Article

Bridging the Energy Poverty Gap: Evaluating the Impact of Shallow Renovations and Micro-Efficiency in Spain

by
Roberto Barrella
1,2,* and
José Carlos Romero
1,2,*
1
Chair of Energy and Poverty, ICAI School of Engineering, Comillas Pontifical University, Alberto Aguilera, 25, 28015 Madrid, Spain
2
Institute for Research in Technology (IIT), ICAI School of Engineering, Comillas Pontifical University, Alberto Aguilera, 25, 28015 Madrid, Spain
*
Authors to whom correspondence should be addressed.
Sustainability 2025, 17(12), 5585; https://doi.org/10.3390/su17125585
Submission received: 8 May 2025 / Revised: 30 May 2025 / Accepted: 3 June 2025 / Published: 17 June 2025
(This article belongs to the Special Issue Tackling Energy Poverty and Vulnerability Through Energy Efficiency)

Abstract

:
Low-income households face severe energy affordability issues due to poor housing quality. To fight this problem, Spanish public administrations and NGOs have collaborated with the Naturgy Foundation’s Energy Rehabilitation Solidarity Fund to improve the energy efficiency of vulnerable households through quick and low-cost interventions. This paper evaluates the impact of shallow renovation and micro-efficiency measures implemented within this program on energy poverty across various Spanish provinces. The analysis includes data from 416 households in 10 provinces, examining sociodemographic factors, housing conditions, energy bills, and thermal comfort perceptions. The methodology involved collecting data through two questionnaires and energy bills provided by collaborating entities. The study found that shallow renovation measures reduced the energy poverty gap by 14.51%, from EUR 554/year to EUR 483/year. Despite these gains, many households remain in severe hidden energy poverty, spending less than a quarter of their theoretical energy expenditure. The findings highlight the diversity among different provinces and measures and the need for more extensive structural measures to reduce energy poverty significantly. Eventually, the study underscores the effectiveness of energy renovations carried out by non-profit organizations. Thus, scaling these efforts nationally might help meet the goals of the public energy poverty plans.

1. Introduction

The Spanish National Energy Poverty Strategy 2019–2024 (ENPE) [1] officially defined energy poverty as the situation in which a household is unable to meet its basic energy needs due to an insufficient level of income. Although the energy poverty reduction targets set by the ENPE were ambitious—reducing all energy poverty indicators by at least 25% in 2025 and aiming for a 50% reduction—there have been setbacks in recent years.
In mid-2021, energy prices started to rise due to the aftermath of the COVID-19 pandemic and tensions in energy markets. The Russian invasion of Ukraine further aggravated this. In this context, in 2022, Russia decided to suspend natural gas exports to some EU members, which led to further price increases, which completed the determination of an energy crisis. On top of this, during the summer of 2022, there were major heat waves that increased cooling demand and decreased hydropower supply due to droughts. These phenomena have exacerbated energy poverty in Europe [2,3,4].
In Southern Europe in general [5], and in Spain in particular [6,7], this critical situation triggered by exorbitant energy prices is added to the reality of the low quality of the housing construction. Low-income families often cannot afford energy-efficient housing, adding an even more significant energy problem to their already vulnerable situation [6,7,8].
One of the consequences of the energy price increase was the reduction in energy consumption in a considerable number of households, i.e., they found themselves in a situation of “hidden energy poverty” for fear of turning on the heating, using electrical appliances and, in short, fear of the bill. Consequently, the number of dwellings with an inadequate temperature increased [9].
Unsurprisingly, these developments generally worsened the levels of energy poverty in 2022, a situation which, although slightly improved in 2023, remains of great concern. At the bottom of this issue are not only the energy prices but also the low income and energy efficiency of the households. Sánchez-Guevara Sánchez et al. [10] proposed a new definition of energy poverty based on minimal thermal habitability conditions in low-income dwellings in Spain. Their study highlighted the need for comprehensive energy efficiency measures to address energy poverty effectively. In this line, businesses and not-for-profit organizations have sought to curb the rise in energy poverty in the last few years by providing micro-efficiency material and implementing energy retrofitting.
Since 2018, Spanish public administrations and NGOs have collaborated with the Energy Rehabilitation Solidarity Fund (FSRE) of the Naturgy Foundation. Their objective is to raise funds to improve energy efficiency in the homes of vulnerable families. In other words, the money is intended to rehabilitate and equip housing through quick and low-cost interventions: shallow renovation measures (such as window replacement) and micro-efficiency measures (such as light bulb replacement), according to the classification of [11]. De Luxán García De Diego et al. [12] further classified shallow renovation measures (focusing on the thermal envelope of the dwellings) and analyzed how they affect the theoretical heating demand. Then, the same authors updated their previous work on low-cost solutions for vulnerable households [13], emphasizing the importance of affordable and efficient energy renovations. Lately, [11] carried out an objective assessment of the impact of shallow renovation measures on 54 vulnerable households in Catalonia. The study focused on hidden energy poverty and was carried out by considering the characteristics of each household and the energy bills before and after the interventions. Their findings indicated significant improvements in energy affordability and reductions in energy poverty levels following these interventions. Similarly, [14] evaluated the impact of energy efficiency strategies on households’ energy affordability in Spain, highlighting the positive outcomes of such measures. Luján Torres et al. [15] examined the impact of shallow renovations on energy poverty in Valencia, demonstrating notable improvements in energy affordability and thermal comfort. Martín-Consuegra et al. [16] monitored improvements in energy performance following envelope renovations in subsidized single-family housing in Madrid. Their results indicated substantial energy savings and enhanced thermal comfort. Bienvenido-Huertas et al. [17] analyzed the effectiveness of energy conservation measures in reducing energy poverty in Southern Spain, confirming the positive impact of these interventions.
While these studies provide valuable insights into the benefits of energy efficiency measures and renovations, there is a notable gap in the comprehensive assessment of the impact of shallow renovations using both objective and subjective indicators. Specifically, there is a lack of national studies that calculate and empirically analyze the savings generated by different refurbishment measures, measure the Hidden Energy Poverty Indicator (HEP), and assess changes in perceived thermal comfort. This paper aims to fill this gap by providing a mixed analysis of the impact of shallow renovations on reducing energy poverty, thereby offering a more holistic understanding of the effectiveness of these interventions. The specific objectives of the article are as follows:
  • Calculate and analyze the savings generated by the different refurbishment measures in the theoretical energy expenditure of the beneficiary households.
  • Calculate and analyze the Hidden Energy Poverty Indicator (HEP), measuring both its incidence and depth (energy poverty gap), to measure the impact of retrofits on energy poverty. This is achieved with the evolution of the HEP indicator after implementing the energy refurbishment measures, thus comparing the real energy expenditure with the theoretical expenditure before and after the interventions.
  • Assess the changes in the perceived thermal comfort of households using subjective indicators of inadequate temperature in winter and summer.
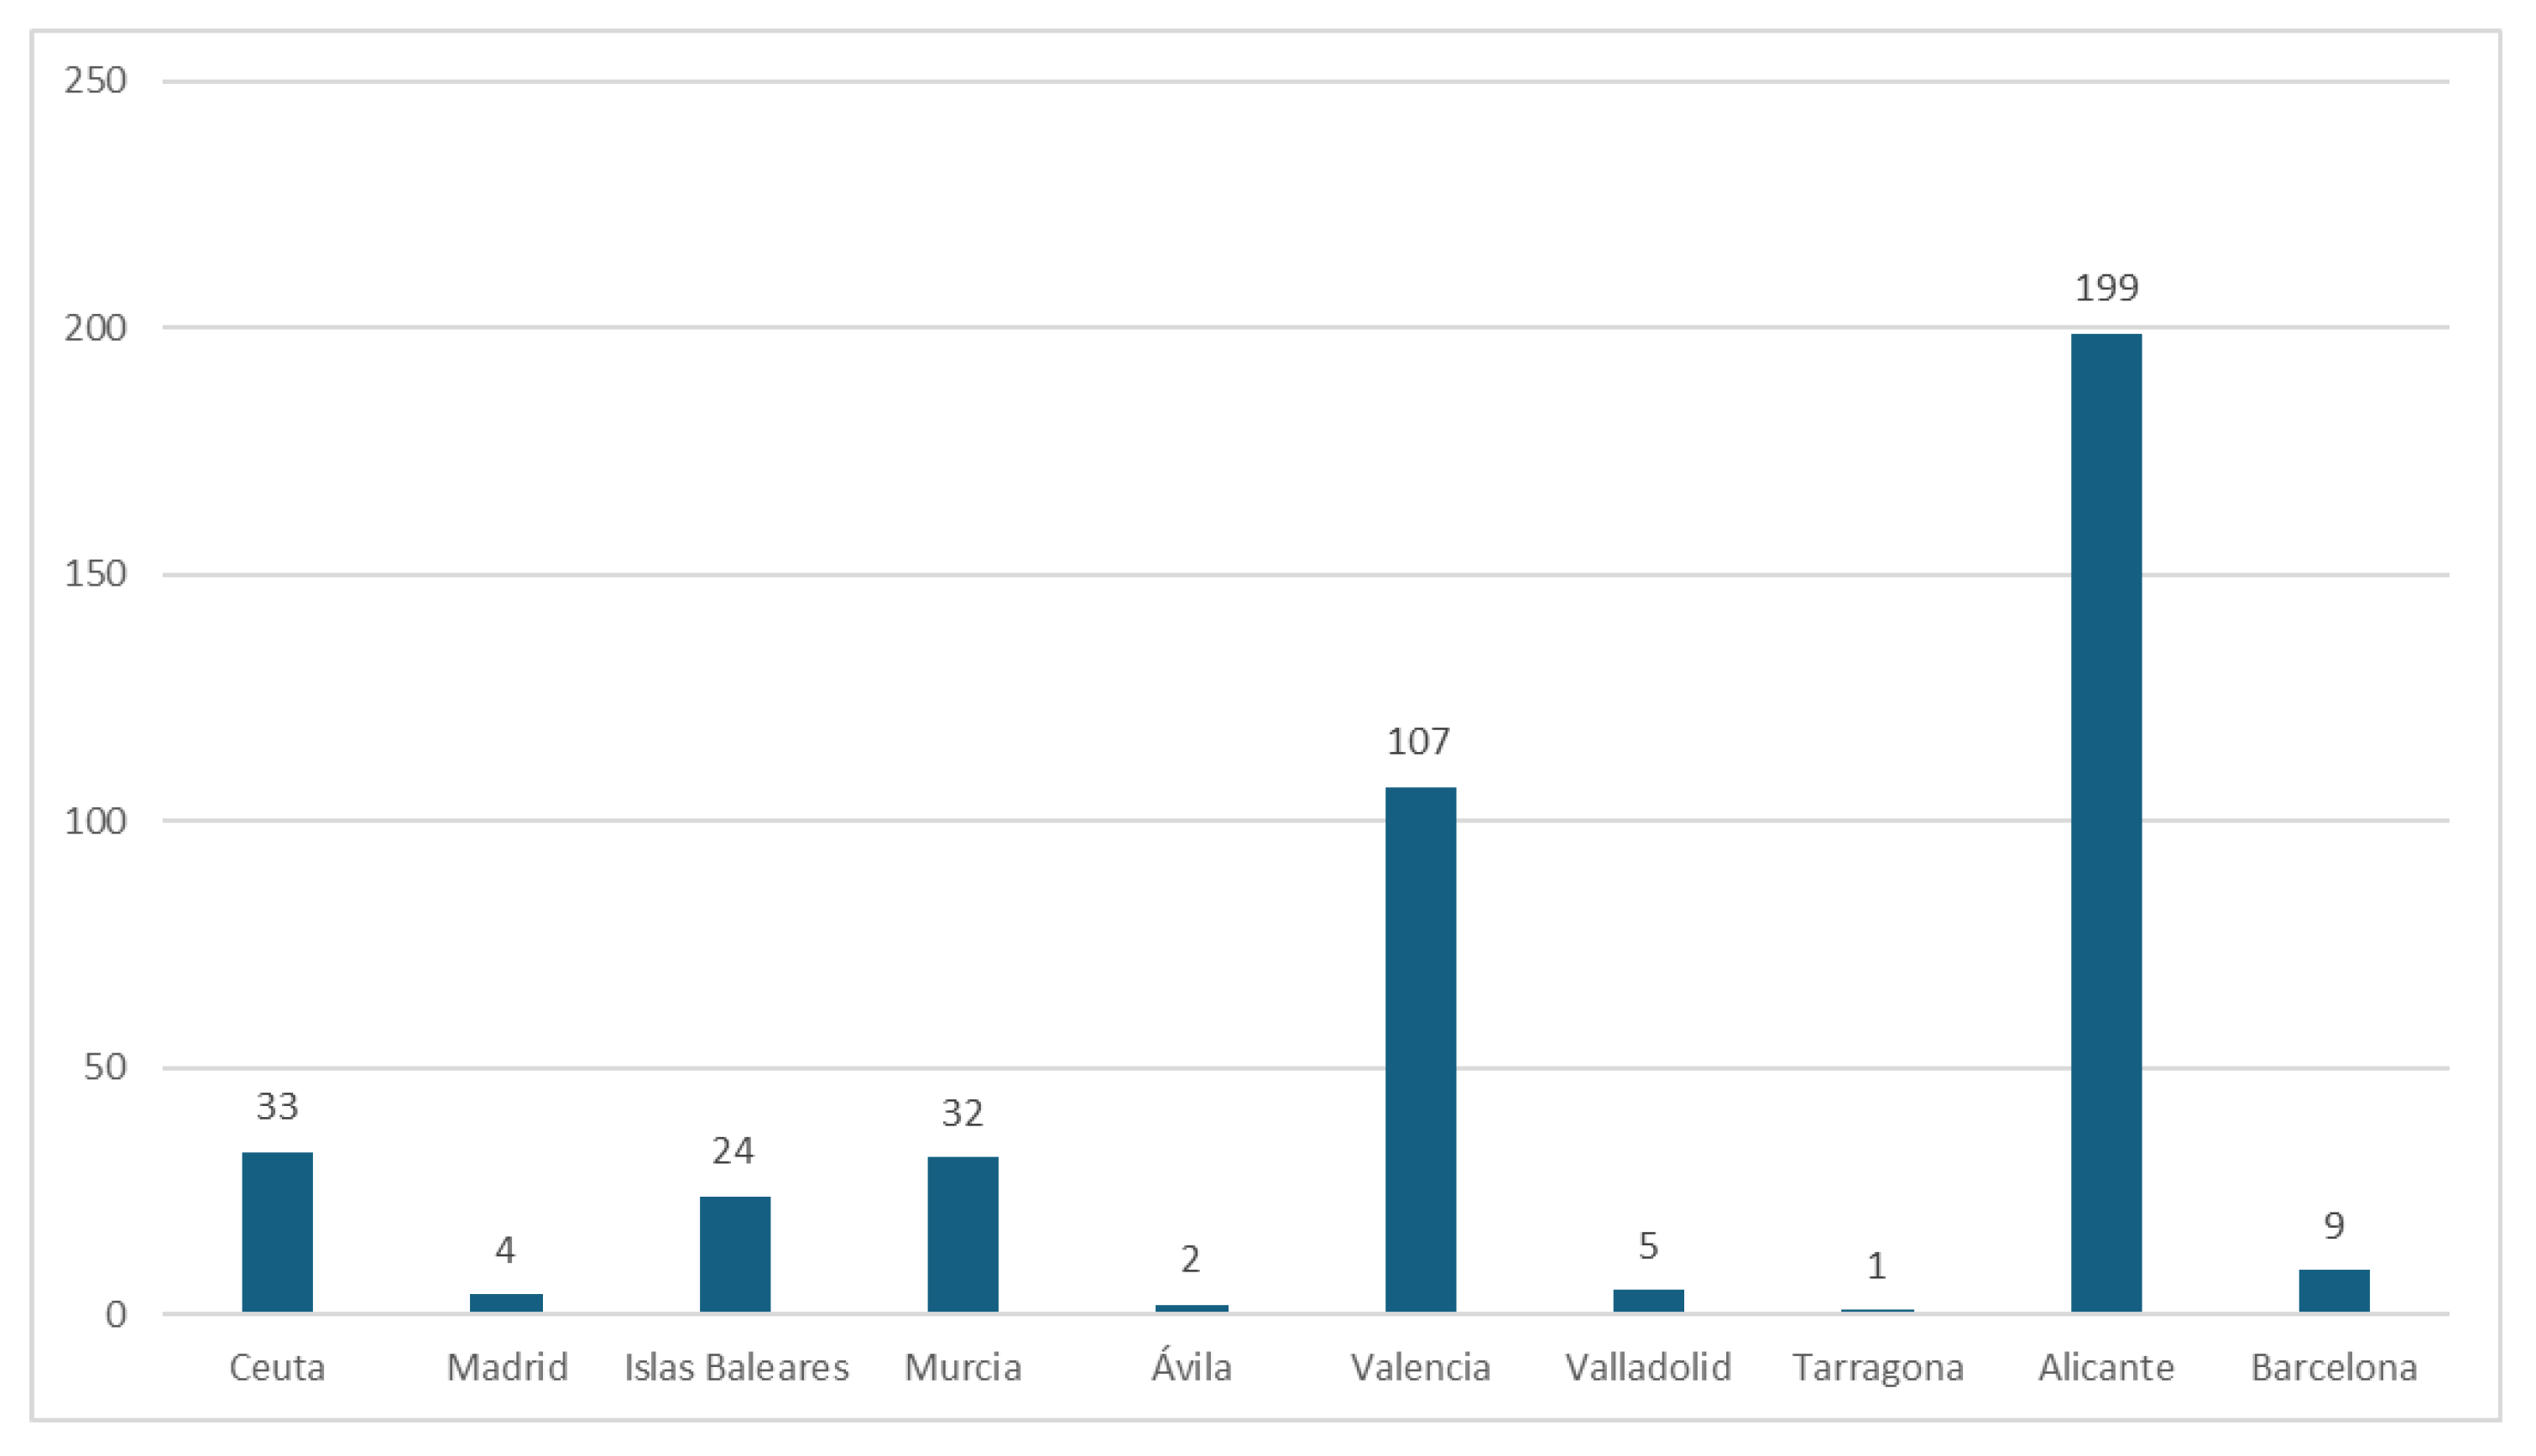
  • Extend the geographical and sample scope with respect to the previous study [11], including 416 households from 10 provinces in seven Autonomous Communities (regions of Spain), thus allowing conclusions and recommendations to be extrapolated to the national level.
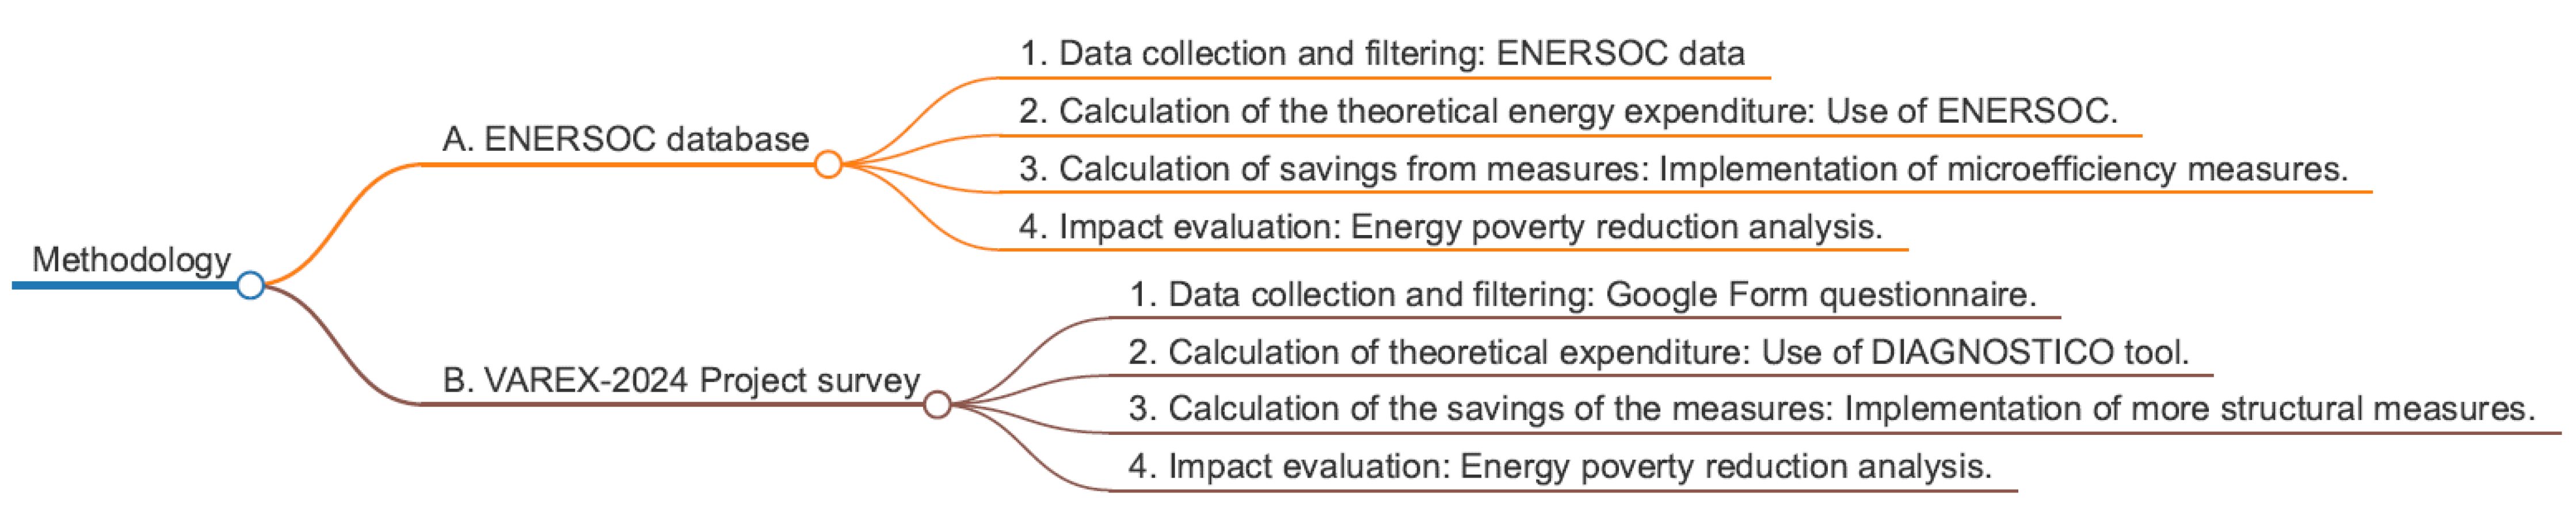
The remainder of the study is structured as follows. Section 2 details the methodology employed, including data collection and calculations. To this end, it first provides a descriptive sample analysis, presenting the characteristics of the households studied. In terms of calculations, this section describes the application of the required energy expenditure (RENE) methodology (proposed in [18]), calculating the theoretical energy expenditure of each household before and after the intervention, and of the HEP indicator to the panel of households in the study. Section 3 focuses on the results, analyzing the impact of retrofits on energy expenditure and hidden energy poverty. Finally, Section 4 presents the study’s conclusions and offers recommendations for future interventions and policies in the field of energy poverty.

2. Methodology

This paper adapts the methodology used according to the provenance and nature of the data (two different datasets), as explained in Figure 1. The following subsections of this section describe the procedures mentioned in Figure 1.

2.1. Data Curation and Calculation of Theoretical Energy Expenditure

Data collected by NGOs from different territories in Spain were used to analyze the impact of shallow renovation measures. The data have been divided into two main categories:
Data from the ENERSOC tool (Red Cross). A total of 404 cases have been used for the analysis of theoretical expenditure and 171 cases for the analysis of hidden energy poverty. ENERSOC is an ECODES-owned tool used by the Red Cross and other NGOs and administrations, which collects several data on socioeconomic and demographic characteristics of the households, provides recommendations to them, and calculates their theoretical energy expenditure.
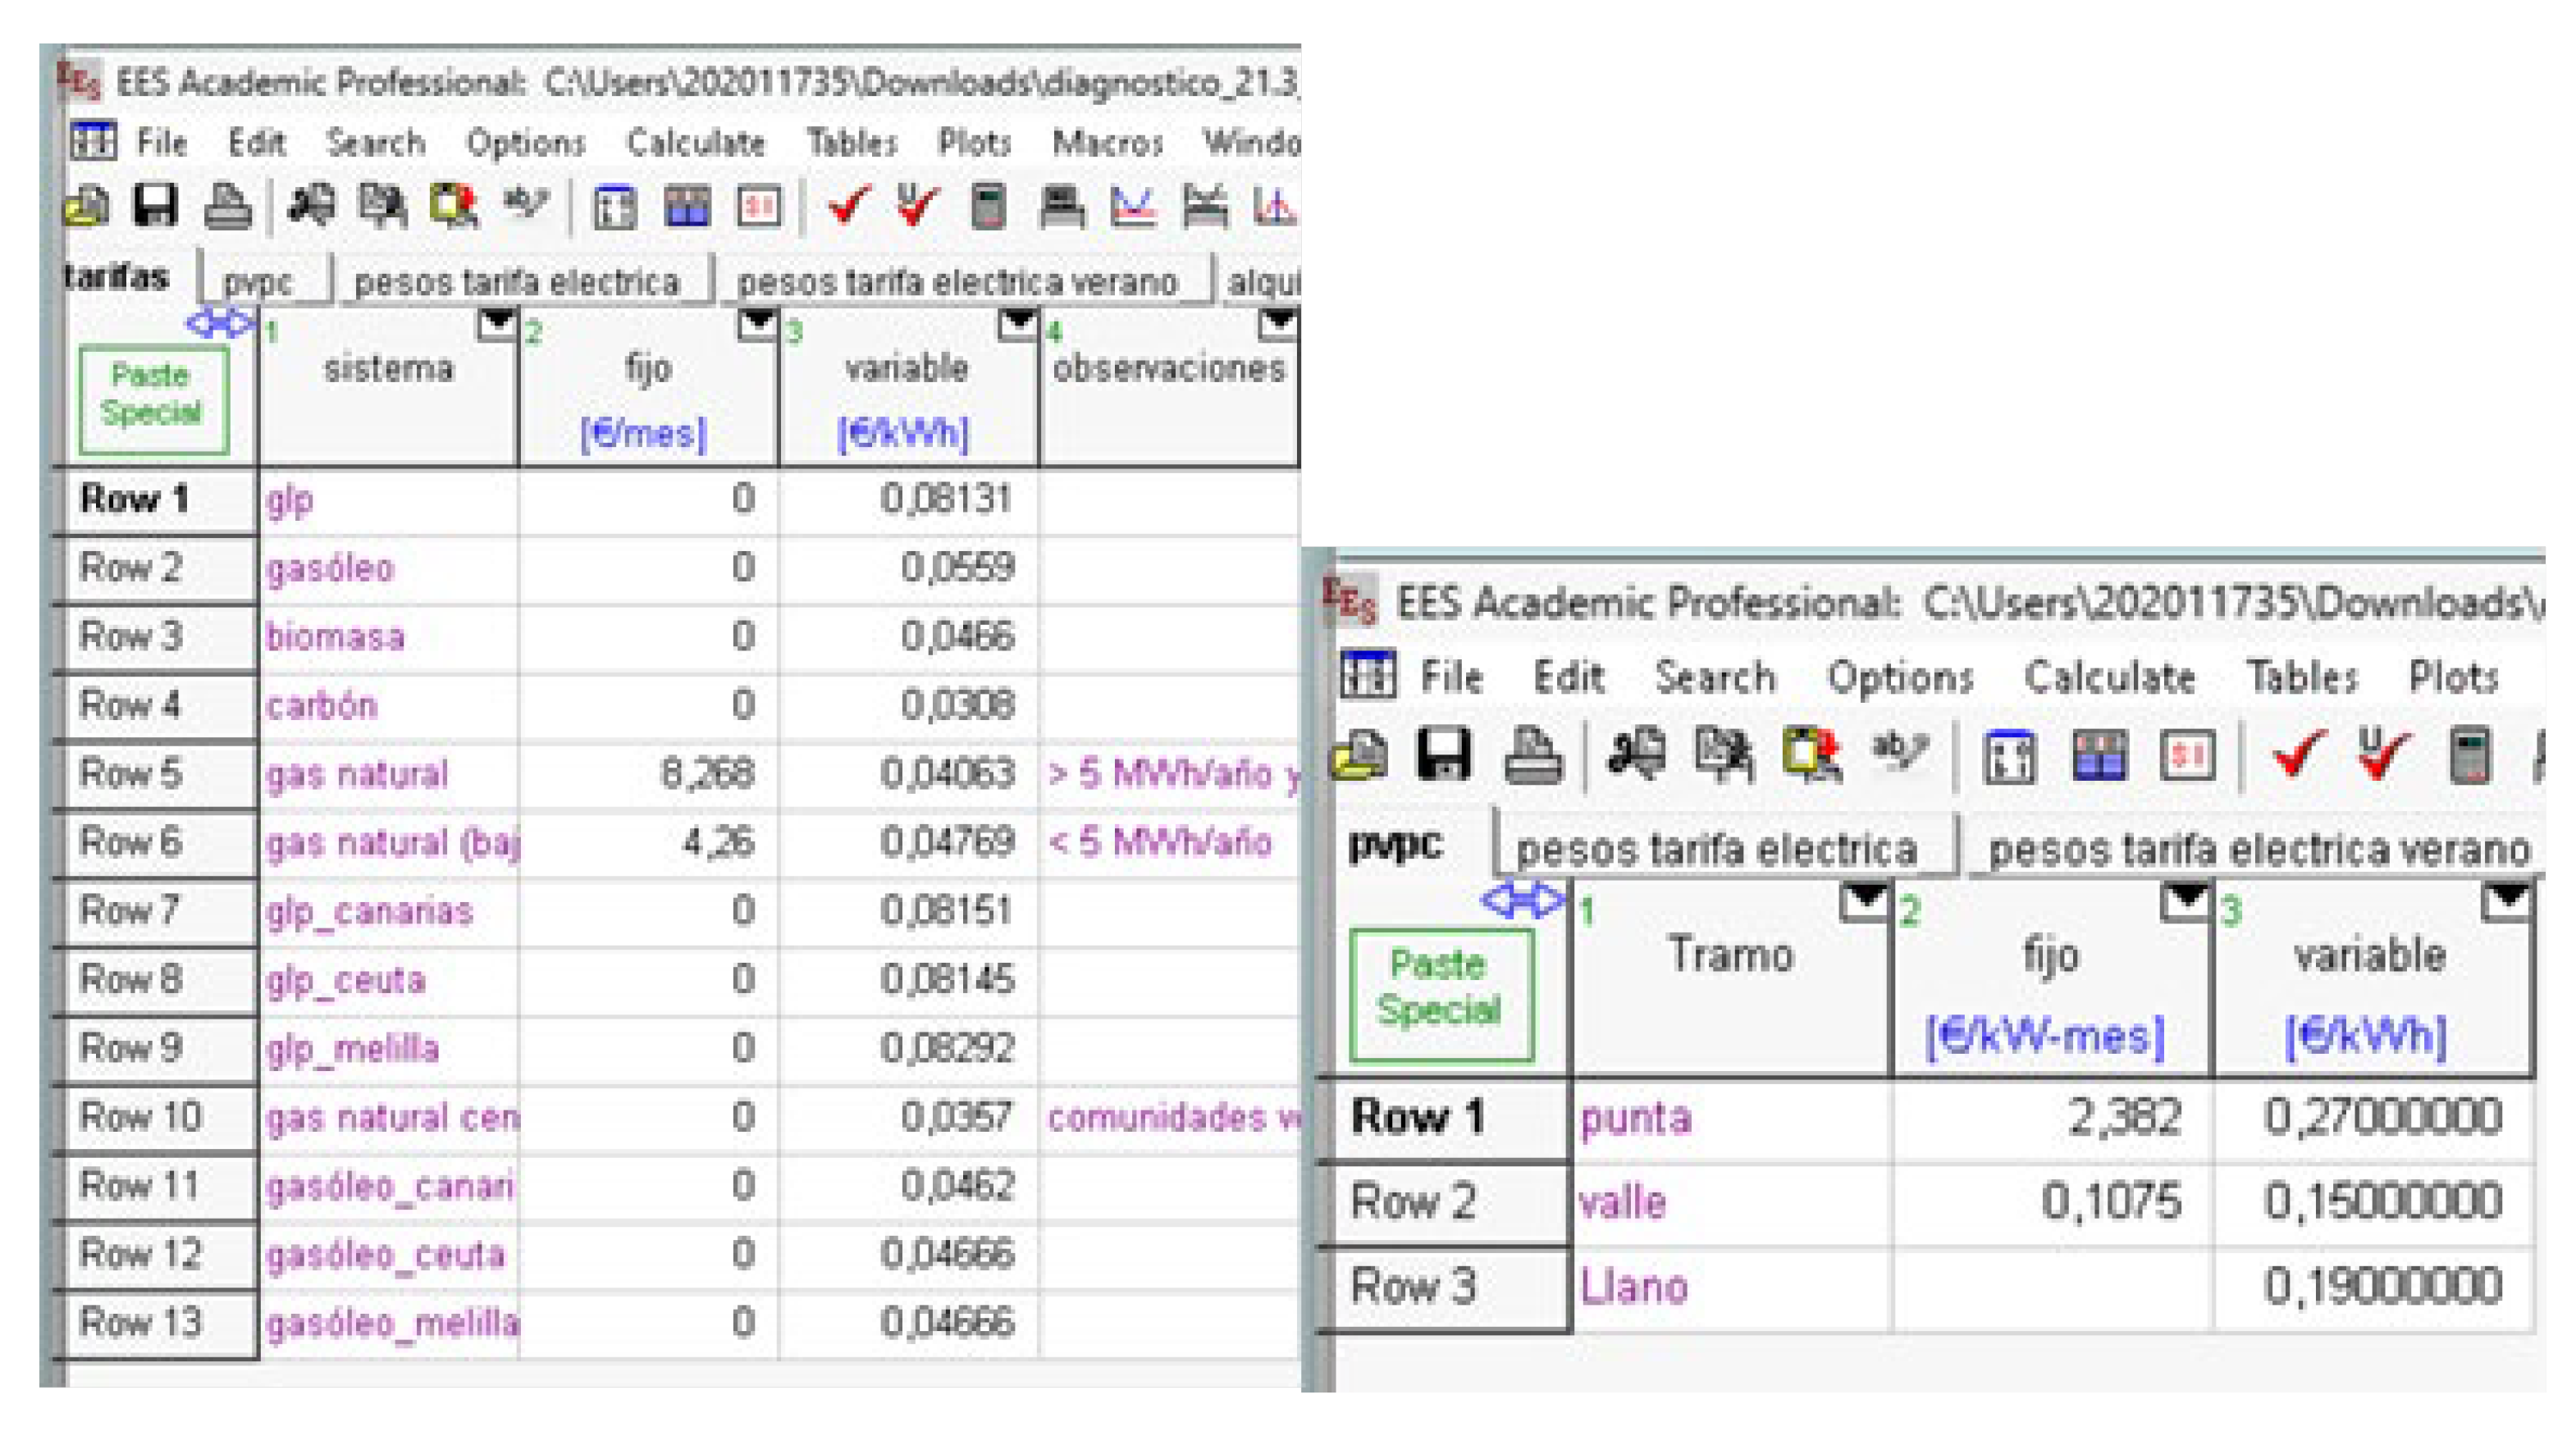
Data from the project’s own collection (other NGOs): Twelve cases have been used in the study of theoretical expenditure and 9 cases in the analysis of energy poverty. These data were collected through the project’s own questionnaire, which provided detailed information on the cohabitation or family unit, the dwelling, and the electrical and thermal installations. More details on the questions included in the survey are in [11] and in the VAREX-2025 report. In addition, electricity and natural gas bills have been used to obtain the actual expenditure of the household and to establish the corresponding prices before and after the reform.
The base parameter to be able to undertake the objectives of the study is the theoretical energy expenditure (TEE), that is, the energy expenditure in euros that a household would need to satisfy its energy needs, both in thermal and electrical uses [18].
To measure the impact of shallow renovation for both samples, this theoretical energy expenditure will be calculated. Then, the monetary savings caused by each shallow renovation measure implemented will be calculated by applying the methodology [11] that calculates the savings on energy consumption. In other words, the relative consumption saving obtained by was applied directly to the theoretical energy expenditure.
For the correct application of this approximation, which is calculated by province, it was necessary to break down the total energy expenditure into its different uses. For this purpose, theoretical provincial energy expenditures for 2022 calculated according to the methodology of the article by [18] and presented in the article [19] were used, considering that the number of persons per household is 3, as this was the average number of households served. In Appendix A, the total theoretical energy expenditure per province was broken down and in Theoretical cost of heating, DHW, and cooling; Theoretical electricity consumption (lighting + electrical appliances + kitchen); Total Theoretical Expenditure (GTT+ GELT).
The same was conducted with the percentages of savings that were finally applied to the theoretical expenditure of each household according to the province and measure applied (only the savings of the provinces that appear in the study are shown).
Finally, it should be noted that, among “micro-efficiency measures” it was possible to calculate the savings produced by LED bulbs, weather stripping, thermocover, and power strips.
On the other hand, in regard to the effect of the change in energy prices on the estimated savings generated, two scenarios were calculated:
  • Real case, including the impact of the price change after the rehabilitation;
  • Counterfactual case, isolating/excluding the impact of price change after rehabilitation.

2.1.1. Red Cross Data from ENERSOC

Within this category, we find the data collected by the Spanish Red Cross using the ENERSOC tool. As we did not have data on post-retrofit bills, we considered that the actual expenditure did not change. On the other hand, ENERSOC calculates the theoretical electricity and fuel expenditure of the households treated before the renovation.
An initial sample of 1208 cases was taken as the starting point, and those without efficiency measures applied or without the calculation of theoretical electricity expenditure were eliminated. The final sample was 404 cases from the provinces of Alicante, Balearic Islands, Ceuta, A Coruña, Madrid, Murcia, Valencia, and Valladolid. A total of 75% of the households included in the study were located in the provinces of Alicante and Valencia, which may cause potential biases due to the climate characteristics of these provinces, as further discussed in Section 3.1.2. Only micro-efficiency measures have been implemented in these households. The impact on the theoretical expenditure of four of them were taken into account as follows:
Replacement of luminaires with LED bulbs: saving, on average, 48.5% in lighting electricity consumption [11].
Use of weather stripping: reduces heating demand, on average, by 7.5% [11], but there are significant differences depending on the climate zone that was taken into account. Appendix A shows more details).
Use of thermocover: reduces heating demand by 3.35% on average if there is single glazing and 1.55% if there is double glazing [11]. In cases where this information was unavailable, it was assumed that the dwellings had single glazing, as this was the most common in the initial sample (63% had single glazing, and only 25% had double glazing). The thermocover is a novel product, based on nanotechnology, easy to apply, and economical. It consists of a non-adhesive insulation film that is applied to windows to protect and insulate against heat loss in the cold months. The term used to identify this product in this report is that of the manufacturer© Tesa SE—A Beiersdorf Company (Hamburg, Germany).
Use of power strips: exact savings are not available, but it is known that standby consumption (consumption that power strips are willing to reduce) reaches almost 7% of electricity consumption [18]. Therefore, the use of power strips will be considered to decrease electricity consumption by 7%.
Only data from households in which any of the above measures had been applied were used, so that a total of 404 households were finally available. In these cases, the theoretical energy expenditure after the renovation was obtained by deducting the corresponding savings according to the province and measured from the theoretical energy expenditure before the renovation (calculated by ENERSOC in most cases).
It was necessary to discard some of the above households to analyze the hidden energy poverty (HEP) indicator. Recall that calculations of theoretical energy expenditure savings are made on the total energy expenditure of a household and should, therefore, be compared with the actual total expenditure. However, in the Red Cross data, actual fuel expenditure information is unavailable for any of the study cases, as it has not been collected by Red Cross staff or volunteers. Therefore, for the analysis, only those cases where the heating system is electric, or where there is no heating, could be taken into account. However, if the source of energy for the hot water supply is a fuel, the case was included as it represents a very small expense in comparison with the sum of the expenditure on air-conditioning and electricity, and we can consider that practically all the energy expenditure is electrical. Finally, those cases in which we did not have the value of the actual electricity expenditure were eliminated. After all filters, 171 data were available for the energy poverty analysis.
In addition, the value of the theoretical energy expenditure of some of the households in the HEP analysis was corrected. Of these 171 cases, 81 of them had an actual expenditure of more than half of the theoretical expenditure, i.e., 47.39% of the households were not in hidden energy poverty. This is a considerable percentage of the total taking into account that the families registered in ENERSOC apply for help from the Red Cross and are, therefore, understood to be in a marked situation of energy vulnerability, as reflected in two previous analyses of this sample [4,19].
ENERSOC calculates theoretical energy expenditure with regulated market prices, so it is possible that the households that had free market contracts had higher electricity prices during the post-energy crisis year (2023). Then, to calculate a more accurate theoretical energy expenditure, for these cases, the DIAGNOSTICO tool was used. DIAGNOSTICO v1 is a software application implemented by the Chair of Energy and Poverty of Comillas Pontifical University using a local high-level programming language to determine the so-called theoretical energy expenditure. This energy price profiling was performed by changing the nationally regulated price of electricity and natural gas for the average value according to the autonomous community and the contracted company (in cases where the company was not known, the average price of the free market of the corresponding autonomous community was used). These prices were obtained from [16,17,18,19,20]. Of the 56 cases that had a free-market contract and were not initially in hidden energy poverty, 26 became so after the indicated modifications; that is, 46.43% of the theoretical energy costs had a significant error due to the price applied by ENERSOC. The same procedure was carried out for those cases in which the type of market contracted was not indicated. The price used was the weighted average (considering the number of supplies of each supplier) of the regulated market price and the free market price in the corresponding autonomous community (of a total of 5 cases, 4 have been modified).
It was not considered necessary to re-evaluate those cases with contracts in the regulated market because the regulated market prices in the ENERSOC tool are kept up to date.

2.1.2. Data from Other NGOS from the Project’s Own Questionnaire

The project’s own questionnaire provides information about the dwelling (surface area, number of people, occupancy, etc.), electrical equipment (type of electrical appliances in the dwelling), and thermal equipment (heating and hot water system); information necessary to obtain the theoretical energy expenditure through the local DIAGNOSTICO tool. It was also necessary to enter the fixed and variable prices of electricity and natural gas in each case. When invoices were available, the price indicated on them was used, and in the case of not having them, the price was set depending on the autonomous community and the contracted company according to [18,19,20], as already detailed in the Section 2.1.1.
Invoices from before and after the renovation were collected from 12 households, as shown in Table 1.
In these households, structural reforms have been carried out, thus having a more significant impact on demand and consumption than the micro-efficiency measures implemented in the Spanish Red Cross cases. The different measures implemented, and their savings are as follows:
Replacement of household appliances: This leads to a 15% reduction in theoretical electricity consumption in the case of replacement of refrigerators, and 6% in the case of washing machines.
Replacement of windows (glazing and joinery): It reduces the required heating demand. This reduction varies depending on the climate zone, as with weather stripping. For more details, see Appendix A.
Wall insulation: It reduces the required heating demand. This reduction varies depending on the climate zone, as with weather stripping and window replacement, as detailed by. [11].
In these cases, it was possible to estimate the actual average expenditure before and after the reform from the bill data. On the other hand, the local DIAGNOSTICO tool was used to obtain the theoretical electricity and fuel costs. In these cases, having access to the bills and the price of electricity and fuel that appeared on the bills were determined. Only three households had access to their natural gas bills, so the same procedure as in Section 2.1.1 was used for the fixed and variable gas prices for the other households. Two theoretical costs were calculated, one with the prices before the reform and the other with the prices after the reform, and the savings corresponding to the implemented measure have been applied to the second result.
Again, to analyze the hidden energy poverty (HEP) indicator, it was necessary to exclude households that have fuel-supplied heating since we did not have access to their fuel bills, as we will, therefore, not be able to know their actual total expenditure. Finally, for this analysis, we had 9 households.

2.2. Impact on Energy Poverty

To measure the direct impact of retrofitting on energy poverty, the following indicators were calculated:
  • Hidden energy poverty indicator (HEP). The extent (HEP extent) and depth (HEP depth) of hidden energy poverty were estimated before and after the intervention.
  • Subjective indicators of thermal comfort. Households’ responses to questions about their ability to maintain an adequate temperature in the winter and summer before and after the intervention were analyzed.
Regarding the first indicator, HEP, or the hidden energy poverty indicator proposed by [18] and included in the annual reports of the Chair in Energy and Poverty, was applied. According to this metric, a household is in energy poverty if it has the following:
Under-spending: actual energy expenditure is less than half of its theoretical energy expenditure—GET/2;
Low income: belongs to the lowest 5 deciles of equivalized income.
The justification of these thresholds is described in depth in [18]. This indicator was applied to each sampled household to estimate the ‘extent’ (HEP extent) of hidden energy poverty in the FSRE beneficiary population. This means calculating the percentage of households suffering from this problem. The under-expenditure condition was verified from the value of the theoretical energy expenditure calculated in the previous step. As for the second condition of the indicator (income), an equivalent income threshold was used to determine the economic vulnerability of households. This threshold corresponds to the maximum equivalent income of the fifth decile of Spanish households, which is EUR 15,372 per year, according to data from the Household Budget Survey (HBS) of 2022. This low-income condition was verified in a representative sample of households, which is to be expected given that these are households assisted by partner NGOs due to their degree of vulnerability.
In addition, the ‘depth’ of this hidden dimension of energy poverty (the ‘energy poverty gap’ or HEP depth) has also been estimated as the difference between half of the household’s theoretical energy expenditure and its actual energy expenditure (GET/2—GR). Finally, the ‘severe energy poverty gap’ has also been introduced as the difference between a quarter of the household’s theoretical energy expenditure and its actual energy expenditure (GET/4—GR).
For the two subjective indicators of thermal comfort, the responses of the sample households to the following questions were analyzed:
Adequate temperature in winter: Can you afford to keep the dwelling at an adequate temperature in winter?
Adequate temperature in summer: Can you afford to keep the dwelling at an adequate temperature in summer?
However, only in the 12 cases with the project’s own data was it possible to analyze the impact of the shallow renovation on the perception of comfort by asking questions before and after the intervention. As the sample is not representative of all households benefiting from the FSRE, the results are analyzed without the pretension of having reliable statistics on the impact of the FSRE on the subjective ability to maintain comfort in the home. However, they allow us to introduce the qualitative impact of Shallow renovation, which will be further explored in future studies.
It is worth clarifying that in this paper, we distinguished between two categories of interventions: (1) shallow renovation, which refers to low-cost structural measures affecting the building envelope—such as the replacement of windows or wall insulation—and (2) micro-efficiency measures, understood as quick and non-structural actions aimed at reducing energy use with minimal investment, such as LED bulb replacement, power strips, weather stripping, or thermocovers.

3. Results and Discussion

The data of all the entities participating in the FSRE as a whole were analyzed, with emphasis on the impact of the implemented measures on the theoretical energy expenditure (Section 3.1) and on the energy poverty situation (Section 3.2) of the households included in the study.

3.1. Analysis of the Theoretical Expenditure

The average theoretical savings per household of the implemented measures was 6.24%. The theoretical energy expenditure has gone from an annual average of EUR 1873.1 to an average of EUR 1757.7. A total of 416 cases were used for this study.

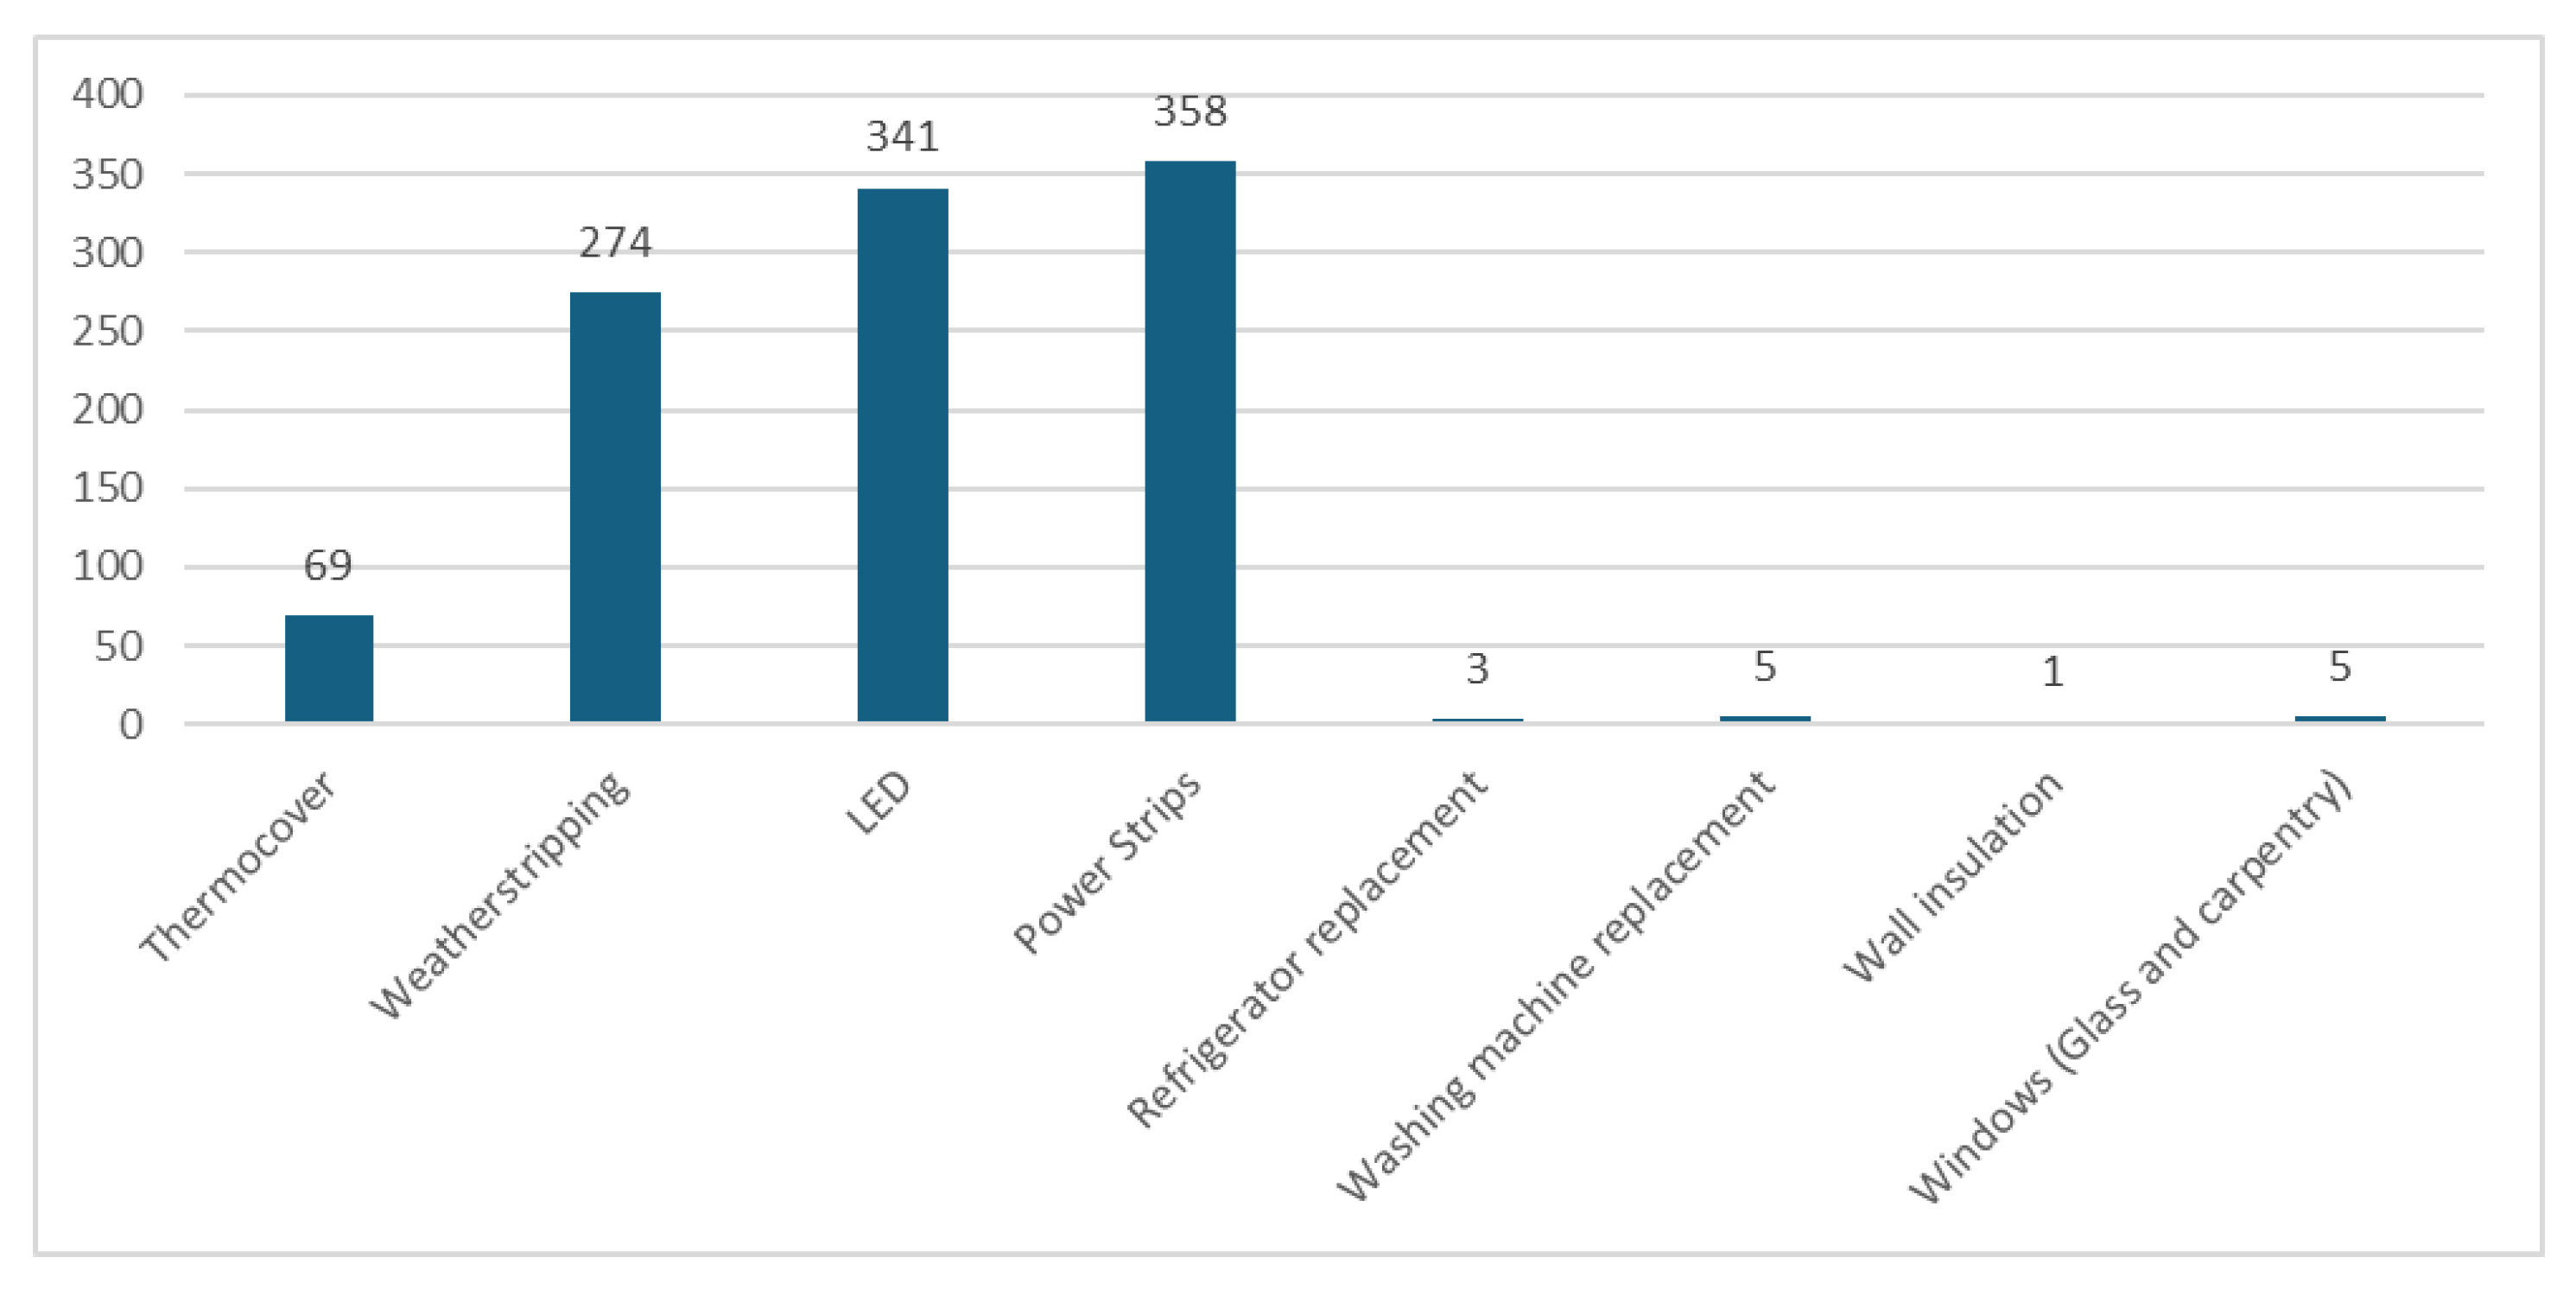
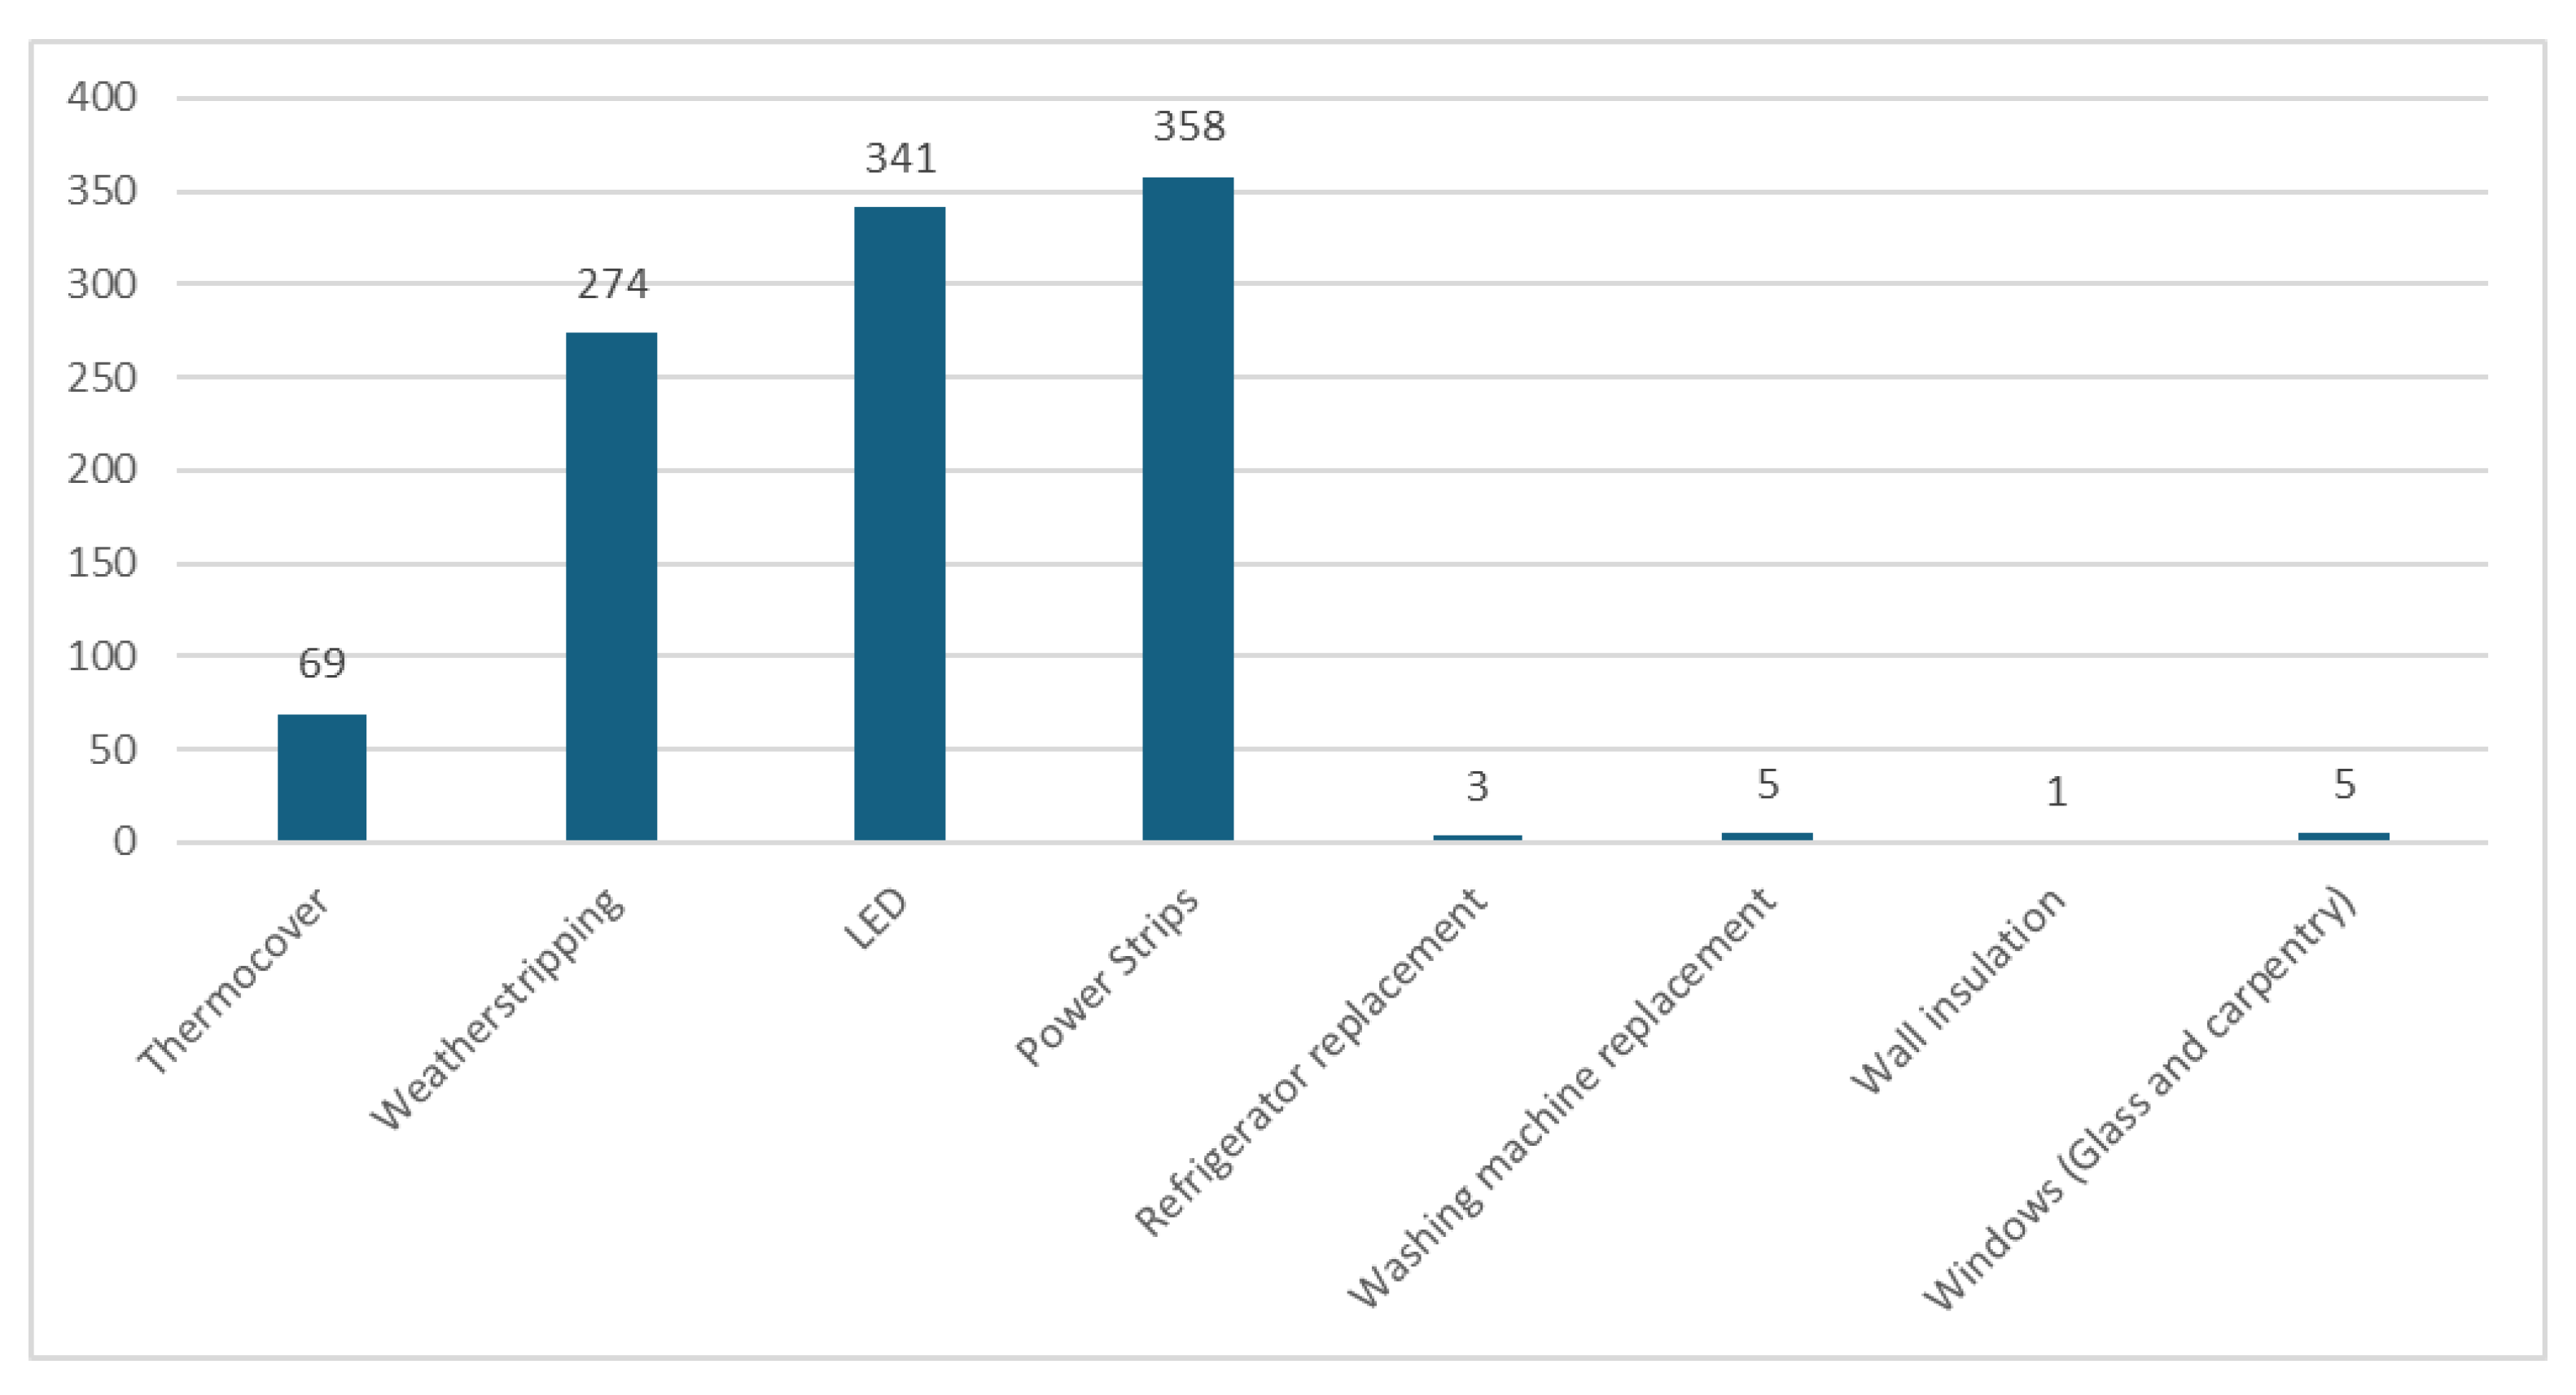
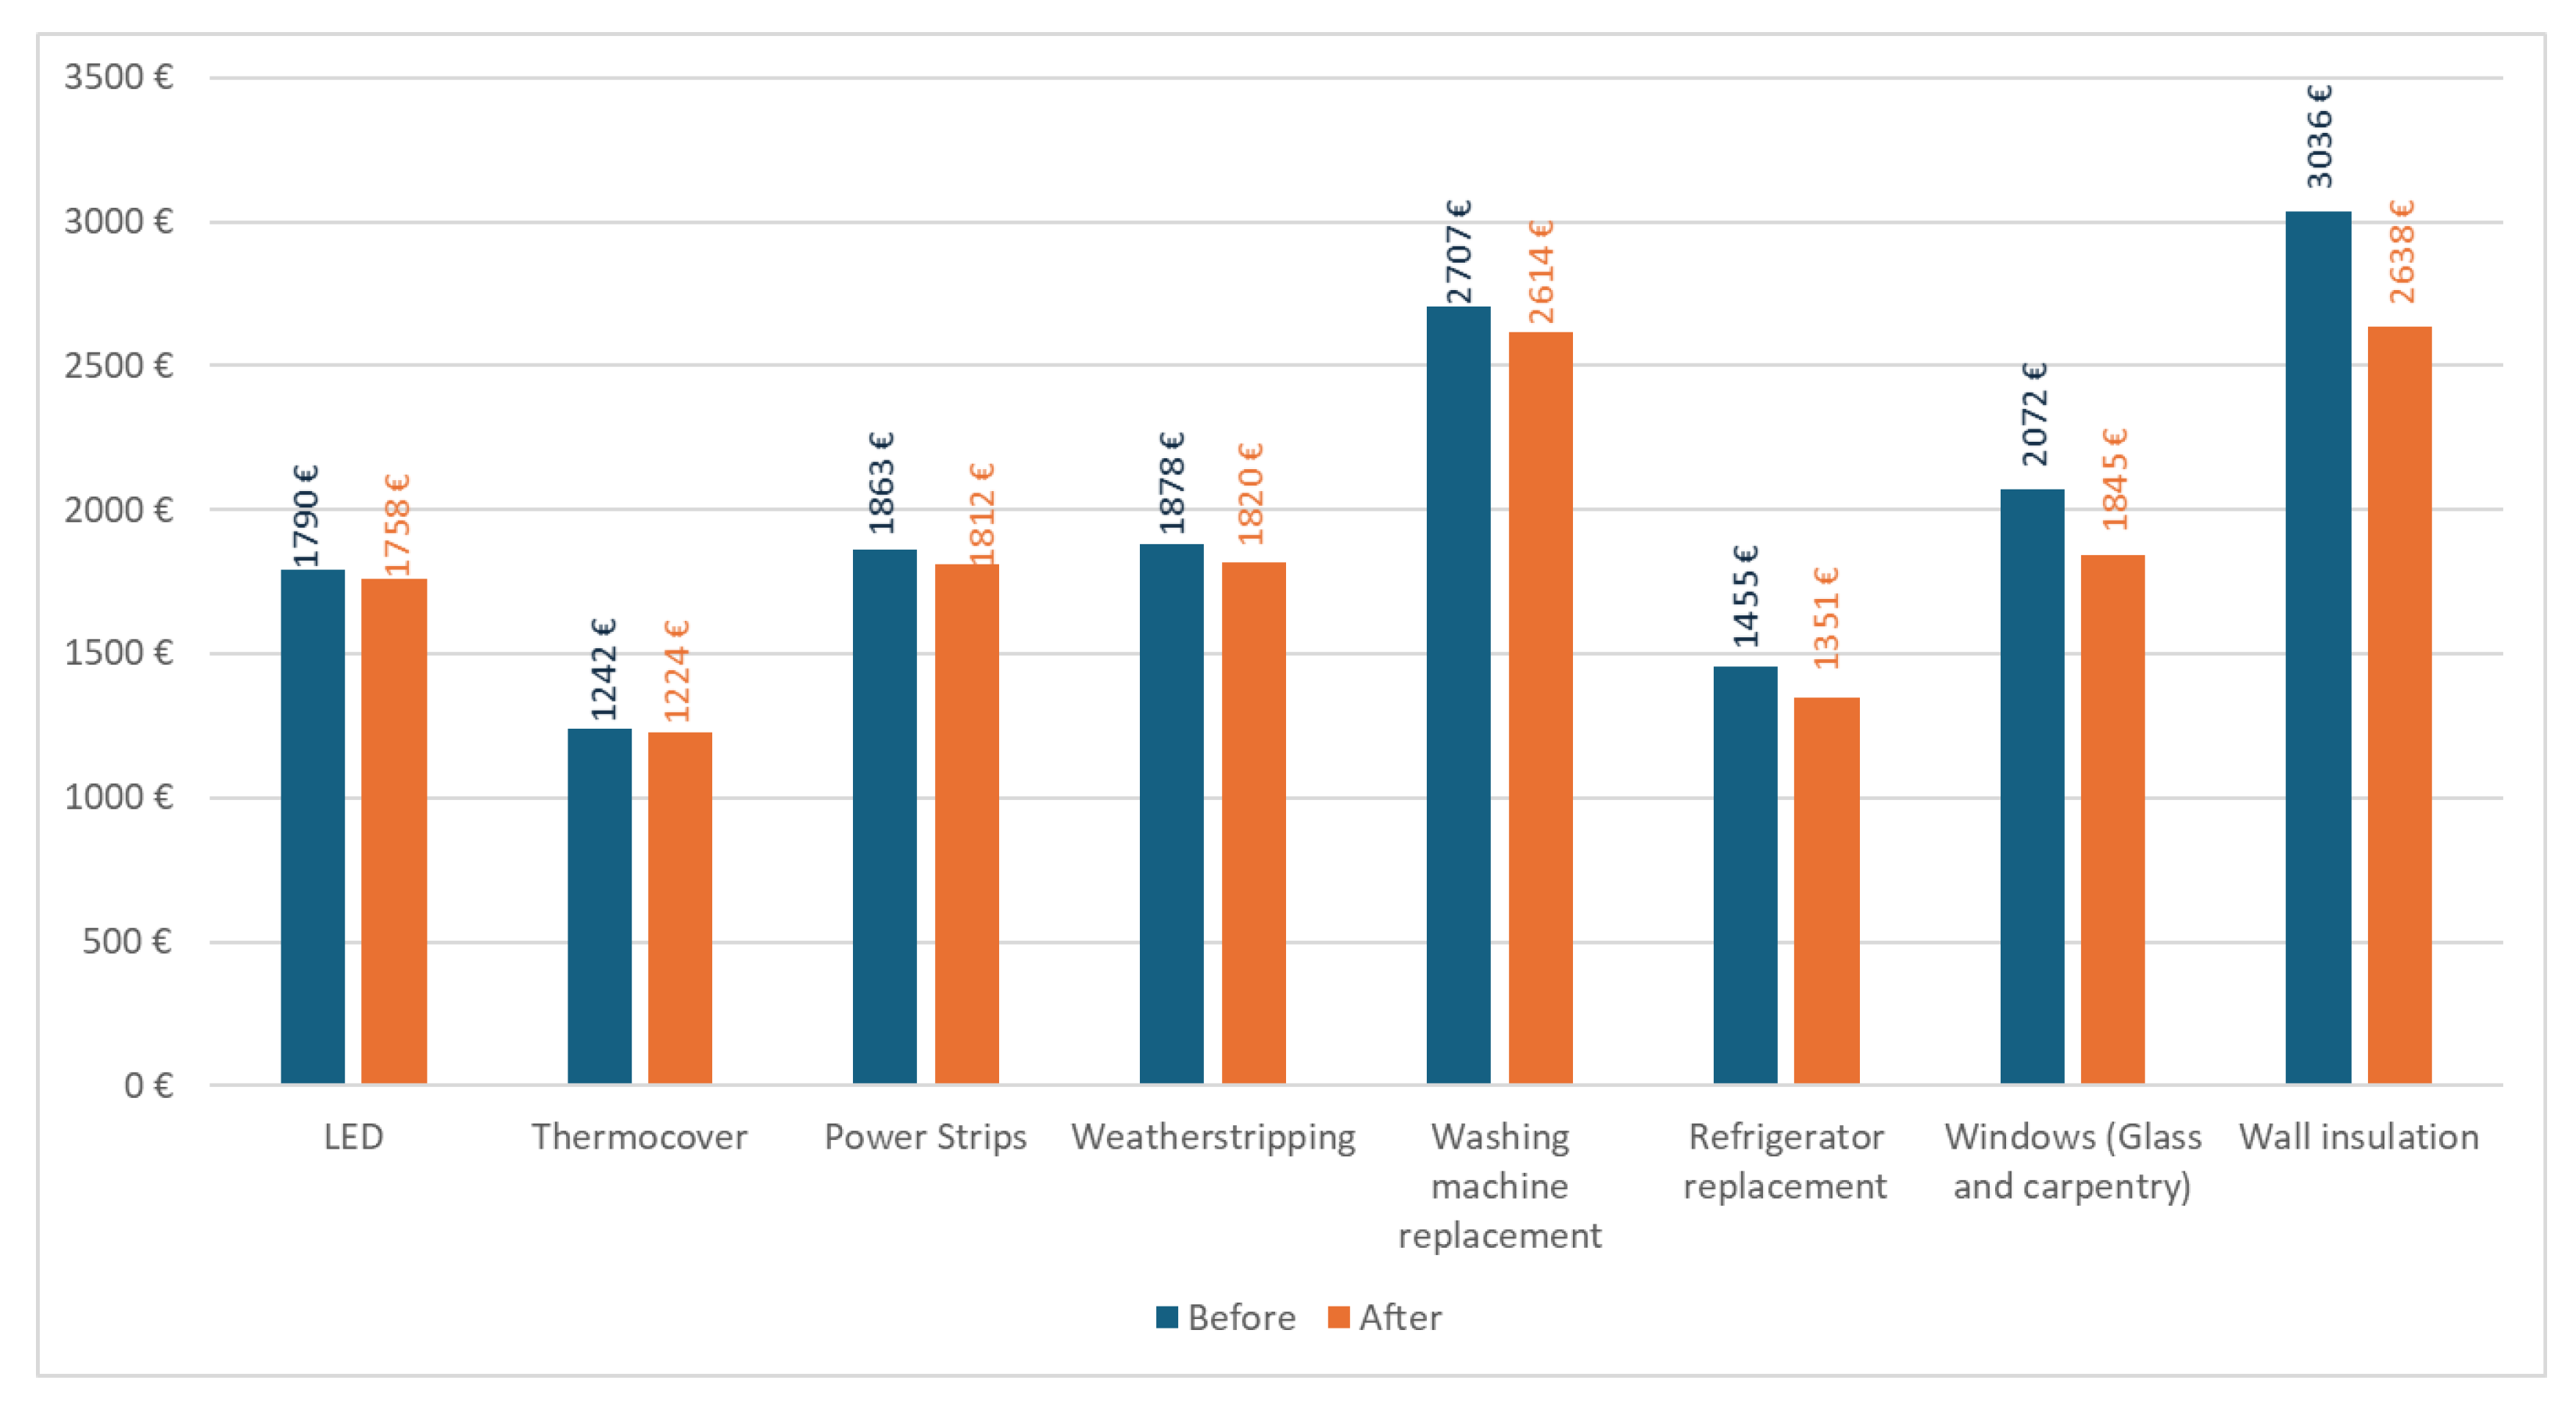
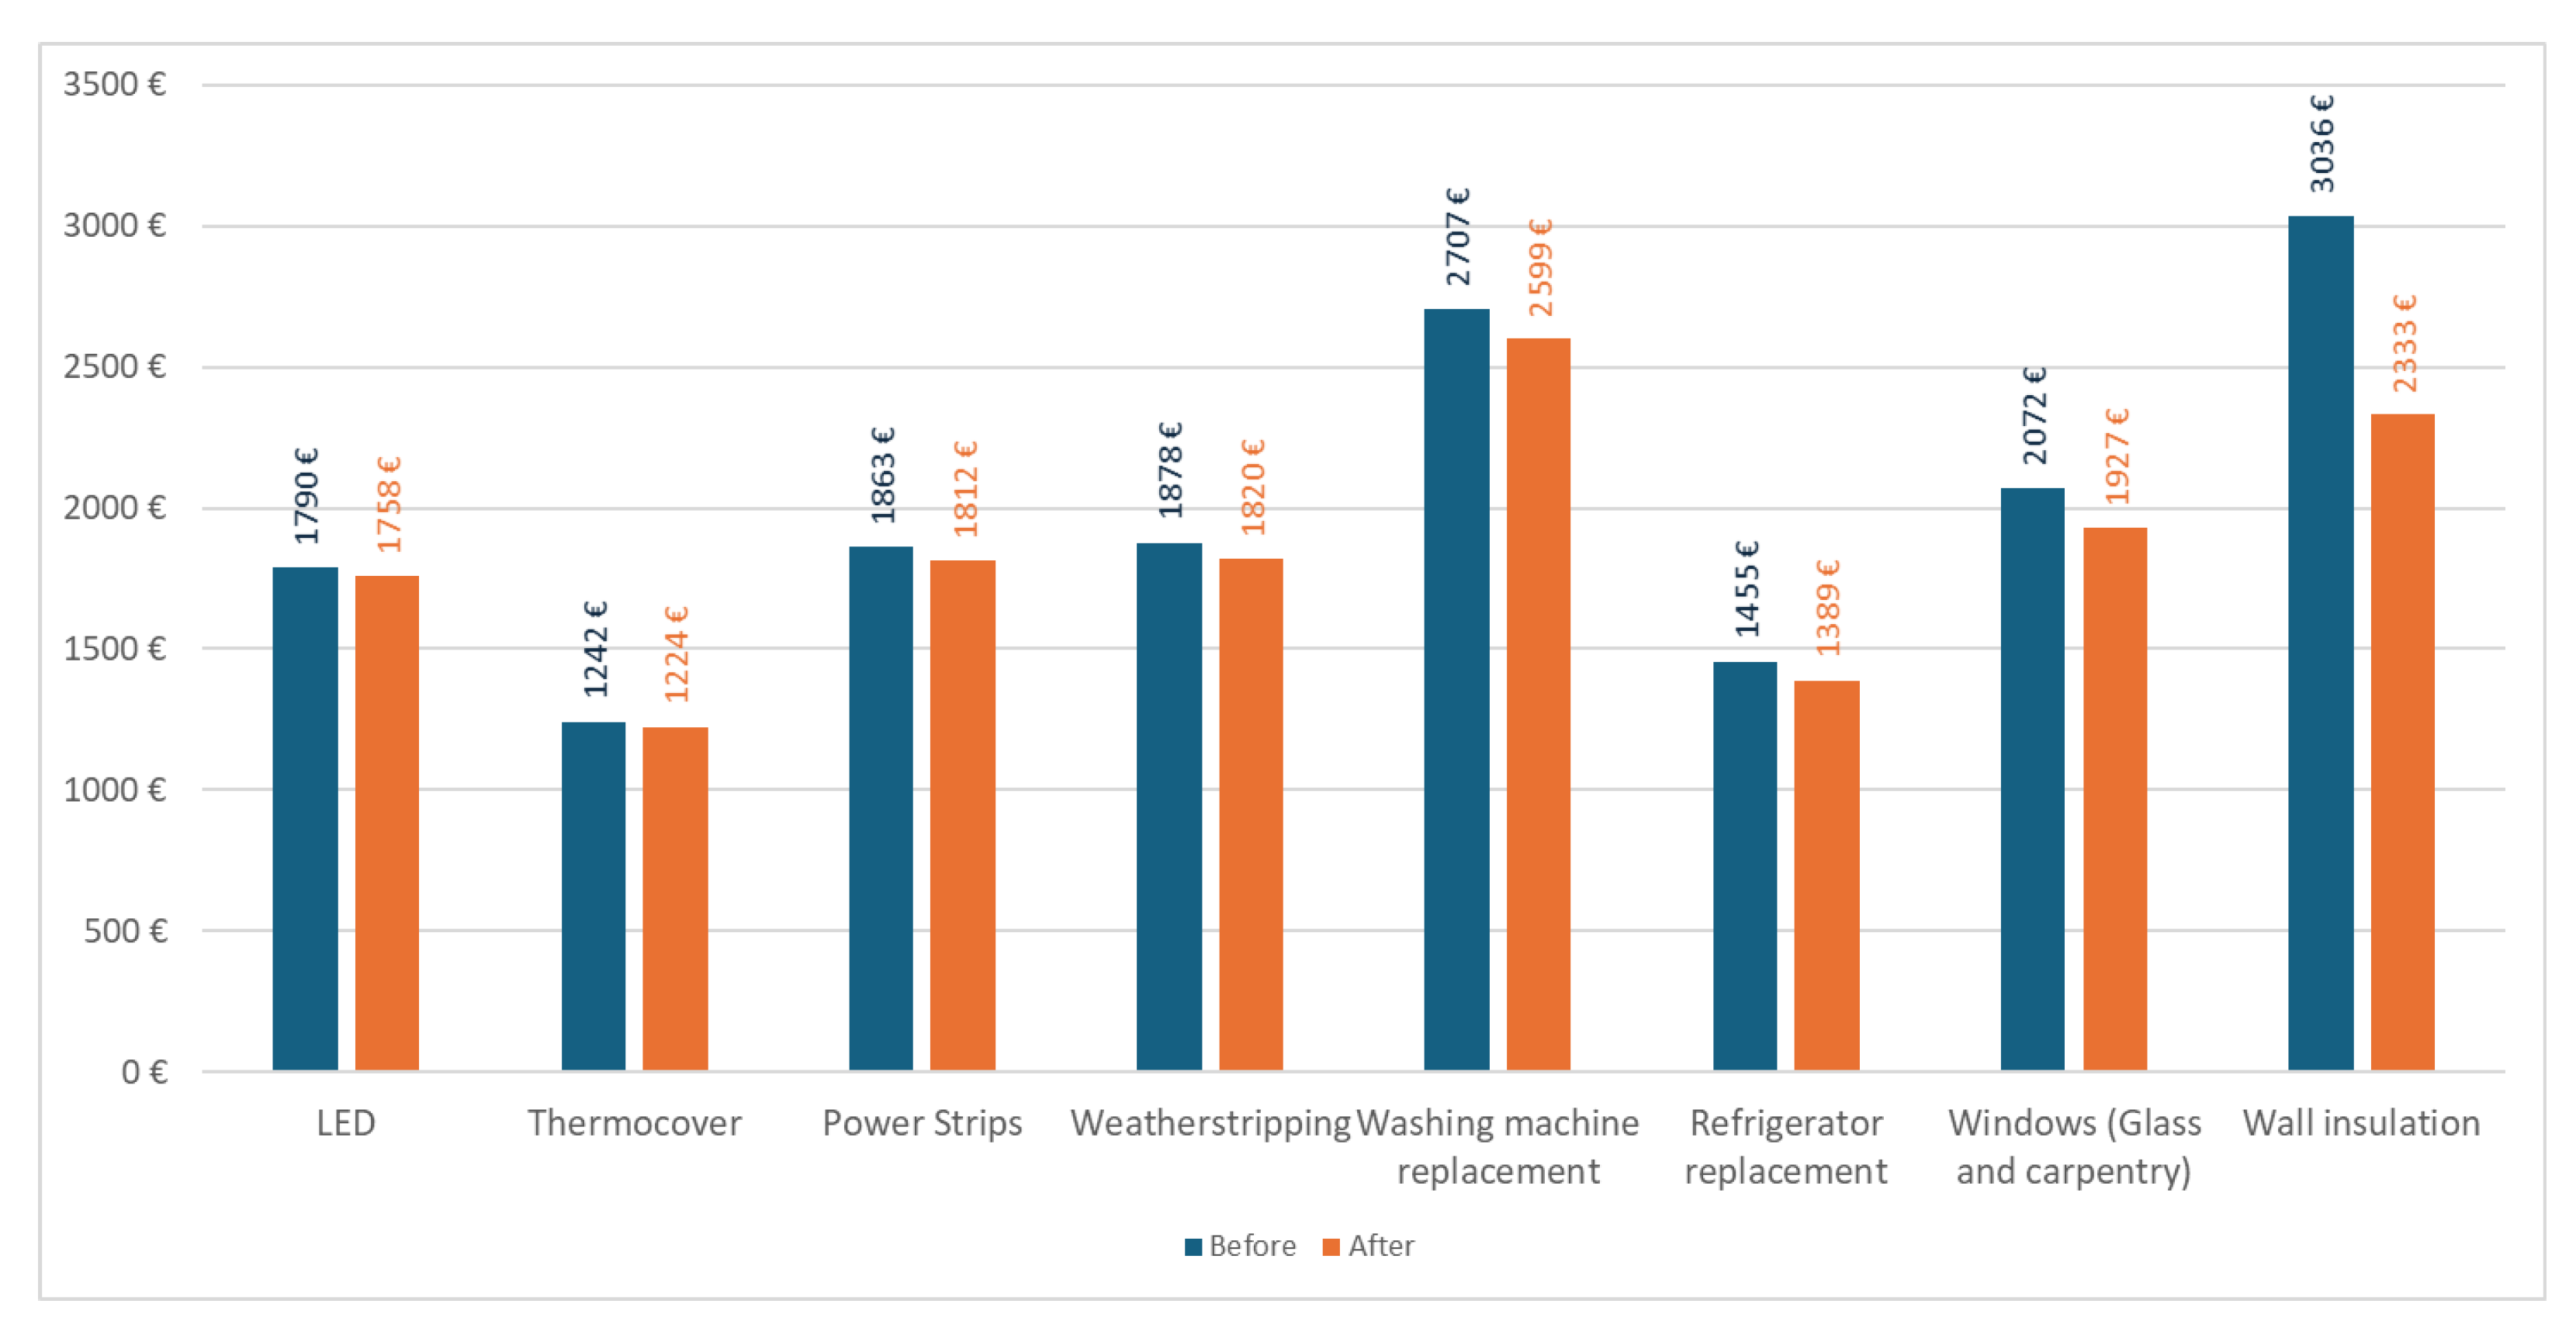
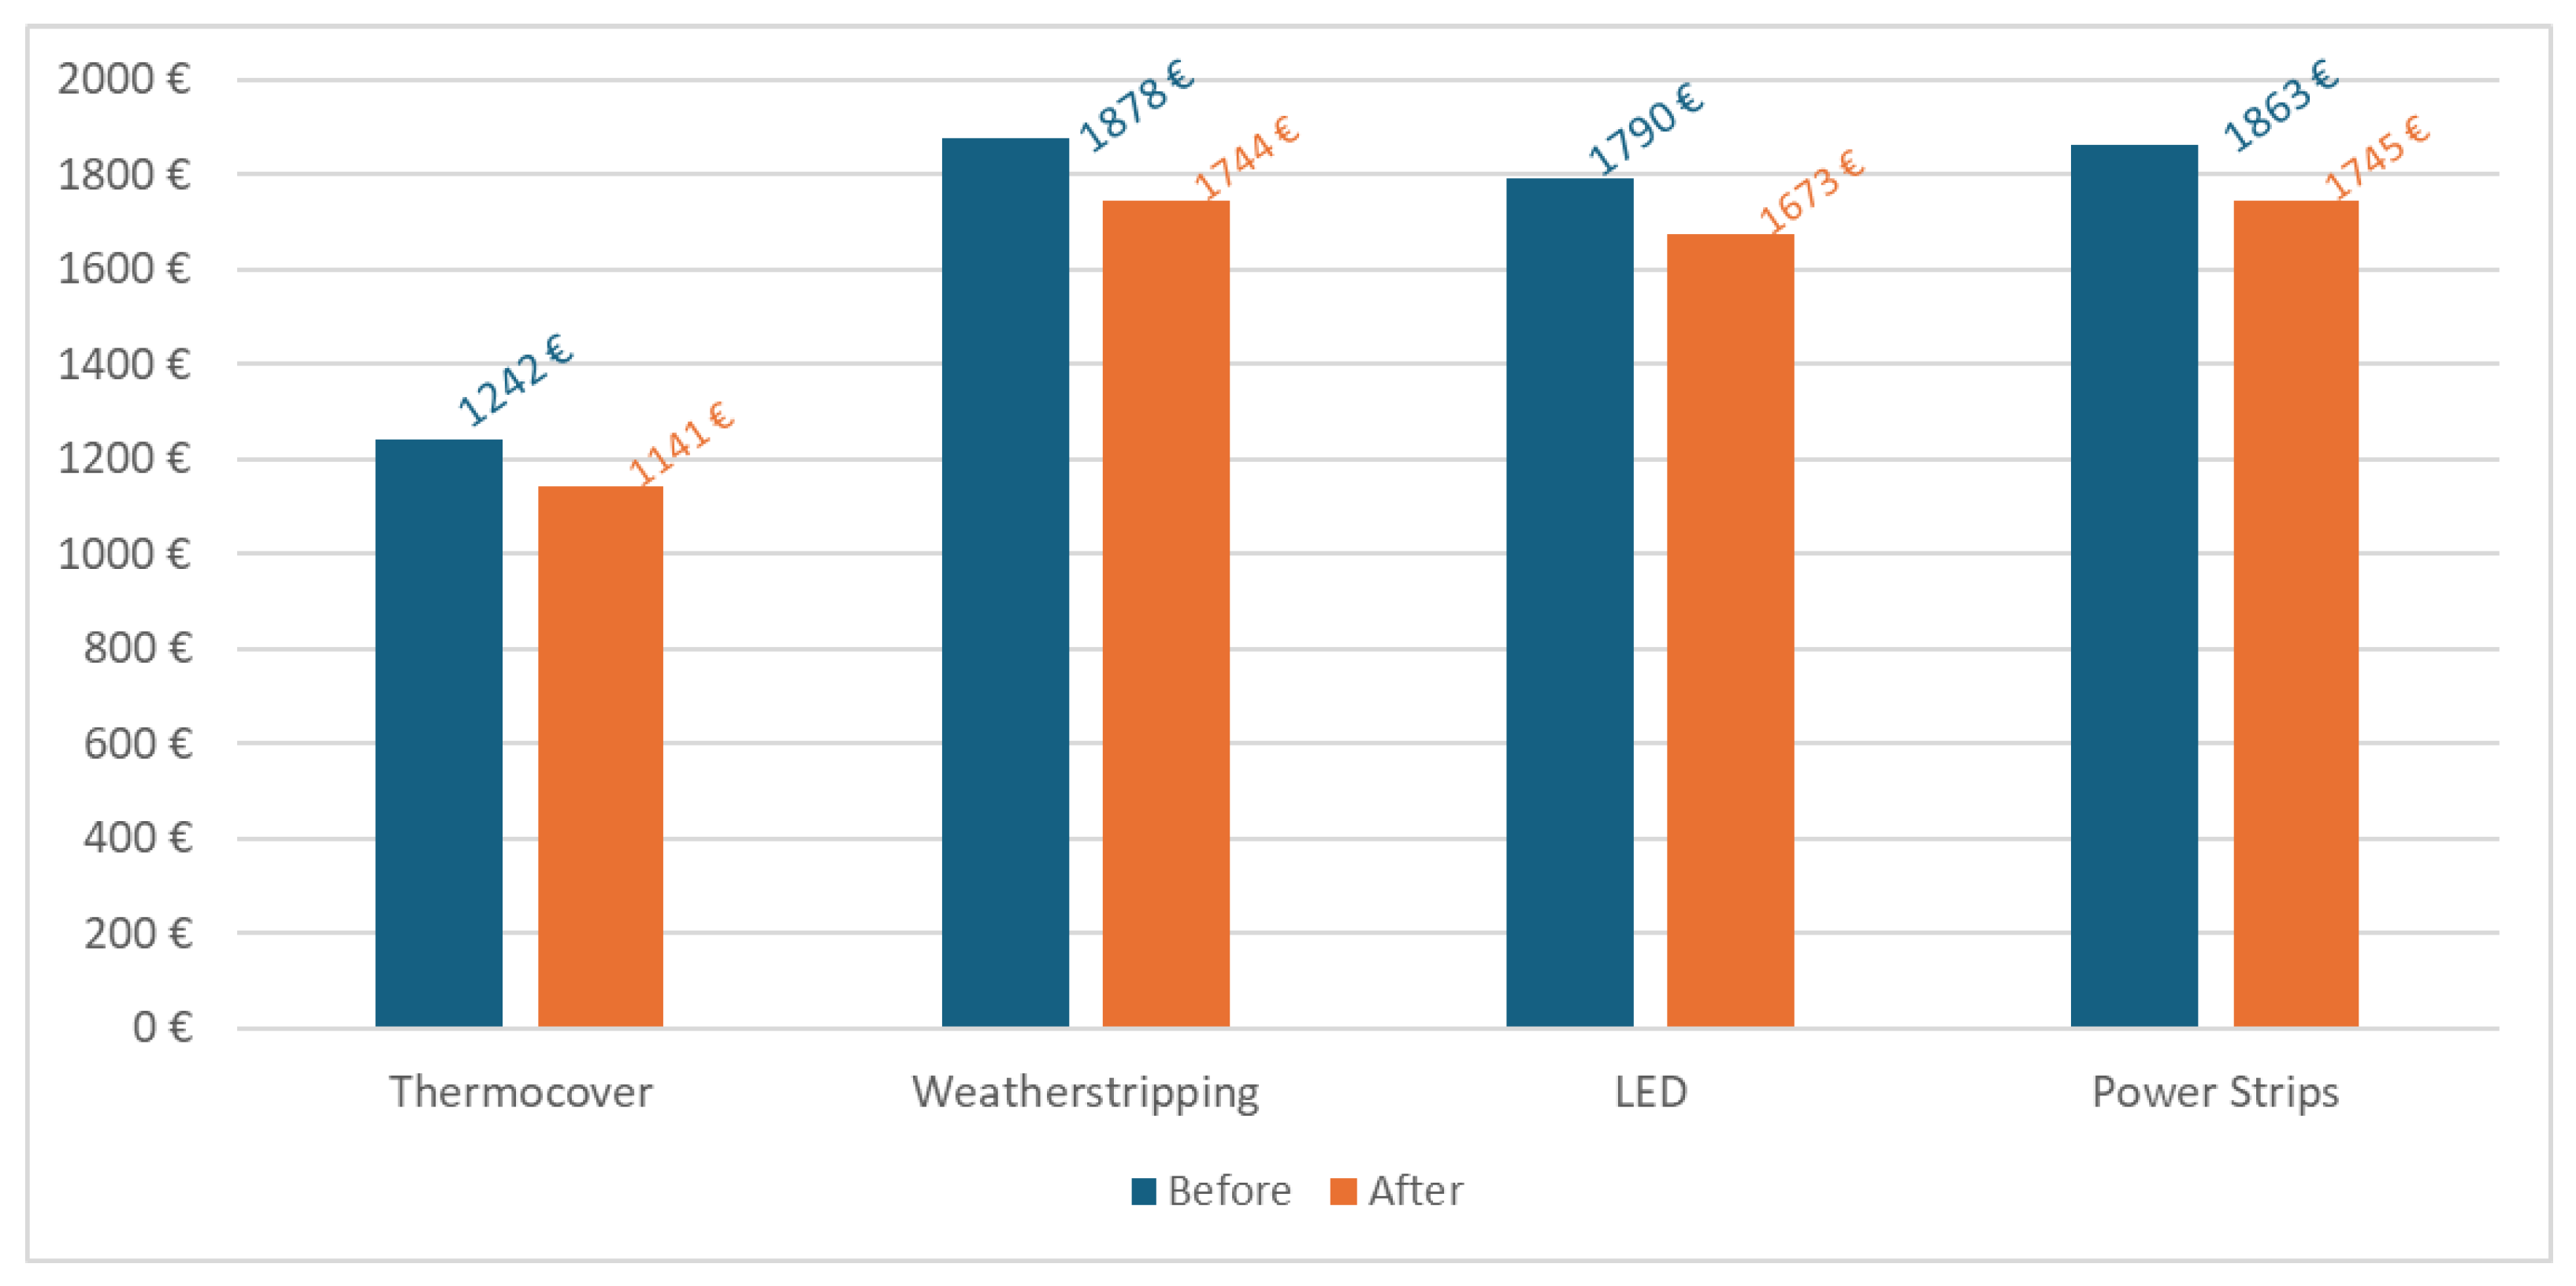
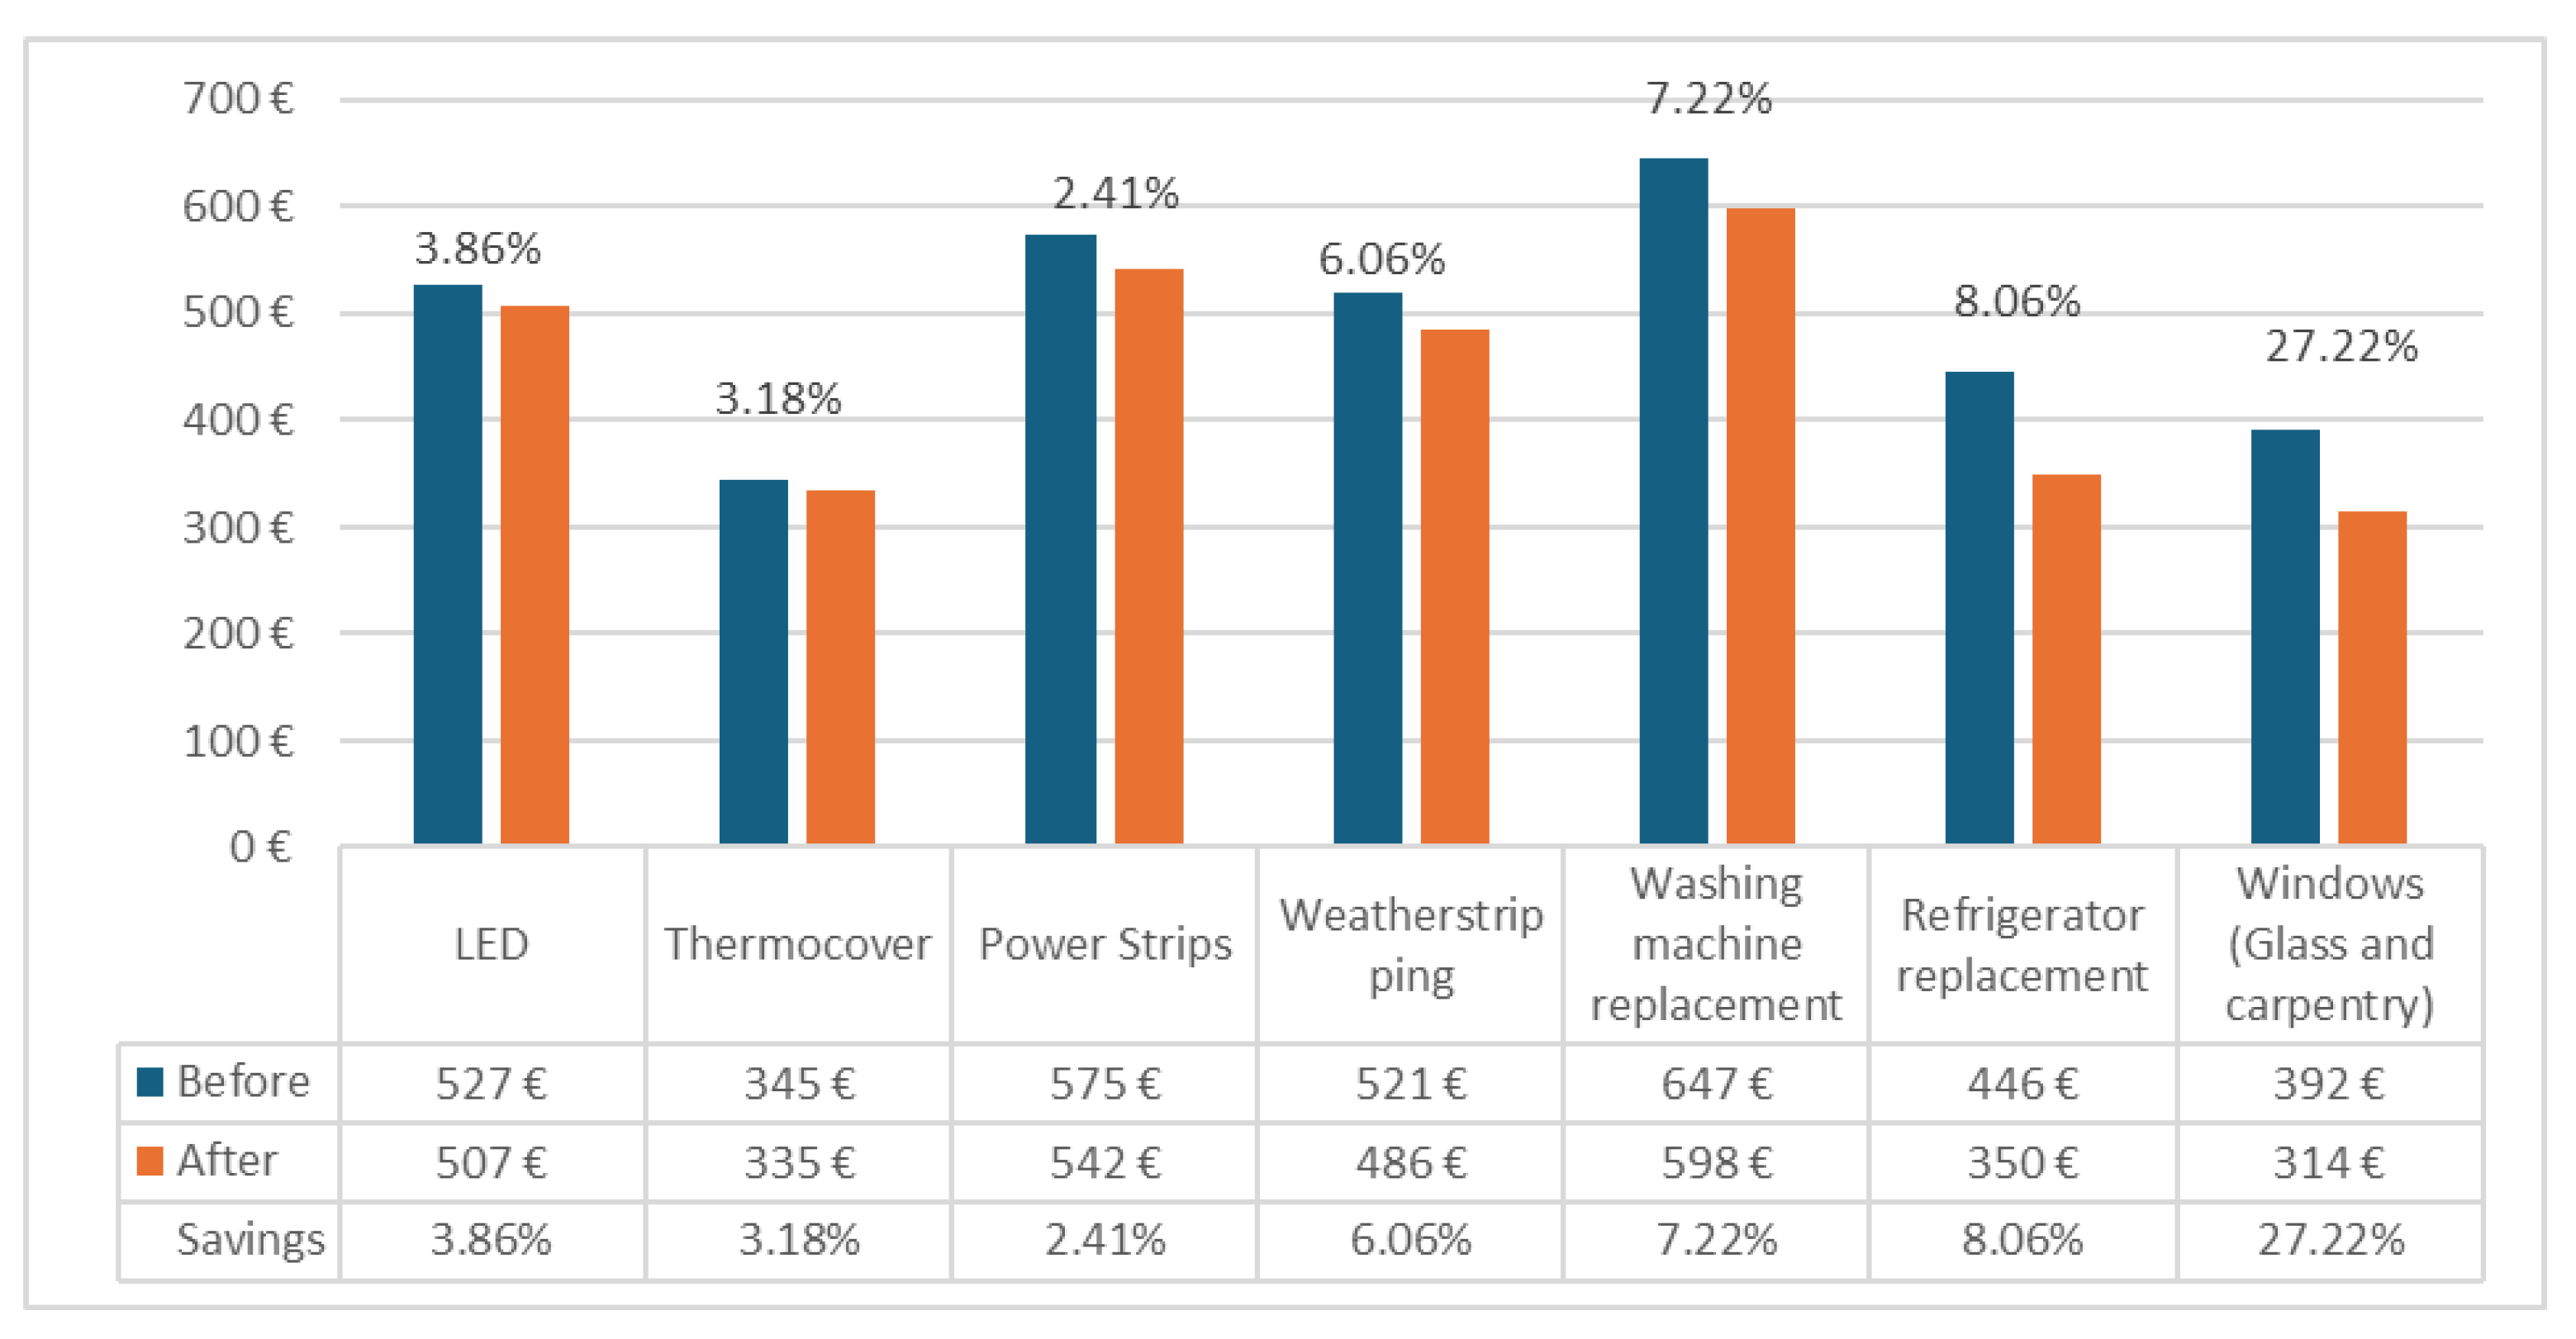
3.1.1. Study of Energy Retrofitting Measures

Figure 2 shows the number and type of interventions that were carried out in the study dwellings. Most notably, LED bulbs, power strips, and weather stripping, i.e., micro-efficiency measures, were provided. This is justified because most households were served within the Red Cross energy poverty project that only had these measures at its disposal.
Another group of measures is the shallow renovation of the envelope (glazing and carpentry—i.e., window replacement and wall insulation) with fewer cases (six households). Finally, there are some cases of replacement of household appliances (eight households).
To know the efficiency of each measure ‘in isolation’ shows how, in the Real case (i.e., including the impact of the price change after refurbishment), the theoretical energy expenditure was reduced according to each measure. ‘In isolation’ means without taking into account the rest of the measures implemented in the home, e.g., measuring the impact of the thermocover only. The most efficient measure was wall insulation (21.32%—one case in Taradell), followed by the replacement of glass and carpentry (average savings of 6.58%), replacement of refrigerators (4.57%), and the use of weather stripping (3.2%). The most effective measures for reducing theoretical energy costs are those defined as shallow renovation. However, it has to be taken into account that in shallow renovation cases, some theoretical energy expenditure results are affected by the very significant change in electricity prices after refurbishment (see Figure 3).
To eliminate the effect of this phenomenon, Figure 4 shows the average theoretical savings according to the isolated intervention in a ‘Counterfactual case’, i.e., excluding the impact of the price change after the retrofit. This figure allows us to assess the impact of energy efficiency measures per se, i.e., without considering other external factors such as energy prices.
Table 2 compares the average savings of the measures in the Real case (considering the price effect) with the Counterfactual case (isolating the price effect). The first case will be used for the energy poverty analysis (Section 3.2), as it reflects the real situation of the sampled households. On the other hand, the Counterfactual case allows us to analyze the impact of energy efficiency measures on theoretical energy expenditure in an “ideal” scenario of unchanged energy prices before and after the intervention. In households with micro-efficiency measures (Red Cross households), as the bills after the intervention were not available, the price was considered constant, thus giving the same value of savings in the real and the Counterfactual case. On the other hand, in the households of the other entities, the change of washing machine and the insulation of walls in the Real case have generated significantly lower savings than in the Counterfactual case because the bills of these households have experienced a substantial increase in the price of the energy term.
Thus, in the Counterfactual scenario, wall insulation remains the most effective measure, achieving 30.1% savings in theoretical energy expenditure, while washing machine replacement reaches the expected position, generating savings (4.15%) of the same order as refrigerator replacement.
In, it can be seen how much the theoretical expenditure was reduced depending on the micro-efficiency measures implemented, taking into account the total savings, i.e., the percentage of savings of all the measures that have been implemented in the household. Only micro-efficiency measures are considered in this analysis as they have been implemented jointly, i.e., different materials have been installed in the micro-efficient households, e.g., LEDs, power strips, and weather stripping. Therefore, not only is the efficiency of the respective renovation that names the cluster measured, but also the other measures that have been implemented. It should be noted that a household that implemented different measures may be in different clusters. Of the micro-efficient households that have reduced their overall theoretical expenditure, most are those that have received Thermocovers (reduction of 8.14%), followed by those that received weather stripping (7.41%).
The high percentage of savings in the households where thermocovers were delivered is striking, as it is the measure with the lowest average savings on an individual basis (average savings of 1.33%). But this result is because in all households where thermocovers were delivered, at least two further measures were applied, in most cases three (see Figure 5).
Compares of the average savings generated by each micro-efficiency measure considered in with the savings calculated taking into account all measures implemented in the household. The savings percentages for each measure were calculated by averaging the percentage savings of the theoretical expenditure of all cases where the measure was implemented (either by calculating only the savings of the measure mentioned or by including the aggregate savings of all measures implemented in the household).
Table 3 shows that although micro-efficiency measures do not lead to very high savings (the use of thermocover is the least effective measure), if joined, they can lead to significant savings, even greater than those of a major renovation such as replacing a household appliance. Therefore, the results of these types of measures should not be underestimated, as they are not only less costly but also very effective when taken together. In particular, according to the above analysis, the two measures of this type with the greatest impact are weather stripping (3.2% individual savings, also included in the shallow renovation decalogue) and strips (2.7%), with these materials being highly recommended for a micro-efficiency kit. With respect to the thermocover, where installed, the remaining three micro-efficiency measures were also delivered, producing a cumulative saving of 8.14%, which is the study benchmark for a kit composed of the four measures of Table 3.

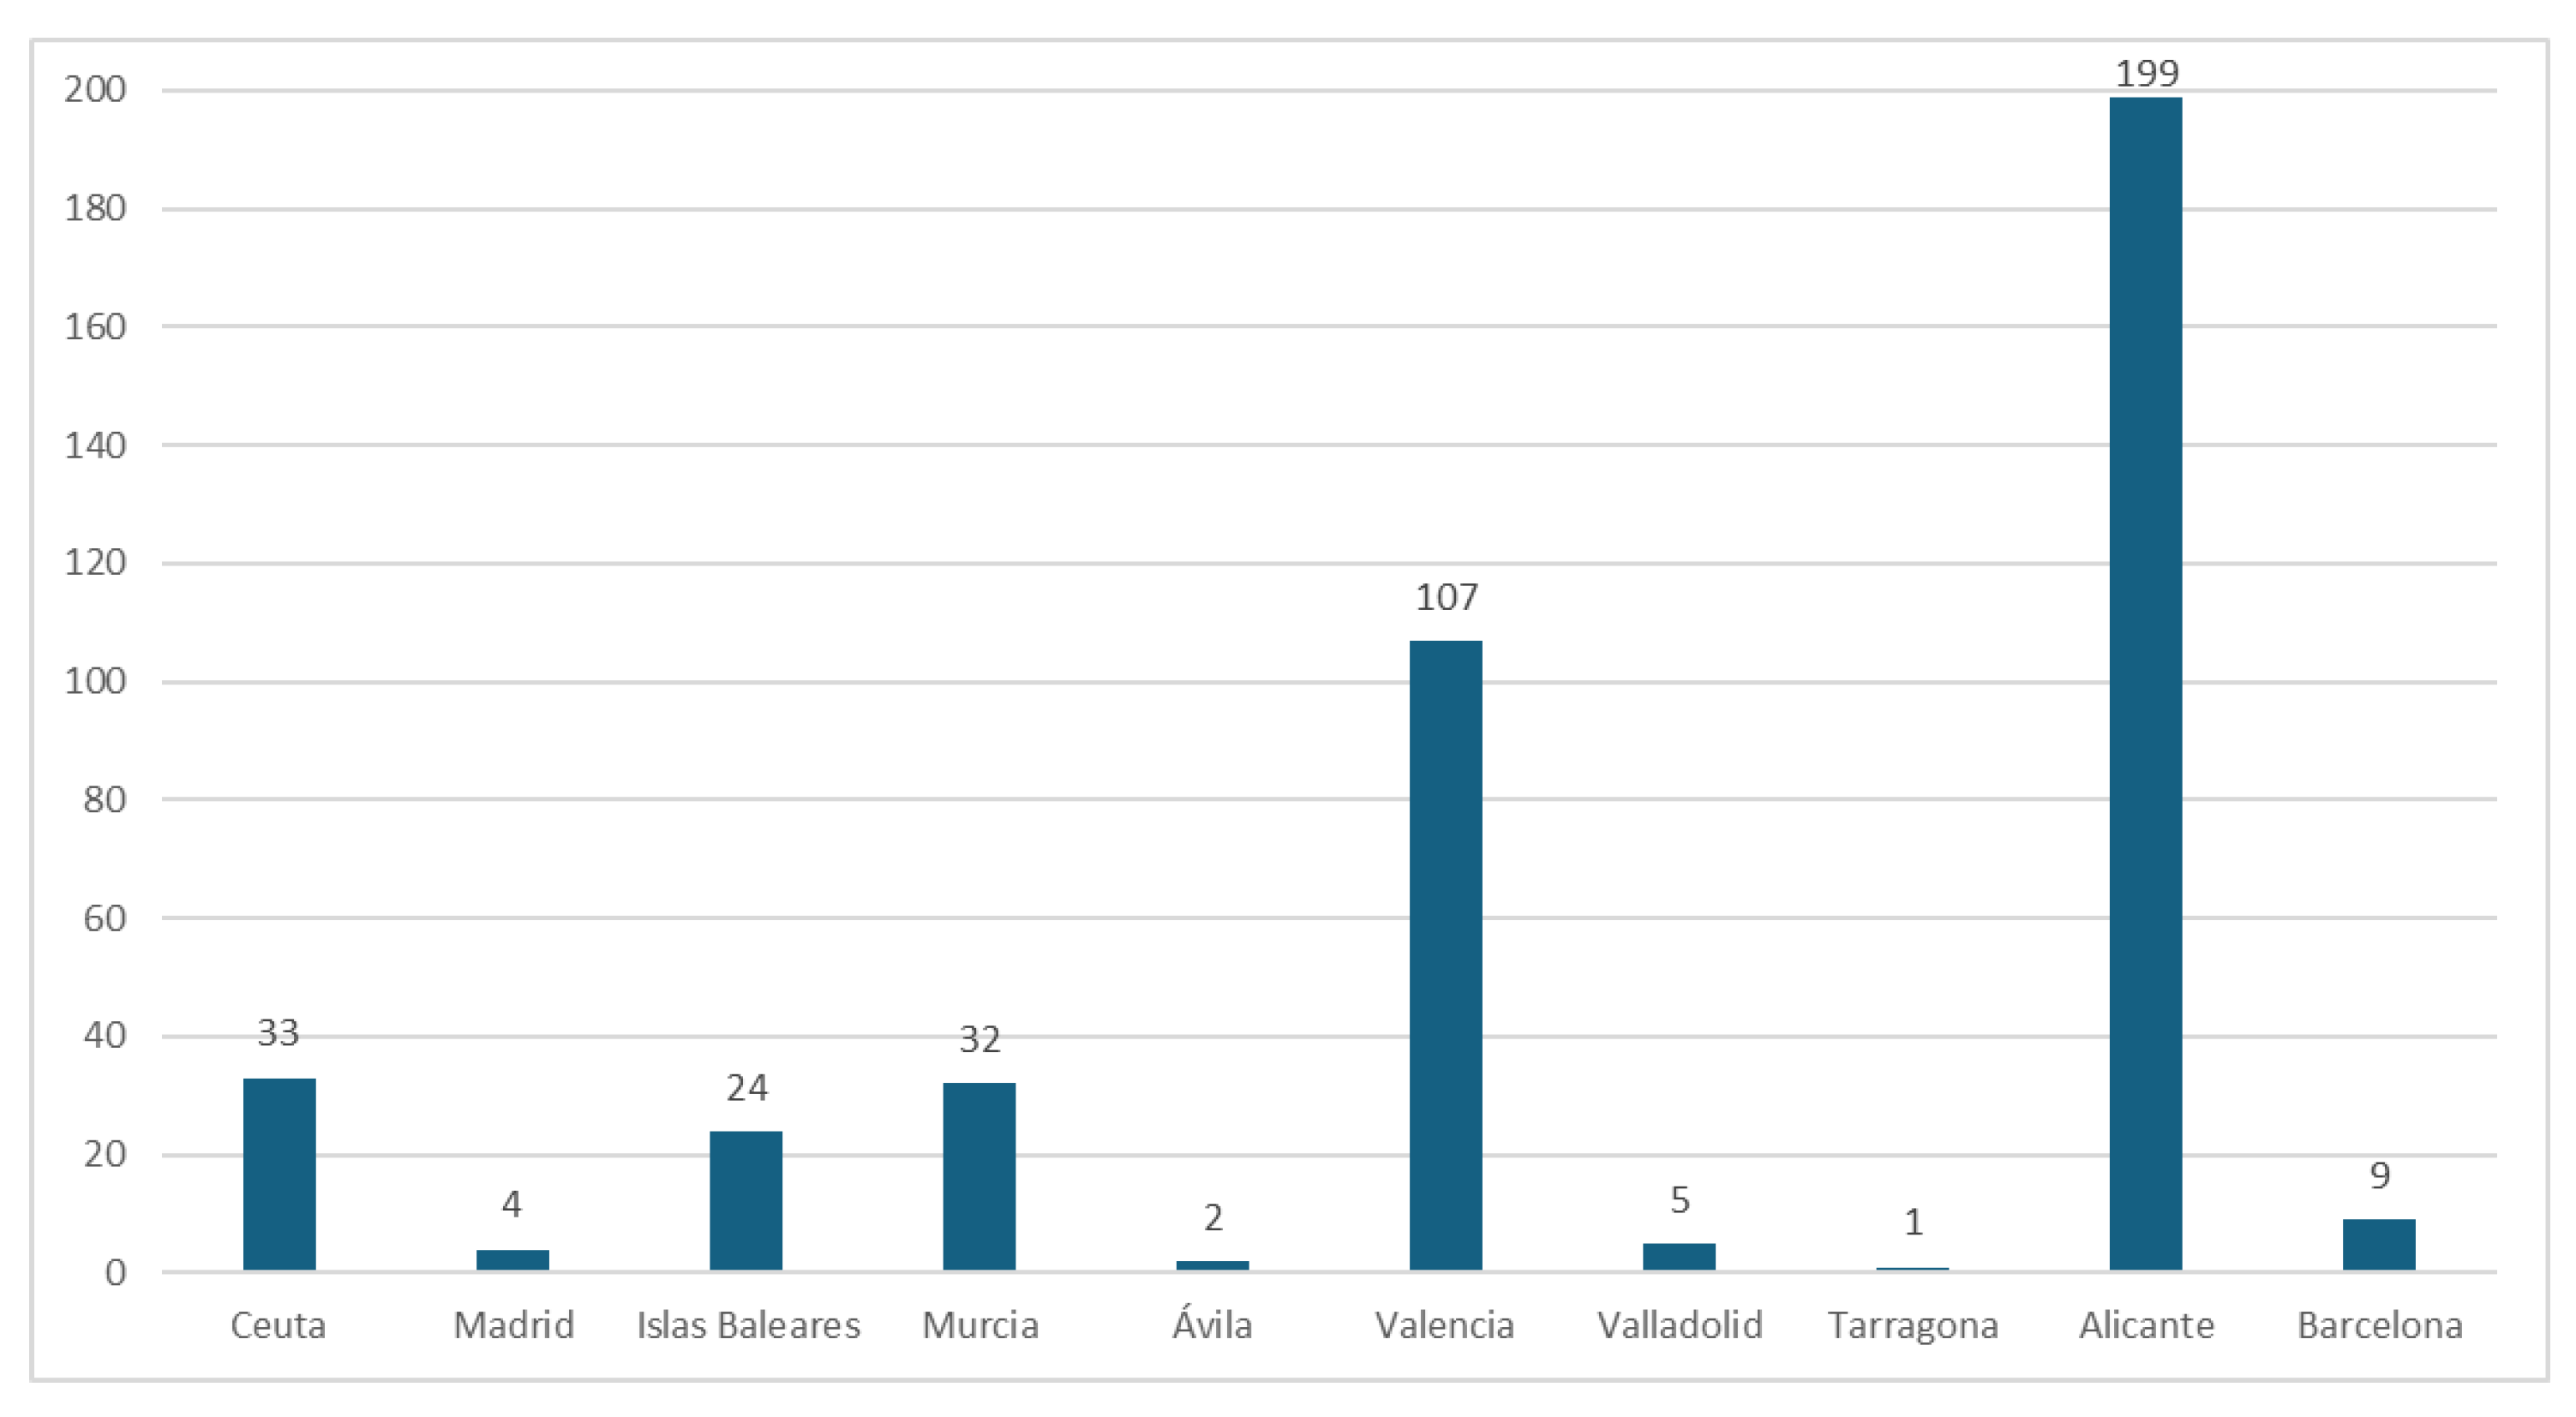
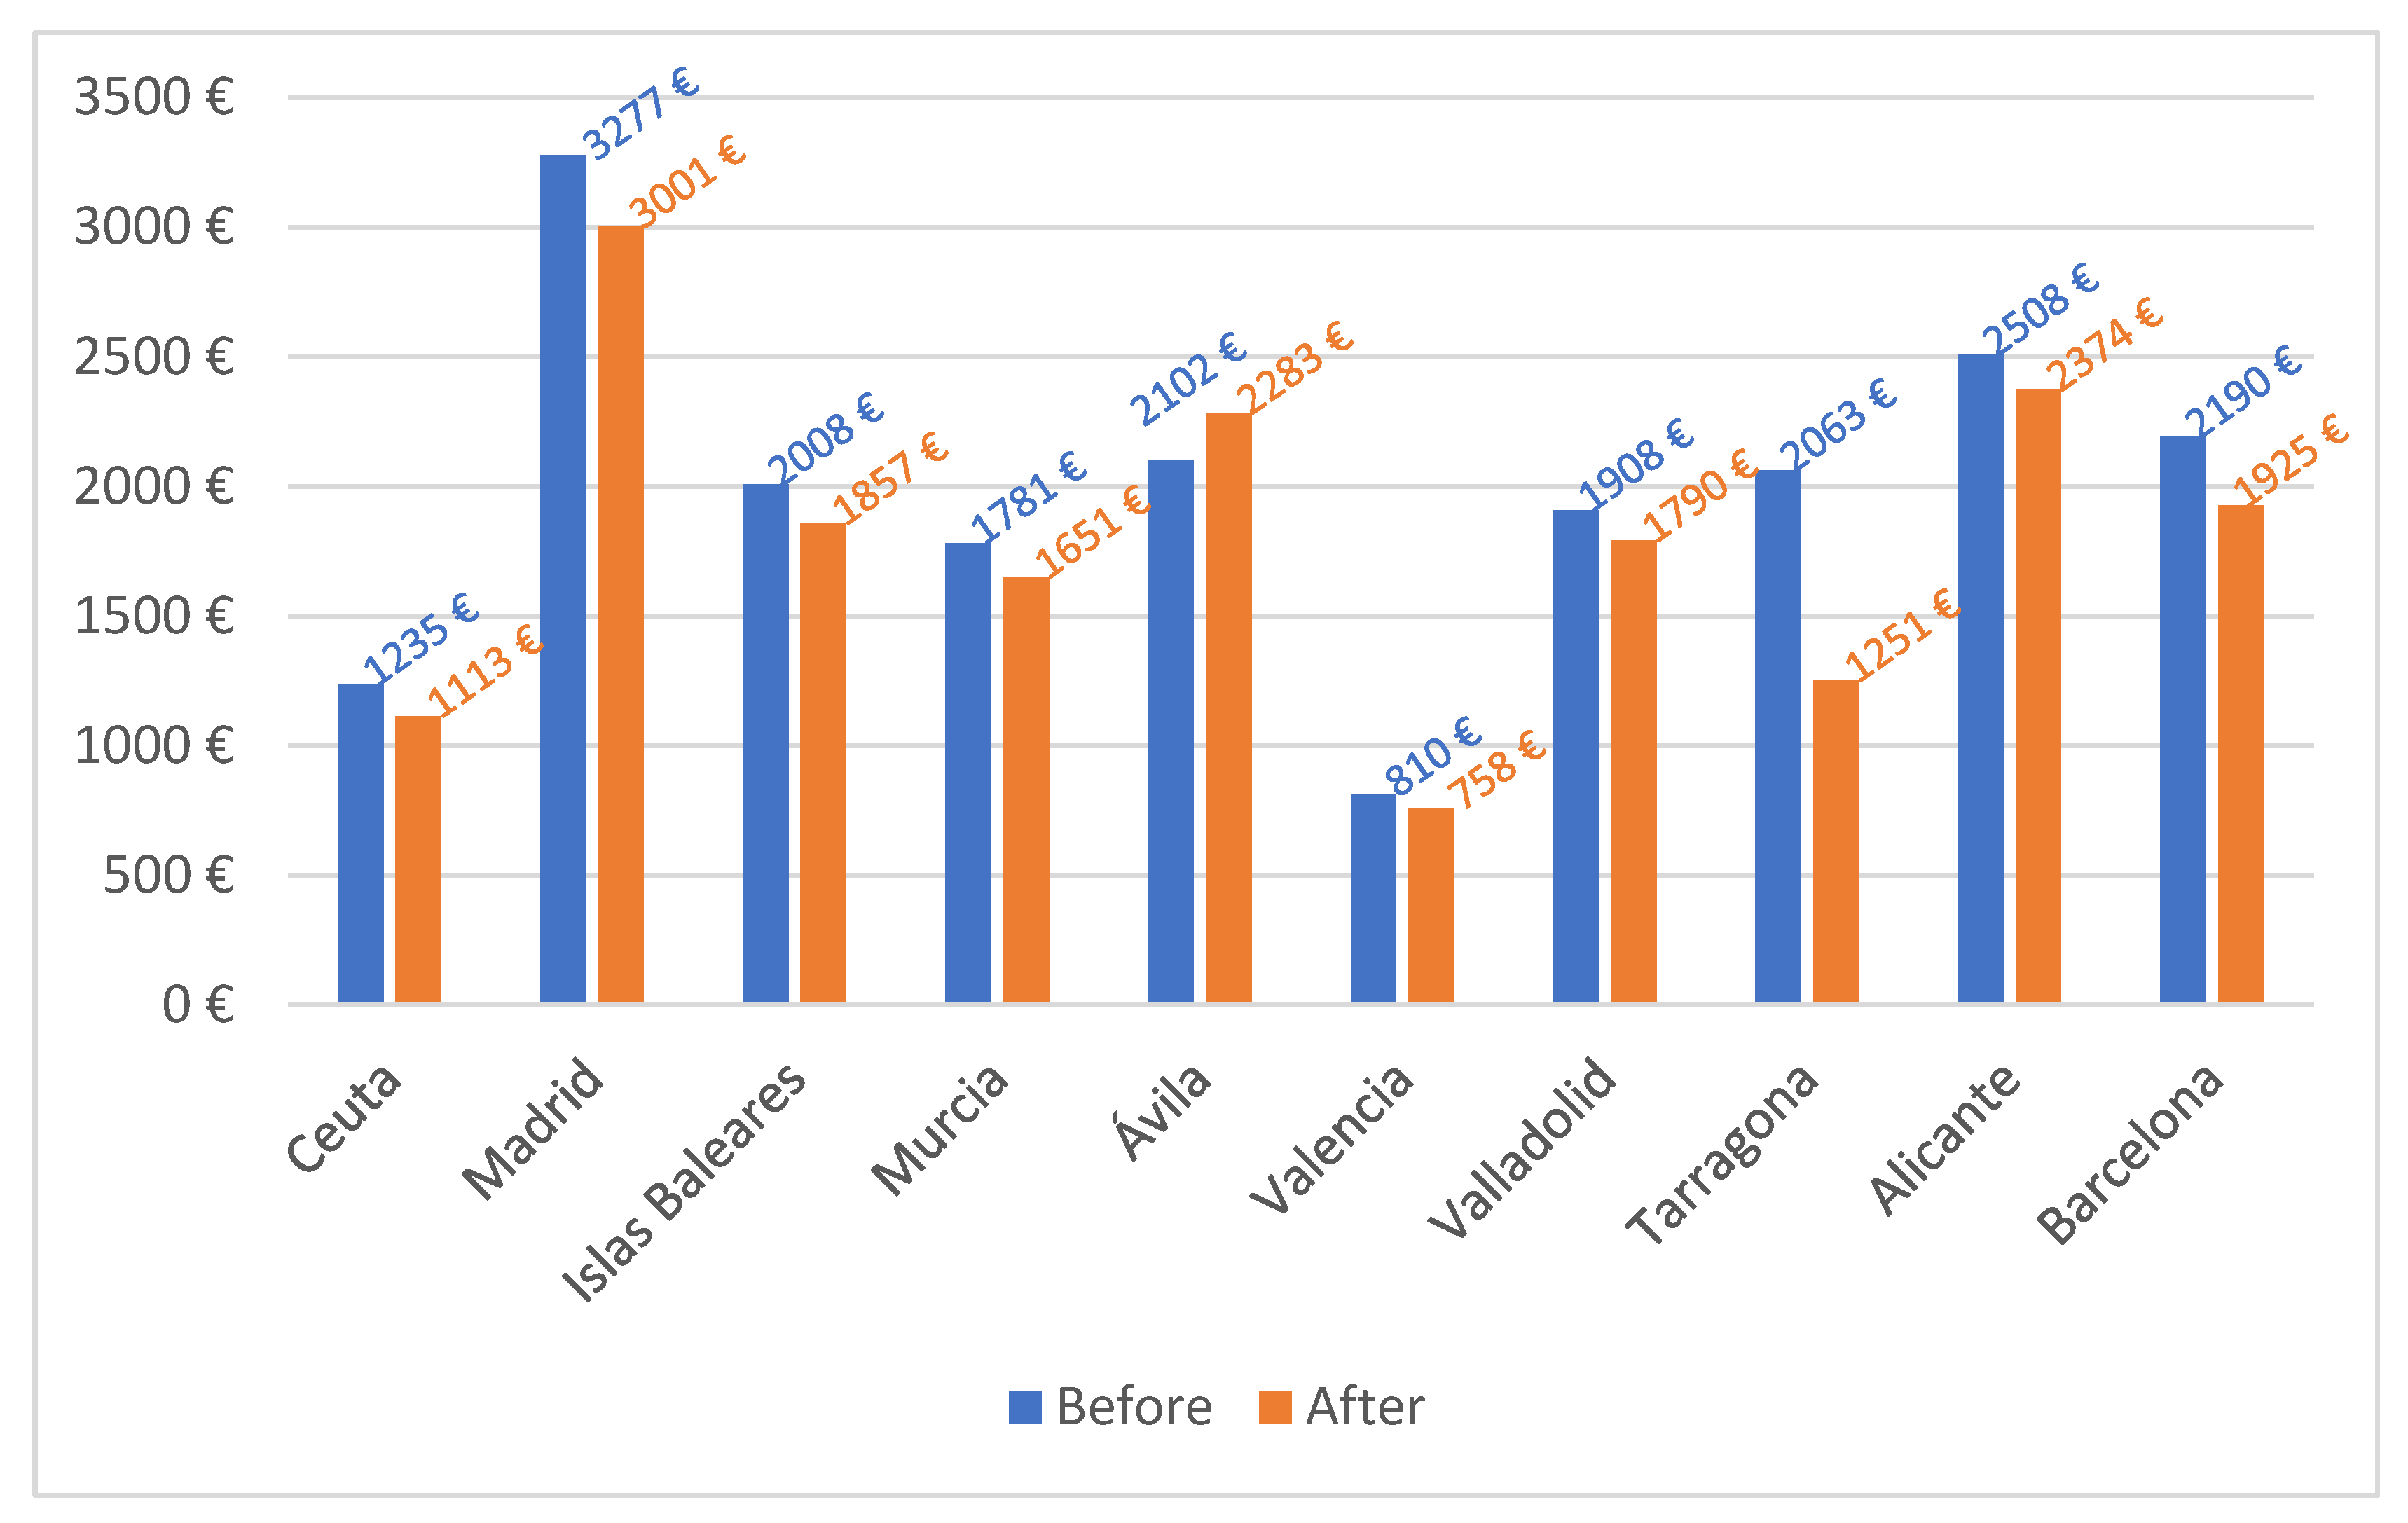
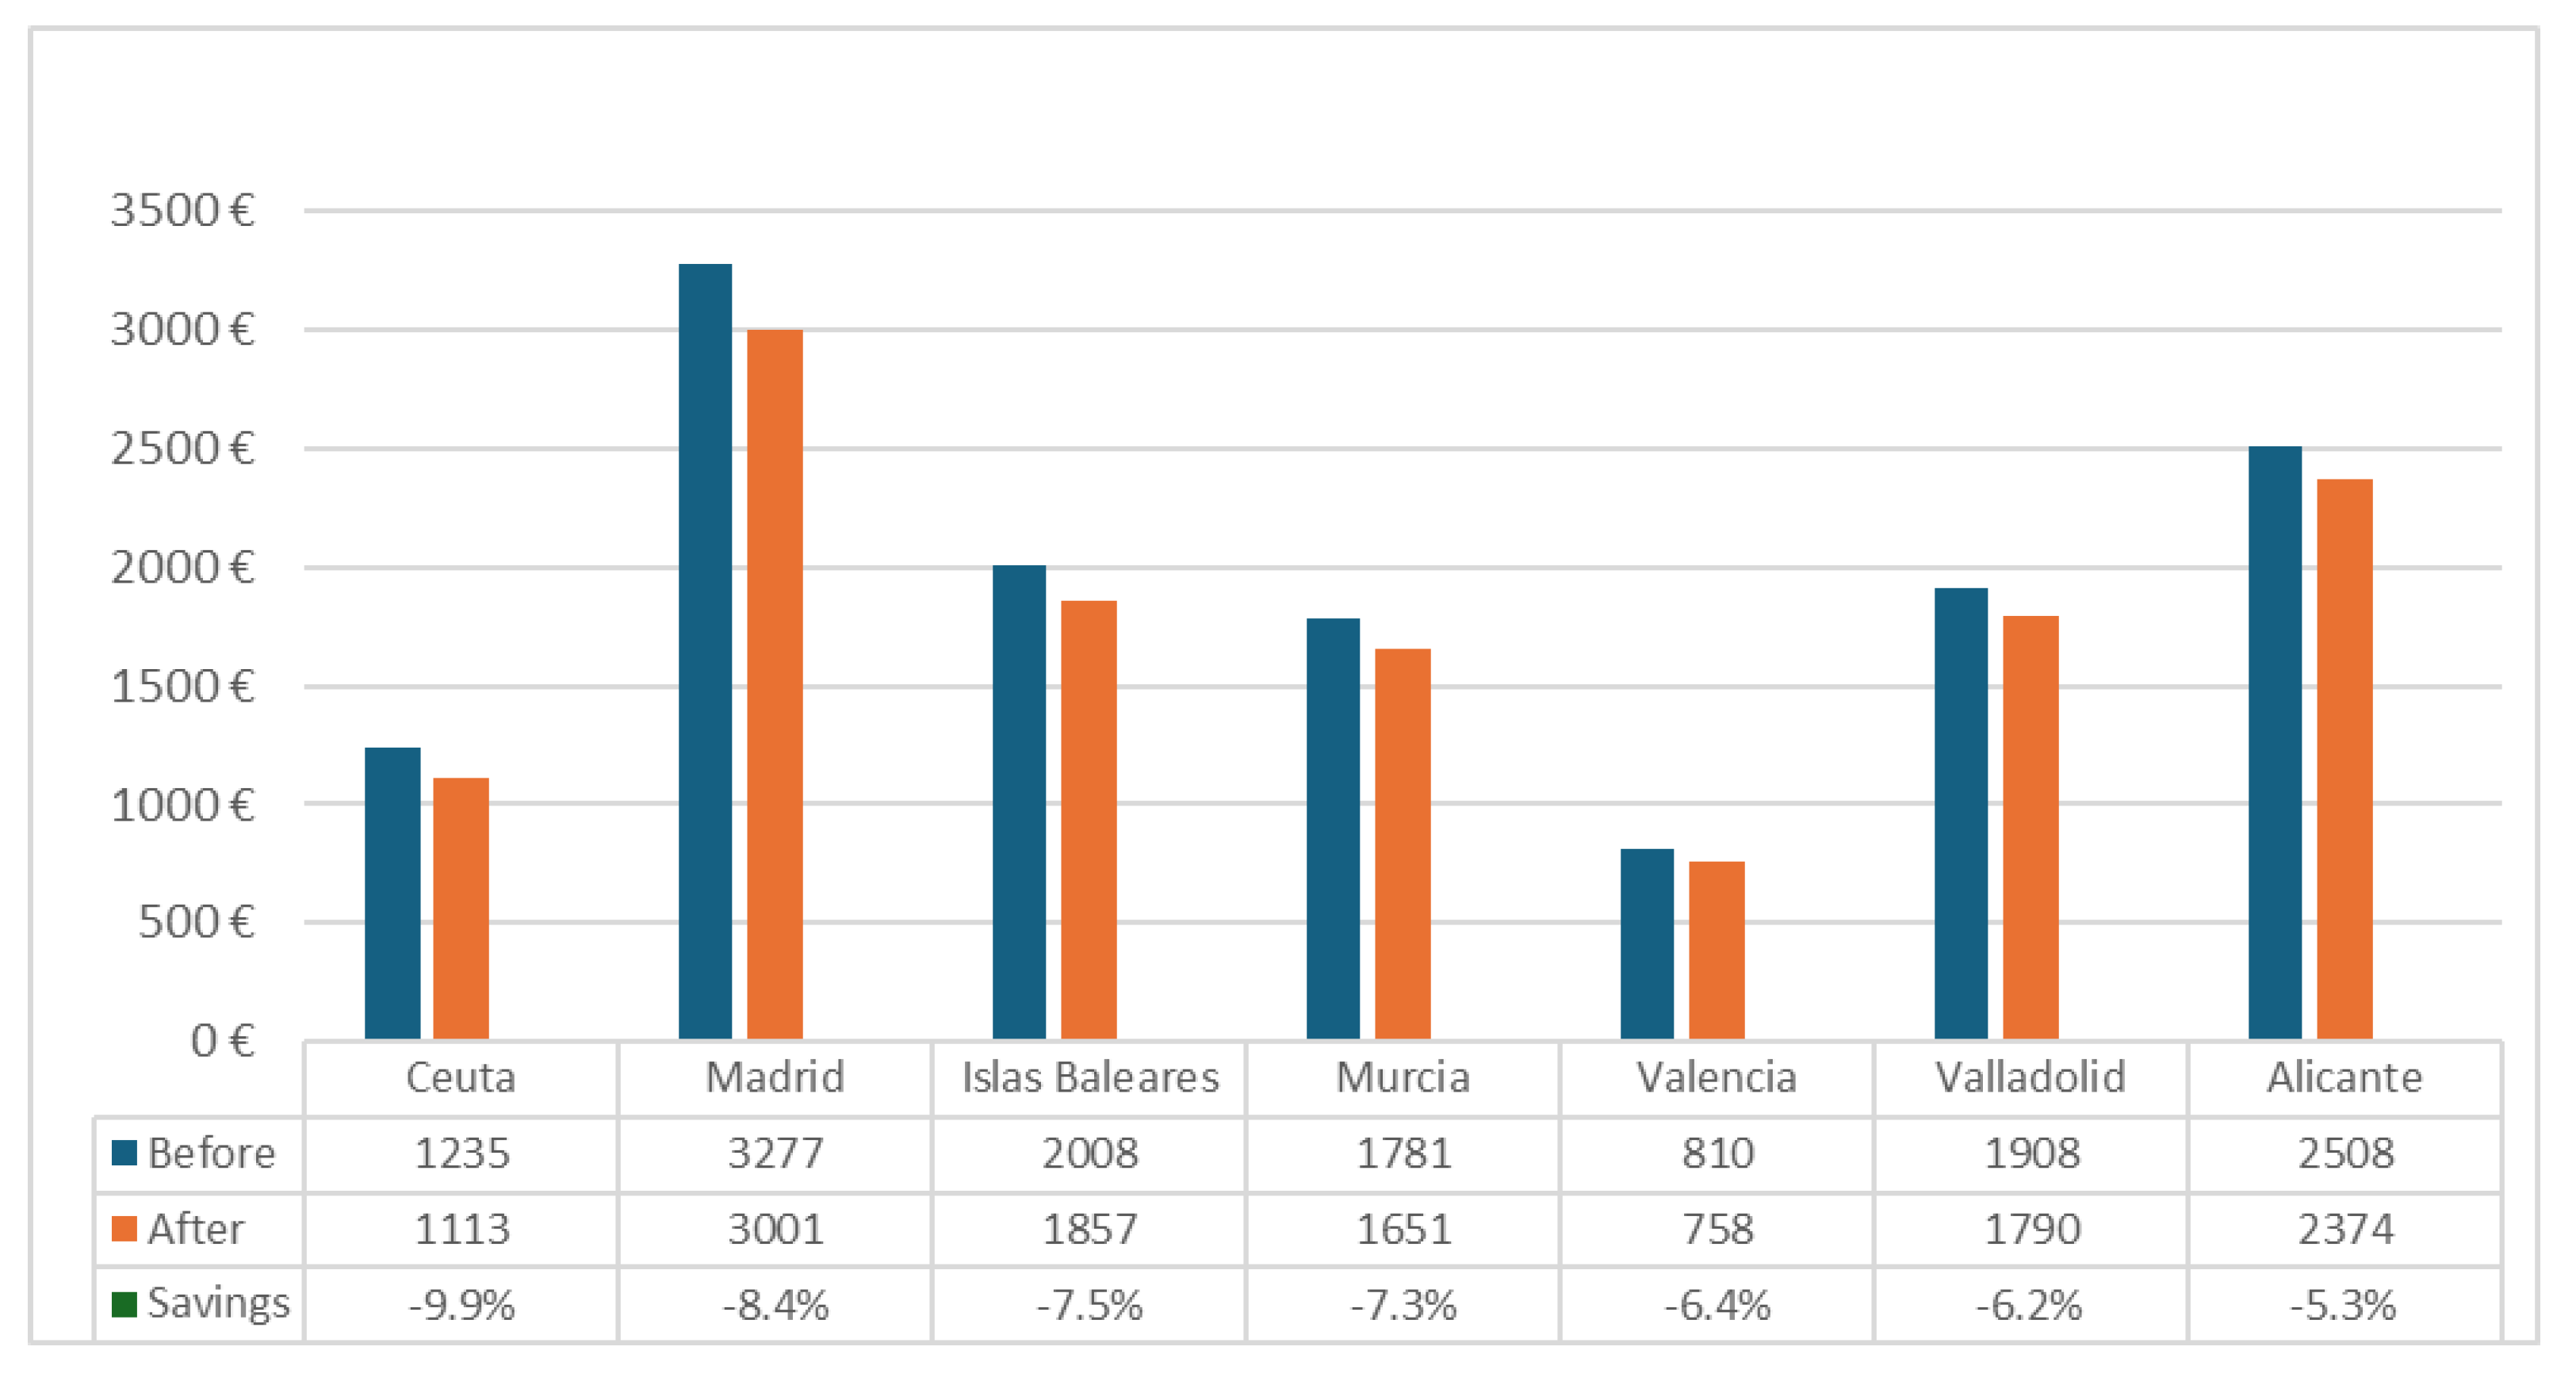
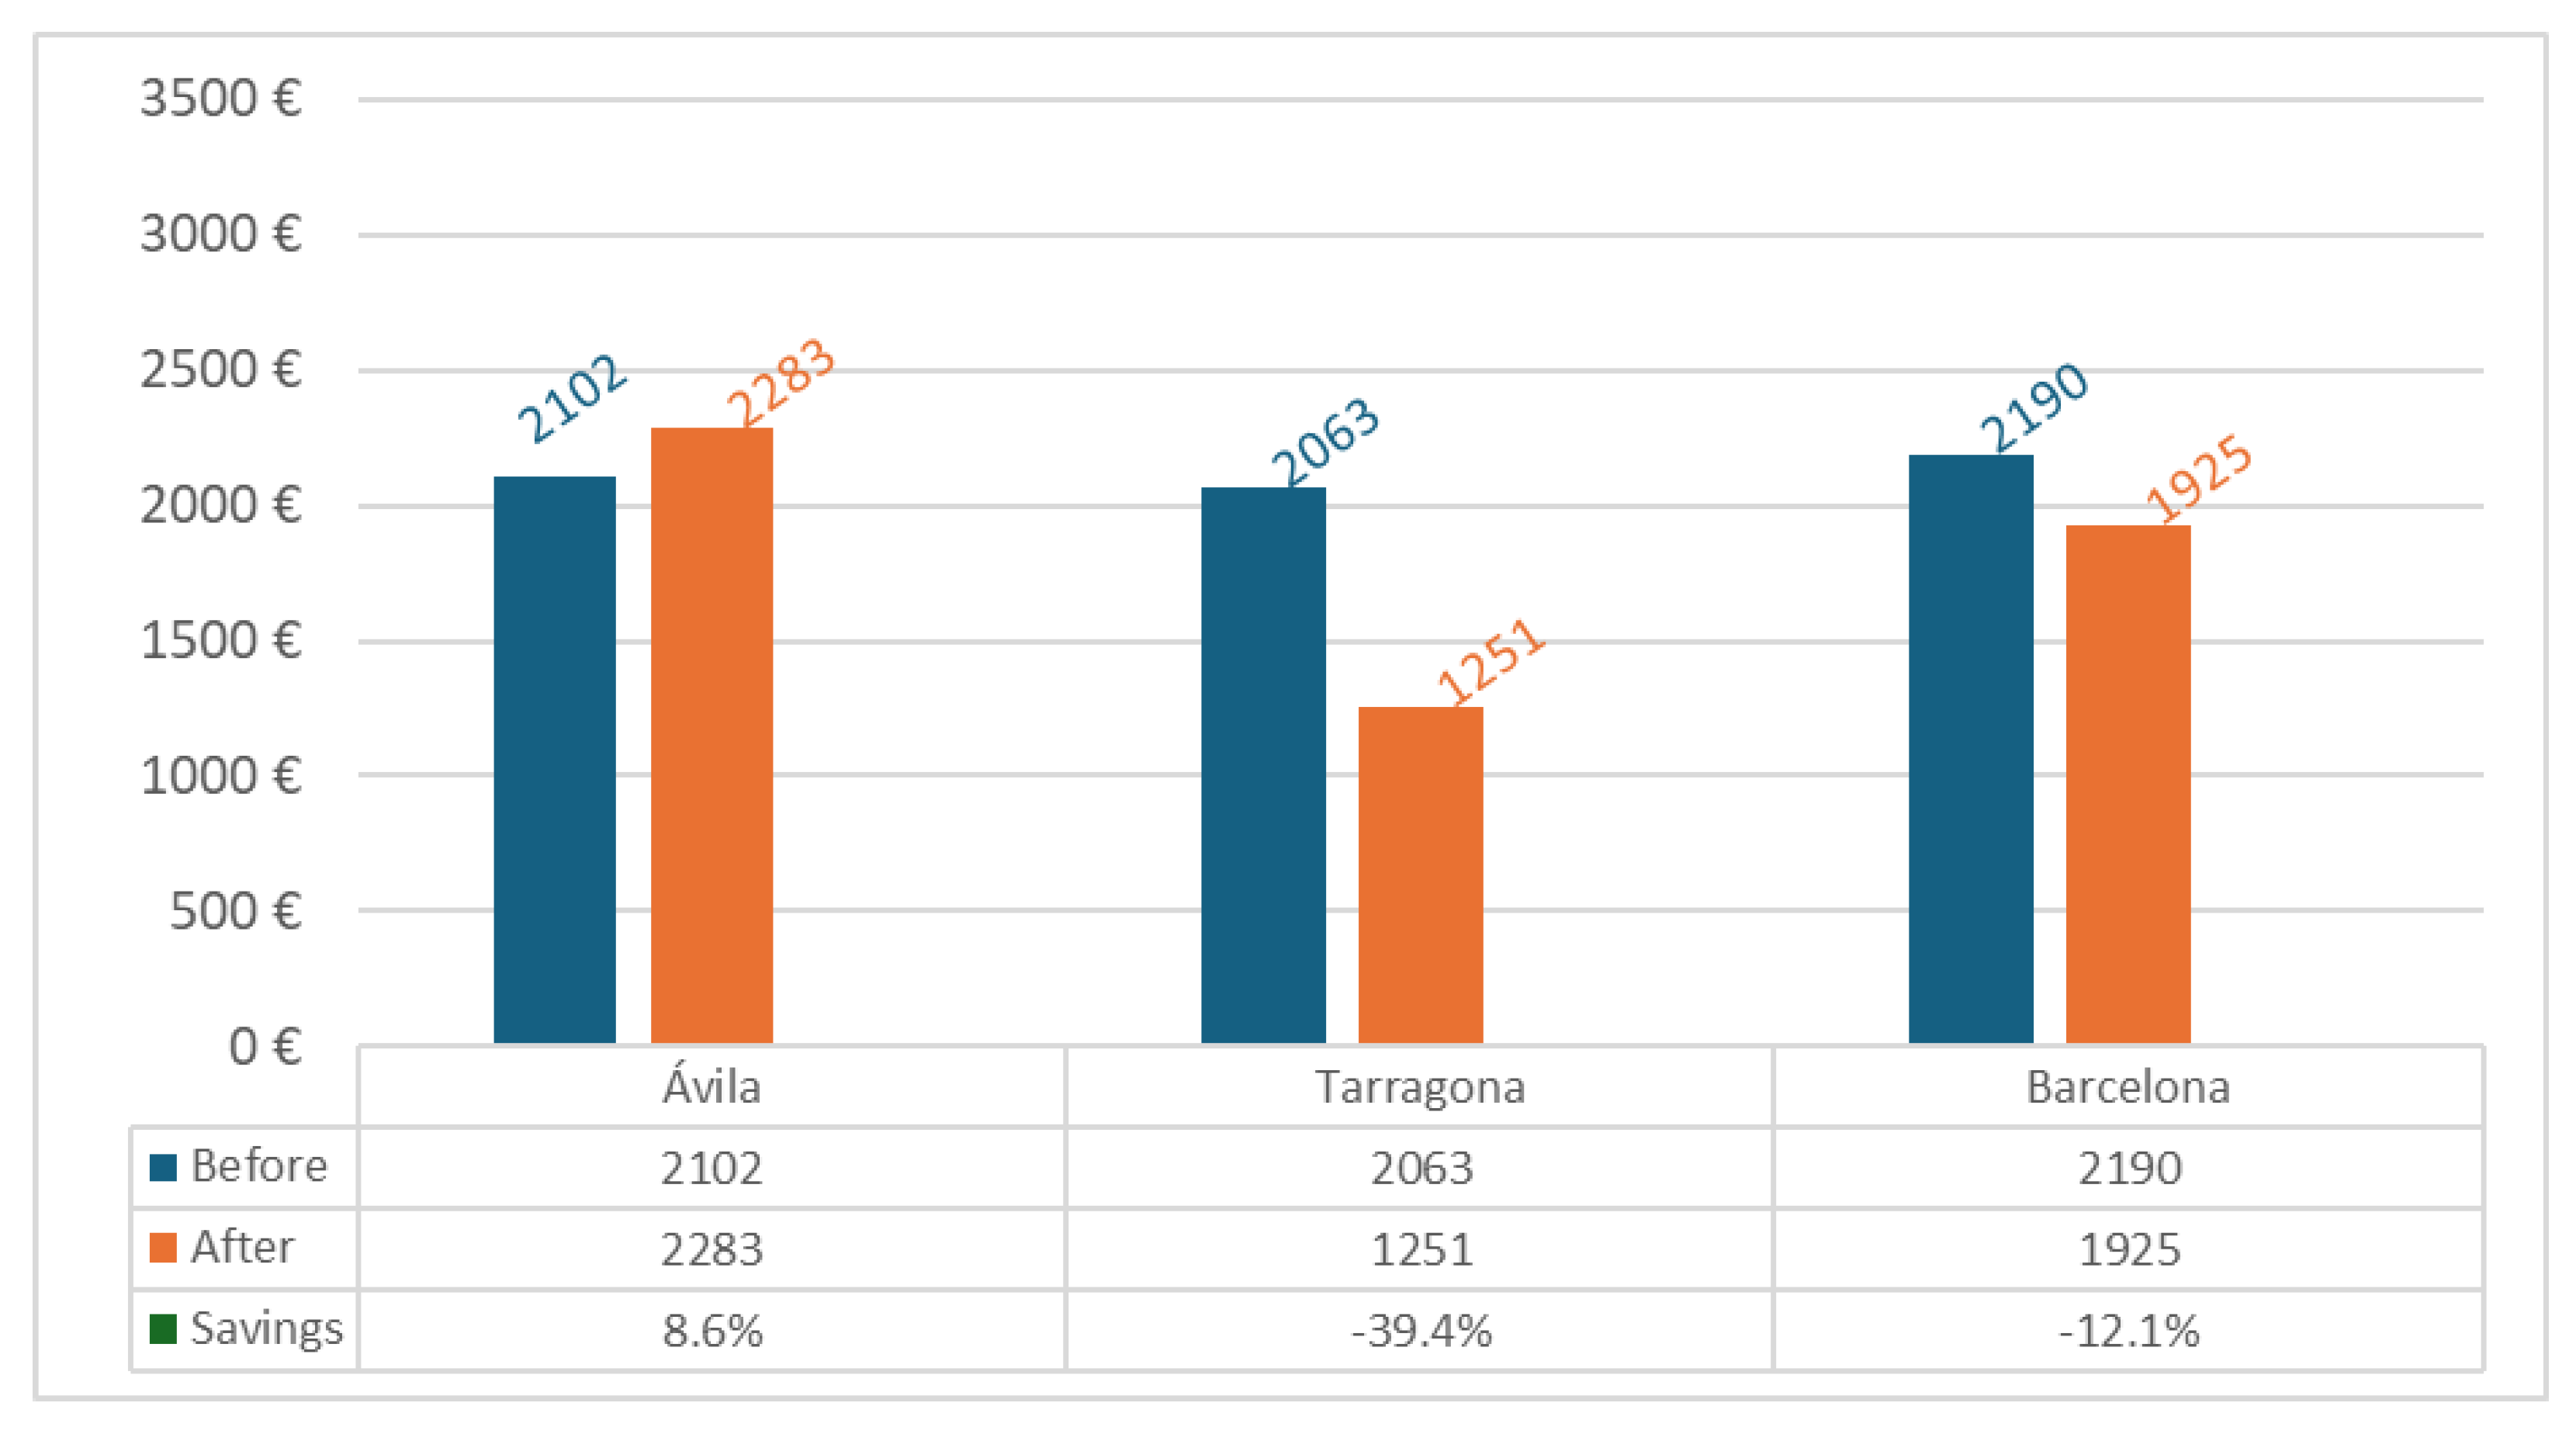
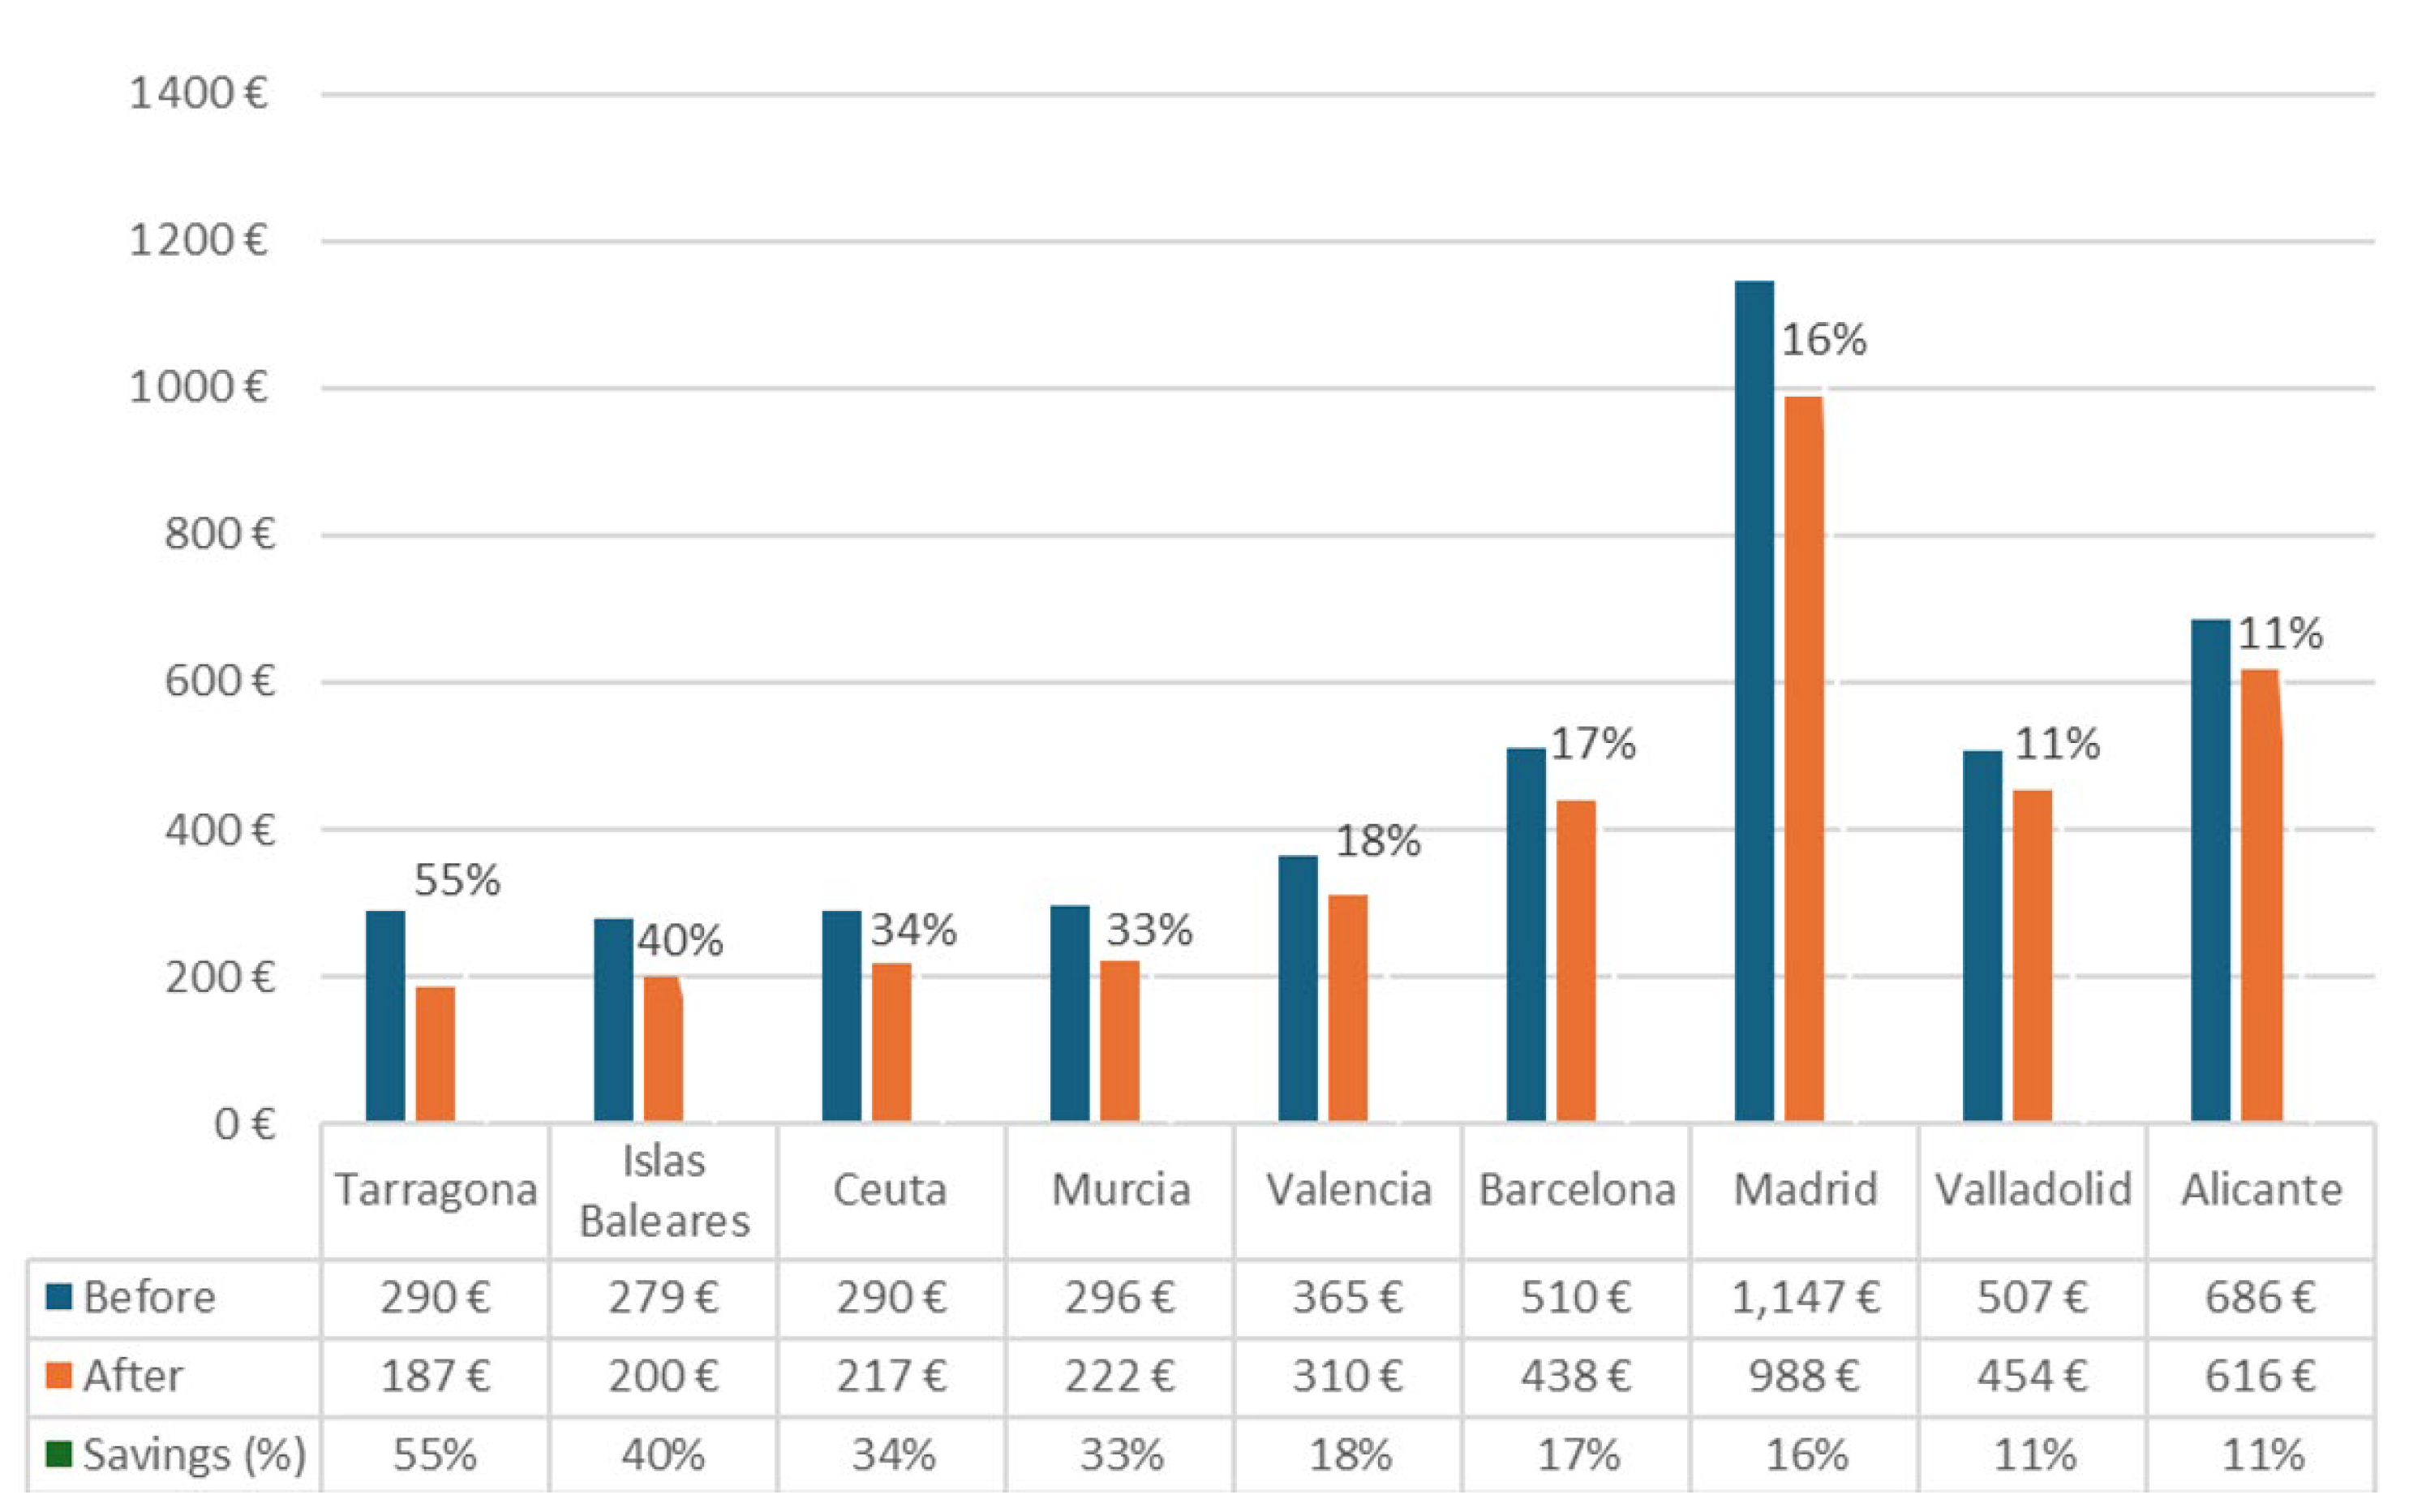
3.1.2. Study by Province

Households are heterogeneously distributed in 10 provinces, a circumstance that must be taken into consideration when assessing the results of this study. Three-quarters of the households are located in the provinces of Alicante and Valencia, which have medium-low heating demands compared to the rest of the provinces. However, [19] ranks Alicante as the province with the second highest theoretical cooling expenditure, which, with summer energy poverty being the most evident dimension of this problem in Spain [9], is a fact to be considered when implementing energy refurbishment measures. On the other hand, 11 households are in provinces with high heating demand (Madrid, Valladolid and Avila). In the case of Madrid, the demand for cooling is also high (see Figure 6).
The average value of the theoretical expenditure before and after the implementation of the measures, according to the province of residence, is shown Figure 7. First, it is important to clarify how the savings percentages mentioned below were calculated. To calculate the average savings in theoretical expenditure for each province, the total savings percentage of all cases belonging to the same province were averaged.
The highest relative theoretical savings occurred in Ceuta, with an average reduction in theoretical expenditure (GET) of 9.89%, followed by Madrid, with a saving of 8.41%. On the other hand, the province that was least favored by the energy re-furbishment measures was Alicante (5.3%). It should be noted that the number of households in the province of Alicante corresponds to almost half of the total cases (199 households), thus having a much higher statistical representativeness than the provinces of Tarragona (one household) or Ávila (two households), among others. Moreover, in the province of Alicante, all these households were assisted by the Red Cross, so only micro-efficiency measures were applied, with a lower theoretical impact, while the only household in the province of Tarragona replaced its old windows (glass and carpentry), with this being one of the most effective measures (see Figure 7).
Figure 8 and Figure 9 compare only provinces with similar measures, namely those from the ENERSOC (Red Cross) data—Figure 8, which implements exclusively micro-efficiency measures, and those from the VAREX-2024 own questionnaire data—and Figure 9, which replaces appliances or implemented passive measures.

3.2. Energy Poverty Analysis

3.2.1. Overall Results

In this section, we analyze the evolution of energy poverty in households after implementing energy refurbishment measures. To do so, we assessed one of the official energy poverty dimensions according to the ENPE, i.e., under-spending or hidden energy poverty, but using the HEP indicator by [18] instead of the M/2. We considered a household to be in hidden energy poverty if its energy expenditure is less than half of its theoretical household expenditure and it is in the lowest five deciles of equivalized income. Due to the data requirements for the analysis of hidden energy poverty, the number of cases that we worked in this section was reduced to 171.
After applying all the corrections mentioned in Section 2.2, it was found that 71.67% of the families treated are in hidden energy poverty; this is a very high percentage if we compare it with the national population share in 2022, which was 30.9% [9], but that was to be expected since these are vulnerable families participating in the Naturgy Foundation projects. This percentage is reduced to 68.33% after implementing the measures (six families leave this situation), i.e., the incidence of hidden energy poverty is reduced by 4.65%. This apparently unsatisfactory result is not so, as it is mainly because more than 40% of the households in energy poverty are in severe hidden energy poverty, i.e., their actual expenditure is less than a quarter of their theoretical expenditure. Households belonging to this group are likely to need more in-depth measures (e.g., deep energy retrofit) than micro-efficiency measures to get out of their hidden energy poverty situation. In other words, they are likely to need more medium to long-term structural measures or, at least, more far-reaching shallow renovation measures (wall insulation). On the other hand, after the renovations, five households move out of severe hidden energy poverty, i.e., the percentage of the total moves from 29.61% to 26.82%, a reduction of 9.4%. Overall, these results reflect the seriousness of the energy situation of the households treated, and the importance of considering different levels of severity when assessing energy poverty.
The six households that have emerged from hidden energy poverty had the same three measures: delivery of light bulbs, weather stripping, and power strips, but what mainly characterizes them is that they had a very slight initial energy poverty gap (GET/2—GR), less than EUR 80. In the case of the five households that emerged from severe hidden energy poverty, the variety of measures is greater; but again, what they share is that their initial severe hidden energy poverty gap (GET/4—GR) is not very significant (in this case, less than EUR 40).
After assessing the HEP indicator, the energy poverty gap (the difference between half of the theoretical and the actual expenditure) will be examined. The results are positive, as the energy poverty gap decreases on average by 14.51% thanks to the interventions, from EUR 553.5/year to EUR 483.3/year. In the cases that filled in their own questionnaire and sent in their bills, variations in the theoretical energy expenditure due to changes in energy prices were considered because the actual expenditure also varies according to these changes.
In the household located in Taradell (province of Barcelona), more ‘structural’ measures were carried out: shallow renovation of wall insulation on three façades and the replacement of the washing machine. These measures led to a reduction in theoretical energy expenditure of 29%, but actual energy expenditure fell even more after the renovation (by 42%) due to several factors (including the reduced need to turn on the heating due to improved wall insulation), thus leading to an increase in the calculated energy poverty gap. However, it is worth noting that the household monitoring and the survey highlight a better thermal comfort expressed by the occupant of this dwelling, both in the winter and summer.
The Taradell case is part of the sample of 12 households where the perception of comfort before and after renovation could be investigated. In this sample, the two households that could not maintain an adequate temperature during the winter before the renovation improved their situation after the intervention to reach winter comfort. That is, the indicator “Adequate winter temperature” dropped from 17% (two households) to 0% (0 households). On the other hand, of the three households that reported being unable to maintain an adequate temperature during the summer before the retrofit, only one remained with the same perception of thermal discomfort after the Fund’s interventions. That is, the indicator “Adequate temperature in summer” dropped from 25% (three households) to 8% (one household).

3.2.2. Study of Hidden Energy Poverty Depending on the Energy Retrofitting Measures Implemented

Figure 10 shows how the gap was reduced depending on the energy renovation measure implemented (“in isolation”, i.e., without considering the rest of the measures carried out in the household). The most effective measure in reducing this gap was the replacement of the refrigerator (27.22% reduction) followed closely by replacing glazing and carpentry (24.58%). Again, the two most effective measures were the least implemented (see Appendix A for the number of interventions according to the renovation measure), as they are more costly and not affordable for all NGOs. As a reference, the average cost of the micro-efficiency kit delivered by the Red Cross under the FSRE in 2023 [20] was approximately EUR 50, much lower than the average investment in shallow renovation measures and boiler/appliance replacements analyzed in [11], about EUR 810.
If we compare these results with those of [11], we see that they are very similar. The previous study indicated that the most effective measures in reducing the gap were firstly the replacement of glazing and carpentry (45%), followed by the replacement of heating or DHW systems (a measure not implemented in our study) and the replacement of household appliances (22%). Therefore, we can conclude that our results are consistent with the previous ones. Moreover, given the larger numerical and geographical (climatic) extension of the sample treated in this year’s study, the conclusions significantly broaden their geographical horizon.

3.2.3. Study of Hidden Energy Poverty According to Province

Significant differences exist in the reduction in the energy poverty gap depending on the province of residence. However, it should be borne in mind that the number of interventions analyzed in each province varies greatly from one province to another (see Appendix A for the distribution of households by province of residence), and, therefore, most provincial values are not statistically representative of vulnerable households benefiting from the Solidarity Fund. In particular, only the samples in Alicante, Valencia, and Ceuta represent this household profile in the corresponding provinces.
The province where households have reduced their gap the most is Tarragona (55% reduction), followed by the Balearic Islands (40%) and Ceuta (34%). The justification for the atypical result in the first of these provinces was discussed above in Section 3.1.2, while the favorable winter weather in the other two provinces leads to a lower initial gap and a more significant impact of the micro-efficiency measures in the relative reduction in the gap. The other two provinces with significant samples in this study (Alicante and Valencia) saw their gap reduced by 11.43% and 17.56%, respectively. On the other hand, in Figure 11, the outstanding value of the gap in Madrid, which is much higher than in the other provinces, is striking, suggesting that the hidden energy poverty situation of households benefiting from the FSRE in this area is worse, also influenced by the severe weather in this province in both the summer and winter.
Eventually, it can be concluded that there is a significant and positive impact on the energy poverty gap in all provinces, with the province of Alicante having the lowest average gap reduction (11.43%). This value is partially justified because in this province, only micro-efficiency measures were carried out, and households started from the second-worst gap value. It should be noted that this result significantly conditions the average reduction of the entire sample (14.51%), as households in Alicante are the majority group in the sample (Figure 11).

4. Conclusions and Recommendations

This paper analyses the impact of shallow renovations in Spanish vulnerable households carried out within the Solidarity Fund for Energy Refurbishment (FSRE).
The average theoretical energy savings per household due to energy refurbishment measures was 6.24%. Thanks to this, the theoretical energy expenditure has gone from an average of EUR 1873/year to an average of EUR 1758/year. The provinces that benefited the most are Ceuta, with an average reduction in theoretical expenditure of 9.89%, followed by Madrid, with a saving of 8.41%. On the other hand, the province with the lowest average savings was Alicante (5.3%). Finally, our results do not show a significant and univocal correlation between the reduction in theoretical expenditure and the province’s climate. However, the study by province is valuable because it provides disaggregated results at the local level, potentially useful for scholars, policymakers, Social Services, and NGOs working in these provinces.
On the other hand, the study highlights that the theoretical savings are more associated with the type of intervention. The most effective measures (individually) in terms of theoretical expenditure reduction were the replacement of glazing and joinery (average savings of 6.58%) and the replacement of refrigerators (4.57%). However, if the impact of all measures is considered, households that received thermocovers had the highest total savings (although, individually, this measure has the lowest savings) because two or three additional micro-efficiency measures were implemented. Therefore, the results of such measures should not be underestimated, as they are not only less costly but also very effective when taken together. In particular, the two measures of this type with the greatest individual impact are weather stripping (3.2% savings) and strips (2.7%), which are highly recommended for a micro-efficiency kit.
On the other hand, the energy poverty gap was reduced on average by 14.51%, from EUR 554/year to EUR 483/year. It can be inferred from the study that the reason why it is not possible to escape from energy poverty in most cases is not the lack of effectiveness of the measures in reducing the gap, but the fact that many of the families are in severe hidden energy poverty (actual energy expenditure of less than a quarter of the theoretical expenditure) and, therefore, start from situations of greater vulnerability. Before the reform, 71.67% of households were in hidden energy poverty, and after the reform, 68.33%. With regard to severe hidden energy poverty, the percentage has fallen from 29.61% to 26.82%. In short, the HEP indicator decreased by 4.65% compared to the 9.4% reduction in severe hidden energy poverty. This reflects a very severe initial vulnerability situation, which indicates that it is very likely that more in-depth measures than micro-efficiency measures will be needed to bring these households out of their hidden energy poverty situation. Moreover, the recent energy crisis increased the electricity and natural prices, thus inducing vulnerable people to consume less for fear of the bill. In other words, more medium to long-term structural measures or at least more far-reaching shallow renovation measures are needed (e.g., wall insulation). In fact, only one of the analyzed households has improved its wall insulation (thus considered as an atypical case excluded from the general energy poverty analysis), registering an improvement in (subjective) comfort both in the winter and summer. Along the same lines, and more generally, in households where measures beyond those of micro-efficiency were applied, the ability to maintain an adequate temperature in both seasons was improved.
The province that has reduced its energy poverty gap the most is Tarragona (55% reduction, with only one household in the sample from Tarragona, which replaced its windows), followed by the Balearic Islands (40%) and Ceuta (34%). As for the most effective measures in reducing the gap (individually), the replacement of the refrigerator stands out (27.22% reduction), closely followed by the replacement of glass and carpentry (24.58%). Again, the two most effective measures were the least implemented, as they are more costly (they are not micro-efficiency measures and are not affordable for all NGOs).
The results of this report suggest several recommendations for future work:
Expanding the energy poverty analysis, for example, by improving the scope of the analysis of the inadequate temperature indicator or applying the disproportionate expenditure indicator based on the Minimum Income Standard [18,19,20], which has proven to be more effective in identifying disproportionate expenditure situations compared to other relative indicators, such as 2M and 10% [20];
Changes in other parameters, which, although not considered official for measuring energy poverty, are key to measuring the well-being of households, such as the presence of dampness, the use and condition of electrical appliances, air infiltration, etc.;
Investigate the impact of micro-efficiency measures not included in the study on theoretical energy expenditure.
Finally, this study also shows how more and more non-profit organizations are getting involved in such energy retrofit programs. However, there is still a long way to go to scale up these programs at the national level and substantially contribute to meeting the targets set by the 2019–2024 Spanish National Strategy Against Energy Poverty (ENPE). In this sense, the paper’s results allow us to make some recommendations for the new ENPE 2025, with a view to the implementation and greater effectiveness and scalability of shallow renovation measures.
  • Prioritize measures with greater structural impact:
    Insulation of walls, replacement of windows, and replacement of appliances. These measures have proven highly effective in reducing theoretical energy costs, reducing the energy poverty gap and/or improving comfort.
    Combination of micro-efficiency measures. Lower cost measures can be very effective in combination. Strategies to maximize their joint implementation should be promoted.
  • Improve monitoring and evaluation:
    Pre- and post-retrofit data collection. Implement mechanisms, such as monitoring questionnaires, to obtain data on actual energy expenditure and comfort of households after retrofitting.
    Optimization of analysis tools: Advance the development of tools, such as ENERSOC, to automatically calculate changes in notional expenditure after reforms, specifying the measures implemented.
  • Scaling up interventions at the national level:
    Increase collaboration with non-profit organizations. Encourage more NGOs and social entities to participate in energy refurbishment programs, promoting their outreach and sustainability.
    Advocate for increased financing policies. Promote public financing programs that support structural reforms needed to improve efficiency and reduce energy poverty.
It is important to acknowledge that the results of this study are not representative of the entire Spanish population, nor of all energy-poor households in the country. The analysis is based on a limited sample of highly vulnerable households assisted by the Energy Rehabilitation Solidarity Fund (FSRE), many of whom face severe hidden energy poverty and complex structural challenges. As such, the findings should not be generalized beyond similar contexts. Nevertheless, the study offers valuable insights for the design of targeted energy poverty policies, especially those aimed at the most vulnerable groups. These populations often require ad-hoc approaches that address specific needs beyond standardized interventions. Eventually, the lessons drawn from this targeted analysis can inform more effective and equitable strategies in future energy renovation programs.

Author Contributions

Conceptualization, R.B. and J.C.R.; methodology, R.B.; software, R.B. and J.C.R.; validation, R.B. and J.C.R.; formal analysis, R.B. and J.C.R.; investigation, R.B. and J.C.R.; resources, R.B. and J.C.R.; data curation, R.B. and J.C.R.; writing—original draft preparation, R.B.; writing—review and editing, R.B. and J.C.R.; visualization, R.B.; supervision, R.B. and J.C.R. All authors have read and agreed to the published version of the manuscript.

Funding

This work was funded by Fundación Naturgy (Naturgy Foundation) within the VAREX-2024 project.

Data Availability Statement

Data will be provided by the corresponding authors upon reasonable request.

Acknowledgments

The authors are especially grateful to all the people who collaborated in VAREX-2024 project, in particular to Fundación Naturgy (Naturgy Foundation) and the following Third Sector organizations and local public administrations: Spanish Red Cross, Fundació Domus Misericordiæ Sant Josep (FDMSJ), Fundación Abulense para el Empleo (Fundabem), Fundación Roure, Foment de l’habitatge social, and Mancomunitat Intermunicipal Voluntària La Plana.

Conflicts of Interest

The authors declare no conflict of interest.

Abbreviations

DHWDomestic Hot Water
CNMCComisión Nacional de los Mercados y la Competencia (National Markets and Competition Commission).
CRESpanish Red Cross
EESEngineering Equation Solver
ENPENational Strategy against Energy Poverty
HBSHousehold Budget Survey
FSREEnergy Rehabilitation Solidarity Fund of the Naturgy Foundation
GELTTheoretical electricity consumption (lighting + electrical appliances + kitchen)
GET Theoretical Energy Expenditure (GTT + GELT)
GRReal Energy Expenditure
GTTTheoretical Heat Expenditure (heating, DHW, and cooling)
HEP Hidden Energy Poverty Indicator
IDAEInstitute for Energy Diversification and Saving (Instituto para la Diversificación y el Ahorro de la Energía)
IITThe Comillas Institute for Research in Technology-ICAI
INEInstituto Nacional de Estadística (National Statistics Institute)
MITECOMinistry for Ecological Transition and Demographic Challenge
VAREXEvaluation of Express Rehabilitations Project

Appendix A

Table A1. Breakdown of Spanish households by province according to the type of energy supply used for heating and DHW in blocks of flats (Population and Housing Censuses 2011).
ProvincePetroleum ProductsBiomassCoalGasElectricity
Balears, Illes15.52%0.00%0.00
%
64.20
%
20.28%
Ávila56.58%0.01%0.12
%
35.01
%
8.28%
Valladolid49.20%0.00%0.11
%
42.31
%
8.38%
Barcelona14.26%0.01%0.00
%
65.19
%
20.54%
Tarragona17.82%0.01%0.00
%
62.37
%
19.80%
Alicante/Alacant14.71%0.01%0.00
%
64.84
%
20.44%
Valencia/València15.84%0.01%0.00
%
63.95
%
20.21%
Coruña, A27.23%0.03%1.34
%
50.24
%
21.16%
Madrid46.94%0.00%0.11
%
44.54
%
8.41%
Murcia14.05%0.00%0.00
%
65.37
%
20.58%
Ceuta0.00%0.00%0.00
%
0.00
%
100.00%
Table A2. Breakdown of Spanish households by province according to the type of energy supply used for heating and DHW in single-family dwellings (Population and Housing Censuses 2011).
ProvincePetroleum ProductsBiomassCoalGasElectricity
Balears, Illes41.18%17.87%34.40
%
0.00
%
6.55%
Ávila56.12%15.37%24.48
%
0.05
%
3.97%
Valladolid54.82%18.95%22.04
%
0.05
%
4.13%
Barcelona43.05%17.12%33.64
%
0.00
%
6.19%
Tarragona45.39%16.18%32.69
%
0.00
%
5.74%
Alicante/Alacant41.27%17.83%34.36
%
0.00
%
6.53%
Valencia/València43.41%16.97%33.49
%
0.00
%
6.12%
Coruña, A62.66%8.80%21.69
%
1.81
%
5.04%
Madrid51.00%29.45%14.91
%
0.04
%
4.60%
Murcia36.05%19.94%36.48
%
0.00
%
7.53%
Ceuta49.20%17.03%28.15
%
0.23
%
5.39%
Table A3. Breakdown of Spanish households by province according to the type of main heating and DHW system in blocks of flats (Population and Housing Census 2011).
ProvinceCentralIndividualApparatus
Balears, Illes5.87%34.25%59.87%
Ávila12.69%71.96%15.34%
Valladolid19.13%74.76%6.11%
Barcelona6.65%66.67%26.69%
Tarragona8.49%57.77%33.74%
Alicante/Alacant6.19%29.27%64.54%
Valencia/València4.45%32.85%62.70%
Coruña, A10.67%59.34%29.99%
Madrid21.09%68.67%10.23%
Murcia6.64%28.64%64.73%
Ceuta1.62%9.52%88.87%
Table A4. Distribution of Spanish households by province according to the type of main heating and DHW system in single-family dwellings (Population and Housing Censuses 2011).
ProvinceCentralIndividualApparatus
Balears, Illes0.00%36.39%63.61%
Ávila0.00%82.42%17.58%
Valladolid0.00%92.45%7.55%
Barcelona0.00%71.41%28.59%
Tarragona0.00%63.13%36.87%
Alicante/Alacant0.00%31.20%68.80%
Valencia/València0.00%34.38%65.62%
Coruña, A0.00%66.43%33.57%
Madrid0.00%87.03%12.97%
Murcia0.00%30.67%69.33%
Ceuta0.00%9.67%90.33%
The natural gas and electricity prices that are manually modified in the DIAGNOSTICO tool are those shown in Figure A1 (respectively, Row 5 and Row 6 of the table on the left and the table on the right).
Figure A1. Lookup tables where energy carrier prices are changed in the DIAGNOSTICO tool (Source: CNMC—regulated and free market).
Sustainability 17 05585 g0a1
In VAREX-2022, the theoretical savings percentages referred to savings in theoretical energy demand or consumption. However, in this VAREX-2024 report, as we do not have consumption data for most households (Red Cross sample), the savings have been applied directly to the theoretical expenditure. This approximation is valid due to the fact that in 2022 and in the first quarter of 2023 (dominant periods in the VAREX-2024 data collection) the price of energy was very high and, therefore, most of the bill expenditure is proportional to consumption. In other words, consumption and expenditure in these cases are proportional, a fact that equates the application of savings to either.
In order to correctly apply this adaptation of the VAREX-2022 methodology, we first calculated the percentage that each expenditure represents of the total theoretical energy expenditure according to the province. In order to be able to estimate the percentage of savings on the total theoretical expenditure (Theoretical cost of heating, DHW, and cooling; Theoretical electricity consumption (lighting + electrical appliances + kitchen); Total Theoretical Expenditure (GTT+ GELT).
Table A5. Percentage share of each expenditure in the total theoretical energy expenditure according to province (own elaboration from [19]).
ProvinceHeating (Over GTT)ACS (on GTT)GTTLighting (on GELT)GEL TGET
Balearic
Islands
62.00%13.79%61.45
%
9.33%38.55
%
100
%
Valladolid85.56%6.76%69.52
%
9.33%30.48
%
100
%
Barcelona81.83%8.55%65.12
%
9.33%34.88
%
100
%
Tarragona68.07%8.64%60.68
%
9.33%39.32
%
100
%
Alicante58.18%11.62%61.26
%
9.33%38.74
%
100
%
Valencia64.95%12.24%61.60
%
9.33%38.40
%
100
%
A Coruña89.60%10.40%62.39
%
9.33%37.61
%
100
%
Madrid76.75%7.76%67.13
%
9.33%32.87
%
100
%
Murcia62.62%17.36%56.21
%
9.33%43.79
%
100
%
Ceuta74.08%9.38%66.60
%
9.33%33.40%
100
%
Avila92.57%6.84%67.08
%
9.33%32.92
%
100
%
Theoretical cost of heating, DHW, and cooling; Theoretical electricity consumption (lighting + electrical appliances + kitchen); Total Theoretical Expenditure (GTT + GELT).
Table A6. Percentages of savings on total theoretical expenditure according to province and measure applied.
ProvinceLED
Savings
Saving Thermocover (Single Glazing)Saving Thermocover (Double Glazing)Saving Power StripsSaving on Weather StrippingSavings on Washing Machine ReplacementSaving Refrigerator ReplacementSaving Glass and Carpentry
Balearic
Islands
1.74
%
1.28%0.59%2.70
%
3.05%2.31%5.78%4.95%
Valladolid1.26
%
2.27%1.05%1.95
%
2.97%1.67%4.18%6.54%
Barcelona1.38
%
1.99%0.92%2.13
%
4.26%1.83%4.57%6.93%
Tarragona1.58
%
1.79%0.83%2.44
%
3.30%2.09%5.23%5.37%
Alicante1.78
%
1.38%0.64%2.75
%
2.85%2.36%5.90%4.63%
Valencia1.75
%
1.19%0.55%2.71
%
3.20%2.32%5.81%5.20%
ACoruña1.74
%
1.34%0.62%2.69
%
3.91%2.30%5.76%7.27%
Madrid1.70
%
1.87%0.87%2.63
%
2.58%2.26%5.64%5.67%
Murcia1.49
%
1.73%0.80%2.30
%
2.82%1.97%4.93%4.58%
Ceuta1.98
%
1.18%0.55%3.07
%
4.93%2.63%6.57%6.41%
Avila1.51
%
1.65%0.76%2.34
%
3.10%2.00%5.01%6.83%
Regarding the savings from weather stripping, glazing, and joinery replacement and wall insulation, in this study, we have data from more provinces than those included in the shallow renovation book (four cities, whose population allows approximation with the whole province) [13]. For the application of the book’s savings to the VAREX-2024 sample, we have classified the eight additional provinces within one of the previous four according to their climatic similarities. We will, therefore, consider that Alicante, Murcia, Balearic Islands, Tarragona, and Valencia will have a similar climate to Barcelona; Ceuta similar to Seville; and Avila and Valladolid similar to Madrid. They show, respectively, the savings from weather stripping and from the replacement of glazing and joinery in the four reference provinces. For wall insulation in the case of Taradell, the savings of its province, Barcelona, are applied.
Table A7. Reduction in required heating demand due to the use of weather stripping depending on the province [13].
ProvinceSavings in Heating Demand
Barcelona8%
A Coruña7%
Madrid5%
Seville10%
Table A8. Reduction in required heating demand due to replacement of glazing and joinery, depending on the province [11].
ProvinceSavings in Heating Demand
Barcelona8%
A Coruña7%
Madrid5%
Seville10%
For the reader who wants to apply the savings of the Theoretical cost of heating, DHW, and cooling; Theoretical electricity consumption (lighting + electrical appliances + kitchen); Total Theoretical Expenditure (GTT+ GELT).
To some representative cases, the shows the average Total Theoretical Energy Expenditure (TEE) per province in 2022: sum of TEE (theoretical expenditure on heating, DHW, and cooling) and TEEE (theoretical expenditure on lighting, appliances, and cooking). It refers to an average household (three people and between 80 and 100 m2 on average).
Table A9. Average total theoretical energy expenditure per province in 2022 [19].
ProvinceGET
Balearic IslandsEUR 2764.11
ValladolidEUR 3495.94
BarcelonaEUR 3055.17
TarragonaEUR 2710.16
AlicanteEUR 2750.71
ValenciaEUR 2775.15
A CoruñaEUR 2833.15
MadridEUR 3241.70
MurciaEUR 2433.42
CeutaEUR 3190.32
AvilaEUR 3237.07
Figure A2. Distribution of households according to the province of residence in the energy poverty survey (own elaboration).
Sustainability 17 05585 g0a2
Figure A3. Number of interventions in the energy poverty study (own elaboration).
Sustainability 17 05585 g0a3

References

  1. MITECO. Estrategia Nacional Contra La Pobreza Energética 2019–2024; MITECO: Madrid, Spain, 2021. [Google Scholar]
  2. Carfora, A.; Scandurra, G.; Thomas, A. Forecasting the COVID-19 Effects on Energy Poverty Across EU Member States. Energy Policy 2021, 161, 135907. [Google Scholar] [CrossRef] [PubMed]
  3. Menyhert, B. The Effect of Rising Energy and Consumer Prices on Household Finances, Poverty and Social Exclusion in the EU; European Commission, Joint Research Centre (JRC): Luxembourg, 2023. [Google Scholar]
  4. Barrella, R.; Mora Rosado, S.; Romero, J.C. The 2022 Energy and Inflationary Crises: Data, Experiences and Opinions of Spanish Energy Vulnerable Households. Energy Res. Soc. Sci. 2025, 121, 103961. [Google Scholar] [CrossRef]
  5. Desvallées, L. Low-Carbon Retrofits in Social Housing: Energy Efficiency, Multidimensional Energy Poverty, and Domestic Comfort Strategies in Southern Europe. Energy Res. Soc. Sci. 2022, 85, 102413. [Google Scholar] [CrossRef]
  6. Dokupilová, D.; Stojilovska, A.; Palma, P.; Gouveia, J.P.; Paschalidou, E.G.; Barrella, R.; Feenstra, M.; Horta, A.; Sánchez-Guevara, C.; Kádár, J.; et al. Exploring Energy Poverty in Urban and Rural Contexts in the Era of Climate Change: A Comparative Analysis of European Countries and Israel. Energies 2024, 17, 2939. [Google Scholar] [CrossRef]
  7. Barrella, R.; Palma, P.; Gouveia, J.P.; Romero, J.C.; Arenas, E.; Linares, J.I. Toward an Integrated Policy Framework to Address Energy Poverty in the Iberian Peninsula: An Exploratory Analysis. Heliyon 2025, 11, e43414. [Google Scholar] [CrossRef]
  8. Lima, F.; Ferreira, P.; Leal, V. The Role of Energy Affordability in the Relationship between Poor Housing and Health Status. Sustainability 2022, 14, 14435. [Google Scholar] [CrossRef]
  9. Sánchez-Guevara Sánchez, C.; Mavrogianni, A.; Neila González, F.J. On the Minimal Thermal Habitability Conditions in Low Income Dwellings in Spain for a New Definition of Fuel Poverty. Build. Environ. 2017, 114, 344–356. [Google Scholar] [CrossRef]
  10. De Luxán García De Diego, M.; Sánchez-Guevara Sánchez, C.; Román López, E.; del Mar Barbero Barrera, M.; Gómez Muñoz, G. Re-Habilitación Exprés Para Hogares Vulnerables. Soluciones de Bajo Coste; Fundación Naturgy: Madrid, Spain, 2017. [Google Scholar]
  11. De Luxán García De Diego, M.; Sánchez-Guevara Sánchez, C.; Román López, E.; del Mar Barbero Barrera, M.; Gómez Muñoz, G. Re-Habilitación Exprés Para Hogares Vulnerables. Soluciones de Bajo Coste (Actualización Mayo 2022); Fundación Naturgy: Madrid, Spain, 2022. [Google Scholar]
  12. Luján Torres, C.; Moliner Galbis, J.; Rodríguez Hernández, J.C.; Vilariño Feltrer, G. Impacto de Las Rehabilitacioes Expres Sobre La Pobreza Energética En Valencia; Universitat Politècnica de València: Valencia, Spain, 2022. [Google Scholar]
  13. Martín-Consuegra, F.; de Frutos, F.; Oteiza, I.; Alonso, C.; Frutos, B. Minimal Monitoring of Improvements in Energy Performance after Envelope Renovation in Subsidized Single Family Housing in Madrid. Sustainability 2021, 13, 235. [Google Scholar] [CrossRef]
  14. Bienvenido-Huertas, D.; Berti, K.; Delgado-Gutierrez, E.; Sánchez-García, D.; Marín-García, D. Analysing the Effectiveness of the Energy Conservation Measures to Reduce Energy Poverty Cases in the Southern Regions of Spain. In Energy Poverty Alleviation; Springer: Cham, Switzerland, 2022; pp. 225–238. [Google Scholar]
  15. Instituto para la Diversificación y Ahorro de la Energía (IDAE) Proyecto SECH-SPAHOUSEC. Análisis Del Consumo Energético Del Sector Residencial En España. Informe Final; IDAE: Madrid, Spain, 2011. [Google Scholar]
  16. ECODES; Cruz Roja Española. Análisis Del Impacto Proyectos De Lucha Contra La Pobreza Energética; ECODES: Zaragoza, Spain, 2023. [Google Scholar]
  17. Bernabéu Villena, J. Análisis Prospectivo de La Demanda Energética Residencial e Implementación de Medidas de Adaptación Al Riesgo de Shock de Precios. Master’s Thesis, Universidad Pontificia Comillas, Madrid, Spain, 2023. [Google Scholar]
  18. Cruz Roja Española; Fundación Naturgy. Informe Final de Actividad; Cruz Roja Española: Madrid, Spain, 2023. [Google Scholar]
  19. Bradshaw, J.; Middleton, S.; Davies, A.; Oldfield, N.; Smith, N.; Linda, C.; Williams, J. A Minimum Income Standard for the UK; Joseph Rowntree Foundation: York, UK, 2008; Volume 64. [Google Scholar]
  20. Romero, J.C.; Linares, P.; López, X. The Policy Implications of Energy Poverty Indicators. Energy Policy 2018, 115, 98–108. [Google Scholar] [CrossRef]
Figure 1. Flowchart of the paper methodology (own elaboration).
Sustainability 17 05585 g001
Figure 2. Number of interventions according to the energy rehabilitation measure implemented (own elaboration).
Sustainability 17 05585 g002
Figure 3. Average theoretical expenditure before and after retrofitting according to the type of measure implemented, considered in isolation, in the Real case (own elaboration).
Sustainability 17 05585 g003
Figure 4. Average theoretical expenditure before and after retrofitting according to the type of measure implemented, considered in isolation, in the Counterfactual case (excluding the impact of the change in energy prices) (own elaboration).
Sustainability 17 05585 g004
Figure 5. Average theoretical expenditure before and after retrofitting according to the type of measure implemented, taking into account the savings of all measures implemented in the household (own elaboration).
Sustainability 17 05585 g005
Figure 6. Distribution of survey households by province of residence (own elaboration).
Sustainability 17 05585 g006
Figure 7. Average theoretical expenditure before and after rehabilitation according to province of residence (own elaboration).
Sustainability 17 05585 g007
Figure 8. Average theoretical expenditure before and after rehabilitation by province of residence—ENERSOC data (Red Cross).
Sustainability 17 05585 g008
Figure 9. Average theoretical expenditure before and after rehabilitation according to province of residence which replaces appliances or implemented passive measures (own elaboration).
Sustainability 17 05585 g009
Figure 10. Hidden energy poverty gap before and after retrofitting and relative reduction (%) according to the measure implemented (own elaboration).
Sustainability 17 05585 g010
Figure 11. Energy poverty gap before and after retrofitting and relative reduction (%) according to the province of residence (own elaboration).
Sustainability 17 05585 g011
Table 1. Number of households with before and after bills by NGO.
NGONo. of Households with Electricity BillsNo. of Households with Natural Gas Bills
Fundabem (Ávila)20
Roure Foundation (Barcelona and Tarragona)51
Domus Misericordie Sant Josep Foundation (Barcelona)31
Fundació Foment de l’habitatge Social (Barcelona)11
MANCOMUNITAT LA
PLANA (Taradell)
11
Table 2. Comparison of the average savings of the measures calculated in the Real case and in the Counterfactual case (excluding the impact of energy price changes).
MeasureSavings—Real CaseSavings—Counterfactual Case
LED1.75%1.75%
Thermocover1.33%1.33%
Power strips2.71%2.71%
Weather stripping3.20%3.20%
Washing machine replacement1.83%4.15%
Refrigerator replacement4.57%4.79%
Windows (glass and carpentry)6.58%7.51%
Wall insulation21.32%30.11%
Table 3. Comparison of the average savings generated by each micro-efficiency measure considered in isolation with the savings calculated taking into account all measures implemented in the household (joint).
Measurement GroupIsolated MeasureJoint Measures
LED1.75%6.70%
Thermocover1.33%8.14%
Power strips2.71%6.59%
Weather stripping3.20%7.41%
Disclaimer/Publisher’s Note: The statements, opinions and data contained in all publications are solely those of the individual author(s) and contributor(s) and not of MDPI and/or the editor(s). MDPI and/or the editor(s) disclaim responsibility for any injury to people or property resulting from any ideas, methods, instructions or products referred to in the content.

