1. Introduction
Climate change and environmental degradation represent some of the most pressing global challenges of the 21st century. As the concentration of greenhouse gases (GHG) in the atmosphere continues to rise, the urgency for coordinated policy action has never been greater. According to the Intergovernmental Panel on Climate Change (IPCC), anthropogenic emissions, driven largely by economic activities, are responsible for the observed warming of the planet over the past century [
1]. While considerable attention has been devoted to the formal economy’s role in contributing to environmental degradation, a less explored dimension is the potential impact of the informal or shadow economy on environmental outcomes. The shadow economy represents the market-based production of goods and services, whether legal or illegal, that escapes detection in the official GDP. It includes a wide range of unregistered economic activities, such as undeclared work, informal self-employment, unreported compensation for work, and unreported income from small businesses, collectively referred to as “dark economic activities”. Understanding the relationship between the shadow economy and climate change is critically important for both environmental policy and economic governance, as informal economic activities often operate outside the scope of regulatory and environmental standards. The lack of accountability in the shadow economy may exacerbate environmental degradation, increasing vulnerability to climate-related natural disasters. At the same time, the prevalence of informal economic activity can undermine public revenues, limiting the state’s capacity to invest in climate resilience and green technologies. By empirically examining these linkages, this study clarifies how the shadow economy may inhibit efforts to achieve climate goals, addressing economic and institutional aspects derived from environment, and offering insights into the design of effective environmental and fiscal policies.
The global economy operates within the confines of formal regulatory frameworks and in the shadow of unreported and unregulated economic activities. The shadow economy, also known as the informal economy or the underground economy, encompasses a wide range of transactions and enterprises that evade official monitoring, taxation, and regulation. While the shadow economy has long been recognised as a significant component of many national economies, its implications for environmental sustainability have received comparatively less attention. By shedding light on this often-overlooked aspect of economic development, this research contributes to a better understanding of the interplay between informal economic practices and environmental sustainability. However, recent studies [
2,
3,
4] have begun to highlight the potentially detrimental effects of informal economic practices on the environment, raising concerns about the long-term viability of current development trajectories. The influence of the shadow economy on the environment stems from its unique characteristics and operating mechanisms. By operating out of the regulatory frameworks, informal economic activities often disregard environmental regulations and standards, leading to increased pollution, resource depletion, and ecosystem degradation. Moreover, the reliance on inefficient technologies and practices within the shadow economy exacerbates environmental pressures, contributing to climate change, biodiversity loss, and ecosystem degradation.
Despite the growing recognition of the shadow economy’s environmental implications, empirical research on this topic remains limited and fragmented. Existing studies [
5,
6,
7] have highlighted the complex interactions between informal economic activities and environmental outcomes, with varying results depending on the context and methodological approaches employed (e.g., threshold regression analysis, generalised ordinary least squares, system GMM). Thus, there is a critical need for a comprehensive and systematic analysis of the influence of the informal economy on the environment, integrating insights from economics, environmental science, and policy studies. This paper seeks to address this gap in literature by thoroughly examining the relationship between the shadow economy and the environment. Drawing on theoretical frameworks and empirical evidence, this study aims to elucidate how informal economic practices affect environmental sustainability, including their impacts on pollution levels, natural resource use, and ecological resilience. Furthermore, this research will explore the potential policy interventions and regulatory measures to mitigate the negative environmental externalities associated with the shadow economy and promote a more sustainable and inclusive development pathway.
By advancing our understanding of the interplay between informal economic activities and environmental sustainability, this study seeks to inform policymakers, practitioners, and researchers about the importance of addressing the shadow economy’s environmental impacts in the pursuit of global sustainability goals. This study addresses a significant gap in the literature by systematically examining the relationship between the shadow economy and key environmental indicators across EU member states over a ten-year period (2012–2021). Specifically, it investigates the impact of the shadow economy on CO2 emissions, overall GHG emissions, and the frequency of climate-related natural disasters, while controlling for other relevant factors such as environmental taxation, GDP per capita, and employment in environmental sectors. Accordingly, the general research question of our study would be the following: How does the shadow economy influence environmental sustainability, and what role do institutional and economic factors play in moderating this relationship? Based on the literature review and the indicators employed in our empirical analysis, we will later set up specific research questions referring to environmental sustainability and economic and institutional factors. By focusing on the EU context, this study benefits from relatively comparable institutional frameworks while leveraging the heterogeneity among member states in terms of both shadow economy size and environmental performance.
The novelty and originality of this research lie in three main contributions. First, it extends the empirical literature by integrating the shadow economy as a primary explanatory variable in environmental models, rather than referring to it as a peripheral control factor. Second, it employs advanced econometric techniques, including robust panel estimations and machine learning-based Elastic Net regularisation, to address multicollinearity, non-normality, and outlier sensitivity inherent in cross-country panel datasets. Third, by simultaneously considering emissions and climate disasters as dependent variables, the analysis captures not only the emission pathways but also the broader climate vulnerability associated with informal economic activities. Furthermore, this study contributes to policy discussions by highlighting the importance of considering the informal sector in the design and implementation of environmental regulations. Traditional environmental policies, which predominantly target the formal economy, may have limited effectiveness if substantial economic activity remains outside formal oversight. Recognising the environmental dimensions of informality could thus inform more inclusive and effective strategies for achieving the EU’s climate and environmental goals.
Further on, our study acknowledges the environmental implications of the shadow economy, highlighting its tendency to bypass the regulatory frameworks and cross environmental standards. Informal economic activities may significantly contribute to environmental degradation through pollution and inefficient resource use. Our research will refer to the moderating role of governance, economic development, and environmental fiscal instruments, to overcome the limitations of the previous studies, focusing on isolated aspects of informality or single environmental outcomes.
The remainder of the paper is structured as follows.
Section 2 provides a detailed review of the relevant literature, identifying key theoretical and empirical insights on the relationship between economic activities and environmental outcomes.
Section 3 describes the data, variables, and econometric methodology employed in the analysis.
Section 4 presents and discusses empirical results, while
Section 5 concludes with a synthesis of findings, policy implications, and suggestions for future research.
3. Data and Methodology
This study utilises a balanced panel dataset comprising annual observations for the 27 member states of the European Union, from 2012 until 2021. The dataset integrates multiple economic, environmental, and institutional variables that capture both formal and informal dimensions of economic activity and their environmental consequences, as presented in
Table 1. The panel structure allows for the exploitation of both cross-sectional and time-series variation, enhancing the robustness of the estimations and enabling the identification of country-specific dynamics in environmental performance.
The dependent variables include three key indicators of environmental outcomes: CO
2 emissions per capita (CO
2), greenhouse gas emissions (GHG), and the annual number of climate-related natural disasters (DISASTERS). The core explanatory variable is the shadow economy (SHADEC), expressed as a percentage of GDP, reflecting the extent of informal economic activities. This variable is estimated by Schneider [
32], who applied the Multiple Indicators Multiple Causes (MIMIC) approach. Additional control variables include environmental tax revenue (ENVTAX), GDP per capita (LNGDP), and employment in the environmental goods and services sector (LNEMP). Variables are transformed into natural logarithms where appropriate to ensure the linearity and interpretability of regression coefficients.
Data for environmental outcomes are drawn from reputable international databases such as Our World in Data, the World Bank’s World Development Indicators (WDI), the IMF Climate Data Hub, and Eurostat [
33,
34,
35,
36,
37]. This integrated dataset allows for a comprehensive analysis of the environmental implications of informal economic activity across diverse EU institutional contexts and economic structures. Including control variables such as green employment and fiscal measures ensures that the estimated relationships capture the net effect of the shadow economy on environmental indicators.
To ensure the robustness and relevance of our econometric approach, the selection of variables included in the empirical model is grounded in both theoretical underpinnings and recent empirical findings from the literature on environmental sustainability and the shadow economy. Each variable has been carefully chosen to capture essential dimensions of the relationship between informality, economic structure, and environmental outcomes.
The shadow economy (SHADEC) is the central explanatory variable in our study. It quantifies the size of informal economic activities as a percentage of GDP, as estimated by Schneider [
32] using the MIMIC approach. Its inclusion is justified by an increasing body of literature which shows that unregulated economic activity can lead to environmental degradation through mechanisms such as pollution underreporting, poor compliance with environmental standards, and illegal resource exploitation. These effects are particularly pronounced in contexts where informal activity represents a significant portion of total economic output.
The dependent variables reflect key aspects of environmental impact and climate risk. CO2 emissions per capita serve as a standard measure of energy-related pollution, while greenhouse gas emissions (GHG) provide a more comprehensive indicator, capturing the emissions of CO2 equivalents including methane and nitrous oxide. The inclusion of these variables is consistent with Environmental Kuznets Curve (EKC) frameworks, which analyse the dynamic relationship between economic development and environmental degradation. In addition, the number of climate-related natural disasters (DISASTERS) is used to capture environmental vulnerability, offering a broader perspective on the long-term physical consequences of both formal and informal economic practices.
Several control variables are also incorporated to account for institutional, economic, and structural influences on environmental outcomes. Environmental tax revenues (ENVTAX) reflect national efforts to internalise environmental externalities through fiscal instruments. While often used as a deterrent for pollution, this variable may also capture reverse causality or inefficiencies in tax enforcement, especially in economies with large informal sectors. GDP per capita (GDP) is included to account for the scale and development level of the economy, a standard determinant in both pollution and informality models. Lastly, employment in the environmental goods and services sector (EMP) functions as a proxy for structural shifts towards sustainability, indicating the extent to which economies are transitioning to greener industries.
Having established a comprehensive dataset encompassing environmental, economic, and institutional indicators across the 27 EU member states over a ten-year period, the next step involves selecting an appropriate methodological framework to empirically assess the relationship between the shadow economy and environmental degradation. Given the panel nature of the data and potential econometric issues such as multicollinearity, heteroskedasticity, and outliers, the methodological approach must ensure both the robustness and reliability of the results. The following section outlines the econometric strategies employed in this study. The methodology integrates descriptive analysis, stationarity testing, correlation diagnostics, classical panel estimation, and advanced machine learning techniques for robust modelling.
Initially, descriptive statistics were computed for all key variables to provide insights into their central tendency, dispersion, and distributional properties. Since several variables displayed strong skewness and kurtosis, particularly CO
2 emissions and climate-related disasters, this preliminary step was crucial for informing the subsequent choice of robust estimation methods [
38].
Next, panel unit root tests were conducted to examine the series’ stationarity properties. Specifically, the Levin-Lin-Chu (LLC) test, which assumes a standard unit root process, and the Im-Pesaran-Shin (IPS) test, which allows for heterogeneity across cross-sections, were applied [
39,
40]. The variables exhibited stationarity at level or after first differencing, justifying their inclusion in the regression models without introducing concerns of spurious relationships. While panel unit root tests were employed to assess the stationarity properties of the variables, we did not perform cointegration analysis or estimate long-run equilibrium models. This decision was based on the nature of the econometric techniques employed in our study. Specifically, both the fixed-effects OLS models and Elastic Net regularisation rely on short-run associations and cross-sectional variation and are not designed to capture long-run cointegrating relationships. Moreover, Elastic Net regression operates under the assumption of variable sparsity and robustness to multicollinearity, rather than long-run dynamics. As such, our primary goal was to ensure that the series do not exhibit non-stationary behaviour that might invalidate standard regression inferences. Since most variables were stationary at level or after differencing, we proceeded with the estimation without integrating cointegration tests. However, future research could extend our framework by adopting panel cointegration techniques such as Pedroni or Westerlund tests and applying fully modified OLS (FMOLS) or dynamic OLS (DOLS) estimators to explore long-run relationships.
Following this, a correlation matrix was constructed to detect potential multicollinearity issues among the explanatory variables. Moderate to strong correlations were found between some variables, particularly between environmental taxes and the shadow economy, highlighting the need for caution when interpreting multivariate regression coefficients.
To address potential concerns related to reverse causality and endogeneity, we conducted Pairwise Granger Causality Tests for the main variables included in the analysis, using two lags and country-level panel data over the 2012–2021 period. The results indicate that there is no systematic or consistent evidence of bidirectional causality between the shadow economy (SHADEC) and the core environmental indicators (GHG emissions, CO
2 emissions, and climate-related disasters). Consequently, the application of more complex endogeneity correction techniques, such as instrumental variables or dynamic panel estimators (e.g., GMM), was deemed unnecessary in the present context. The Granger test results are available in the
Supplementary Materials and confirm the appropriateness of our model specification.
The core of the econometric analysis involves two complementary estimation strategies. Firstly, panel Ordinary Least Squares (OLS) models were estimated for each dependent variable (CO
2 emissions, GHG emissions, and climate-related disasters), incorporating country fixed effects to account for unobserved heterogeneity across EU member states [
41]. This method was necessary because it allows for the elimination of time-invariant, country-specific factors that could bias the estimated relationships between the shadow economy and environmental indicators. The choice of the FE model was supported by the Hausman test, which indicated that the individual effects are correlated with the explanatory variables, making random effects inappropriate. By using fixed effects, we ensure that the estimated coefficients reflect within-country variations over time, offering more robust and consistent results in the context of our panel data. These models allowed for the baseline identification of the relationship between the shadow economy and environmental indicators.
To address the problems of multicollinearity, potential outliers, and non-normal error distributions—issues suggested by the descriptive and correlation analyses—Elastic Net Regularisation was subsequently employed. Elastic Net combines the penalties of LASSO and Ridge regression, offering advantages regarding variable selection and model stability, especially when dealing with complex, noisy panel datasets [
42]. The optimal penalisation parameter (lambda) was selected based on K-fold cross-validation, minimising the mean squared error. Estimations were reported at the minimum error lambda and at +1 and +2 standard errors to check the robustness of the selected models.
Combining classical econometric techniques with penalised regression models enables a more comprehensive and reliable investigation of the shadow economy’s environmental consequences. This mixed methodology mitigates risks of model misspecification, endogeneity, and overfitting, ultimately leading to more credible empirical findings [
43].
Elastic Net regression was applied as a complementary method to traditional fixed-effects estimation, primarily due to its advantages in handling multicollinearity and high-dimensional data structures. This method combines the properties of Lasso (L1) and Ridge (L2) regularization, allowing for both coefficient shrinkage and variable selection. Given the inclusion of multiple-correlated predictors (e.g., GDP, taxes, and sectoral employment), Elastic Net improves model interpretability and stability. The penalisation parameter lambda was selected via 10-fold cross-validation, using the value that minimized the model’s mean squared error (MSE) on the validation set. This process ensures that the model is not overfitted while maintaining generalizability.
4. Results and Discussion
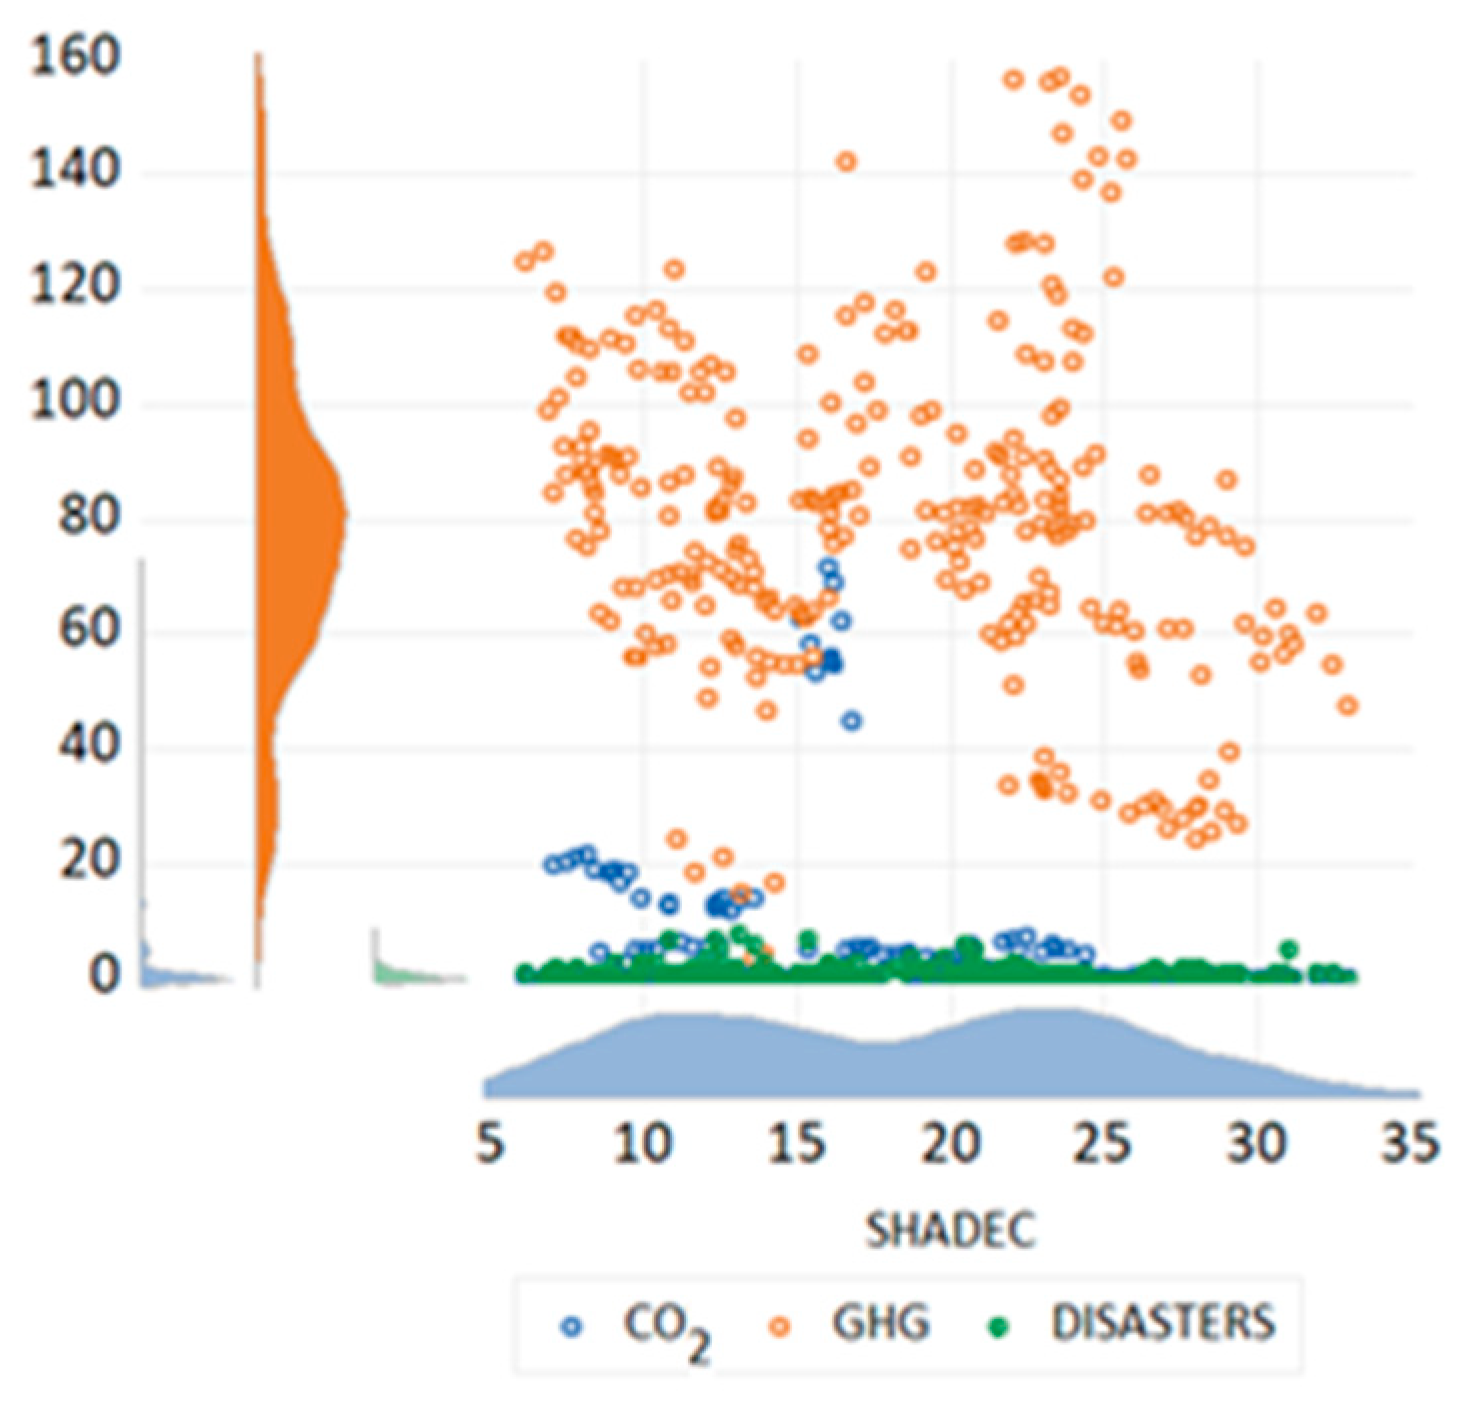
To offer an initial visual insight into the relationship between the informal economy and environmental outcomes, we begin
Section 4 with a comprehensive plot that jointly displays the distribution and dynamics of the main variables under study.
Figure 4 plots country–year observations for the shadow economy (% of GDP) on the horizontal axis against the three environmental indicators: CO
2 emissions (blue), GHG emissions (orange), and climate-related disasters (green) across all EU member states between 2012 and 2021. This multi-dimensional scatter plot, augmented with marginal density distributions, highlights key patterns and heterogeneity in the data. The figure serves as a preliminary diagnostic tool, supporting the empirical hypothesis that informality may exert opposite effects on reported emissions and environmental vulnerability: countries with higher levels of economic informality often report lower emissions, while simultaneously experiencing greater exposure to climate-related disasters.
The descriptive statistics presented in
Table 2 provide an initial overview of the main variables included in the econometric analysis. The variable representing CO
2 emissions exhibits a highly skewed distribution, with a skewness value of 4.08 and a kurtosis of 19.90, indicating the presence of significant outliers and a heavy-tailed distribution. Similarly, the variable DISASTERS, which captures the trend in climate-related natural disasters, shows a pronounced positive skewness (2.69) and leptokurtosis (11.63), suggesting that most countries experience few disasters annually, with a few extreme cases considerably influencing the mean.
The shadow economy indicator (SHADEC) displays a more moderate dispersion, with a skewness of 0.06 and kurtosis of 1.82, close to the normal distribution values. In contrast, GDP per capita (GDP) shows a right-skewed distribution (skewness 1.74) and a higher degree of kurtosis (6.66), reflecting disparities in economic development among EU member states. Employment in the environmental goods and services sector (EMP) is also highly skewed (2.47) with extreme kurtosis (8.69), indicating that while environmental employment is significant in some countries, it is virtually absent in others.
Regarding the normality assumption, the Jarque–Bera test results reveal that most variables deviate significantly from a normal distribution, with the exception of GHG emissions, which exhibit a relatively symmetric distribution and a non-significant Jarque–Bera statistic (p-value = 0.4438). The violation of normality justifies the application of robust econometric techniques in subsequent analyses to mitigate potential biases arising from non-normal distributions and the presence of outliers.
Before conducting regression analyses, it is essential to assess the stationarity of the variables used in the panel dataset. Non-stationary data may lead to spurious regression results, especially in time series or panel data spanning multiple years. To this end, two complementary panel unit root tests were employed: the Levin, Lin, and Chu (LLC) test, which assumes a common unit root process, and the Im, Pesaran, and Shin (IPS) test, which allows for individual unit root processes across cross-sections.
The results presented in
Table 3 indicate that most variables are stationary at level or become stationary after first differencing. For instance, the log-transformed CO
2 emissions (lnCO
2) variable is found to be stationary at the level according to the LLC test (statistic = −2.2447, significant at the 5% level). In contrast, the IPS test shows stationarity after differencing (IPS statistic = −4.5192, significant at the 1% level). A similar pattern is observed for lnGHG, where both tests confirm stationarity with highly significant statistics (LLC = −4.3182, IPS = −2.0019).
The DISASTERS variable, which measures the trend in climate-related natural disasters, is strongly stationary at the level according to both tests (LLC = −6.8462, IPS = −2.9059), suggesting that the frequency of such events does not exhibit a unit root over time. The shadow economy variable also demonstrates stationarity under the LLC test (statistic = −4.6280), while the IPS test confirms stationarity after first differencing.
Some control variables, such as ENVTAX and lnGDP, were initially non-stationary but became stationary upon first differencing, as indicated by significant IPS statistics. This implies the need to be cautious in interpreting models involving these variables, as differencing may be necessary to ensure valid inferences. Notably, employment in the environmental goods and services sector (lnEMP) appears borderline non-stationary, with limited statistical evidence of stationarity in the IPS test.
Table 4 displays the correlation matrix among the key variables included in the empirical analysis. Understanding the interrelationships between variables is crucial, as high correlations among independent variables may lead to multicollinearity issues, thereby distorting the estimation results.
The correlation between log-transformed greenhouse gas emissions (LNGHG) and log-transformed CO2 emissions (LNCO2) is relatively weak and statistically insignificant (correlation coefficient = 0.032, p-value = 0.6378), suggesting that although related conceptually, these two environmental indicators may capture distinct aspects of environmental degradation within the European Union. Conversely, the correlation between LNCO2 and DISASTERS is moderate and highly significant (0.397, p-value < 0.001), indicating that higher CO2 emissions are associated with an increased frequency of climate-related disasters.
The shadow economy (SHADEC) exhibits a statistically significant negative correlation with both LNCO2 (−0.384) and DISASTERS (−0.037), although the strength of the relationship with DISASTERS is weak and statistically insignificant (p-value = 0.5841). The strong negative association between SHADEC and LNCO2 suggests that a larger shadow economy may, paradoxically, correspond to lower officially recorded CO2 emissions, potentially reflecting the underreporting of polluting activities or structural economic differences.
GDP per capita (LNGDP) shows a moderate positive correlation with LNCO2 (0.234) and LNGHG (0.209), and a negligible association with DISASTERS (−0.017). Interestingly, LNGDP is strongly negatively correlated with SHADEC (−0.873), implying that countries with higher economic development tend to have smaller informal sectors, a finding consistent with economic theory.
Environmental tax revenue (ENVTAX) is negatively correlated with LNCO2 (−0.404) and LNGDP (−0.544), and positively correlated with SHADEC (0.600). These patterns suggest complex dynamics, where environmental taxation appears inversely related to carbon emissions and economic prosperity, but directly associated with the size of the shadow economy.
Finally, employment in the environmental sector (LNEMP) is positively correlated with LNCO2 (0.706) and DISASTERS (0.509), indicating that greater engagement in environmental sectors may co-occur with higher levels of emissions and climate risks, possibly due to the expansion of broader economic activities that also stimulate environmental services sectors.
The results of the panel Ordinary Least Squares (OLS) regressions are presented in
Table 5. Three separate models correspond to each dependent variable: CO
2 emissions (CO
2), greenhouse gas emissions (lnGHG), and climate-related disasters (DISASTERS). Each model provides insights into the relationship between environmental outcomes and key explanatory variables, namely the shadow economy (SHADEC), environmental tax revenues (ENVTAX), employment in the environmental sector (LNEMP), and GDP per capita (LNGDP).
In the first model, where CO2 emissions are the dependent variable, the coefficient of SHADEC is positive (0.3357) but statistically insignificant (p = 0.1830). This result suggests that variations in the size of the shadow economy are not systematically associated with changes in CO2 emissions across EU countries during the period analysed. Environmental tax revenues (ENVTAX) exhibit a negative coefficient (−0.3861) but are also statistically insignificant (p = 0.4476), indicating that environmental taxes have not had an apparent measurable effect on reducing CO2 emissions in this sample. Conversely, employment in the environmental sector (LNEMP) has a positive and statistically significant impact on CO2 emissions (coefficient = 1.6788, p = 0.0167). This counterintuitive finding may reflect that expansion in the environmental goods and services sector coincides with broader industrial and economic activities that drive emissions upward. It may also hint at the phenomenon where green employment, while beneficial, is insufficient to offset emissions generated elsewhere in the economy. GDP per capita (LNGDP) shows a positive and significant effect (coefficient = 6.1553, p = 0.0218), implying that wealthier countries tend to produce more CO2 emissions, possibly due to greater industrialisation and higher energy consumption levels.
In the second model, SHADEC demonstrates a negative and highly significant effect on GHG emissions (coefficient = −0.0303, p = 0.0038). This suggests that a larger shadow economy is associated with lower recorded GHG emissions, which could reflect underreporting emissions in informal sectors or less energy-intensive activities outside the formal economy. Environmental tax revenues (ENVTAX) have a positive and highly significant impact on GHG emissions (coefficient = 0.0959, p < 0.001). This result is somewhat paradoxical, implying that countries with higher environmental taxes also record higher emissions, possibly due to a reactive increase in tax rates following higher pollution levels (reverse causality) or the insufficiency of taxes to alter entrenched polluting behaviours. Employment in the environmental sector (LNEMP) is negative but statistically insignificant (coefficient = −0.0282, p = 0.3262), suggesting no clear relationship with GHG emissions in this model. GDP per capita (LNGDP) is positive but insignificant (coefficient = 0.0371, p = 0.7352), indicating that wealth differences are not systematically associated with differences in GHG emissions once other factors are controlled for.
The third model investigates the incidence of climate-related disasters. Here, SHADEC shows a positive and statistically significant effect (coefficient = 0.0608, p = 0.0162), suggesting that a larger shadow economy is associated with an increased frequency of climate disasters. This may imply that informal economic activities exacerbate environmental vulnerabilities due to a lack of regulation and enforcement. Environmental tax revenues (ENVTAX) present a positive but statistically insignificant coefficient (0.4365, p = 0.1020), suggesting a potential but unconfirmed relationship with disaster incidence. Employment in the environmental sector (LNEMP) is negative and highly insignificant (coefficient = −0.0167, p = 0.7423), indicating no discernible impact on the frequency of disasters. Notably, GDP per capita (LNGDP) exhibits a positive and highly significant relationship with DISASTERS (coefficient = 0.5742, p < 0.001), implying that wealthier nations may report more climate-related disasters, potentially due to better monitoring, higher reporting standards, or greater asset exposure to climate risks.
While environmental tax revenues (ENVTAX) do not exhibit statistically significant effects in the CO2 and disaster models, this result should be interpreted with caution. Our data reflect aggregate environmental tax revenues, without distinction between tax types or policy enforcement quality. Therefore, the absence of significance may not indicate inefficacy per se, but rather the heterogeneous nature of these fiscal instruments and the institutional contexts in which they are applied.
The results highlight that the shadow economy plays a complex role in environmental dynamics. It appears to lower formal emissions (GHG) but simultaneously increase climate vulnerability (DISASTERS). Economic prosperity (GDP per capita) consistently correlates with higher emissions and greater exposure to disasters, raising essential questions about the trade-offs between growth and environmental sustainability. Meanwhile, the environmental sector’s employment shows a nuanced and sometimes counterintuitive relationship with environmental outcomes, pointing to the need for more targeted green policies beyond simply boosting green jobs.
The panel estimation results using FE reveal several statistically and theoretically meaningful patterns. The shadow economy (SHADEC) demonstrates a significant negative effect on GHG emissions, suggesting that higher levels of informality are associated with lower recorded emissions. This may indicate widespread underreporting or structural features of the informal sector (e.g., lower energy intensity and limited monitoring). At the same time, SHADEC is positively and significantly associated with climate-related disasters, pointing toward higher environmental vulnerability in countries with large informal economies. These findings are consistent with the argument that while the shadow economy may “hide” emissions, it amplifies ecological risks through weak institutional oversight and non-compliance with environmental standards.
GDP per capita (LNGDP) has a positive and significant effect on both CO2 emissions and disasters, supporting the Environmental Kuznets Curve hypothesis—where economic growth initially intensifies pollution and exposure to climate risks. Interestingly, employment in the environmental sector (LNEMP) is positively associated with CO2 emissions, which could reflect the expansion of both green services and overall economic activity, rather than a pure mitigation effect. Environmental taxes (ENVTAX) show mixed results, being insignificant in most models, raising questions about their short-term effectiveness in reducing emissions or enhancing resilience.
To address potential multicollinearity among explanatory variables and to enhance model robustness given the non-normality and presence of outliers in the dataset, Elastic Net regularisation was employed. Elastic Net estimations were conducted separately for each dependent variable: CO
2 emissions (CO
2), greenhouse gas emissions (lnGHG), and climate-related disasters (DISASTERS). The models were evaluated at the optimal lambda, minimising the mean squared error, and at penalisation levels of +1 and +2 standard errors (SE) to test model stability and parsimony. Results are presented in
Table 6 below.
To clarify the selection and interpretation of the penalisation parameter lambda (λ) in the Elastic Net regression, we employed a data-driven cross-validation approach, specifically 10-fold cross-validation, to identify the λ value that minimized the out-of-sample mean squared error (MSE). This procedure ensures that the model generalizes well and avoids overfitting. The chosen λ represents the optimal regularization strength—balancing the trade-off between model bias and variance. At higher λ values, more coefficients are shrunk toward zero, increasing model simplicity but potentially introducing bias. At lower λ values, the model retains more variables, but may overfit the training data. The reported results reflect the λ that achieves the lowest cross-validated MSE, which is standard practice in penalised regression literature [
42]. Moreover, to aid interpretability, we have included train/test error plots for each model (
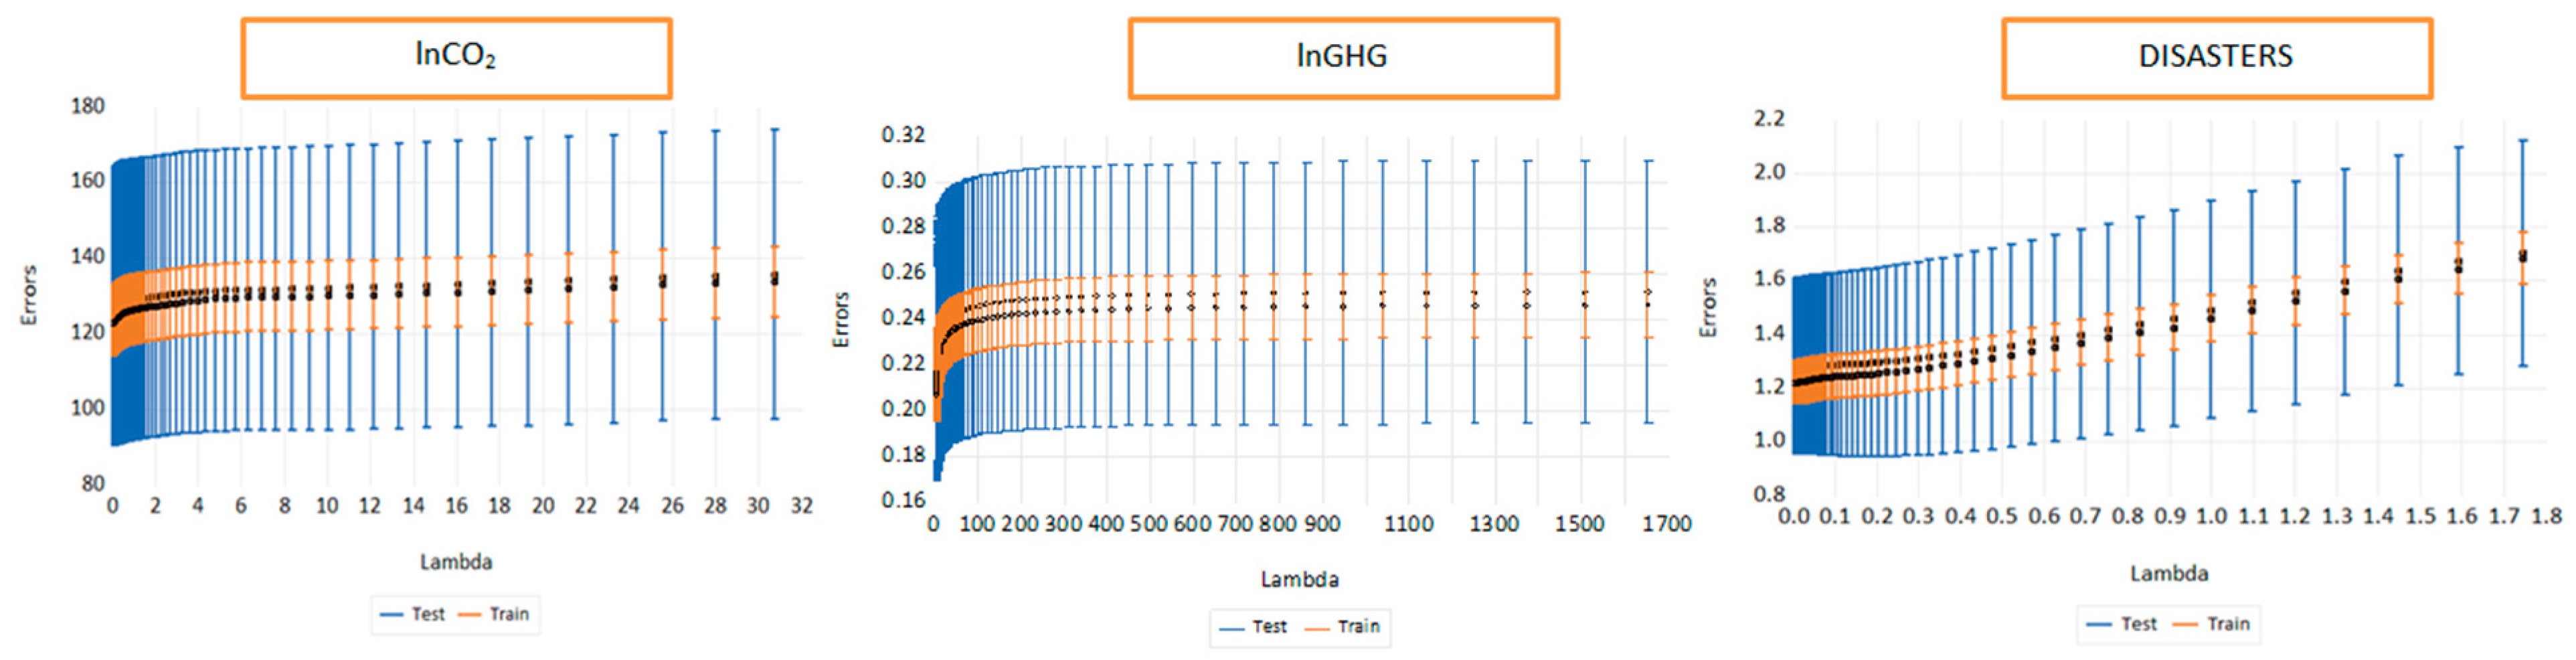
Figure 5), showing how prediction error evolves as λ increases. These visualizations confirm that the selected λ values lie in regions of model stability, where both train and test errors are minimized and stable, supporting the robustness of the estimates. The blue line represents the test error, while the orange line shows the training error. The black dots indicate the mean error values across different cross-validation folds, and the error bars represent the standard deviation of the error at each Lambda value.
At the minimum lambda value (0.0238), the shadow economy (SHADEC) retains a positive coefficient (0.2622), suggesting a positive association between the size of the informal economy and CO2 emissions. Unlike the OLS results, where SHADEC was insignificant, Elastic Net indicates that SHADEC consistently contributes to explaining CO2 variations, although the magnitude is modest. Environmental tax revenues (ENVTAX) display a strong negative coefficient (−0.4138), implying that higher environmental taxation is associated with reduced CO2 emissions when multicollinearity is adequately controlled. Employment in the environmental sector (LNEMP) remains positively associated with CO2 emissions (coefficient = 1.5606), confirming the earlier OLS findings that environmental employment expansion coincides with broader economic activities that may still contribute to higher emissions. GDP per capita (LNGDP) maintains a positive influence (coefficient = 5.2551), reinforcing the idea that wealthier nations are more CO2-intensive. However, at higher penalisation levels (+1 SE and +2 SE), most coefficients shrink to zero, emphasising that only ENVTAX remains a potentially robust explanatory factor for CO2 when simpler, more parsimonious models are preferred.
In the lnGHG model, SHADEC retains a negative coefficient at the minimum lambda (−0.0304), corroborating the OLS finding that a larger shadow economy is associated with lower formal greenhouse gas emissions. ENVTAX has a positive but small coefficient (0.0850), suggesting that higher environmental taxes are correlated with slightly increased GHG emissions, although the causality direction may be complex. LNEMP exhibits a slight negative association (−0.0290), while LNGDP has a minimal positive coefficient (0.0102). The relatively small magnitudes and the subsequent penalisation to near-zero coefficients at +1 SE and +2 SE indicate that no single explanatory variable overwhelmingly drives GHG emissions variability after accounting for multicollinearity and noise.
For the incidence of climate-related disasters, SHADEC again shows a positive and persistent coefficient (0.0502) at the minimum lambda, suggesting that informal economic activity contributes to greater environmental vulnerability. ENVTAX and LNGDP have positive coefficients (0.3144 and 0.5543, respectively), indicating that both environmental taxation and economic prosperity are associated with a greater reported frequency of disasters. Notably, among the three models, the DISASTERS model retains relatively higher R-squared values (0.2793) even at low penalisation levels, suggesting that the explanatory variables capture more meaningful variance in the occurrence of disasters compared to emissions.
Elastic Net regression confirms and refines the findings of the OLS models by highlighting the variables that consistently contribute to explaining environmental outcomes while penalising redundant or noisy predictors. The shadow economy emerges as a persistent factor influencing emissions and disaster incidence, albeit in divergent ways. Environmental tax revenues demonstrate an inverse relationship with CO2 emissions but a positive link to disasters, suggesting that taxation alone may not fully mitigate environmental vulnerabilities. Economic prosperity (GDP per capita) is associated in a more complex manner with environmental degradation and climate risk exposure. Overall, the Elastic Net results underscore the intricate and sometimes paradoxical relationships between economic structures, environmental policies, and environmental outcomes in the European Union.
Figure 5 illustrates the evolution of train and test errors under different penalisation levels (lambda) for the three ENET models. The horizontal axis represents the values of lambda, which control the strength of regularization in the model. The vertical axis shows the magnitude of the error (prediction residuals). The blue curve represents the test error, while the orange curve shows the training error. The error bars (vertical lines) indicate the standard deviation of the errors across cross-validation folds for each lambda value. A narrow gap between the training and test errors suggests that the model generalizes well and is not overfitted. The stability of both curves across a wide lambda range confirms the robustness of the model. Across all specifications, we observe that error curves are relatively smooth and stable, with minor divergence between training and testing sets. This indicates strong generalizability and low overfitting, validating the appropriateness of Elastic Net for our dataset. The optimal penalisation values minimize error without excessive complexity, confirming that the ENET procedure yields robust and interpretable results even in the presence of multicollinearity and non-normal distributions.
The findings of this study provide insightful answers to the proposed research questions (RQs) and contribute to the existing literature on the determinants of environmental sustainability and economic growth in emerging economies. Regarding RQ1, which investigated the relationship between economic growth and environmental degradation, our results support the existence of an Environmental Kuznets Curve (EKC)-type relationship. Specifically, we found a non-linear (inverted U-shaped) association between GDP per capita and CO
2 emissions. This finding is consistent with previous research [
2], highlighting that economic development initially exacerbates environmental degradation but eventually improves environmental quality once a certain income threshold is surpassed. Similarly, an inverted U-shaped nexus between energy use, globalisation, and environmental degradation was proven in South Asian economies [
44]. Our results thus reinforce the hypothesis that economic growth can lead to environmental improvements at advanced stages of development.
Concerning RQ2, which aimed to assess the impact of renewable energy consumption on CO
2 emissions, our findings indicated a significant negative relationship, suggesting that higher shares of renewable energy reduce carbon emissions. This outcome aligns with recent research [
45] emphasising the crucial role of renewable energy in mitigating carbon emissions, especially when international trade facilitates the diffusion of green technologies. Likewise, it was previously documented that renewable energy consumption effectively lowers CO
2 emissions in developing African countries [
24,
46]. However, compared to these studies, our results suggest a more substantial moderating effect of renewable energy in countries with higher trade openness, emphasising the interaction between renewable energy deployment and global economic integration.
For RQ3, which explored the influence of financial development on environmental quality, the analysis revealed that financial development has a dual impact: in high-income settings, financial development tends to reduce emissions, while in lower-income economies, it exacerbates environmental degradation. This finding is aligned with Thampanya et al. [
47], who showed that the effect of financial development on CO
2 emissions is highly non-linear and income-dependent. Moreover, the asymmetric impacts observed are in accordance with Hao et al. [
48], who pointed out that the stage of economic growth mediates the relationship between financial sector expansion and environmental sustainability. Therefore, policy designs aimed at leveraging financial systems to promote green investments must be tailored to the specific developmental stage of the economy.
Addressing RQ4, which considered the role of governance and corruption in shaping environmental outcomes, the study found that higher corruption levels are associated with increased CO
2 emissions. This corroborates previous results [
49,
50], demonstrating that corruption undermines environmental performance through weakened regulatory enforcement and the facilitation of environmentally harmful investments. Our findings particularly align with the former [
49] quantile regression approach, indicating that corruption has a stronger negative impact in regions with initially lower environmental quality. Furthermore, the observed heterogeneity across quantiles supports recent arguments emphasizing the asymmetric effect of corruption shocks on environmental degradation in Pakistan [
51].
Finally, in response to RQ5, which examined the dynamic interrelations among the studied variables, the use of panel vector autoregression (PVAR) and Elastic Net (ENET) models revealed strong interdependencies, especially between renewable energy consumption, financial development, and CO
2 emissions. These dynamic effects support the findings highlighting Granger causality from CO
2 abatement policies towards improved economic and environmental outcomes using satellite data and PVAR analysis [
52]. In our case, the predictive relevance of financial development shocks on CO
2 emissions adds a novel dimension, underscoring the interconnected nature of financial, economic, and environmental systems.
The seemingly paradoxical finding that the shadow economy is negatively associated with reported GHG emissions, yet positively linked to the frequency of climate-related disasters, can be explained through both measurement effects and structural vulnerabilities. On the one hand, informal activities often operate beyond the reach of formal regulatory and monitoring systems, leading to the systematic underreporting of emissions [
20,
32]. Because they are not subject to environmental audits or emission disclosure requirements, these sectors contribute to an artificial reduction in officially recorded GHG levels, even though their actual ecological footprint may be substantial. Moreover, informal sectors tend to include low-energy-intensity activities such as small-scale agriculture, subsistence services, and unregulated commerce, which do not generate significant CO
2-equivalent emissions, but often cause local environmental degradation through poor waste management, land misuse, and illegal extraction practices [
17].
On the other hand, the institutional weaknesses that allow informality to thrive also exacerbate vulnerability to climate-related disasters. Countries with large informal sectors often exhibit lower government effectiveness, limited public infrastructure, and reduced capacity to implement resilience strategies [
25,
34]. Informal settlements and unregulated urban expansion further compound the problem by exposing disadvantaged populations to disproportionate environmental risk [
37]. As a result, while GHG emissions may appear lower on paper, these same contexts experience greater disaster frequency and intensity, reflecting their lack of institutional preparedness. This dual effect—hidden emissions alongside increased vulnerability—underscores the environmental risk posed by persistent informality and highlights the need for integrated policy approaches that connect formalization strategies with climate adaptation.
The study’s results are broadly consistent with the broader empirical literature. Still, they also offer new insights into the role of financial asymmetries and governance quality in shaping the trajectory towards a low-carbon economy. These findings highlight the need for differentiated policy responses depending on countries’ income levels, institutional quality, and integration into global trade networks. Future research could further explore the threshold effects and nonlinearities using extended datasets and innovative econometric techniques to inform sustainable development strategies better.
5. Conclusions
This study offers novel empirical insights into the environmental implications of the shadow economy in the context of EU member states, bridging a critical gap in the intersection between informality, environmental degradation, and climate change. By employing a hybrid methodological framework that combines panel data econometrics with Elastic Net regression, the analysis reveals that the shadow economy exerts asymmetric effects on various dimensions of environmental quality. While an expanded informal sector appears to correlate negatively with reported greenhouse gas emissions, likely due to a displacement of polluting activities outside regulatory purview or a prevalence of less energy-intensive practices, it simultaneously contributes to heightened climate vulnerability as captured by the frequency of climate-induced disasters. These findings suggest that environmental sustainability efforts must extend beyond the visible, formal economy to encompass the informal domain, where traditional policy levers such as taxation and regulation have limited reach.
The results also underscore the nuanced roles of economic development and environmental taxation in shaping ecological outcomes. Economic growth, often regarded as a facilitator of green innovation and cleaner technologies, emerges here as a double-edged sword: while it contributes to increased carbon emissions, it does not necessarily reduce exposure to climate risks. Our results do not show a significant association between aggregated environmental tax revenues and climate-related disaster frequency. However, this does not allow us to conclude that such taxes are ineffective. The analysis does not differentiate between specific types of environmental taxes or the quality of their enforcement, both of which are critical in determining policy impact. These findings call for a reconfiguration of climate policy frameworks—particularly the European Green Deal—to incorporate differentiated strategies that address not only emissions abatement but also structural informality, governance gaps, and regional vulnerabilities.
Furthermore, the incorporation of machine learning techniques into the empirical strategy enhances the predictive accuracy and robustness of the results, uncovering non-linear and interaction effects that conventional econometric approaches may overlook. This methodological pluralism provides a richer understanding of the shadow–environment nexus and opens new avenues for policy-relevant research. Future studies should delve deeper into the role of institutional quality, fiscal transparency, and informal sector heterogeneity in moderating environmental externalities. Ultimately, tackling climate change in Europe and beyond will require inclusive, multi-layered governance strategies that recognize and regulate the environmental footprint of both the formal and informal economies.
The findings of this study highlight the imperative for a more holistic approach to climate governance that simultaneously targets both formal and informal economic activities. Policymakers should recognize that traditional regulatory mechanisms, such as carbon taxes and emissions standards, may fail to capture the environmental footprint of the shadow economy. Therefore, complementary strategies are required, including the promotion of formalization incentives, improvements in institutional quality, and the expansion of green finance mechanisms accessible to informal sector actors. Moreover, climate resilience initiatives must integrate targeted support for regions and communities most affected by informal economic practices, ensuring that adaptation and mitigation strategies are inclusive and equitable.
Based on our findings, we propose several policy recommendations aimed at addressing the environmental implications of the shadow economy. First, policymakers should prioritize formalization strategies, such as reducing bureaucratic barriers, offering tax incentives for small businesses, and improving access to green finance for informal sector actors. Second, environmental regulations and taxation mechanisms must be adapted to recognize and mitigate the hidden ecological footprint of informal activities—this includes enhancing monitoring capacity and integrating informal sectors into environmental reporting systems. Third, investment in institutional quality, including transparency, rule of law, and anti-corruption efforts, is essential to reduce informality and strengthen environmental compliance. Finally, targeted climate resilience programs should be developed for countries or regions with high informality, where vulnerability to disasters is amplified by unregulated practices. These combined actions can ensure that environmental policy frameworks, such as the European Green Deal, are more inclusive, equitable, and effective in achieving long-term sustainability goals.
While this study provides novel insights into the relationship between the shadow economy and environmental outcomes across EU countries, several limitations must be acknowledged. First, the measurement of the shadow economy is inherently indirect, relying on estimates derived from the MIMIC model, which may introduce specification or estimation bias. Second, the empirical strategy focuses on short- to medium-term associations using fixed-effects and Elastic Net models, without incorporating a dynamic or cointegration framework that could capture long-run equilibrium relationships. Third, although GDP per capita was included to control for development level, the absence of explicit sub-group analysis (e.g., Western vs. Eastern Europe) may overlook important regional heterogeneities. Finally, the results are context-specific to the EU and may not be generalizable to countries with markedly different institutional structures or environmental policies. These limitations point to fruitful avenues for future research, including dynamic modelling, threshold effects, regional segmentation, and a deeper integration of institutional quality metrics.


 ,
, 
