Article

Machine Learning Approaches for Microplastic Pollution Analysis in Mytilus galloprovincialis in the Western Black Sea

by
Maria Emanuela Mihailov
1,
Alecsandru Vladimir Chiroșca
2,*,
Elena Daniela Pantea
3,* and
Gianina Chiroșca
4
1
Research-Development and Innovation Center, Maritime Hydrographic Directorate “Comandor Alexandru Catuneanu”, Fulgerului Street No. 1, 900218 Constanta, Romania
2
Faculty of Physics, University of Bucharest, Atomiștilor 405, 077125 Magurele, Romania
3
Ecology and Marine Biology Department, National Institute for Marine Research and Development (NIMRD) “Grigore Antipa”, 300 Mamaia Blvd., 900581 Constanta, Romania
4
National R&D Institute for Optoelectronics “INOE 2000”, Atomistilor 409, 077125 Magurele, Romania
*
Authors to whom correspondence should be addressed.
Sustainability 2025, 17(12), 5664; https://doi.org/10.3390/su17125664
Submission received: 18 May 2025 / Revised: 12 June 2025 / Accepted: 13 June 2025 / Published: 19 June 2025
(This article belongs to the Special Issue Environment and Sustainable Economic Growth, 2nd Edition)

Abstract

:
Microplastic pollution presents a significant and rising risk to both ecological integrity and the long-term viability of economic activities reliant on marine ecosystems. The Black Sea, a region sustaining economic sectors such as fisheries, tourism, and maritime transport, is increasingly vulnerable to this form of contamination. Mytilus galloprovincialis, a well-established bioindicator, accumulates microplastics, providing a direct measure of environmental pollution and indicating potential economic consequences deriving from degraded ecosystem services. While previous studies have documented microplastic pollution in the Black Sea, our paper specifically quantified microplastic contamination in M. galloprovincialis collected from four sites along the western Black Sea coast, each characterised by distinct levels of anthropogenic influence: Midia Port, Constanta Port, Mangalia Port, and 2 Mai. We used statistical analysis to quantify site-specific microplastic contamination in M. galloprovincialis and employed machine learning to develop models predicting accumulation patterns based on environmental variables. Our findings demonstrate the efficacy of mussels as bioindicators of marine plastic pollution and highlight the utility of machine learning in developing effective predictive tools for monitoring and managing marine litter contamination in marine environments, thereby contributing to sustainable economic practices.

1. Introduction

The persistent spread of microplastic pollution in marine ecosystems has emerged as a critical issue over recent decades, with significant research focusing on its environmental and toxicological impacts, particularly in coastal and semi-enclosed seas. In many studies, microplastics are defined as particles smaller than 5 mm in size, originating from both primary sources (manufactured in small sizes) and secondary sources (the fragmentation of larger plastics). This environmental challenge is compounded by the fact that microplastic particles can adsorb various toxic contaminants, thereby increasing their hazard potential through synergistic effects. Furthermore, the widespread distribution of microplastics is influenced by various transport mechanisms, including long-distance atmospheric transport, which can disperse fibres in vast geographical areas [1]. Researchers have increasingly concentrated on understanding the physicochemical and biological processes of microplastic pollution to design effective mitigation and remediation strategies [2,3]. Moreover, the complex characteristics of microplastics, including size, shape, and polymer type, require sophisticated analytical methods to support robust environmental assessments.
The Mediterranean mussel, Mytilus galloprovincialis, has been widely recognised as an effective bioindicator due to its filter-feeding behaviour and its ability to bioaccumulate pollutants, including microplastics, present in coastal ecosystems. Studies emphasise that the species’ ecological role and economic importance in aquaculture and fisheries drive the need for demanding monitoring programs that reliably assess pollutant loads, including microplastics, within its tissues. In this context, the physiological responses and molecular biomarkers in M. galloprovincialis, such as antioxidant enzymes and stress markers, have been suggested to indicate environmental contamination. Accumulation patterns in mussels are thus used to indicate the overall health of marine environments, providing insights into exposure levels and potential ecological risks [2,4]. Researchers have also noted that enhanced bioindicator capability may be achieved by integrating advanced analytical methods to quantify these pollutants more accurately.
Mytilus galloprovincialis, the Mediterranean mussel, is a bivalve mollusc of considerable ecological and economic importance on a global scale. Belonging to the Mytilidae family within the Mytilus edulis species complex, it exhibits a broad distribution in temperate and subarctic coastal environments in the Northern and Southern Hemispheres, frequently establishing dominance on hard substrates. The species is characterised by its remarkable adaptability, enabling it to colonise diverse habitats, from the rigorous conditions of rocky intertidal zones to the more stable subtidal regions and artificial structures such as aquaculture installations. This widespread occurrence and environmental plasticity suggest a resilient organism capable of thriving in various conditions, positioning it as a significant species for ecological research and a promising candidate for aquaculture in regions such as the Black Sea [5].
The Black Sea presents a unique marine environment, distinguished by its status as the world’s largest meromictic basin. This characteristic is defined by a permanently stratified water column that features a less saline, oxygenated upper layer that supports aerobic life and a deeper, anoxic layer rich in hydrogen sulphide, which limits the distribution of most marine organisms [6]. This distinct hydrographic profile contributes to the relatively lower biodiversity of the Black Sea compared to the adjacent Mediterranean Sea due to its specific environmental conditions, including fluctuations in salinity and temperature, as well as its history of isolation. Furthermore, the Black Sea ecosystem is subject to substantial anthropogenic pressures, including significant riverine input that transports nutrients that contribute to eutrophication, pollution from industrial and agricultural activities, the impacts of overfishing, and the introduction of non-native species that can disrupt ecological balance [7].
Within this unique context of the Black Sea, Mytilus galloprovincialis plays a dual role in terms of ecological importance and economic potential. Ecologically, the Mediterranean mussel acts as an ecosystem engineer, forming extensive beds that provide complex three-dimensional habitats and consequently enhance biodiversity within benthic communities [8]. Its filter-feeding activity is also essential, influencing water quality through the removal of particulate matter and participating in nutrient cycling processes, which can potentially help mitigate some of the adverse effects of eutrophication in the Black Sea. Economically, M. galloprovincialis represents a valuable resource for the Black Sea region. Established aquaculture practices in certain coastal countries, coupled with the potential for further sustainable development, offer opportunities to enhance food security, generate employment for coastal communities, and stimulate economic growth.
Environmental studies have shown that the concentration of microplastics in this region can be significantly higher than in open-ocean systems, posing serious risks to biodiversity and human communities that rely on coastal resources. Microplastics pollution has been observed in various components of the Black Sea ecosystem. Studies have reported the presence of microplastics in water [9,10,11,12,13,14], on beaches [15], and in sediments [16,17]. However, research specifically focusing on bivalves is limited, with only a few studies available [18,19,20,21,22,23]. According to Cincinelli et al. (2021), the most heavily contaminated area is the northwestern part of the Black Sea [24].
The bioaccumulation of microplastics by species such as M. galloprovincialis in the Black Sea thus becomes critical research linking environmental monitoring with public health concerns [3,21].
Machine learning (ML) approaches have gained increasing importance in environmental monitoring due to their capacity to process large datasets and identify complex patterns that traditional statistical techniques often overlook. By integrating heterogeneous data sources—ranging from remote sensing imagery and spectroscopic analyses to in situ measurements—machine learning frameworks significantly enhance both the resolution and accuracy of pollution monitoring initiatives, as highlighted by the works of Stamataki et al. (2020) [25]. Such developments are essential for addressing the pressing issue of microplastics in marine ecosystems, as they provide a robust platform for understanding the spatiotemporal dynamics and biological impacts of these contaminants [4,25,26]. In the context of environmental applications, machine learning has been employed for tasks such as classification, regression, and anomaly detection, which are directly relevant to detecting and quantifying microplastics within marine organisms. These advanced computational techniques not only assist in identifying the presence of microplastics but also in determining their concentrations and distributions across various marine environments. Developing deep learning methodologies has added advanced detection capabilities, especially in complex matrices such as biological tissues.
The main application of machine learning in microplastic pollution analysis involves techniques such as image processing, spectral analysis, and predictive modelling. These techniques enable researchers to achieve high detection accuracy and automate repetitive processes, thus enhancing efficiency in environmental monitoring. One example is the implementation of convolutional neural networks (CNNs), which have shown the ability to classify microplastic particles in laboratory-controlled environments and field images automatically. By reducing dependence on labour-intensive and time-consuming manual identification methods, CNNs enable researchers to significantly accelerate monitoring processes, allowing for broader and more frequent data collection across wide marine areas [4,26].
Machine learning also extends to strong analytical approaches such as support vector machines (SVM) and random forest models, which are routinely employed to decipher complex environmental datasets. These models exhibit considerable resilience despite high variability and noise, making them particularly well suited for ecological data that often exhibit inherent complexity [4,26]. Furthermore, these algorithms enable the dynamic integration of diverse datasets and the development of innovative methods for predictive modelling regarding microplastic pollution.
The present study aims to evaluate the accumulation of microplastics in Mytilus galloprovincialis along the Romanian Black Sea coast, integrating empirical biomonitoring with machine learning-based predictive modelling. Combining organism-level measurements with synthetic data-driven regression analysis provides site-specific insights into patterns of chronic and episodic contamination. This approach reinforces the relevance of M. galloprovincialis as an indicator species for coastal pollution and highlights the potential of machine learning frameworks to enhance traditional monitoring methods. Although developed for a regional case study, the proposed methodology offers a robust framework for broader environmental applications.

2. Materials and Methods
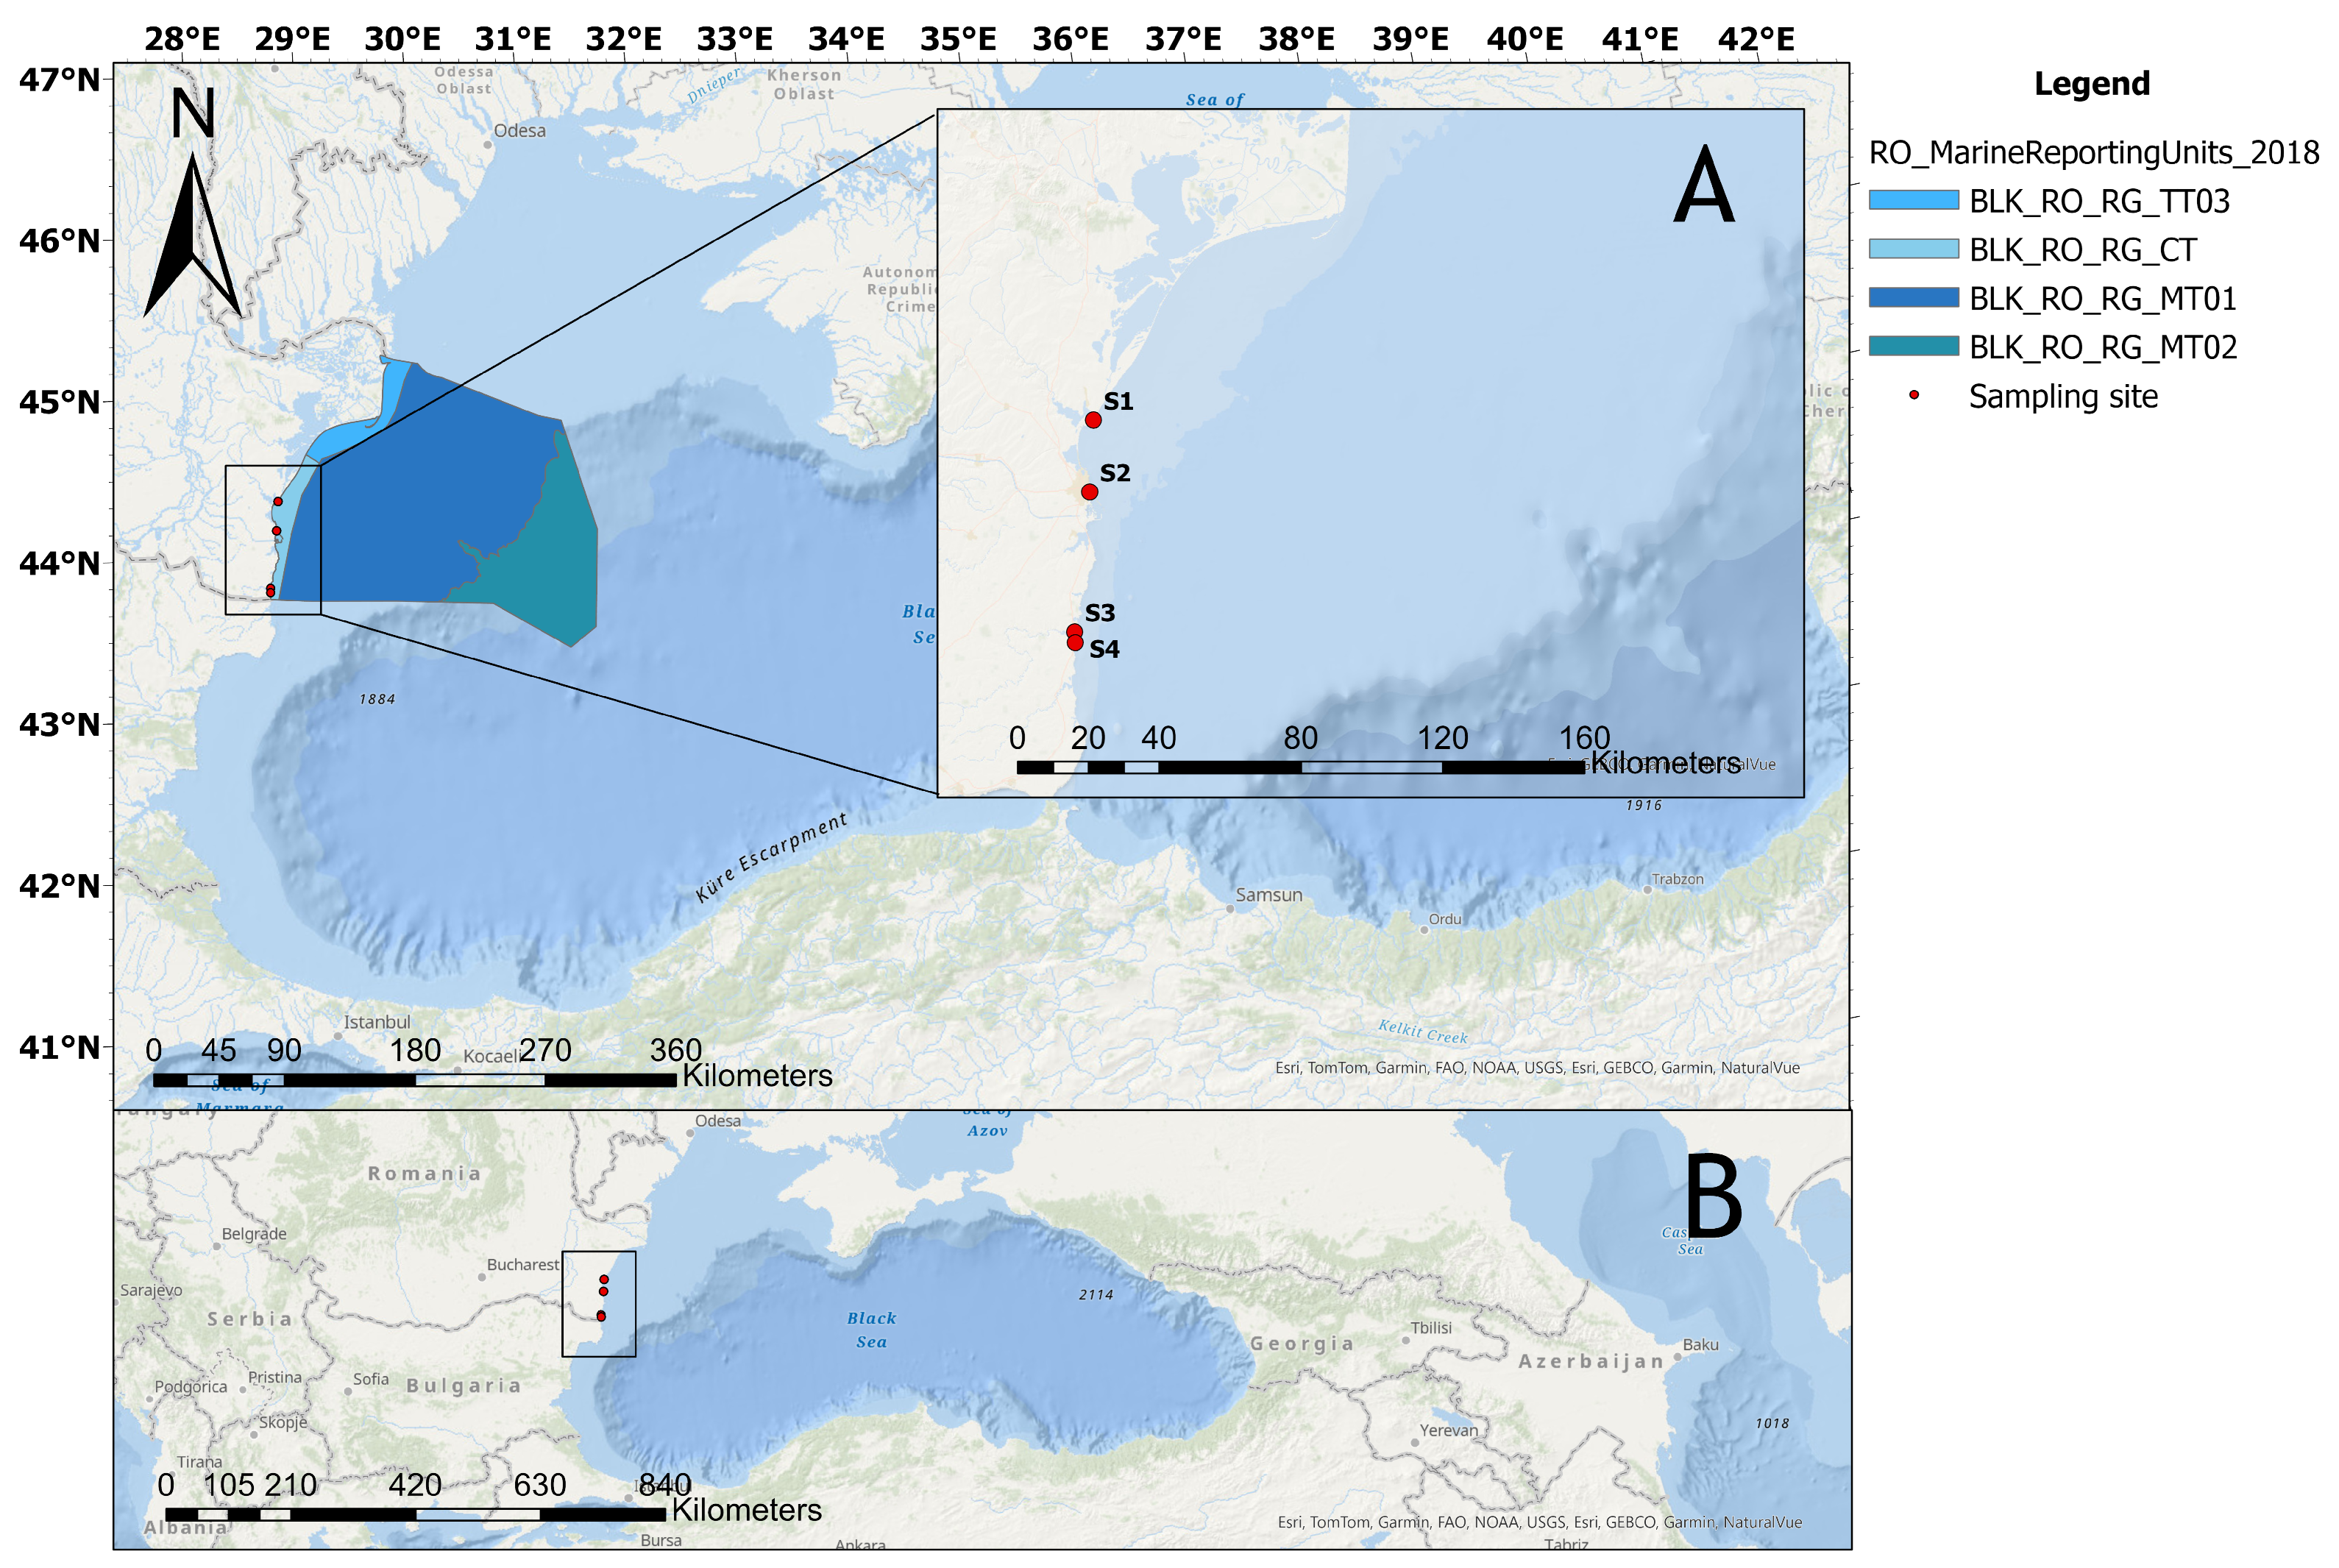
To address these objectives, a comprehensive methodology was employed, encompassing field sampling, laboratory analysis, and machine learning techniques. The following sections detail the study area, sample collection, microplastic processing, and data analysis procedures.

2.1. Study Area

To investigate the microplastic pollution levels of wild mussels, Mytilus galloprovincialis (Lamarck, 1819), from the Romanian Black Sea coast, four sampling locations were selected. These sites represented a range of anthropogenic pressures and environmental conditions (Figure 1, Table 1). The study was conducted seasonally from May to November 2018 (spring, summer, and autumn).
Sampling locations were selected based on major potential microplastic sources in the coastal zone, including wastewater treatment plants (for both domestic and industrial effluents), maritime traffic, tourism, and fishing activities. Three of the sites (Midia Port (S1), Constanța Port (S2), and Mangalia Port (S3)) are significantly influenced by human activities and were classified as heavily contaminated [27]. The fourth sampling location was Veche-2 Mai Vama Veche-2 Mai Marine Reserve, a protected natural area. Due to the area’s limited urban development and low levels of anthropogenic pressure, this zone was considered relatively clean. The study area map was created using REDL USA ArcGIS Desktop v.10.7.x. [28].

2.2. Microplastic Processing and Isolation from Mussels

2.2.1. Contamination Prevention and Quality Control

To minimise airborne microplastic contamination during laboratory procedures, nitrile gloves were utilised, and 100% cotton laboratory coats were used throughout the analysis. The stereomicroscope and work area were cleaned prior to sample analysis. All liquid reagents, including distilled water, saline solution, and hydrogen peroxide, were pre-filtered through 1 µm glass microfibre filters (Ahlstrom-Munksjo, 47 mm diameter, Ahlstrom-Munksjo, Germany) to prevent background contamination. Glassware and instruments were rinsed thrice with filtered distilled water. During tissue digestion, samples were covered with aluminium foil. Furthermore, filters were covered with glass Petri dish lids during measurements to avoid contamination during the analytical process. A procedural blank (without tissue) was simultaneously processed with tissue samples to correct for potential procedural contamination. Blank filters were used during microscopic inspection to assess airborne contamination. To moderate the potential contamination of the sample from airborne microplastics present in the laboratory environment, rigorous quality control measures were implemented. We determined that procedural contamination, identified on these blank filters, constituted less than 10% of the mean number of microplastics found in the actual samples. Microplastics observed on blank filters that shared characteristics with those found in the samples were systematically excluded from the final analysis. This laborious approach ensured that the microplastic counts reported accurately reflected those accumulated by mussels, minimising the external contamination bias. Procedural contamination was determined to be less than 10% of the mean number of microplastics found in samples [29]. Microplastics observed on blank filters were categorised by type and colour. Microplastics in samples with characteristics similar to those identified in blanks were excluded from the analysis. All experimental procedures were completed rationally to minimise contamination risk.

2.2.2. Sample Processing and Microplastic Extraction

Before analysis, mussels were defrosted at ambient temperature for 1–2 h. Mussel length was measured in millimeters using a digital calliper (UNIOR 270A, UNIOR, Zreče, Slovenia) with a precision of 0.02 mm. Mussels were categorised into three size classes (n = 3): small (2–4 cm), medium (4–6 cm), and large (6–8 cm). Soft tissue was dissected from the valves using a stainless-steel scalpel after allowing excess intra-valvular water to drain, and the tissue wet weight (g) was determined using a precision balance (KERN KB, d = 0.01 g, KERN&SOHN GmbH, Balingen, Germany). Microplastics were extracted from the soft tissue using a hydrogen peroxide digestion method based on the protocol of Li et al. (2015) with minor modifications, specifically extending the soft tissue digestion time on a hot plate from 24 to 48 h [30]. Tissues from three individuals of the same size class were pooled to create a single replicate in a 1 L Erlenmeyer glass flask. Three replicates were prepared for each sampling location. A volume of 200 mL of 30% H 2 O 2 (hydrogen peroxide for analysis, 30% concentration, EMSURE®ISO, Merck KGaA, Darmstadt, Germany) was added to each flask to digest the organic matter of the soft tissue. Flasks were covered with aluminium foil and placed on a multi-position magnetic stirring hotplate (VELP Scientifica AM4, Usmate Velate, Italy) at 65 °C for 48 h, with intermittent manual agitation during the digestion process. After hot digestion, samples were left at room temperature for 24–48 h to ensure complete tissue digestion, with manual agitation at specific intervals.

2.2.3. Microplastic Separation with Hypersaline Solution and Filtration

A concentrated saline solution (1.2 g/mL, sodium chloride for analysis, Silal Trading, București, Romania) was prepared to separate microplastics from the digested tissue solution. Given microplastics’ low density and high buoyancy, the hypersaline solution facilitated their separation from the dissolved soft tissue matrix via density-based flotation. The digested tissue solution was transferred to a 1 L separation funnel, and 800 mL of filtered saturated NaCl solution was added. The mixture was agitated and allowed to settle overnight at room temperature. After 24 h, the lower liquid layer was drained. The supernatant (approximately 700 mL) was filtered through a 5 µm porosity, 47 mm diameter mixed cellulose ester (MCE) filter (MF-Millipore®, Merck, Darmstadt, Germany) using a vacuum pump (ME 4 NT, VACUUBRAND, Wertheim, Germany). If the filters became clogged during filtration, the sample was divided into subsamples and filtered through multiple filters, which were combined into a single sample. Following filtration, filters were placed individually in glass Petri dishes with lids. Filters were stored in the dark and allowed to dry at room temperature until further analysis. After drying, the edges of the filters were affixed directly to the Petri dish using a small amount of adhesive to facilitate microscopic examination.

2.2.4. Microplastic Identification, Inventory, and Measurement

Filters were examined using a stereomicroscope (OLYMPUS SZX10, Olympus, Tokyo, Japan). Microplastics were visually identified based on their physical characteristics, according to the criteria of Barrows et al. (2017) [31]. To confirm the plastic nature of observed particles, they were subjected to physical manipulation (i.e., pressing or moving with a syringe needle) or the hot needle test, as described in Barrows et al. (2017) [31]. Plastic particles typically exhibit flexibility and do not fracture when subjected to pressure. Plastic fragments often exhibit movement when touched. Particles that break upon touch were excluded from the plastic classification. The hot needle test was employed to differentiate between plastic particles and organic matter. Microplastics will melt or curl upon contact with a hot needle, whereas other materials will not. Residual digested organic matter and salt granules on the filter could obscure observations of microplastics [31]. Salt granules and any remaining digested tissue were carefully moved on the filter to prevent overlooking plastic fragments. Identified microplastics were classified into five morphological categories: fibre (narrow, flexible, and elongated), fragment (irregularly shaped portions of larger plastics), pellet or sphere (spherically shaped plastics), film (thin, small plastic sheets), and foam (spongy plastic). Microplastics were also classified based on the predominant surface colour: transparent, black, blue, red, and green. Microplastics were photographed and measured using a digital camera (OLYMPUS SC50, Olympus, Tokyo, Japan) and imaging software (Olympus cellSens Entry, Olympus, Tokyo, Japan). The lengths of all identified microplastics were measured in µm using the software’s polyline tool for fibres and the single line tool for fragments, pellets, films, or foam. Microplastic dimensions were converted to mm and grouped into seven size classes: 0.01–0.25 mm, 0.25–0.50 mm, 0.5–1 mm, 1–2 mm, 2–3 mm, 3–4 mm, and 4–5 mm. All particles larger than 5 mm (mesoplastics) identified in the samples were also recorded and measured.

2.3. Development of a Surrogate Machine Learning Model

A machine learning (ML) approach was employed to simplify the computational algorithm for estimating the lifetime and average plastic concentration within the ingested water. Such a model requires a much larger dataset than the one we analysed, meaning that we needed to implement synthetic data generation tools. To generate such a dataset, we had to identify the measured parameters using descriptive statistical analysis. The workflow for statistical data processing is presented within the Supplementary Files.
The distributions from Table 2 were applied for unbiased Monte Carlo generation of data, together with the size distribution 4.18 ± 1.72 cm. The negative values are floored to 0 to accurately consider situations where such data are unavailable (missing within the sample measurements). All other values (such as microplastics concentration, age, wet weight, and water flow) are computed using the regression-generated algorithms, and target values for the new dataset of 87,652 records, which contains only synthetic data generated from the existing real dataset, are provided. This dataset is supplied as an input value to the ML training pipeline.
The machine learning model was trained on a synthetic dataset comprising 87,652 records. This large-scale synthetic dataset was generated using an unbiased Monte Carlo generation method based on the measured parameters and distributions identified through descriptive statistical analysis of our experimental data (summarised in Table 2). Specifically, the distributions from Table 2, along with the mussel size distribution of 4.18 ± 1.72 cm, were used as the source for generating the synthetic data. Negative values in the generated data were floored to 0 to accurately reflect situations where such data might be unavailable or missing in sample measurements. The preprocessing steps for this dataset involved encoding textual values with numerical labels. For the ‘Station’ feature, we replaced the categorical names with their corresponding geographic coordinates (latitude and longitude from Table 1). The ‘Substrate’ variable, also a textual categorical feature, was encoded using a label encoder, as detailed in Table 3. The decision to remove ‘wet mass’ as a feature was based on its high positive Pearson correlation coefficient of 0.9 with ‘size in cm’ when considering yearly averages, indicating redundancy. All other values, including microplastic concentration, age, and water flow, were computed using regression-generated algorithms and provided as target values for the new synthetic dataset.
This design, where the synthetic data’s underlying distributions and inter-variable relationships are directly derived from the measured parameters, ensures that the synthetic dataset inherently reflects the statistical characteristics and trends observed in our in situ data. This method of generation was chosen to specifically address the requirement for a much larger dataset than the one we analysed, enabling the robust training of our machine learning model for estimating the lifetime and average plastic concentration within the ingested water. Moreover, this synthetically generated, balanced dataset served as the input for our machine learning training pipeline, allowing us to develop a robust predictive model despite the limited size of our initial experimental dataset.
To implement the regression pipeline, we need to encode the textual values with numerical labels. For the station, we replace it with its geographic placement (latitude and longitude, as listed in Table 1), while the substrate requires encoding. For this, we implemented the Label Encoder, resulting in the following table:
Using these notations, our regression problem becomes a function where the feature and target values are from Table 4. The decision to remove the wet mass is due to the fact that, for yearly averages, it provides a positive Pearson correlation coefficient of 0.9 with the size in cm.
The synthetic dataset is, by design, a balanced one, so all machine learning frameworks should be able to handle such data. In our specific case, common frameworks such as TensorFlow v.2.18.1 [32] or PyTorch v.2.6.0 [33] did not converge on our problem, and we resorted to an AutoML package v.2.9.9 [34] for initial algorithm selection and evaluation. During the evaluation, we employed all available regression algorithms, and the only one that converged upon our problem was the suggested Decision Tree. Although this algorithm provided poor results (MSE: 0.07/MAE: 0.05 for age and MSE: 13.6/MAE: 0.11 for microplastic concentration) for a Decision Tree using Friedman MSE [35] with a max-depth of 8 and min-sample-leafs of 6 and a random-state of 1, from this stage, we applied a Grid Search Algorithm for meta-parameter tuning [36] with k-fold cross-validation, leading us to a Random Forest regression algorithm with much better results (MSE: 0.02/MAE: 0.06 for age and MSE: 16.54/MAE: 0.08 for the microplastic concentration in water digested during the lifetime). The R² values obtained for these predictions were 0.95 for age and 0.88 for microplastic concentration, indicating a high proportion of variance explained by the model. The final, tuned algorithm also uses the Friedman MSE with max-features set to 1 and a total of 64 estimators with a random-state of 3.
The results of the sample analysis and the machine learning models are presented in the following section.

3. Results

The following discussion interprets these findings in the context of the current scientific literature and environmental implications.

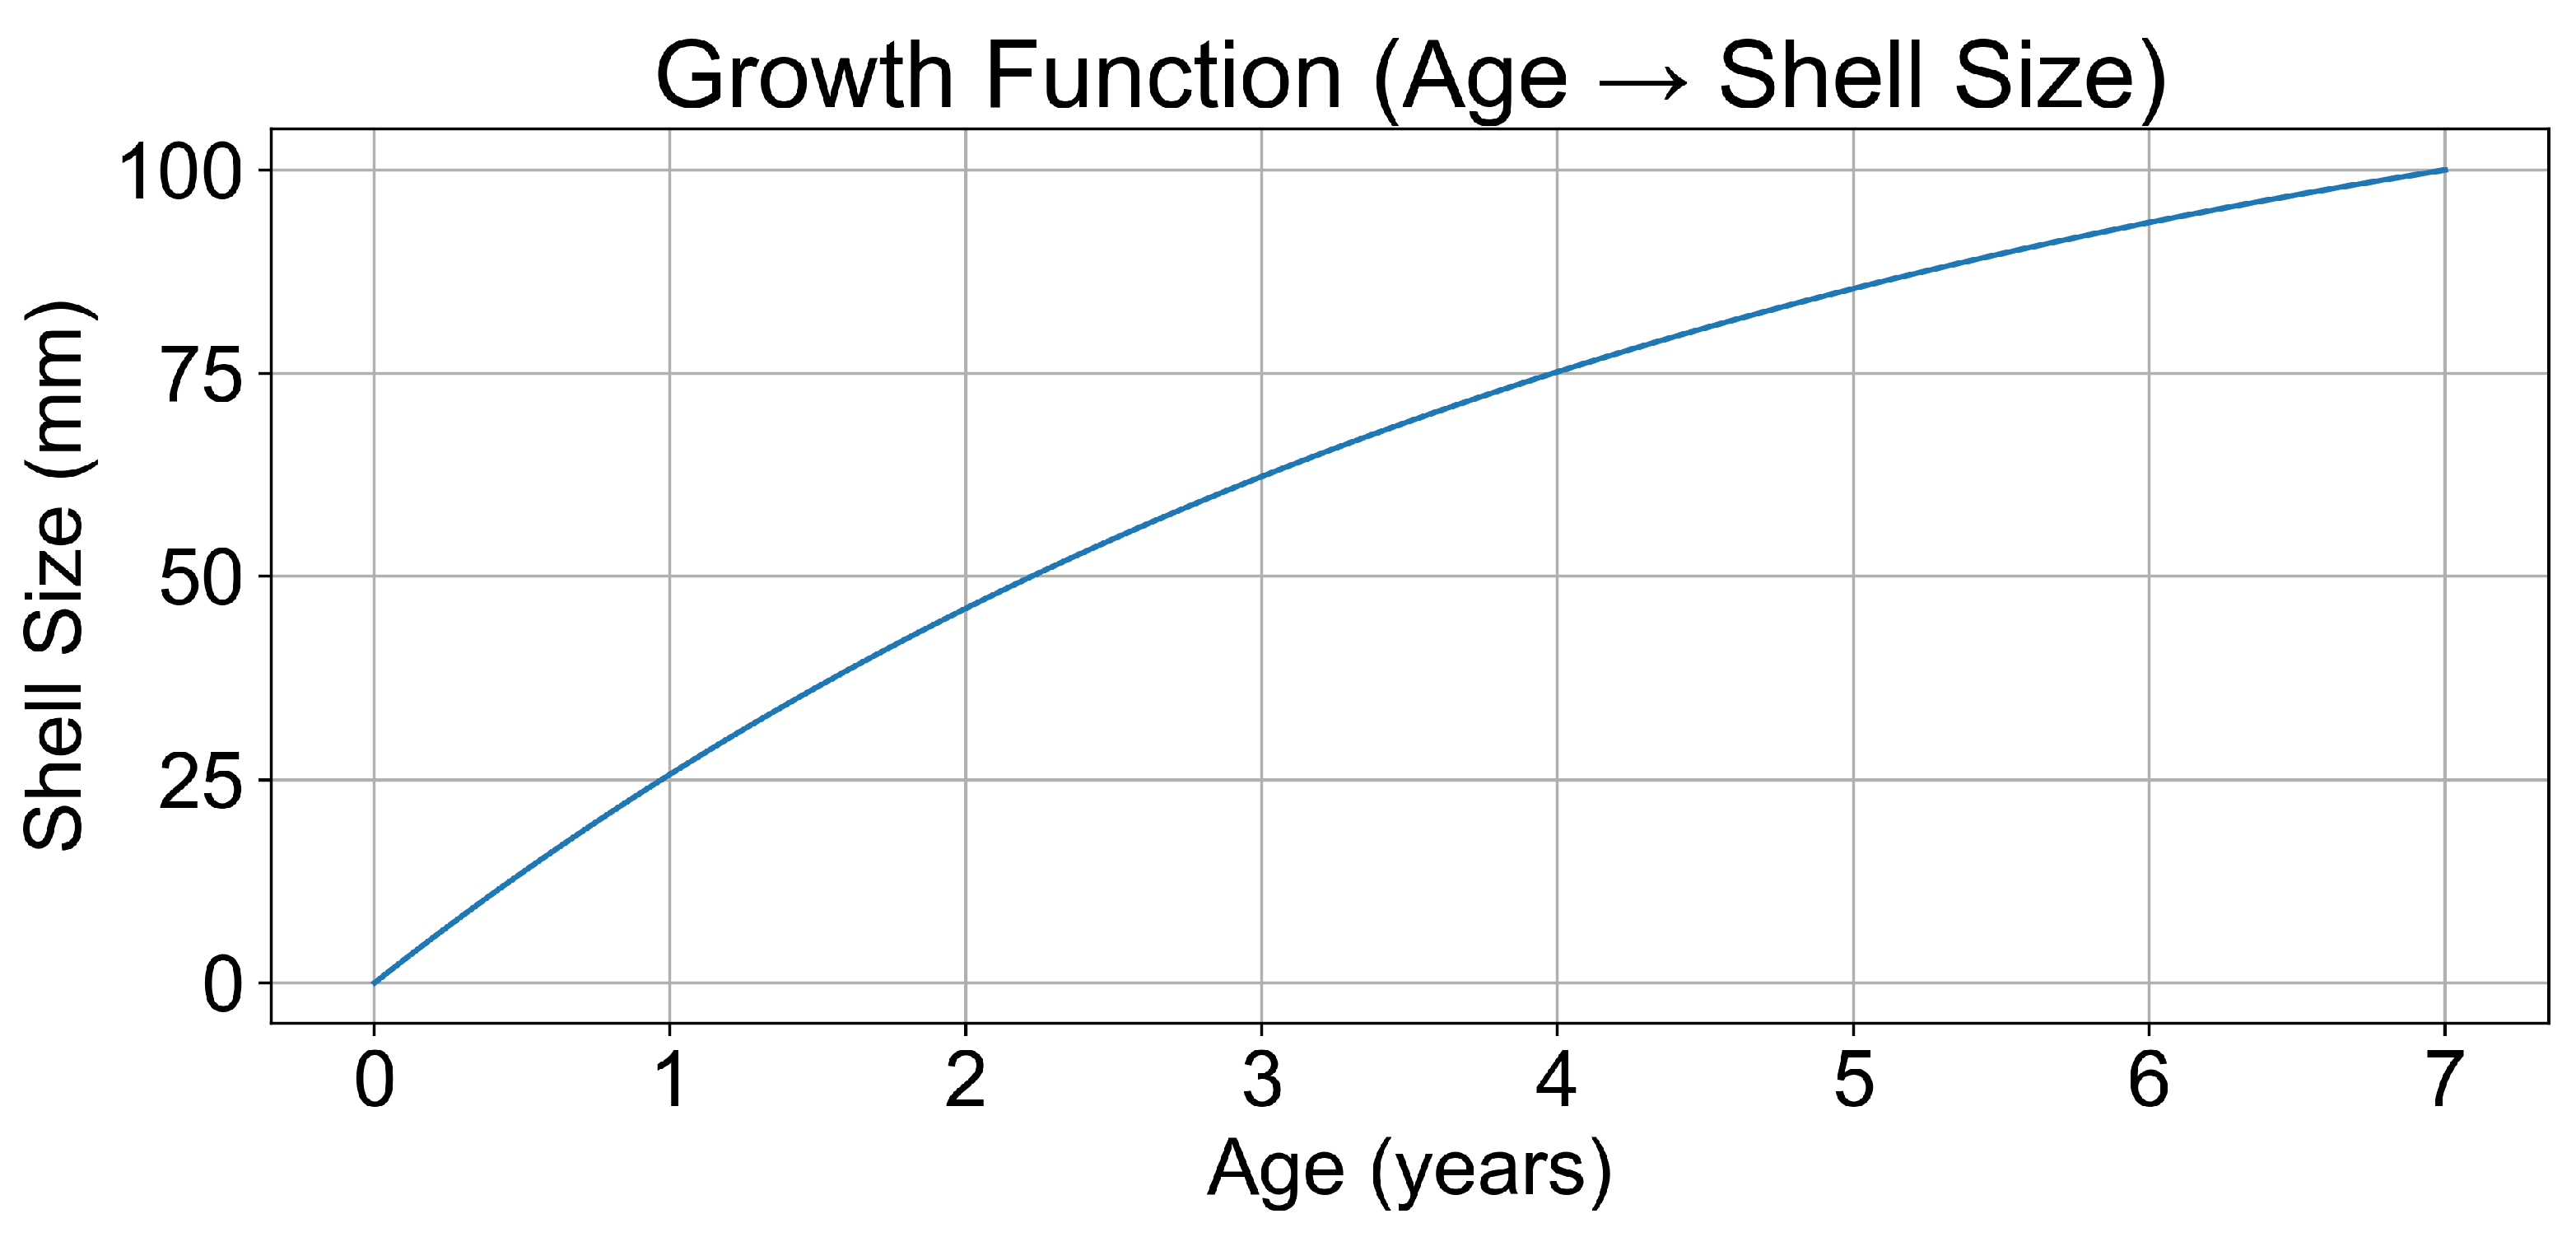
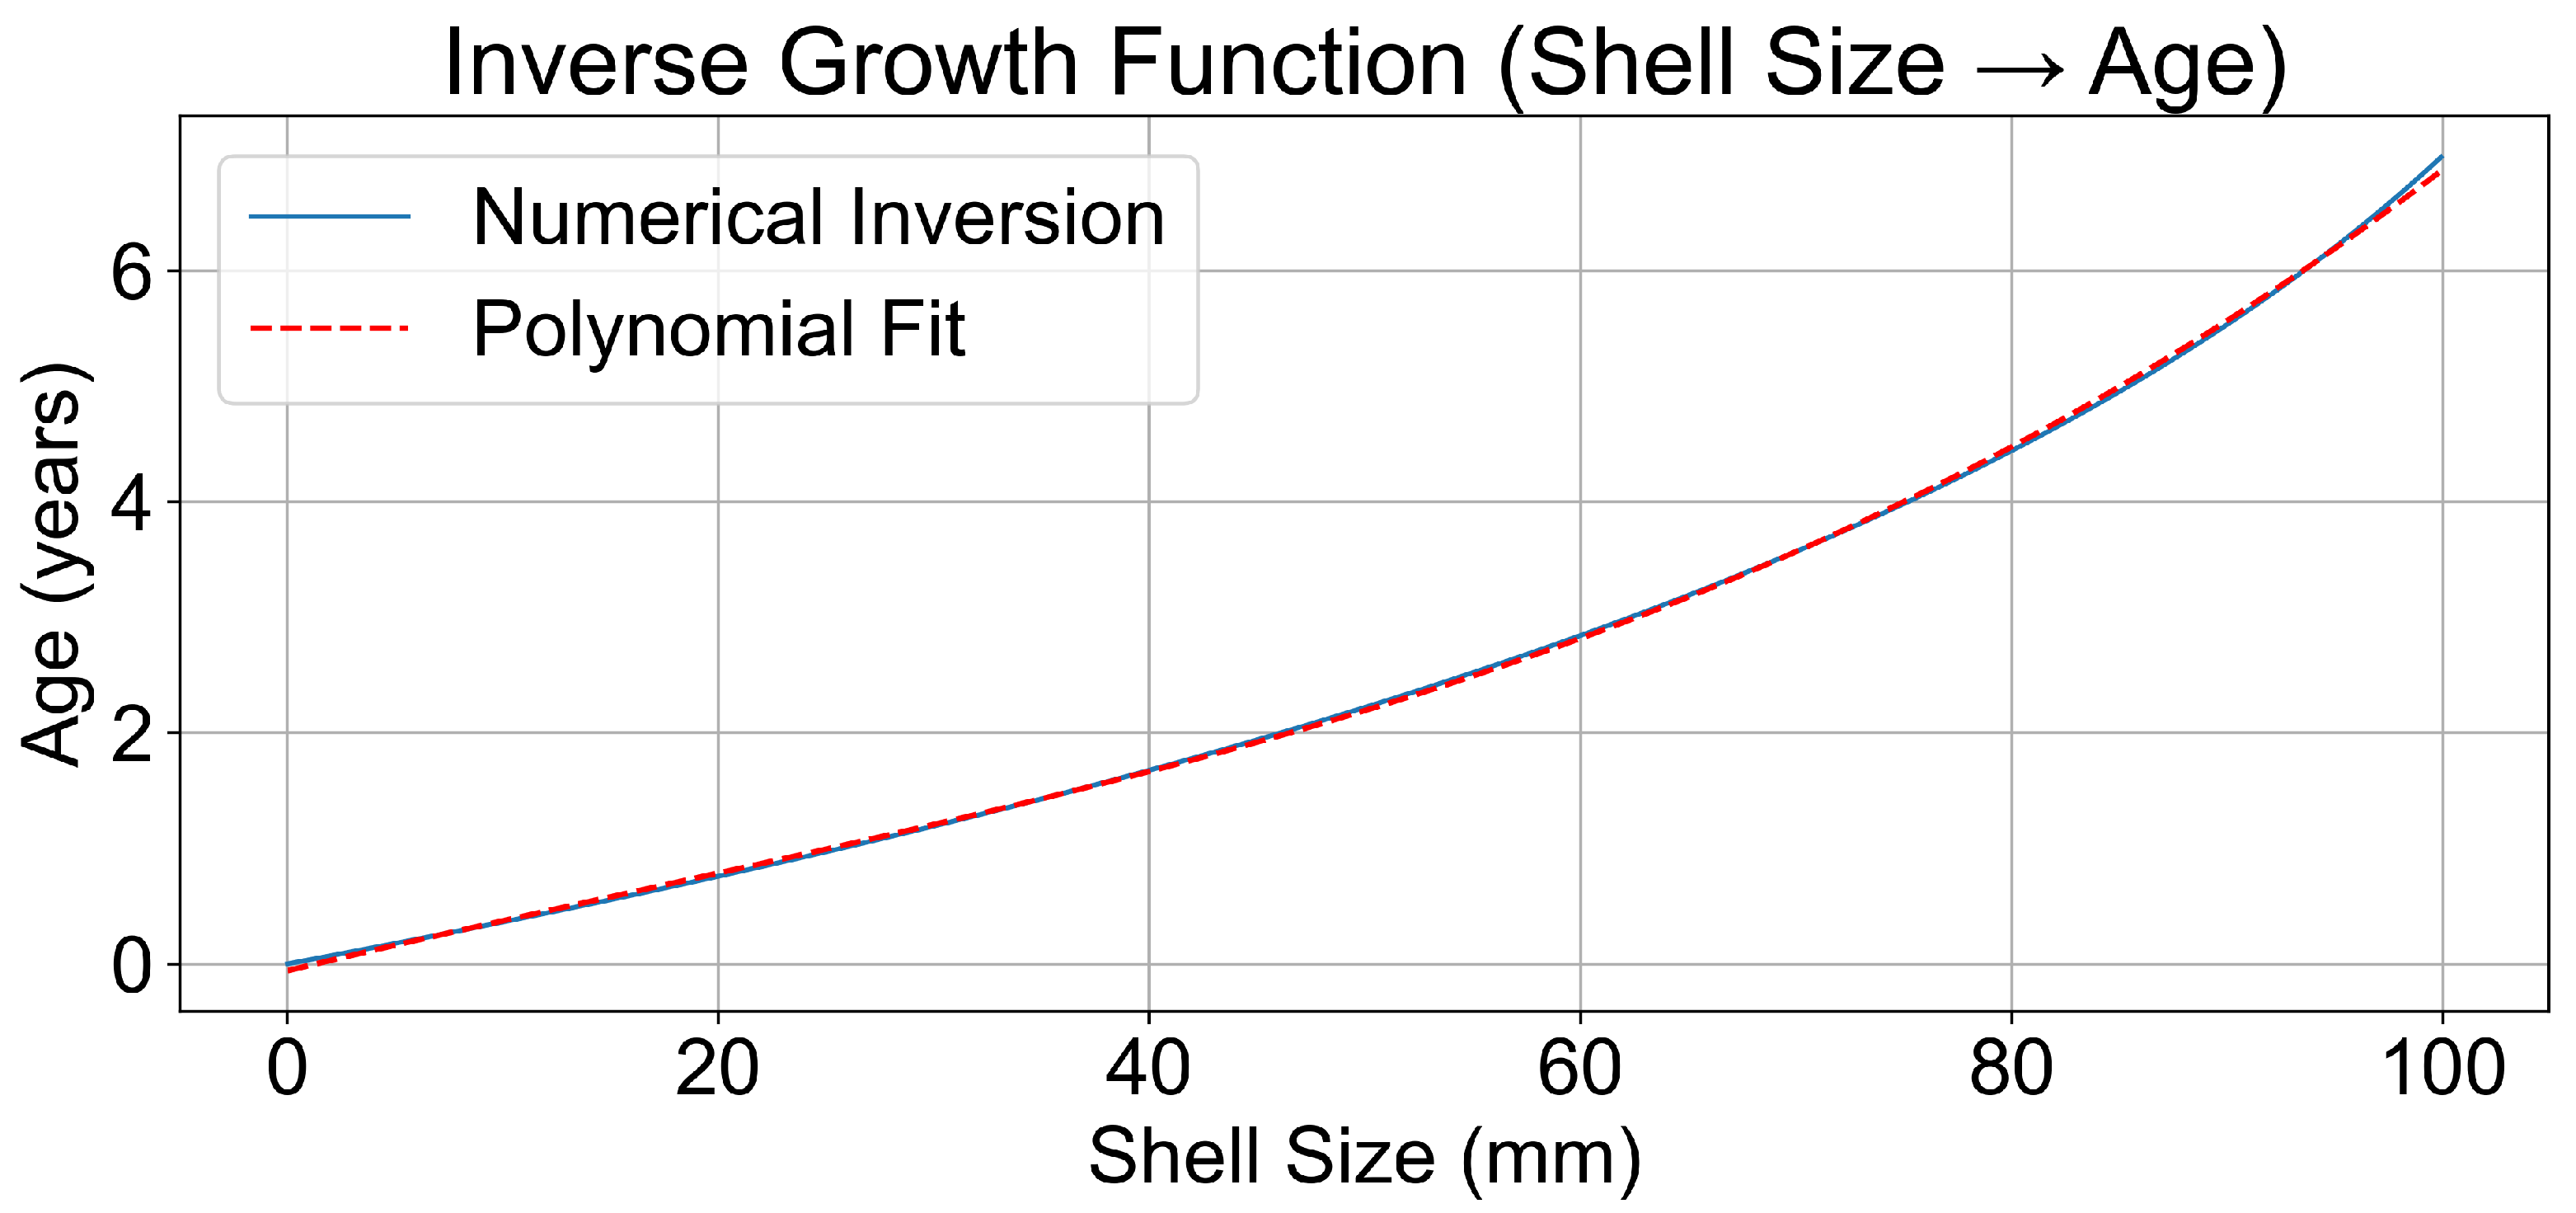
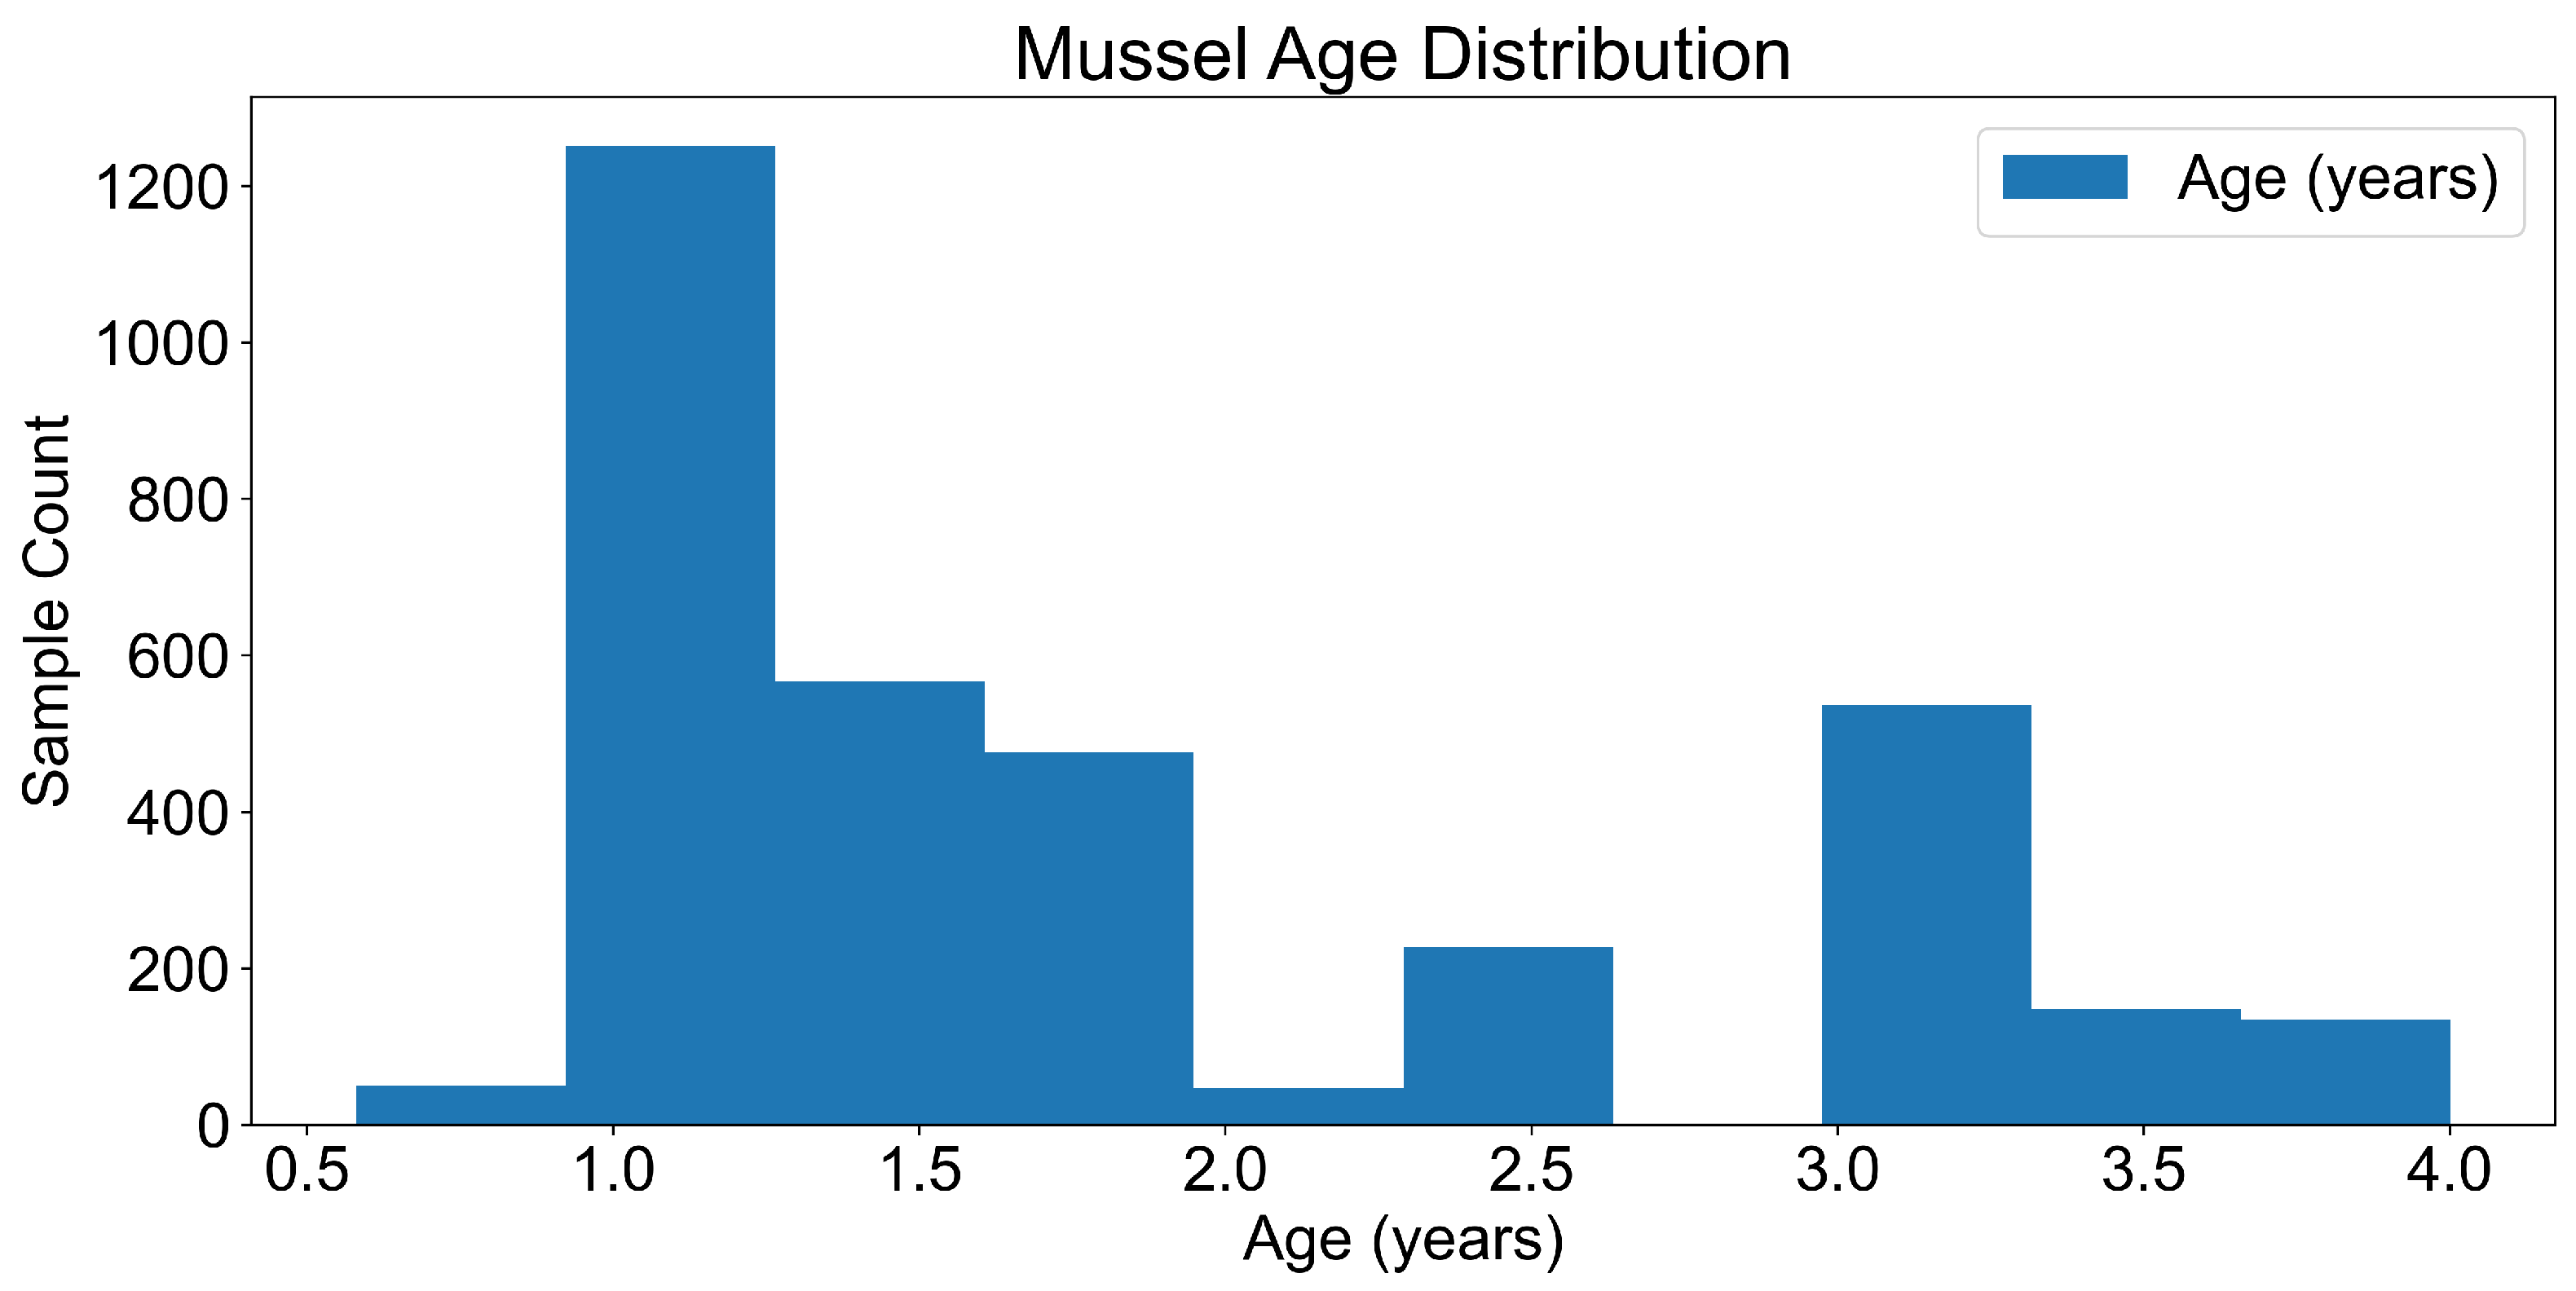
3.1. Growth Patterns in Mytilus galloprovincialis

To estimate the age distribution of the sampled Mytilus galloprovincialis population, we applied the Von Bertalanffy Growth Function (VBGF) to the observed shell length data. The resulting model (Figure 2) depicted a typical growth trajectory, with rapid development during early life stages tapering into asymptotic growth as age increased. The inverse function (Figure 3) enabled us to estimate mussel age from shell length, essential for interpreting age-related microplastic accumulation trends.
The inverse growth function, used to estimate age from size, showed a corresponding increase in estimated age with mussel size (Figure 3). We additionally fitted a third-degree polynomial to the age–length relationship to allow systematic age estimation, with the following equation:
a g e = 4.90511708 × 10 6 s i z e 3 2.50034061 × 10 4 s i z e 2 + 4.53030305 × 10 2 s i z e 5.95602403 × 10 2
This growth model sustained subsequent analyses of bioaccumulation and exposure timeframes.
To estimate the age distribution of the sampled Mytilus galloprovincialis population, the Von Bertalanffy Growth Function (VBGF) was fitted to the observed length data (Figure 2). The model revealed that rapid juvenile growth decreases with age, consistent with expected biological patterns. The polynomial inversion provided a practical means for age estimation in subsequent analyses, described by the equation:
L ( t ) = L × [ 1 e K ( t t 0 ) ]
where L(t) is the length of the mussel at age t, is the asymptotic length (the maximum average length the mussels can reach), K is the growth coefficient (a measure of how quickly the mussels approach their maximum length), and t 0 is the theoretical age at which the length is zero.
In this study, the parameters for the VBGF were set as follows: L = 125 mm, K = 0.23, and t 0 = 0. These parameters were selected based on sample data. Using these parameters, the growth inversion function was calculated to estimate the age of individual mussels based on their length. The inverse function was calculated numerically using the scipy. optimise. minimise function (Nelder–Mead method, tolerance 10 6 ) to minimise the squared difference between the observed size and the size predicted by the VBGF for a given age. This process was performed for a range of shell sizes, from 0 to 100 mm, with increments of 0.1 mm. Figure 2 and Figure 3 illustrate the resulting age–length relationship.
Mussel weight was estimated from size using the polynomial function derived from the relationship between mussel size and wet weight.

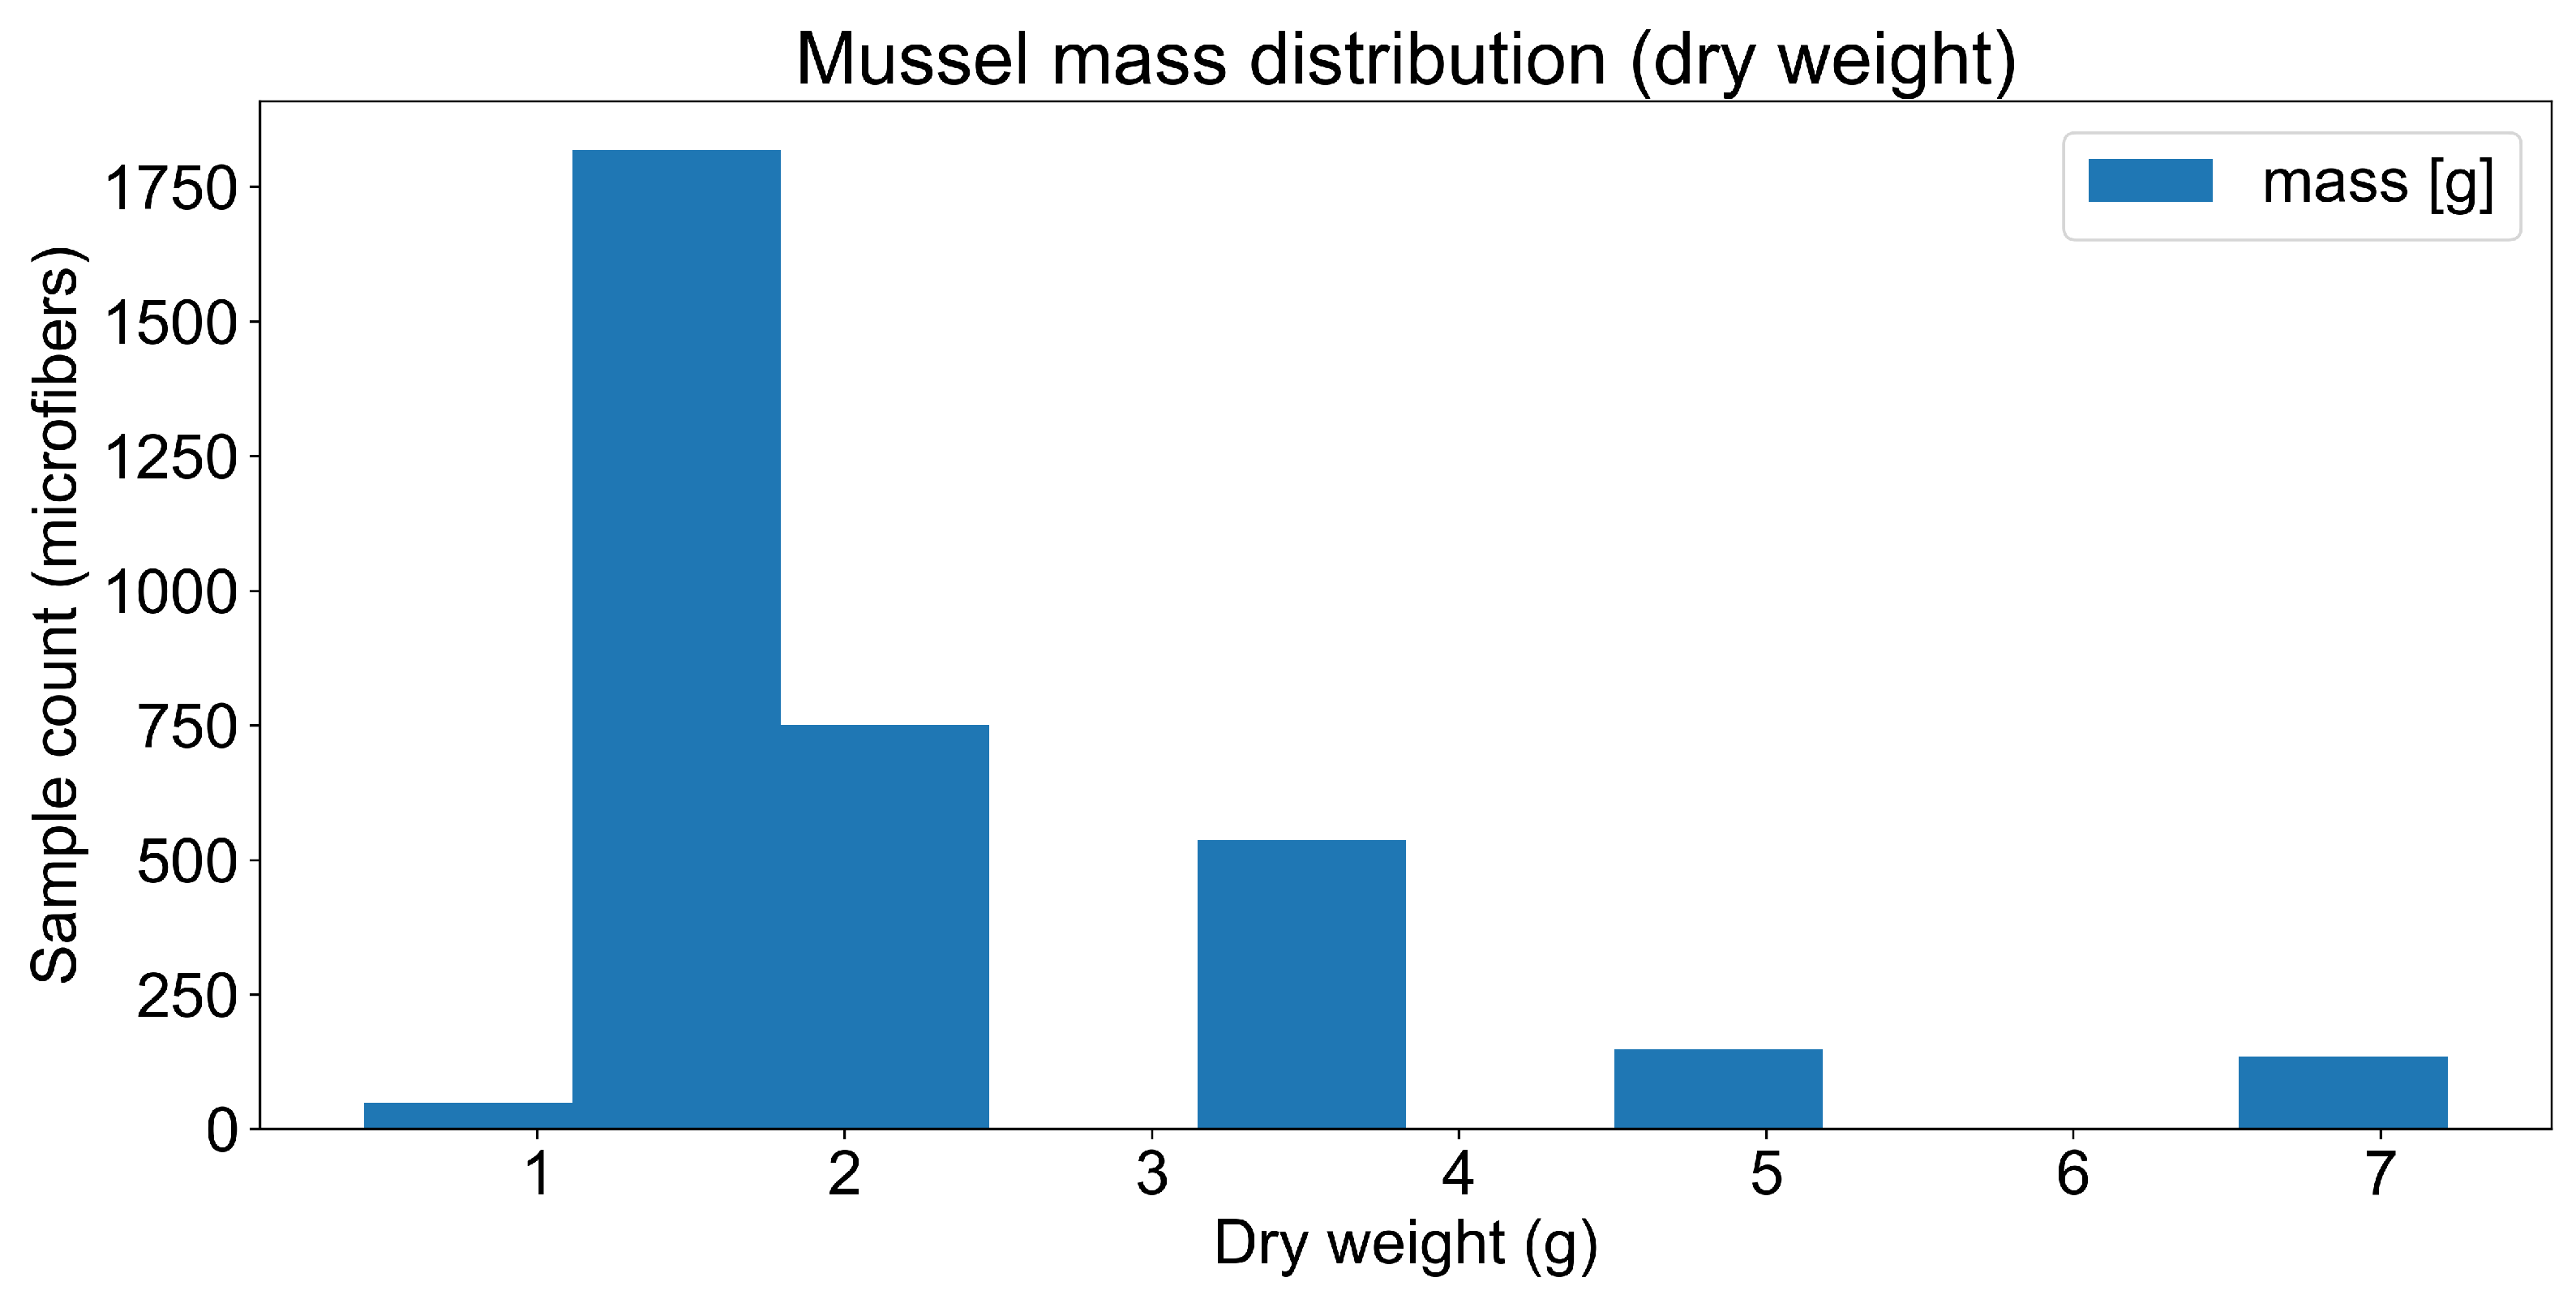
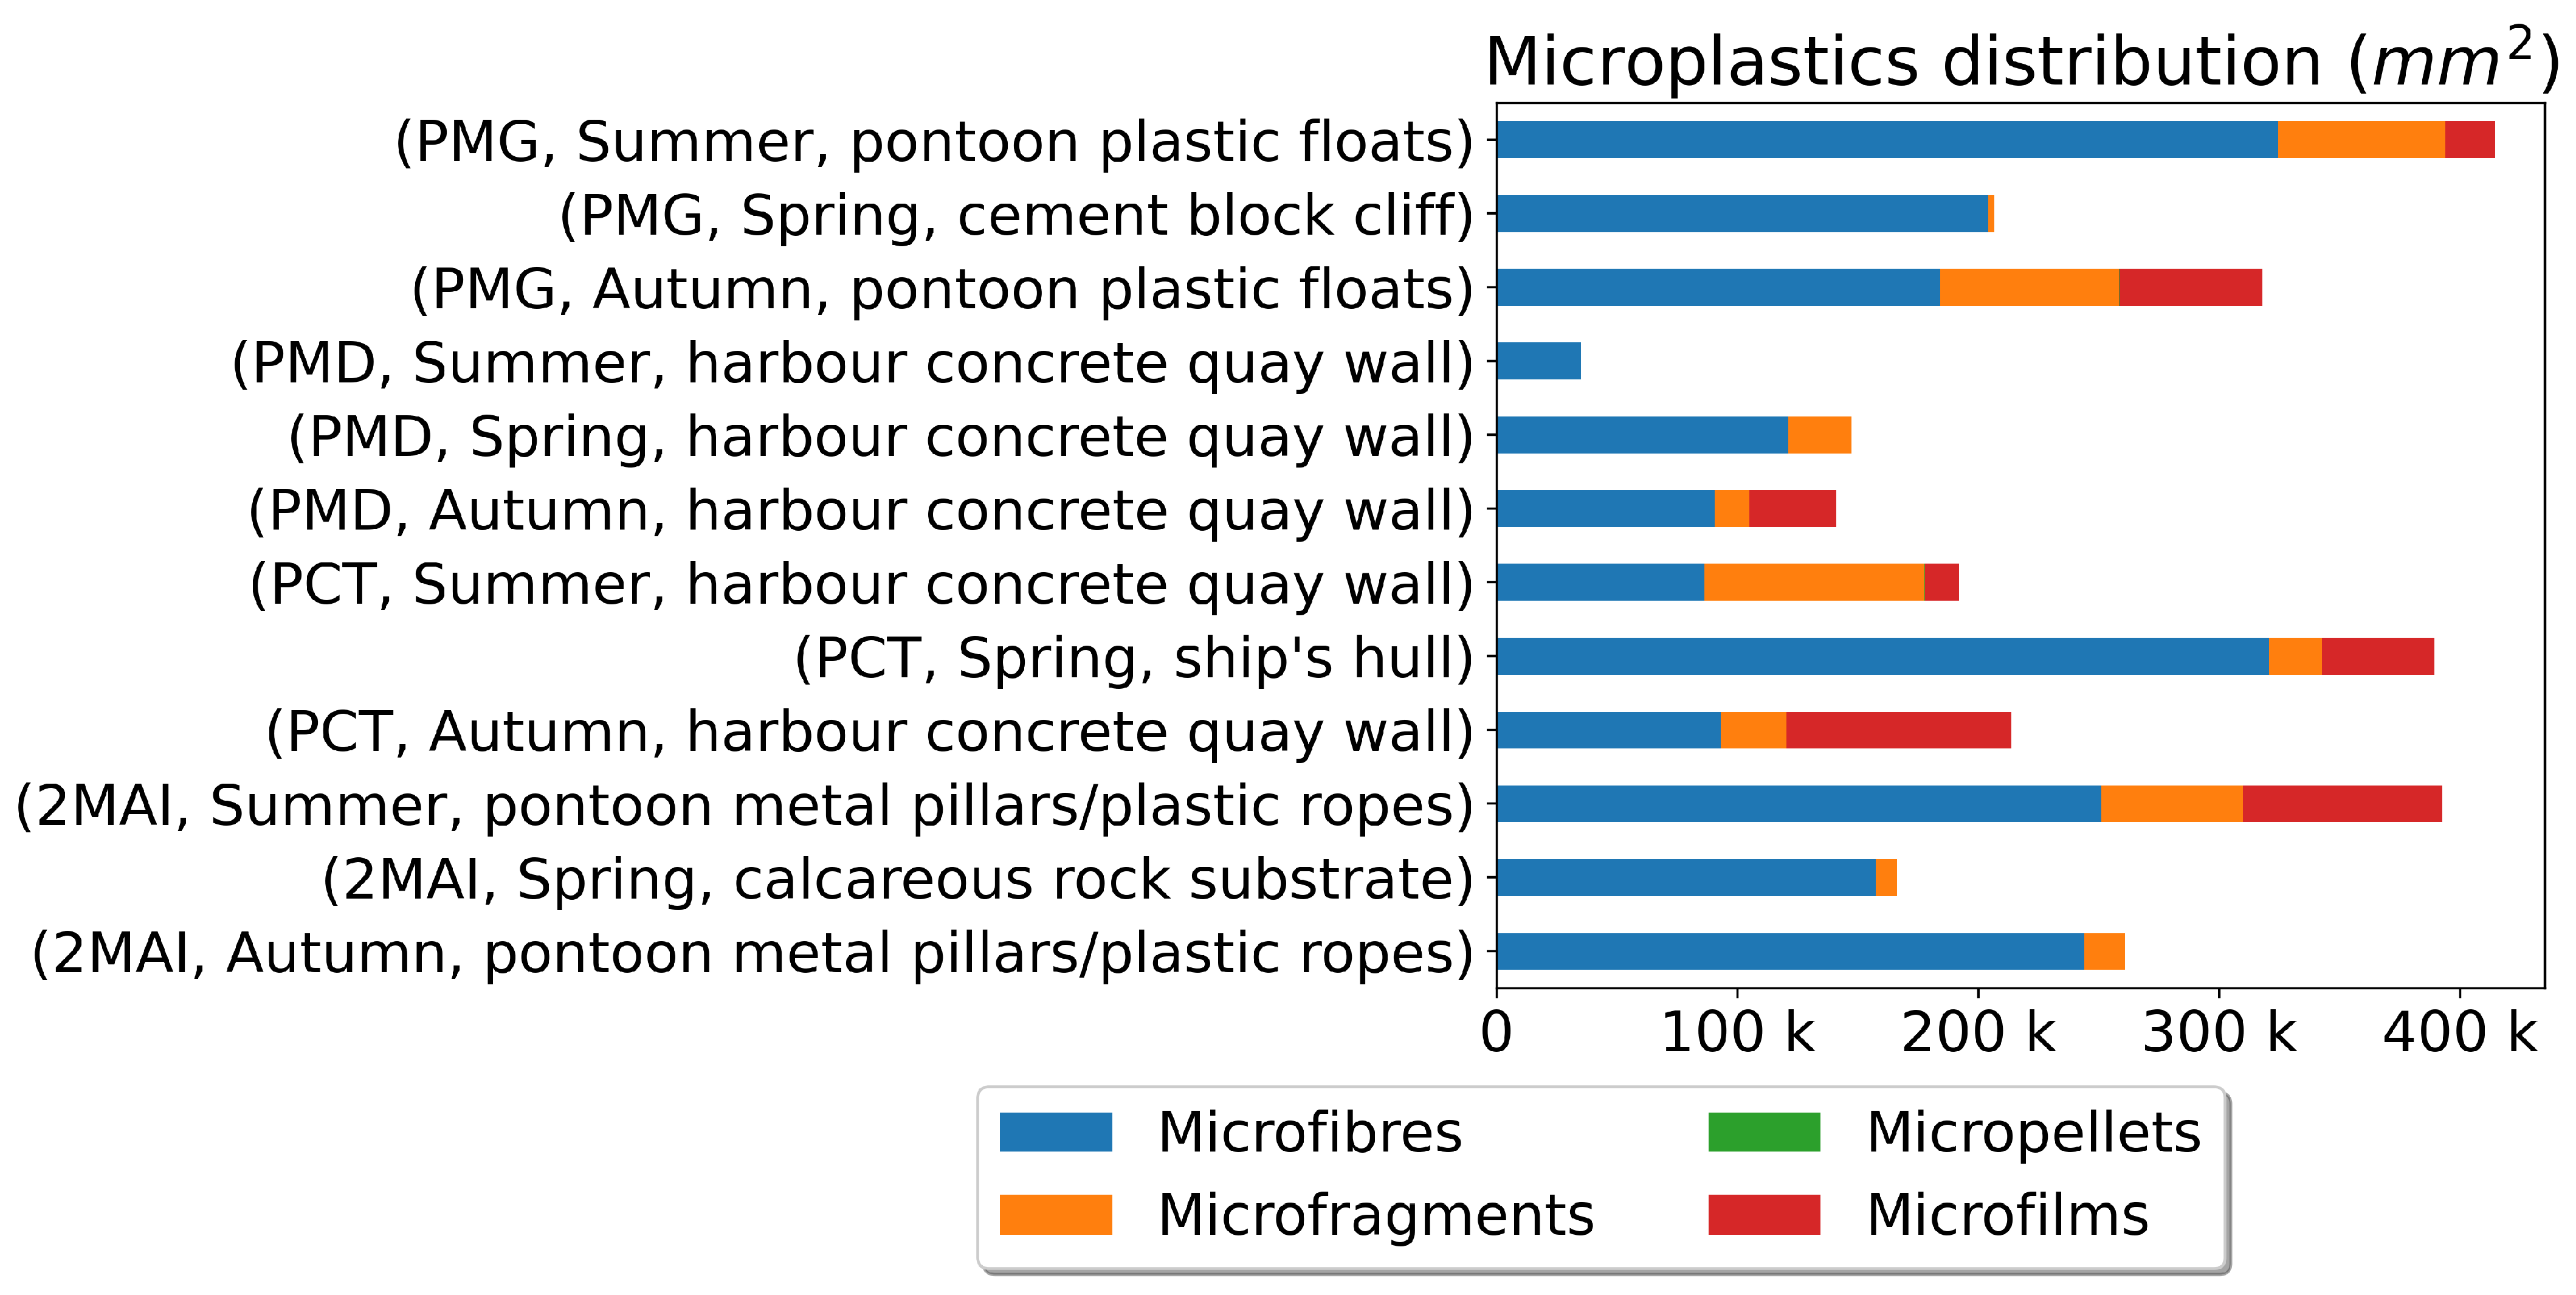
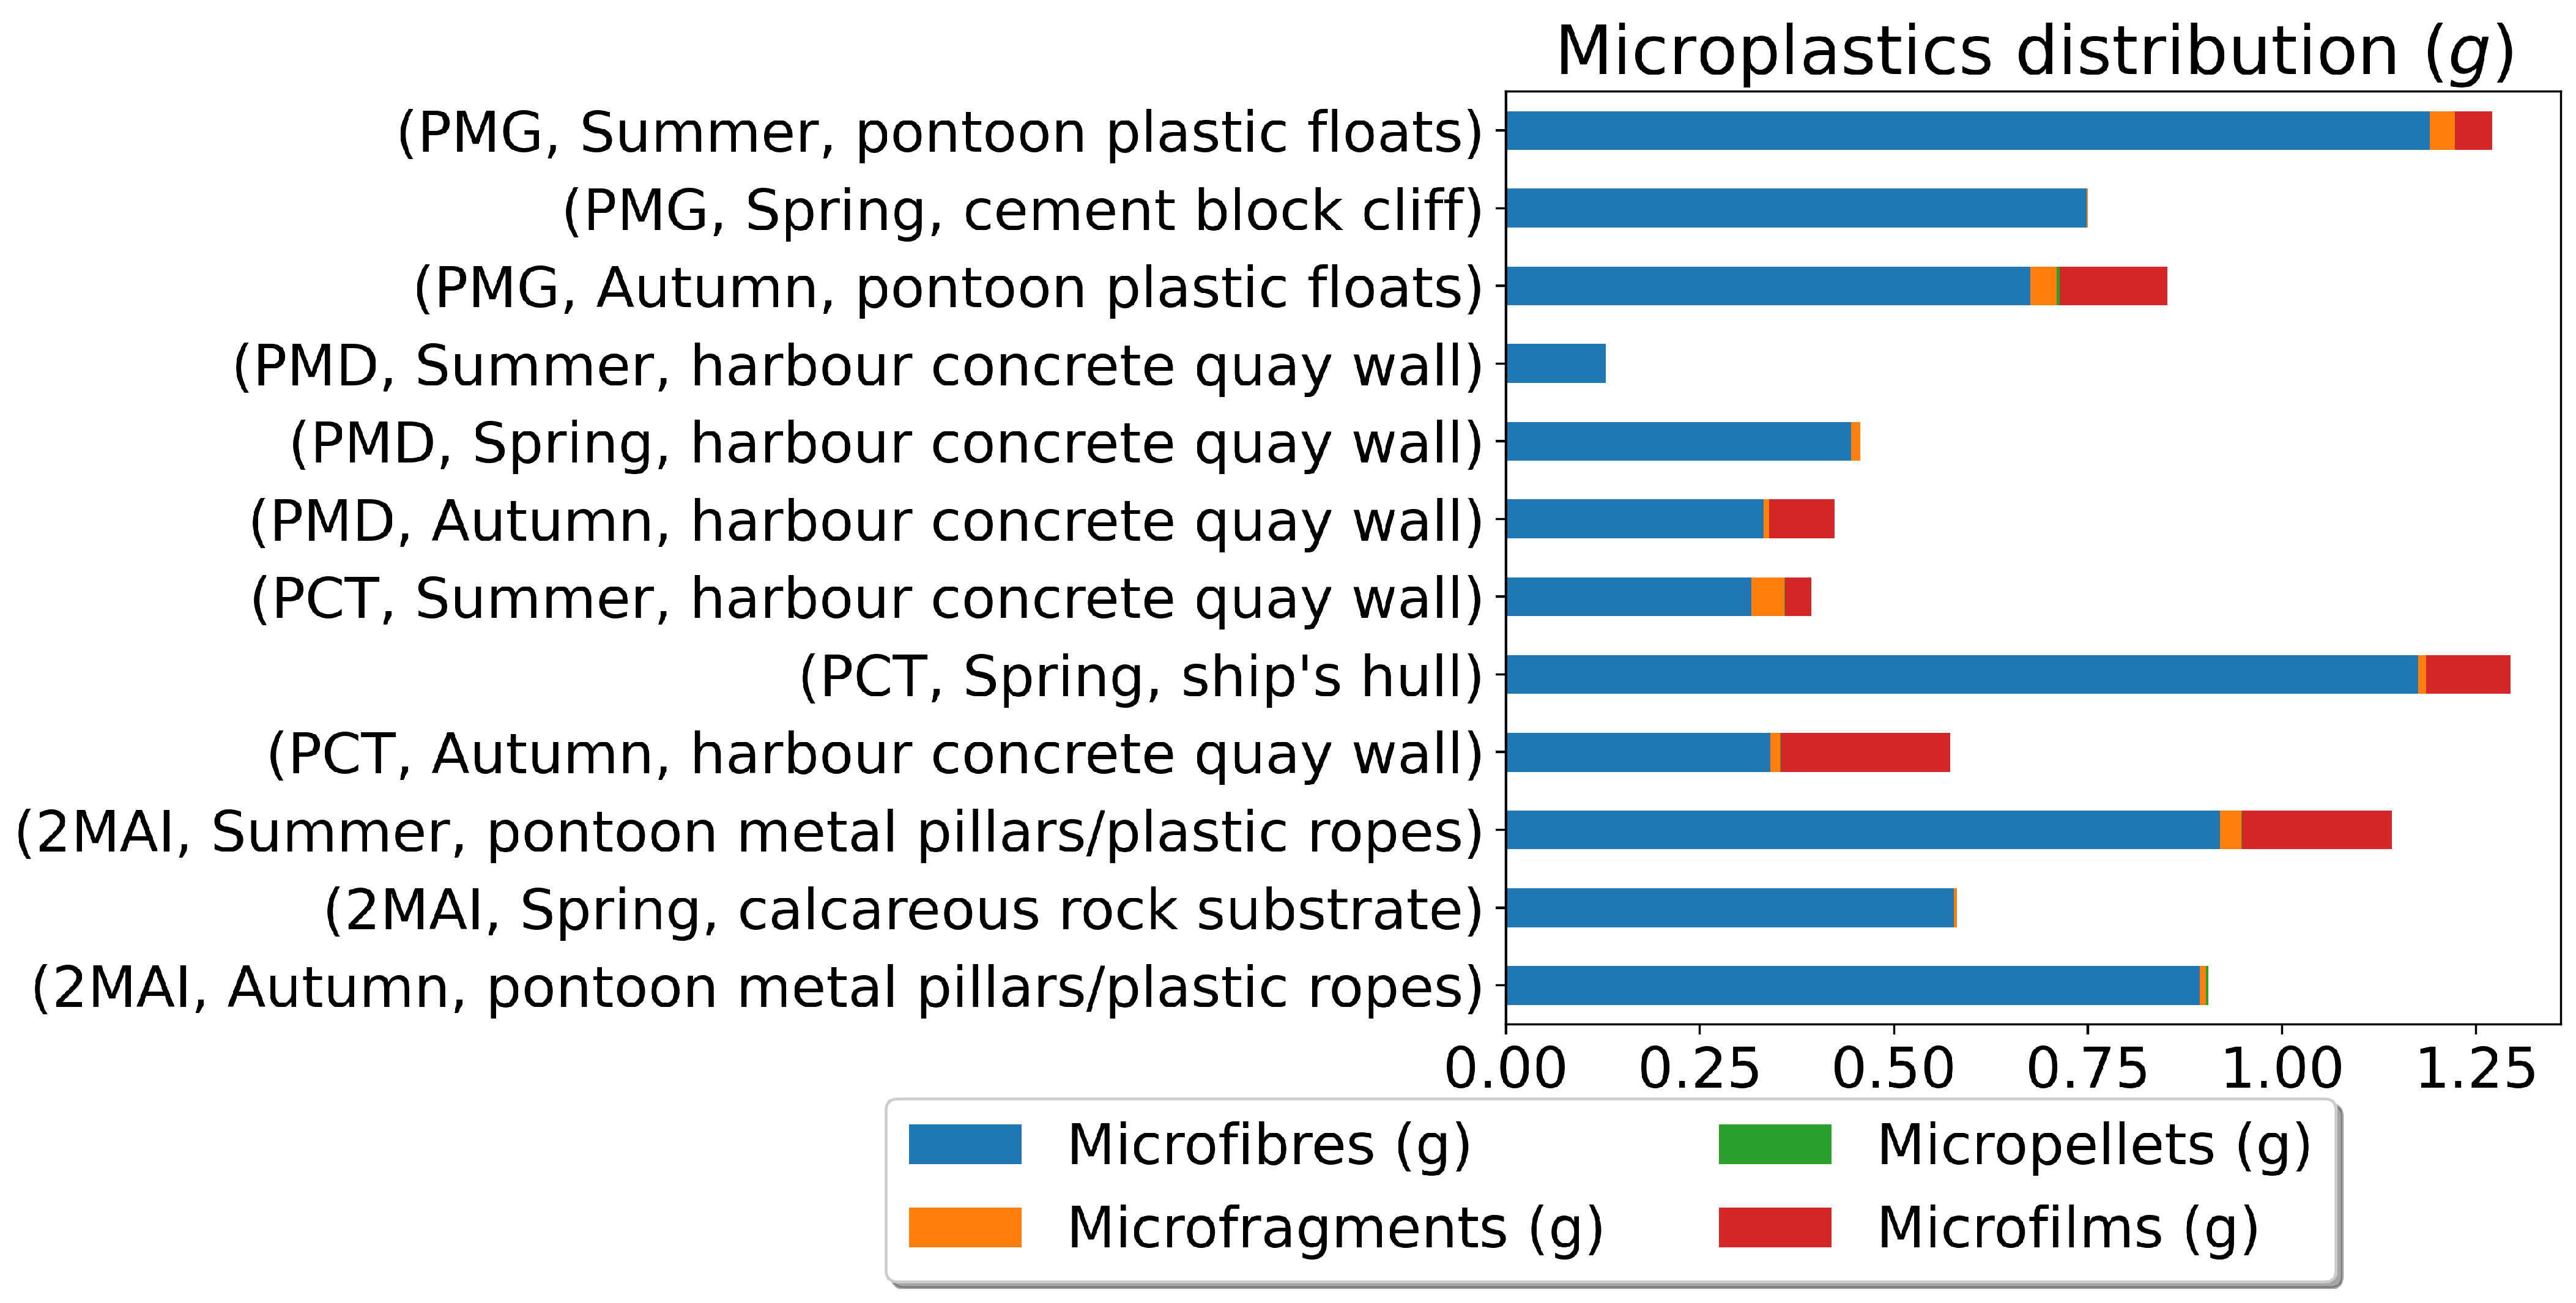
3.2. Mussel Biomass and Microplastic Load

Shell length was also used to estimate mussel wet weight via polynomial regression (Figure 4). This approach was essential for samples with missing direct weight measurements and allowed for consistent normalisation of microplastic loads across specimens.
We processed the microplastic count and type data to estimate the total plastic mass using standard density values (1.4 g/cm3). This transformation enabled the conversion from raw counts to microplastic mass (g), facilitating direct interpretation of environmental risk. The wet weight normalised values showed that most mussels had a body mass between 2 and 4 g (Figure 5), with a predominance of younger individuals aged between 0 and 2 years (Figure 6), confirming the utility of juvenile mussels in bioindicator frameworks.
Mussel weight data were loaded using pandas and averaged across replicates. Samples where weight data were not available were removed. A 4th-degree polynomial function was fitted to the relationship between mussel size and wet weight (Figure 4), and this function was used to estimate mussel weight from size.
Microplastic data were processed to calculate the total amount of microplastics per sample. Using a uniform density value of 1.4 g/cm3 for all microplastic types, specific functions were defined to convert microplastic counts to estimated mass (grams) for microfibres, microfilms, microfragments, and micropellets. The processed data were then used to analyse the distribution of microplastics across sampling stations, seasons, and substrates.

3.3. Statistical Analysis

Descriptive statistics were calculated to assess the distribution of mussel weight and age (Figure 5 and Figure 6). The population was skewed towards younger, smaller individuals, which may reflect recent recruitment events or selective mortality in polluted environments.
Using pandas, descriptive statistics were calculated for mussel age, mass, and microplastic quantities. Data visualisations, including histograms and stacked bar plots, were generated using matplotlib to explore the distribution of mussel characteristics and microplastic pollution (Figure 5, Figure 6, Figure 7 and Figure 8).
The majority of mussels had a wet weight ranging from 2 to 4 g. The distribution is right-skewed, indicating that smaller mussels were more abundant in the samples (Figure 5). The majority of mussels were estimated to be between 0 and 2 years old, with the number of individuals decreasing as age increased (Figure 6).
The highest microplastic levels were consistently found at PCT (Constanta Port), particularly in samples from ship hulls during the spring. This suggests that shipping activities represent a significant source of microplastic pollution. The lowest levels were observed at 2MAI (Vama Veche-2 Mai Marine Reserve), indicating that this protected area experiences less microplastic contamination compared to the port areas (Figure 7 and Figure 8). The distribution of microplastic sizes and types also varied across the sampling locations, suggesting different pollution sources or accumulation patterns.

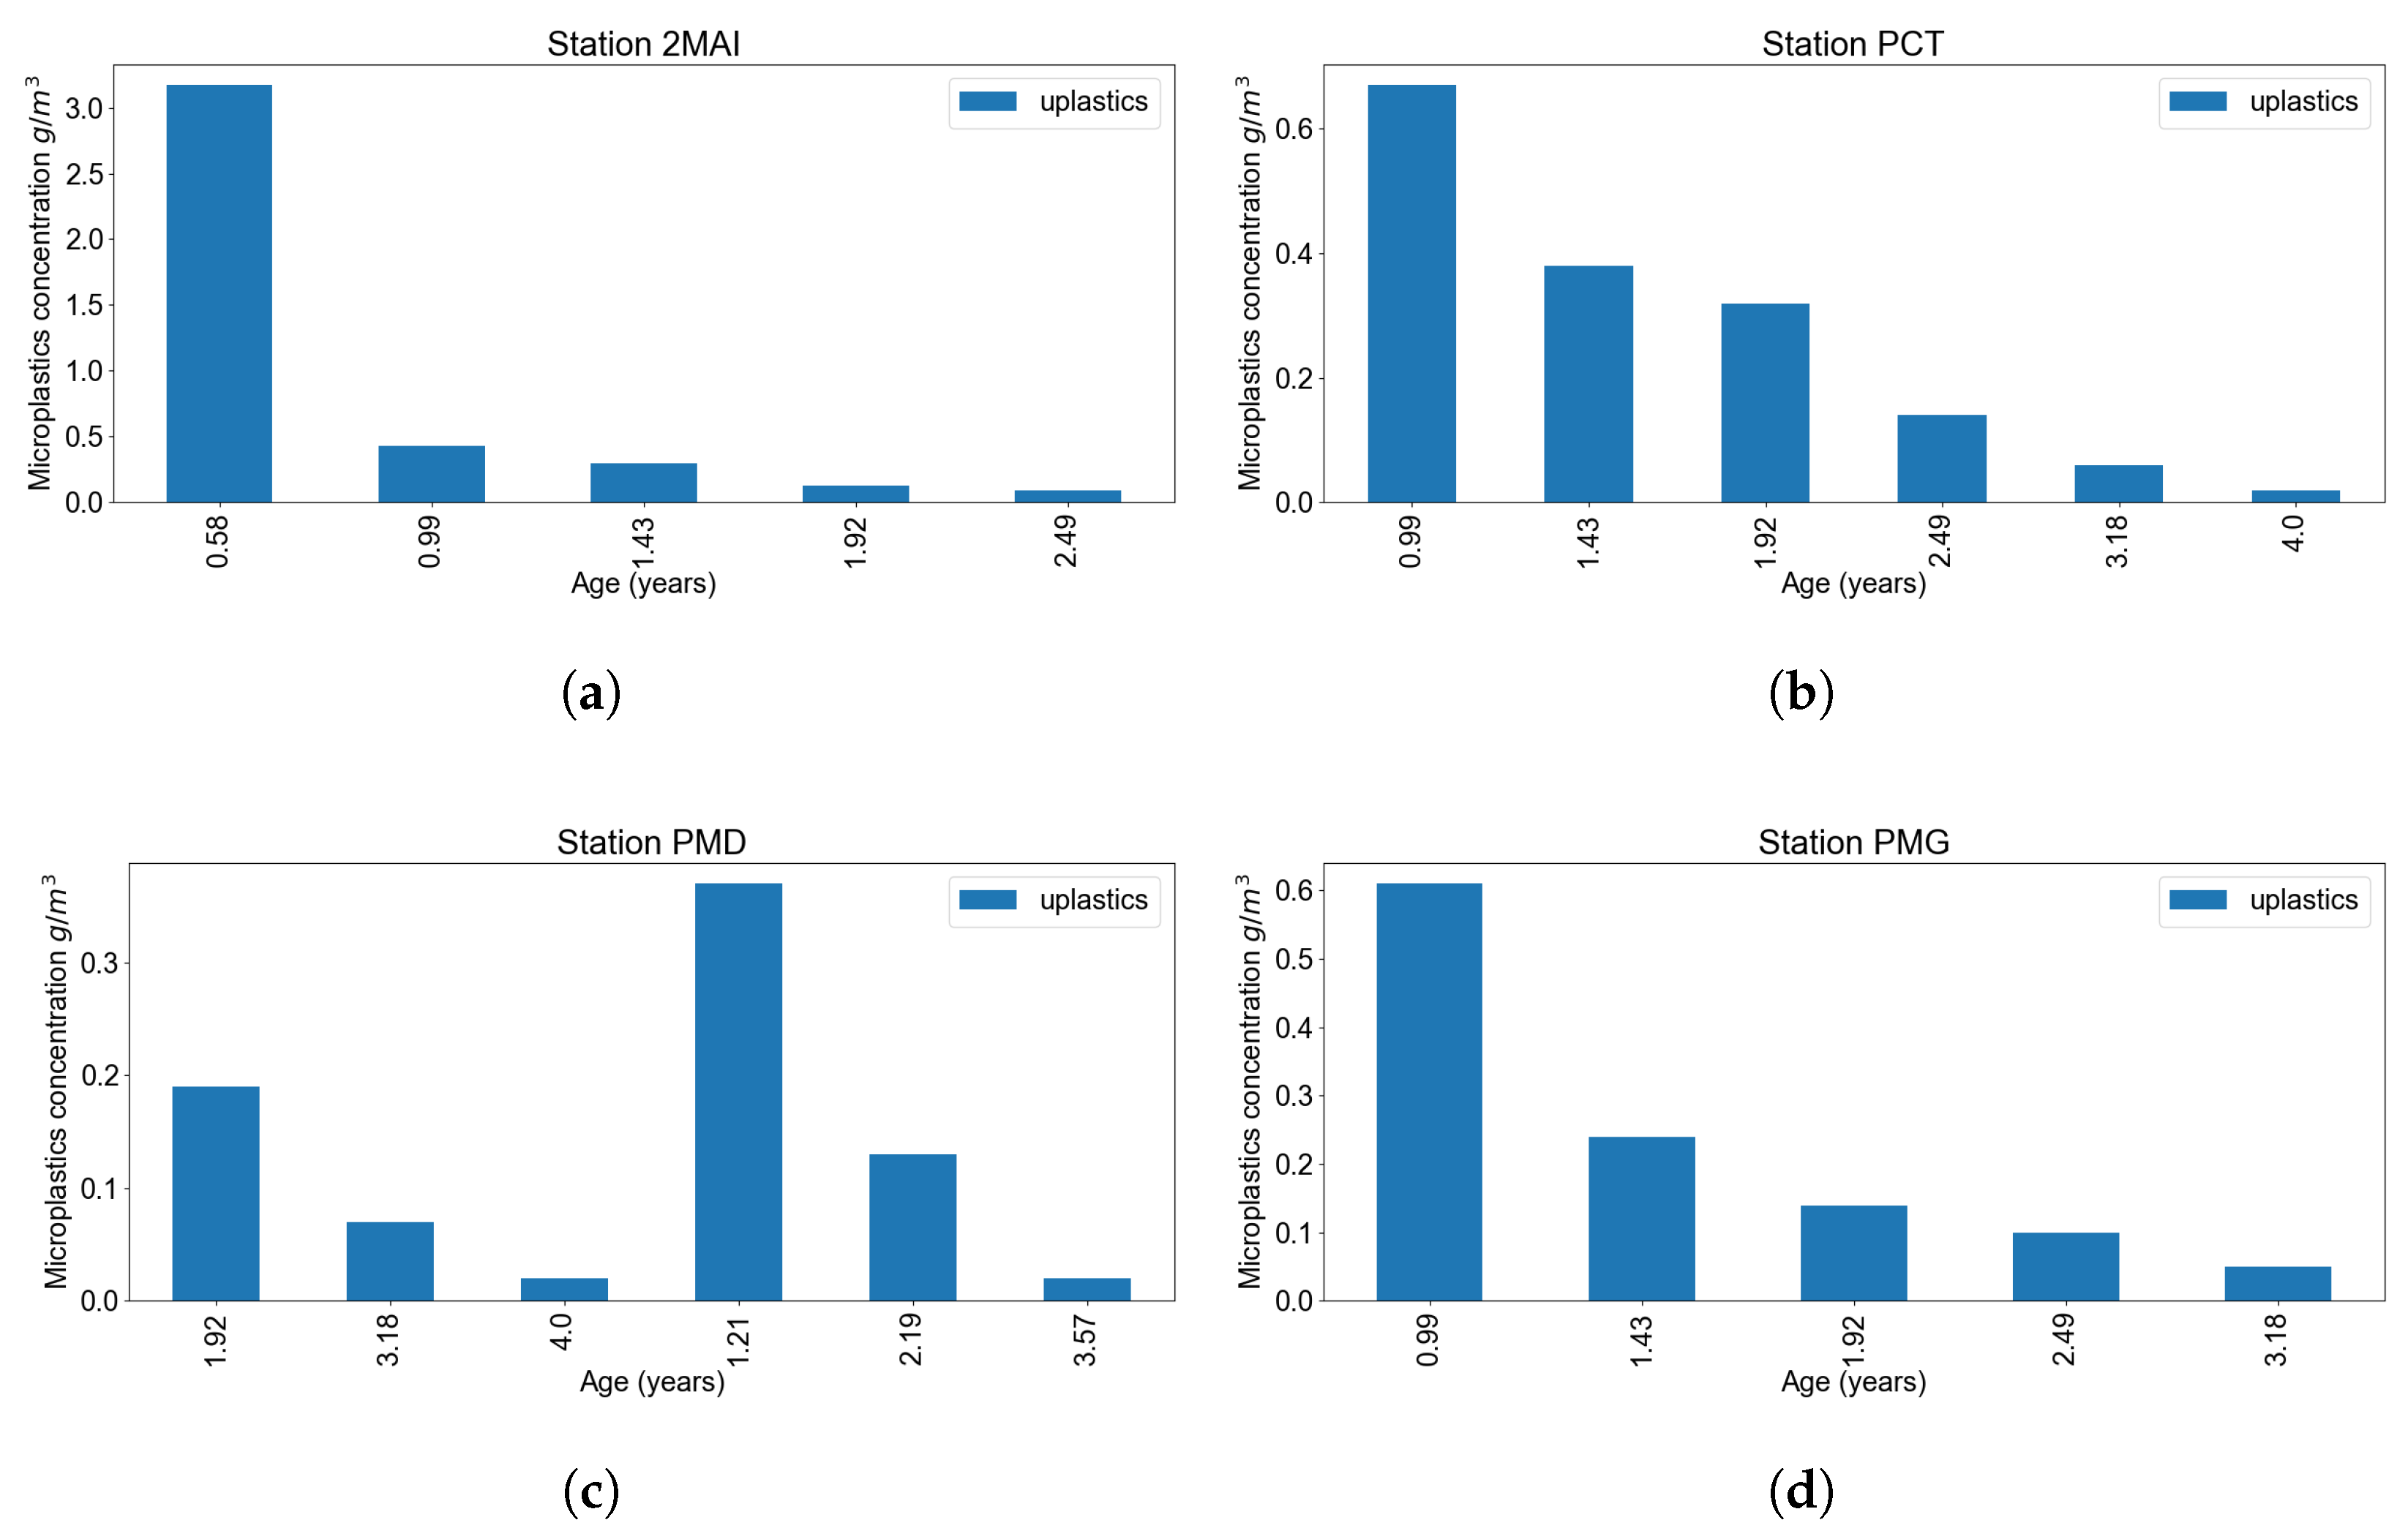
3.4. Lifetime Ingestion Estimate

Lifetime microplastic ingestion was estimated using modelled filtration rates. This normalisation highlighted variation in exposure efficiency across stations and size classes (Figure 9), accounting for variations in microplastic exposure due to mussel physiology.
The lifetime water ingestion for each mussel was estimated from its estimated mass, assuming a retention coefficient of 0.013, using the following formula:
l i f e t i m e _ i n g e s t i o n = 364 × 24 × m u s s e l _ m a s s × 0.3 0.013
The microplastics mass was then normalised by the estimated lifetime ingestion to compare microplastics accumulation across samples (Figure 9).
Figure 9 shows the amount of microplastics that mussels ingested during their lifetime. Figure 9 indicates that the microplastics mass normalised by the estimated lifetime ingestion allows us to compare microplastics accumulation across mussels, accounting for differences in how much water they have processed. The relationship between microplastic mass and estimated lifetime ingestion could provide insights into the bioaccumulation of microplastics in mussels and how it relates to their feeding behaviour and lifespan.

3.5. Predictive Modelling of Microplastic Accumulation

To evaluate predictive capabilities, a surrogate model was trained on synthetic data derived from the experimental distributions. Despite the limited size of the real dataset, the final model achieved acceptable predictive accuracy (MAE: 0.06 years for age, 0.08 g/m3 for concentration), as shown in Table 5.
Our predictive modelling workflow involved several key stages. First, based on our experimental findings from the three measurement campaigns in 2018, we categorised microplastic concentrations into distinct classes based on their morphology: microfibres (cylindrical), microfragments (volumetric, measured by width and height), micropellets (larger spherical), and microfilms (thin, two-dimensional sheets). We then applied a standard conversion method to estimate the actual detected mass of microplastics within the chemically digested mussel tissue, normalising it to the mussel’s wet weight (as detailed in Section 3.2).
Next, the age of the mussel was estimated from its size using the Von Bertalanffy Growth Function (VBGF) and its polynomial inversion (Section 3.1). Then, the mussel’s lifetime digested water volume was calculated from its estimated mass and a retention coefficient, as shown in Equation (3) (Section 3.4). Finally, the average microplastic concentration within this lifetime-ingested water was determined by normalising the estimated microplastic mass by the estimated lifetime ingestion. These derived parameters, along with raw mussel size, sampling location (encoded as latitude and longitude), and encoded substrate type, served as the input features for our machine learning model (as detailed in Table 3).
The key to our predictive modelling was the development of a surrogate machine learning model. This regression model was considered to predict two key target variables: the age of the mussel (in years) and the average microplastic concentration (g/m3) in the water ingested by the mussel over its lifetime. The model was trained on a large synthetic dataset (87,652 records) generated from the distributions of our experimental data. As outlined in Section 3.2, a Random Forest regression algorithm was selected and hyperparameter-tuned due to its robust performance on our specific problem. The results of this predictive modelling are summarised in Table 5. The model achieved acceptable predictive accuracy, with a mean absolute error (MAE) of 0.06 years for age and 0.08 g/m3 for microplastic concentration. The precision for uncertainty determination, based on the mean absolute error (MAE), was determined to be 11%. This illustrates the model’s capability to provide reliable estimates of these parameters based on readily available input metrics, even with a limited initial real dataset.
Starting from the experimental results obtained during three measurement campaigns in 2018, the microplastics concentration is divided into certain classes, such as microfibres that are cylindrical fibres, microfragments that are volumetric and usually measured using the width and height, micropellets that are larger, and microfilms that are also bidimensional with a small thickness. We investigated the measured values and provided a conversion to the actual detected mass of microplastics within the chemically digested mussel (thus, the wet weight). Once we had computed the weight of the plastic, we calculated the mussel’s age, and with this parameter, we determined the mussel’s lifetime digested water and the average lifetime concentration of microplastics in it.
Table 5 summaries the experimental data while performing yearly averages.
To evaluate the predictive capabilities, a surrogate model was trained on synthetic data derived from the in situ distributions. Despite the limited size of the real dataset, the final Random Forest model achieved acceptable predictive accuracy (MAE: 0.06 years for age, 0.08 g/m3 for concentration) and robust explanatory power (R2: 0.95 for age, 0.88 for concentration), as shown in Table 5. The model’s robustness and generalization capability were ensured through systematic hyperparameter tuning, incorporating k-fold cross-validation, confirming its performance across different data subsets. Based on the given results, using the mean absolute error (for uncertainty determination), we obtain a precision of 11%.

4. Discussion

In this study, we investigated the spatial and age-dependent accumulation of microplastics in Mytilus galloprovincialis along the Romanian Black Sea coast, integrating empirical bio-monitoring with machine learning-based predictive modelling. We sought to evaluate the spatial and age-dependent accumulation of microplastics in Mytilus galloprovincialis collected from four representative sites along the Romanian coast of the Black Sea, including sites of intense maritime traffic (harbours) and a marine reserve. Our results provide new insights into how microplastic exposure varies across mussel life stages and geographical locations, as well as how predictive modelling can enhance environmental assessments. Recent studies have reported concerning trends regarding the accumulation of microplastics in various marine species, predominantly in filter-feeding organisms, such as mussels. This discussion elaborates on the mechanism behind microplastic accumulation, the factors influencing spatial and age-dependent variations, and the implications for environmental assessments through predictive modelling.
Microplastics are widespread in marine environments and have been shown to affect bivalves, particularly Mytilus galloprovincialis, due to their filtering nature, which allows the ingestion of particulate matter from the surrounding water column. Mussels can accumulate microplastics in their tissues, potentially affecting their physiological health and reproductive capabilities. Pittura et al. (2018) identified that microplastics can act as vectors for harmful pollutants, such as polycyclic aromatic hydrocarbons (PAHs), which can accumulate in bivalve tissues, aggravating environmental stress suffered by these organisms [26].
Age and size are key in influencing an organism’s ability to accumulate microplastics. Research conducted by Pizzurro et al. (2023) suggests that while there is no significant correlation between the number of microplastic particles and the weight of mussels, the age of the mussel is likely a more pertinent factor influencing accumulation rates [4]. Younger specimens may exhibit different feeding behaviours and higher metabolic rates compared to older mussels, leading to variations in microplastic uptake. Additionally, the physiological condition of mussels can vary spatially due to environmental factors such as water currents, sedimentation patterns, and local pollution levels, further influencing microplastic accumulation. These spatial variations have been documented along various coastlines, including the Black Sea [3].
To explain the spatial dynamics of microplastic distribution, modelling approaches have been identified as practical methods for predicting and assessing microplastic accumulation in marine organisms. Stamataki et al. (2020) developed a Dynamic Energy Budget (DEB) model specifically for Mytilus spp., which allows for the integration of biological responses to microplastic ingestion and accumulation within the broader ecological context [25]. This model can be applied to conduct predictive assessments of microplastic impacts across various coastal regions, taking into account factors such as temperature, salinity, and nutrient availability, which are crucial for understanding the physiological responses of marine organisms to microplastic exposure. Examining microplastics in bivalves provides invaluable insights into the ecological health of marine environments, particularly in regions like the Black Sea, where pollution levels are concerning. It is crucial to acknowledge Mytilus galloprovincialis as a key bioindicator species, as demonstrated in the works of Georgieva et al. (2016) [37] and Ibryamova et al. (2022) [21], which highlight its role in monitoring the accumulation of microplastics and other pollutants. Continued examination of microplastics within Mytilus galloprovincialis is dynamic, especially regarding human health risks, given the consumption of contaminated shellfish. Studies conducted by Peycheva et al. (2021) [38] emphasise the importance of public awareness regarding the potential for bioaccumulation of harmful substances through the marine food web, highlighting the need for effective food safety regulations and public health initiatives.
In most stations, we observed an evident inverse relationship between mussel age and microplastic concentration in the volume of the water ingested. Younger individuals consistently accumulated higher microplastic loads, homogenised by their estimated lifetime filtration. At Station 2MAI (marine reserve), mussels under one year of age displayed concentrations exceeding 3 g/m3, which was significantly higher than in urbanised areas. Similarly, early-stage individuals in PCT and PMG had high microplastic loads (∼0.6–0.7 g/m3). These findings align with physiological expectations: smaller mussels often have higher metabolic and filtration rates relative to their biomass, increasing their exposure to suspended particles, including microplastics.
This approach enabled the estimation of average microplastic concentration in water using both analytical methods and a machine learning model, with Mytilus galloprovincialis serving as a bioindicator. While most parameters are either derived from mathematical analysis or established in the literature, such models are essential for assessing (in a sustainable manner) an estimate of the microplastic-based pollution model.
While the model is purely theoretical, it is tailored towards the needs of the researchers, keeping the input data directly available to them. When performing such analysis, it should focus on assessing microplastics within mussels of different sizes (corresponding to different ages), thus allowing the implementation of graphs similar to those presented in Figure 10. While the model is developed using in situ experimental data, it is only implemented for the Romanian Black Sea coastal region and needs more data to be extended for other (or broader) regions.
Figure 10a illustrates the estimated concentration of microplastics (g/m3) within the volume of water filtered during the lifespan of Mytilus galloprovincialis individuals sampled at Station 2MAI (Vama Veche—2 Mai Marine Reserve). A clear decreasing trend is observed with increasing mussel age, with the highest concentration (3.17 ± 2.03 g/m3) detected in the youngest age class (∼0.58 years). Concentrations decline substantially in older mussels, stabilising below 0.15 g/m3 beyond 1.5 years of age. These results suggest that younger individuals may exhibit higher microplastic accumulation rates, potentially due to higher filtration activity relative to body mass or greater environmental exposure during early developmental stages. Given that 2MAI is a protected site with lower anthropogenic pressure, the elevated levels in younger cohorts may also reflect recent episodic contamination events.
Figure 10b shows the estimated microplastic concentration (g/m3) in the lifetime-ingested water of Mytilus galloprovincialis collected from Constanța Port (PCT), one of the most anthropogenically impacted sites in the study. An age-dependent decline in microplastic concentration is evident. Younger mussels (0.99 years) showed the highest mean concentrations (∼0.67 g/m3), likely reflecting recent exposure to intense maritime activity, effluent discharges, and sediment disturbance. Concentrations progressively decrease with increasing age, dropping below 0.05 g/m3 by the age of 4 years. These results suggest that, in addition to the decreasing accumulation rates with age, the ratio mechanisms limit net uptake over time. The observed pattern highlights the influence of local pollution dynamics and the value of young mussels as indicators of acute exposure.
At Midia Port (PMD), Figure 10c, the relationship between mussel age and microplastic concentration exhibits higher variability compared to other sites. Peak concentrations (∼0.36 g/m3) occurred at an intermediate age class (1.21 years), while older individuals (≥3.5 years) and the youngest (1.92 years) exhibited much lower values. This non-monotonic trend may reflect episodic or seasonal pollution inputs, coupled with habitat heterogeneity in port infrastructure (e.g., quay walls, mooring zones). The fluctuation suggests that age alone may not fully explain microplastic burden here, and site-specific environmental dynamics likely influence exposure and retention. Overall, the results from PMD reveal the complex pollution landscape characteristic of industrial harbours. In Mangalia Port (PMG), an urbanised coastal site with moderate marine traffic, the pattern of microplastic accumulation in mussel-ingested water showed a consistent age-dependent decline (Figure 10d). The youngest mussels (0.99 years) had the highest estimated concentrations (∼0.61 g/m3), with values dropping steadily in older classes, reaching ∼0.06 g/m3 at 3.18 years. This trend is consistent with chronic exposure to background pollution sources such as plastic debris, fishing gear, and run-off. The gradient supports the hypothesis of initial rapid accumulation in early life stages, followed by dilution or saturation over time. This makes PMG a representative case of moderate but persistent coastal pollution, suitable for long-term monitoring.
Through most stations, we observed an evident inverse relationship between mussel age and microplastic concentration in ingested water volume. Younger individuals consistently accumulated higher microplastic loads, homogenised by their estimated lifetime filtration. At Station 2MAI (marine reserve), mussels under one year of age displayed concentrations exceeding 3 g/m3, which was higher than in urbanised areas. Similarly, early-stage individuals at PCT and PMG depicted high microplastic loads (0.6–0.7 g/m3). This inverse correlation suggests a complex interplay of physiological and ecological mechanisms. Smaller mussels often have higher metabolic and filtration rates relative to their biomass, which increases their exposure to suspended particles, including microplastics. Their filter-feeding nature allows the ingestion of particulate matter from the surrounding water column. Furthermore, mussels can accumulate microplastics in their tissues, which may impact their physiological health and reproductive capabilities. While older mussels may have accumulated microplastics over a more extended period, their filtration efficiency may decrease with age, or they may engage in more efficient depuration processes. The physiological condition of mussels can also vary spatially due to environmental factors such as water currents, sedimentation patterns, and local pollution levels, further influencing microplastic accumulation.
Research indicates that physiological responses and molecular biomarkers in M. galloprovincialis, such as antioxidant enzymes and stress markers, are indicative of environmental contamination, establishing a correlation between physiological condition and pollutant loads. This aspect is underlined by several studies exploring the biochemical and ecological roles of juvenile mussels in assessing marine health. Furthermore, the bioindicator potential of M. galloprovincialis is enhanced by its ability to accumulate pollutants from the surrounding environment, including heavy metals and microplastics. Studies conducted by Lettieri et al. demonstrated that heavy metal exposure leads to metabolomic changes in M. galloprovincialis, indicating physiological alterations that can be tracked through biomarker analysis [39,40]. The responses of these mussels to environmental stressors further support their position as bioindicators, bridging the gap between pollutant exposure and physiological impact within marine ecosystems [41].
To enhance monitoring capabilities, our study developed a surrogate machine learning model to estimate microplastic concentration in water and mussel age, leveraging M. galloprovincialis as a bioindicator. This innovative approach was based upon a large-scale synthetic dataset, generated from the statistical distributions of our empirical data, to overcome the limitations of a relatively small real dataset. The Random Forest regression algorithm, after systematic hyperparameter tuning, demonstrated satisfactory predictive accuracy (MAE: 0.06 years for age; 0.08 g/m3 for microplastic concentration). This model provides a practical tool for researchers, as it predicts key parameters based on readily available metrics, including mussel size, sampling location, substrate type, and microplastic surface area. While currently implemented for the Romanian Black Sea coastal region using in situ experimental data, the basis of the model has potential for broader application with additional regional datasets.

5. Conclusions

This study presents a multidisciplinary approach to characterising microplastic pollution in the western Black Sea by manipulating the bioindicator potential of Mytilus galloprovincialis in combination with advanced machine learning techniques. Through field sampling at four coastal stations with distinct anthropogenic profiles—ranging from harbours to a marine reserve—we evaluated the load of microplastics accumulated in mussel tissue and normalised these data using biometric-derived filtration estimates. The observed inverse relationship between mussel age and microplastic concentration was consistent across locations, suggesting that younger individuals serve as more acute indicators of recent contamination and reflect the physiological and ecological mechanisms governing particle uptake.
The innovative methodology of the study is represented by generating and using a large-scale synthetic dataset derived from empirical distributions. This allowed us to develop a machine learning (ML) surrogate model capable of predicting mussel age and lifetime-ingested microplastic concentration from a limited set of input variables, including shell size, sampling location, substrate type, and microplastic surface area. The ML model, optimised via hyperparameter tuning and implemented through a Random Forest regression algorithm, achieved satisfactory performance metrics (MAE: 0.06 years for age; 0.08 g/m3 for microplastic concentration). These results demonstrate the potential of data-driven approaches to support real-time environmental forecasting, particularly in regions where direct measurements are limited by cost or accessibility.
Ecologically, the study reinforces the value of M. galloprovincialis as an indicator, highlighting its ability to integrate short-term exposure through filtration activity and its applicability across diverse marine habitats. Interestingly, while ports showed the highest absolute microplastic loads, episodic peaks observed in the marine reserve (2 Mai) suggest that even minimally impacted areas are not immune to transient contamination events. These findings underscore the importance of incorporating temporal variability and habitat heterogeneity into future monitoring programs.
From a sustainability and management perspective, the hybrid framework presented here provides a scalable template for assessing coastal pollution. The combination of standardised biological sampling, synthetic data expansion, and interpretable machine learning (ML) modelling addresses several limitations of current monitoring protocols, particularly in semi-enclosed seas like the Black Sea. With appropriate adaptation, this framework can contribute to meeting policy objectives under regional directives such as the Marine Strategy Framework Directive (MSFD) and support ecosystem-based management practices. Mussel aquaculture, marine tourism, and fisheries—all vital components of coastal economies—are vulnerable to pollution stressors such as microplastics. Notably, this work aligns with the principles of the blue economy, which aims to get to a balance between economic growth and ocean health, by providing tools to detect and anticipate pollution hotspots and predict contamination in bioresources like M. galloprovincialis.
The findings support the value of M. galloprovincialis as an indicator for assessing coastal pollution in the Black Sea, as it is capable of reflecting short-term exposure dynamics and is adaptable to diverse marine habitats. The observed pollution patterns enhance the need to combine temporal variability and habitat heterogeneity into future monitoring programmes by capturing the complexity of microplastic distribution. Beyond ecological insights, the accumulation of microplastics in M. galloprovincialis carries direct implications for human health risks, particularly given the consumption of contaminated shellfish from the Black Sea. This approach addresses the limitations of current monitoring protocols in semi-enclosed seas, such as the Black Sea, by providing tools to detect and anticipate pollution hotspots and predict contamination in valuable bioresources. Such capabilities contribute to the principles of the blue economy, aiming to balance economic growth with ocean health by protecting coastal economic sectors, such as mussel aquaculture, marine tourism, and fisheries, from the impacts of microplastic pollution.

Supplementary Materials

The following supporting information can be downloaded at: https://www.mdpi.com/article/10.3390/su17125664/s1, Table S1: cleaned.csv as raw data for the model; Table S2: clean_v2.csv; Model code: pe_curat.pdf.

Author Contributions

Conceptualisation, M.E.M., A.V.C., G.C. and E.D.P.; methodology, M.E.M., A.V.C., G.C. and E.D.P.; software, M.E.M., A.V.C. and G.C.; validation, A.V.C. and E.D.P.; formal analysis, M.E.M., A.V.C., G.C. and E.D.P.; investigation, M.E.M., A.V.C., G.C. and E.D.P.; resources, E.D.P.; data curation, M.E.M., A.V.C., G.C. and E.D.P.; writing—original draft preparation, M.E.M., A.V.C., G.C. and E.D.P.; writing—review and editing, M.E.M., A.V.C., G.C. and E.D.P.; visualisation, M.E.M., A.V.C. and G.C. All authors have read and agreed to the published version of the manuscript.

Funding

The research of the E.D.P. has been carried out with financial support from the NUCLEU Program (INTELMAR), funded by the Ministry of Research, Innovation and Digitisation, financing contract no. 45N/14.02.2019, project PN19260202. The research of the M.E.M. has been carried out with financial support from the “Forecasting and observing the open-to-coastal ocean for Copernicus users-FOCCUS Project” [42], funded by the European Union (Grant Agreement No. 101133911). Views and opinions expressed are, however, those of the author(s) only and do not necessarily reflect those of the European Union or the European Health and Digital Executive Agency (HaDEA). Neither the European Union nor the granting authority can be held responsible for them. The authors would like to thank the anonymous reviewers and the editorial team for their valuable comments and contributions.

Institutional Review Board Statement

Not applicable.

Informed Consent Statement

Not applicable.

Data Availability Statement

The raw data and the Python v3.10.13 Machine Learning model supporting the conclusions of this article are made available using ZENODO—EU Open Research Repository [43].

Conflicts of Interest

The authors declare no conflicts of interest.

References

  1. Xiao, S.; Cui, Y.; Brahney, J.; Mahowald, N.; Li, Q. Long-distance atmospheric transport of microplastic fibres influenced by their shapes. Nat. Geosci. 2023, 16, 863–870. [Google Scholar] [CrossRef]
  2. Murano, C.; Palumbo, A.; Leone, S. Toxicological Impacts of Microplastics: Effects on Levels of Cellular Thiols in Mytilus galloprovincialis. Environ. Toxicol. Chem. 2023, 42, 1607–1613. [Google Scholar] [CrossRef] [PubMed]
  3. Savuca, A.; Nicoara, M.N.; Faggio, C. Comprehensive Review regarding the Profile of the Microplastic Pollution in the Coastal Area of the Black Sea. Sustainability 2022, 14, 14376. [Google Scholar] [CrossRef]
  4. Pizzurro, F.; Nerone, E.; Ancora, M.; Domenico, M.D.; Mincarelli, L.F.; Cammà, C.; Salini, R.; Renzo, L.D.; Giacinto, F.D.; Corbau, C.; et al. Exposure of Mytilus Galloprovincialis to Microplastics: Accumulation, Depuration and Evaluation of the Expression Levels of a Selection of Molecular Biomarkers. Animals 2023, 14, 4. [Google Scholar] [CrossRef]
  5. GFCM. The State of Mediterranean and Black Sea Fisheries 2023; Food and Agriculture Organization of the United Nations: Rome, Italy, 2023. [Google Scholar] [CrossRef]
  6. Mihailov, M.E. Longterm variability of the water mass structure on the Romanian Black Sea shelf. Rom. Rep. Phys. 2016, 68, 377–392. [Google Scholar]
  7. Churilova, T.; Krivenko, O.; Moncheva, S.; Kremena, S.; Finenko, Z.; Oguz, T.; Akoglu, E.; Timofte, F. The Black Sea: Additional Information on Status of Threatened Ecological Characteristics Relevant to the Marine Strategy Framework Directive Options for Delivering Ecosystem-Based Marine Management. In Project Options for Delivering Ecosystem-Based Marine Management (ODEMM); ODEMM Partners, Ed.; Liverpool University: Liverpool, UK, 2011; Available online: https://edepot.wur.nl/329824 (accessed on 5 June 2025).
  8. Ramos-Oliveira, C.; Sampaio, L.; Rubal, M.; Veiga, P. Spatial-temporal variability of Mytilus galloprovincialis Lamarck 1819 populations and their accumulated sediment in northern Portugal. PeerJ 2021, 9, e11499. [Google Scholar] [CrossRef]
  9. Simeonova, A.; Chuturkova, R. Marine litter accumulation along the Bulgarian Black Sea coast: Categories and predominance. Waste Manag. 2019, 84, 182–193. [Google Scholar] [CrossRef]
  10. Pojar, I.; Stock, F. Microplastics in Surface Waters from the Northwestern Black Sea: An Abundance and Composition Approach. Available online: https://ui.adsabs.harvard.edu/abs/2019EGUGA..21.8357P/abstract (accessed on 5 June 2025).
  11. Toțoiu, A.; Harcotă, G.E.; Bișinicu, B.; Timofte, F.; Boicenco, B. Distribution of micro- and mesolitter in the southwestern part of the Black Sea. In Marine Litter in the Black Sea; Aytan, U., Pogojeva, M., Simeonova, A., Eds.; Turkish Marine Research Foundation (TUDAV): Istanbul, Turkey, 2020; pp. 208–217. [Google Scholar]
  12. Berov, D.; Klayn, S. Microplastics and floating litter pollution in Bulgarian Black Sea coastal waters. Mar. Pollut. Bull. 2020, 156, 111225. [Google Scholar] [CrossRef]
  13. Eryaşar, A.R.; Gedik, K.; Şahin, A.; Çağrı Öztürk, R.; Yılmaz, F. Characteristics and temporal trends of microplastics in the coastal area in the Southern Black Sea over the past decade. Mar. Pollut. Bull. 2021, 173, 112993. [Google Scholar] [CrossRef]
  14. Demirel Bayık, G.; Aydemir, E. Microplastic pollution in a small fishing port in Zonguldak/Turkey. Environ. Res. Technol. 2023, 6, 13–20. [Google Scholar] [CrossRef]
  15. Stoica, E.; Atabay, H.; Bat, L.; Ciuca, A.; Creanga, S.; Marin, D.; Öztekin, A.; Tanase, M.; Tolun, L. Marine litter occurrence in the river-influenced Black Sea coast. In Marine Litter in the Black Sea; Aytan, U., Pogojeva, M., Simeonova, A., Eds.; Turkish Marine Research Foundation (TUDAV): Istanbul, Turkey, 2020; pp. 49–62. [Google Scholar]
  16. Galațchi, M.; Anton, E. Studies regarding the seafloor litter on the Romanian Black Sea coast. In Marine Litter in the Black Sea; Aytan, U., Pogojeva, M., Simeonova, A., Eds.; Turkish Marine Research Foundation (TUDAV): Istanbul, Turkey, 2020; pp. 102–110. [Google Scholar]
  17. Akkan, T.; Gedik, K.; Mutlu, T. Protracted dynamicity of microplastics in the coastal sediment of the Southeast Black Sea. Mar. Pollut. Bull. 2023, 188, 114722. [Google Scholar] [CrossRef] [PubMed]
  18. Gedik, K.; Eryaşar, A.R. Microplastic pollution profile of Mediterranean mussels (Mytilus galloprovincialis) collected along the Turkish coasts. Chemosphere 2020, 260, 127570. [Google Scholar] [CrossRef]
  19. Şentürk, Y.; Esensoy, F.; Öztekin, A.; Aytan, U. Microplastics in bivalves in the southern Black Sea. In Marine Litter in the Black Sea; Aytan, U., Pogojeva, M., Simeonova, A., Eds.; Turkish Marine Research Foundation (TUDAV): Istanbul, Turkey, 2020; pp. 303–313. [Google Scholar]
  20. Alexandrova, A.; Ignatova–Ivanova, T.; Bachvarova, D.; Toshkova, S.; Doichinov, A.; Ibryamova, S.; Chipev, N. Pilot Screening and Assessment of Microplastic Bioaccumulation in Wedge Clams Donax trunculus Linnaeus, 1758 (Bivalvia) from the Bulgarian Black Sea Coast. Acta Zool. Bulg. 2022, 74, 568–578. [Google Scholar]
  21. Ibryamova, S.; Toschkova, S.; Bachvarova, D.C.; Lyatif, A.; Stanachkova, E.; Ivanov, R.; Natchev, N.; Ignatova-Ivanova, T. Assessment of the bioaccumulation of microplastics in the Black Sea mussel Mytilus galloprovincialis L., 1819. J. IMAB—Annu. Proceeding (Sci. Pap.) 2022, 28, 4676–4682. [Google Scholar] [CrossRef]
  22. Pojar, I.; Dobre, O.; Baboș, T.; Lazăr, C. Quantitative Microfiber evaluation in Mytilus galloprovincialis, western Black Sea, Romania. Geo-Eco-Mar. 2022, 28, 65–71. [Google Scholar] [CrossRef]
  23. Galyon, F.; Ünver Alçay, A. Microplastic contamination in raw mussels collected in Istanbul. Reg. Stud. Mar. Sci. 2023, 68, 103280. [Google Scholar] [CrossRef]
  24. Cincinelli, A.; Scopetani, C.; Chelazzi, D.; Martellini, T.; Pogojeva, M.; Slobodnik, J. Microplastics in the Black Sea sediments. Sci. Total Environ. 2021, 760, 143898. [Google Scholar] [CrossRef]
  25. Stamataki, N.; Hatzonikolakis, Y.; Tsiaras, K.; Tsangaris, C.; Petihakis, G.; Sofianos, S.; Triantafyllou, G. Modelling mussel (Mytilus spp.) microplastic accumulation. Ocean Sci. 2020, 16, 927–949. [Google Scholar] [CrossRef]
  26. Pittura, L.; Avio, C.G.; Giuliani, M.E.; d’Errico, G.; Keiter, S.H.; Cormier, B.; Gorbi, S.; Regoli, F. Microplastics as vehicles of environmental PAHs to marine organisms: Combined chemical and physical hazards to the Mediterranean mussels, Mytilus galloprovincialis. Front. Mar. Sci. 2018, 5, 103. [Google Scholar] [CrossRef]
  27. Lazăr, L.; Boicenco, L.; Denga, Y. ANEMONE Deliverable 2.2 “Anthropogenic Pressures and Impact on the Black Sea Costal Coastal Ecosystem”; CD Press: Bucharest, Romania, 2021; pp. 18–56. [Google Scholar]
  28. ArcGIS Desktop 10.7.x. Available online: https://desktop.arcgis.com/en/system-requirements/10.7/arcgis-desktop-system-requirements.htm (accessed on 5 June 2025).
  29. Galgani, F.; Hanke, G.; Werner, S.; De Vrees, L. Marine litter within the European Marine Strategy Framework Directive. ICES J. Mar. Sci. 2013, 70, 1055–1064. [Google Scholar] [CrossRef]
  30. Li, J.; Yang, D.; Li, L.; Jabeen, K.; Shi, H. Microplastics in commercial bivalves from China. Environ. Pollut. 2015, 207, 190–195. [Google Scholar] [CrossRef] [PubMed]
  31. Barrows, A.; Neumann, C.; Pieper, C.; Berger, M.; Shaw, S. Guide to Microplastics Identification, a Comprehensive Methods Guide for Microplastics Identification and Quantification in the Laboratory; Marine & Environmental Research Institute, Center for Environmental Studies: Blue Hill, ME, USA, 2017; pp. 2–14. [Google Scholar]
  32. Abadi, M.; Agarwal, A.; Barham, P.; Brevdo, E.; Chen, Z.; Citro, C.; Corrado, G.S.; Davis, A.; Dean, J.; Devin, M.; et al. TensorFlow: Large-Scale Machine Learning on Heterogeneous System v.2.18.1. 2015. Available online: https://www.tensorflow.org/ (accessed on 5 June 2025).
  33. Paszke, A.; Gross, S.; Massa, F.; Lerer, A.; Bradbury, J.; Chanan, G.; Killeen, T.; Lin, Z.; Gimelshein, N.; Antiga, L.; et al. PyTorch: An Imperative Style, High-Performance Deep Learning Library v.2.6.0. In Advances in Neural Information Processing Systems 32; Curran Associates, Inc.: Red Hook, NY, USA, 2019; pp. 8024–8035. [Google Scholar]
  34. Feurer, M.; Klein, A.; Eggensperger, K.; Springenberg, J.; Blum, M.; Hutter, F. Efficient and Robust Automated Machine Learning. In Proceedings of the 29th International Conference on Neural Information Processing Systems, Montreal, QC, Canada, 7–12 December 2015; pp. 2962–2970. [Google Scholar]
  35. Adhikari, R.; Agrawal, R. Forecasting Strong Seasonal Time Series with Artificial Neural Networks. J. Sci. Ind. Res. 2012, 71, 657–666. Available online: https://nopr.niscpr.res.in/handle/123456789/14843 (accessed on 5 June 2025).
  36. Pedregosa, F.; Varoquaux, G.; Gramfort, A.; Michel, V.; Thirion, B.; Grisel, O.; Blondel, M.; Prettenhofer, P.; Weiss, R.; Dubourg, V.; et al. Scikit-learn: Machine Learning in Python. J. Mach. Learn. Res. 2011, 12, 2825–2830. [Google Scholar]
  37. Georgieva, S.; Stancheva, M.; Makedonski, L. Investigation about the presence of organochlorine pollutants in mussels from the Black Sea, Bulgaria. Ovidius Univ. Ann. Chem. 2016, 27, 8–12. [Google Scholar] [CrossRef]
  38. Peycheva, K.; Panayotova, V.; Stancheva, R.; Makedonski, L.; Merdzhanova, A.; Cicero, N.; Parrino, V.; Fazio, F. Trace Elements and Omega-3 Fatty Acids of Wild and Farmed Mussels (Mytilus galloprovincialis) Consumed in Bulgaria: Human Health Risks. Int. J. Environ. Res. Public Health 2021, 18, 10023. [Google Scholar] [CrossRef]
  39. Lettieri, G.; Marinaro, C.; Notariale, R.; Perrone, P.; Lombardi, M.; Trotta, A.; Troisi, J.; Piscopo, M. Impact of heavy metal exposure on Mytilus galloprovincialis spermatozoa: A metabolomic investigation. Metabolites 2023, 13, 943. [Google Scholar] [CrossRef]
  40. Lettieri, G.; Marinaro, C.; Brogna, C.; Montano, L.; Lombardi, M.; Trotta, A.; Troisi, J.; Piscopo, M. A metabolomic analysis to assess the responses of the male gonads of Mytilus galloprovincialis after heavy metal exposure. Metabolites 2023, 13, 1168. [Google Scholar] [CrossRef]
  41. Touahri, H.; Boutiba, Z.; Benguedda, W.; Shaposhnikov, S. Active biomonitoring of mussels Mytilus galloprovincialis with integrated use of micronucleus assay and physiological indices to assess harbor pollution. Mar. Pollut. Bull. 2016, 110, 52–64. [Google Scholar] [CrossRef]
  42. FOCCUS Project. Forecasting and Observing the Open-to-Coastal Ocean for Copernicus Users. Available online: https://foccus-project.eu/ (accessed on 10 May 2025).
  43. Mihailov, M.E.; Chirosca, A.; Pantea, E.D. Machine Learning Approaches for Microplastic Pollution Analysis in Mytilus galloprovincialis in the Western Black Sea. 2025. Available online: https://zenodo.org/records/15612014 (accessed on 1 June 2025).
Figure 1. Study area map showing the location of sample collection stations along the Romanian Black Sea coast (A) and their position in the Black Sea region (B). S1: Midia Port; S2: Constanta Port; S3: Mangalia Port; S4: 2 Mai.
Sustainability 17 05664 g001
Figure 2. VGBF growth curves of Mytilus galloprovincialis to estimate mussel age based on length.
Sustainability 17 05664 g002
Figure 3. Growth inversion function.
Sustainability 17 05664 g003
Figure 4. Wet weight vs. size.
Sustainability 17 05664 g004
Figure 5. Mussel mass distribution (wet weight).
Sustainability 17 05664 g005
Figure 6. Mussel age distribution.
Sustainability 17 05664 g006
Figure 7. Microplastics distribution (mm2).
Sustainability 17 05664 g007
Figure 8. Microplastics distribution (g).
Sustainability 17 05664 g008
Figure 9. Microplastics in lifetime ingestion water (g).
Sustainability 17 05664 g009
Figure 10. Microplastics concentration in water using experimental data: (a) 2 Mai resort station. (b) Constanta harbour. (c) Midia harbour. (d) Mangalia harbour.
Sustainability 17 05664 g010
Table 1. Station locations.
LabelNameLatitudeLongitude
2MAI2 Mai resort station43.77953228.582378
PCTConstanta harbour44.16079228.582378
PMDMidia harbour44.34243628.681631
PMGMangalia harbour43.80701728.582175
Table 2. Experimental data summary.
StationSubstrateMicrofibres
mm2
Microfragments
mm2
Micropellets
mm2
Microfilms
mm2
2 MAIcalcareous rock substrate 667.82 ± 792.28 25.01 ± 208.78 0.00 ± 0.00 0.00 ± 0.00
pontoon metal pillars/plastic ropes 235.03 ± 373.93 52.07 ± 573.75 0.10 ± 2.55 46.42 ± 893.65
PCTship’s hull 193.97 ± 254.27 20.03 ± 142.61 0.00 ± 0.00 24.26 ± 504.29
harbour concrete quay wall 338.54 ± 386.43 235.87 ± 1115.99 0.12 ± 1.64 209.87 ± 2212.76
PMDharbour concrete quay wall 156.24 ± 193.61 30.13 ± 403.06 0.00 ± 0.00 20.39 ± 294.01
PMGcement block cliff 258.49 ± 250.20 2.81 ± 36.40 0.00 ± 0.00 0.00 ± 0.00
pontoon plastic floats 322.46 ± 322.96 102.23 ± 1394.70 0.06 ± 1.79 65.43 ± 1135.59
All values are rounded to the second decimal for readability.
Table 3. Substrate encoding.
LabelValueLabelValue
0rock substrate3harbour concrete quay wall
1cement block cliff4pontoon plastic floats
2ship’s hull
Table 4. Substrate encoding and measured variables. The relationship between environmental factors, mussel characteristics, and microplastic contamination by substrate encoding, geographical coordinates (latitude and longitude), and mussel size, alongside the presence of various microplastic types (microfibres, microfragments, micropellets, and microfilms).
UsageNameDescription
featureSubstrateThe encoded substrate label
featureLatitudeThe latitude for the measured values
featureLongitudeThe longitude for the measured values
featureSizeRaw mussel size (including shell) in cm
featureMicrofibresDetected microfibres in mm2
featureMicrofragmentsDetected microfragments in mm2
featureMicropelletsDetected micropellets in mm2
featureMicrofilmsDetected microfilms in mm2
targetageMussel age in years
targetuplMicroplastic concentration in water in g m 3
Table 5. Experimental data.
StationMicroplastics in Water (g/cm3)
Age (Years)0.580.991.431.922.493.184
2MAI 3.17 ± 2.03 0.43 ± 0.54 0.3 ± 1.32 0.13 ± 0.16 0.09 ± 0.08
PCT 0.67 ± 1.92 0.38 ± 0.39 0.32 ± 1.03 0.14 ± 0.23 0.06 ± 0.14 0.02 ± 0.02
PMD 0.37 ± 0.47 0.07 ± 0.07 0.02 ± 0.03
PMG 0.61 ± 1.50 0.24 ± 0.31 0.14 ± 0.14 0.10 ± 0.08 0.05 ± 0.04
All values are obtained from the experimental data and rounded to the second decimal for readability.
Disclaimer/Publisher’s Note: The statements, opinions and data contained in all publications are solely those of the individual author(s) and contributor(s) and not of MDPI and/or the editor(s). MDPI and/or the editor(s) disclaim responsibility for any injury to people or property resulting from any ideas, methods, instructions or products referred to in the content.

