Abstract
With the increasing global focus on sustainable development, circulating fluidized bed (CFB) boilers, as highly efficient and low-pollution combustion equipment, play an important role in energy production and environmental protection. However, the combustion efficiency and emission control of CFB boilers still face challenges, and there is an urgent need for multi-objective optimization through advanced technologies to support the goal of sustainable development. This study proposes an intelligent framework integrating Bidirectional Temporal Convolutional Network (BiTCN) and Hybrid Dung Beetle Optimizer (HDBO) for multi-objective optimization of combustion efficiency and NOx/SO2 emissions in CFB boilers. The BiTCN model captures bidirectional temporal dependencies between dynamic parameters (e.g., air-coal ratio, bed temperature) and target variables through operational data analysis. Three key improvements are implemented in DBO: (1) Chaotic initialization via sequential pattern mining (SPM) enhances population diversity and spatial coverage; (2) The osprey optimization algorithm (OOA) hunting mechanism replaces the original rolling update strategy, improving global exploration; (3) t-Distribution perturbation is applied to foraging beetles in later iterations, leveraging its “sharp peak and thick tail” characteristics to dynamically balance exploitation and exploration. Experimental results demonstrate 0.5–1% combustion efficiency improvement and 15.1%/30% reductions in NOx/SO2 emissions for a typical CFB boiler.
1. Introduction
With the increasingly serious problems of global climate change and environmental pollution, sustainable development has become the focus of global attention. The energy sector, as one of the major sources of greenhouse gas emissions, is under tremendous pressure to reduce emissions. According to the report of the International Energy Agency (IEA), energy production and consumption account for more than two-thirds of global carbon dioxide emissions. Therefore, improving the efficiency of energy utilization and reducing pollutant emissions have become the key paths to achieving the goal of sustainable development [1,2]. CFB boilers, as a kind of high-efficiency and low-pollution combustion equipment, are widely used in power, chemical, and metallurgical industries. Its unique combustion characteristics enable it to efficiently utilize low calorific value fuels and significantly reduce the emission of pollutants such as NOx and SO2 [3]. Therefore, CFB boilers have an important potential for realizing efficient energy utilization and environmental protection and are one of the most important technologies for promoting the sustainable development of the energy industry. Although CFB boilers have significant advantages in terms of energy efficiency and emission control, their combustion process involves a number of mutually coupled dynamic parameters (e.g., ratio of the total air volume entering the boiler to the total coal volume, bed temperature, etc.), leading to complexity and uncertainty in the optimization of combustion efficiency and pollutant emissions. Conventional optimization methods are often difficult to take into account both combustion efficiency and emission control, and there is an urgent need to achieve multi-objective synergistic optimization through advanced technological means to further enhance the performance of CFB boilers and support the goal of sustainable development.
The operational status of CFB boilers can be characterized by key parameters such as bed temperature, bed pressure, and flue gas oxygen content. Accurate prediction of these parameters forms the foundation for boiler optimization control. However, the combustion process involves complex multiphase reaction dynamics, with strong coupling and nonlinear contradictions between combustion efficiency and pollutant (NOx/SO2) emissions, making traditional mechanistic modeling methods inadequate for multi-objective collaborative optimization [4,5,6].
In recent years, the integration of deep learning and intelligent optimization algorithms has provided new solutions to this challenge. Krzywanski et al. successfully predicted SO2 emissions from various large- and small-scale CFB boilers under diverse operating conditions using a artificial neural network model, including air combustion and oxy-fuel combustion conditions [7]. Hong et al. established a coordinated control system model for a 330 MW CFB boiler based on deep belief networks [8]. Zhang et al. proposesed a combustion optimization method that incorporates neighborhood rough set machine learning. This method first reduces the control parameters affecting multi-objective combustion optimization with the neighborhood rough set algorithm that fully considers the correlation of each variable combination and then establishes a multi-objective combustion optimization prediction model by combining the online calculation of boiler thermal efficiency [9]. Ren developed a CFB boiler combustion process model using BP neural networks and constructed an adaptive genetic algorithm-based optimal control objective function. However, these methods exhibit significant limitations in catastrophic forgetting when data distribution shifts occur due to frequent operational changes in boilers [10]. Ye et al. combined Transformer with Convolutional Neural Networks (CNN) to extract dynamic and local real-time features, respectively. While the self-attention mechanism in Transformer architecture effectively captures long-term dependencies, it shows insufficient sensitivity to local fine-grained features and weakens causal correlations between adjacent timesteps, leading to reduced modeling accuracy for transient CFB combustion dynamics [11].
Existing studies mostly adopt one-way time series models (such as LSTM [12], TCN [13]) or statistical models (such as ARIMA [14]) for combustion process modeling. For example, the dual-linear Fast Learning Network (DLFLN) [15] proposed by Li et al., although it optimizes the weight distribution through the least square method, still belongs to the one-way feature extraction framework and is difficult to capture the context information at future moments. Similarly, although the combustion optimization model based on LSTM can handle temporal dependencies, its unidirectional recursive structure is prone to error accumulation in long-term predictions.
BiTCN addresses these limitations through bidirectional dilated causal convolution, capturing both short-term local fluctuations (e.g., instantaneous responses to fuel supply variations) and long-term dynamic coupling effects (e.g., delayed correlations between material circulation and combustion efficiency) [16]. This aligns well with the “strong nonlinearity and multi-time constants coexistence” characteristics of CFB boiler processes. The temporal features extracted by BiTCN, such as the oxygen variation gradient, can serve as optimization objectives input for DBO, while DBO can optimize the hyperparameters of BiTCN to form closed-loop optimization. Furthermore, DBO’s rolling foraging mechanism can break through local optima, complementing the gradient descent process of BiTCN [17]. However, traditional DBO suffers from local optima entrapment in high-dimensional spaces and struggles with abrupt operational changes due to fixed step-size strategies [18].
The existing combustion control based on machine learning mostly adopts a single optimization algorithm (such as PSO, GA) or a simple hybrid strategy. For example, particle swarm optimization (PSO) [19] is prone to lose its exploration ability due to the attenuation of inertia weight in global search. The cross-mutation operation of the genetic algorithm (GA) [20] has a large computational overhead, and it is difficult to balance the exploration and development stages with fixed parameter Settings.
In the context of increasingly prominent energy and environmental issues, energy saving and emission reduction have become an important way to achieve sustainable development. In industrial production, the pollution generated by boiler combustion accounts for a large proportion. Although CFB boilers show good combustion performance, the control of combustion efficiency and pollutant emission is still a serious challenge. To address these challenges, this study proposes a multi-objective optimization framework integrating BiTCN with Hybrid DBO. First, chaotic mapping-based SPM generates initial populations to enhance population diversity and global search capability in high-dimensional parameter spaces. Second, the hunting-capturing mechanism from the OOA reconstructs dung beetle rolling behavior to improve dynamic optimization efficiency for key combustion parameters (e.g., oxygen concentration, bed temperature). Finally, t-distribution perturbation is applied to foraging dung beetles during later iterations, leveraging its “sharp peak and heavy tail” characteristics to balance exploration-exploitation trade-offs, thereby precisely capturing Pareto optimal solutions for combustion efficiency and emissions. This study provides technical support for realizing clean energy and addressing climate change.
The dung beetle optimization algorithm simulates the ball-rolling navigation and dynamic foraging behavior of dung beetles 15. Its global search mechanism corresponds to the fluidization distribution optimization of fuel particles in CFB boilers. By adjusting parameters such as the coal feed rate and air volume, a fuel-air mixture equilibrium similar to the “pheromone transfer” of dung beetles is achieved in the furnace to reduce the loss of unburned carbon. The Osprey optimization algorithm (OOA) imitates the dive adjustment and precise positioning strategy of ospreys during hunting, corresponding to real-time control under the dynamic working conditions of boilers. For instance, through the coordinated regulation of secondary air temperature and oxygen content, it can quickly respond to load changes and suppress the generation of pollutants, similar to the dynamic correction of ospreys when capturing targets. The two algorithms respectively, simulate the adaptive mechanism in nature from the perspectives of Global Parameter Optimization (DBO) and Local Dynamic Optimization (OOA), providing multi-dimensional optimization paths for the combustion efficiency and emission control of CFB boilers.
In the future, the optimization methods proposed in this study can be widely applied to other industrial combustion equipment to further promote the transition of the energy industry to a green and low-carbon direction. By continuously optimizing the combustion process, this study provides a feasible technical path to achieve the global carbon neutrality goal and sustainable development.
2. Object Description and Variable Selection
2.1. Fundamental Information on Circulating Fluidized Bed Boilers
A 300 MW unit CFB boiler (Taiyuan City, Shanxi Province, China) was selected as the research object. This boiler features a single furnace, natural circulation, and single drum design, with its overall arrangement illustrated in Figure 1. The main design parameters under the boiler maximum continuous rating (BMCR) condition are listed in Table 1.
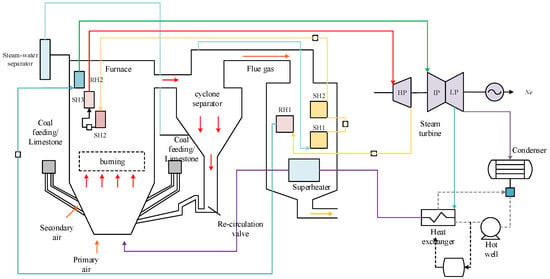
Figure 1.
CFB Boiler’s General Arrangement.

Table 1.
CFB boiler’s main design parameters.
On-site system-collected operational data served as research samples. The optimization targets included NOx and SO2 mass concentrations at the Selective Catalytic Reduction inlet along with boiler thermal efficiency. The NOx and SO2 concentrations were obtained through continuous emissions monitoring systems (CEMS), while the boiler thermal efficiency (based on the lower heating value [21]) was calculated through the heat loss method.
2.2. Boiler Operation Data and Analysis
Under the dynamic operation condition of the boiler at full load, CEMS is used to achieve precise monitoring of pollutant emissions. This system consists of a particulate matter monitoring subsystem, a gaseous pollutant monitoring subsystem, a flue gas parameter monitoring subsystem, and a data acquisition and processing subsystem composed of a distributed control system (DCS). It can transmit the concentration data of NOx and SO2 to the central control platform in real time. To ensure monitoring accuracy, the system is equipped with a dynamic temperature control cooling device, which strictly keeps the temperature of the sampled flue gas within a safe range of 0 to 500 °C, effectively avoiding the interference of condensation effect on the sensing elements. At the same time, it adopts dual protection of semiconductor condensation dehumidifiers and high-molecular membrane separation modules. By maintaining the relative humidity of the flue gas below the critical dew point value, the cross-influence of water vapor on the measurement data is completely eliminated.
The sampling points are best arranged in the straight pipe section of the flue or the core area of the exhaust outlet. Through flow field simulation, the vortex disturbance area was avoided. Combined with the multi-point grid sampling strategy, it is ensured that the collected samples fully represent the true emission state after the uniform mixing of flue gas. The APT2000 type temperature, pressure, and flow sensor is used to monitor the flow rate in real time, dynamically adjust the sampling flow rate, with a sampling period of 60 s and a deviation of ≤±5%. Moreover, the sampling system needs to be compatible with the signals of the dust meter and the temperature, pressure, and flow instrument to achieve synchronous upload of multiple parameters.
The gaseous pollutant detector adopts a high-temperature Fourier transform infrared spectrometer (FTIR), supporting multi-component synchronous measurement. Its resolution is ≤8 cm⁻1. Detection range: SO2: 0–150 mg/m3, NOx: 0–200 mg/m3. The particulate matter detector adopts the PM-1820 dust meter, with a measurement range of 0–200 mg/m3 and an accuracy of ±2%. Among them, the error of gaseous pollutants: Repeatability: ±2% F.S., Zero drift: ≤±1% F.S./30 days, range drift: ≤±1% F.S./30 days, and response time: ≤400 s (including pretreatment and transmission delay); Relative error of particulate matter: ≤±15%; Temperature, pressure and flow error: Temperature: ≤±1.5 °C, pressure: ≤±0.5% F.S., flow rate: ≤±2% F.S.
It should be noted that CEMS is compatible with the existing environmental protection platform data protocol (Modbus/RS-485) to avoid abnormal data transmission.
Taking load as an example, we analyze the relationship between the optimization objectives of boiler thermal efficiency, NOx and SO2 emissions, and unit load. The relationship between thermal efficiency and load is shown in Figure 2, where the range of thermal efficiency is 90% to 92%. As can be seen from Figure 2, when the boiler starts operating at a low load, the thermal efficiency increases as the operating load rises, reaches a peak, and then decreases as the load continues to rise. When the unit operates stably at full load (i.e., 300 MW), the efficiency remains basically unchanged.
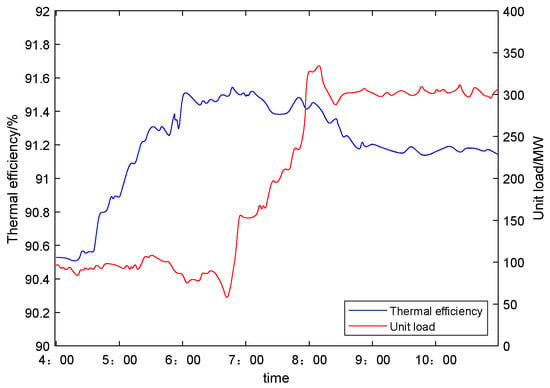
Figure 2.
Relationship between thermal efficiency and load.
The relationship between NOx mass concentration and load is shown in Figure 3, where the NOx mass concentration ranges from 130 to 350 mg/m3. As can be seen from Figure 3, there is a relatively clear positive correlation between the NOx mass concentration of the flue gas at the denitrification inlet and the unit load. As the unit load increases, the overall NOx mass concentration shows an increasing trend. When the load increases to 300 MW and the unit operates steadily, the NOx mass concentration remains basically unchanged.
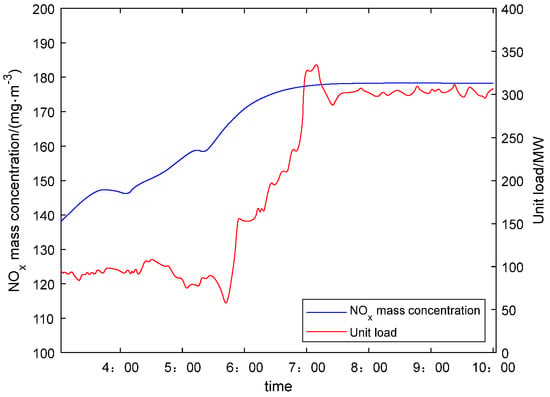
Figure 3.
Relationship between NOx mass concentrations and loads.
The relationship between SO2 mass concentration and load is shown in Figure 4, where the SO2 mass concentration ranges from 100 to 250 mg/m3. As can be seen from Figure 4, SO2 mass concentration shows a decreasing trend with increasing load in the low load range, while SO2 emissions rebound and increase in the high load range. When the load increases to steady-state operation of the 300 MW unit, the SO2 mass concentration remains basically unchanged.
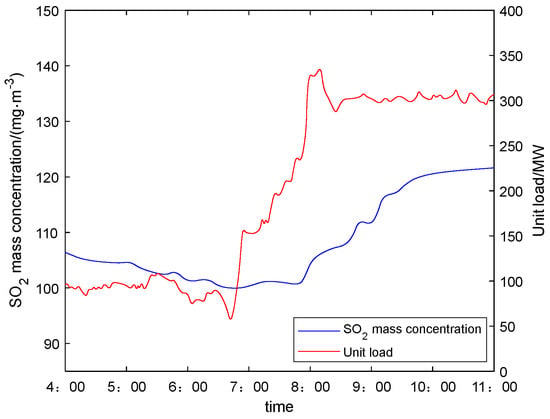
Figure 4.
SO2 Relationship between mass concentration and loads.
By calculating the moving average variance of time-series data (using a 10-min sliding window), the following stability criteria were established: the moving variance of combustion efficiency remained consistently below 1.2%, while the moving variances of NOx and SO2 concentrations maintained below 8 mg2/Nm6 and 15 mg2/Nm6, respectively. When all parameters persistently stay below their respective thresholds (1.5% for combustion efficiency, 10 mg2/Nm6 for NOx, and 30 mg2/Nm6 for SO2), it confirms that the dataset represents stable operational conditions of the CFB boiler.
3. Methodology
3.1. Hybrid Dung Beetle Optimizer
3.1.1. DBO Algorithm
The DBO algorithm is a population-based intelligent optimization algorithm inspired by the living habits of dung beetle populations in nature. The living habits of dung beetles are summarized as ball rolling, dancing, foraging, breeding, and stealing [22]. Unlike traditional intelligent optimization algorithms, the population in the DBO algorithm includes breeding beetles, small beetles, ball-rolling beetles, and stealing beetles, with each subpopulation performing corresponding behavioral actions. In summary, it first models the five behaviors of dung beetles, then each subpopulation conducts corresponding searches, ultimately achieving global exploration and local exploitation.
When there are obstacles on the current path, the dung beetle will relocate by dancing to find a new route. Once the dung beetle finds a new direction, it will continue to roll the ball forward. Update and define the position of the rolling dung beetle as:
Female dung beetles will lay eggs after determining the oviposition area. During each iteration, the female dung beetle lays one egg. During the iteration process, the position of the mother ball also changes, defined as:
Among them, the position of the breeding ball at the iteration is , where and are two random vectors of dimension , is the dimensionality of the optimization problem. If , then ; If , then . Through this over-limit correction method, the breeding dung beetles are confined within a safe range.
Some dung beetles steal dung balls from other dung beetles, and these beetles are called thief dung beetles. Assume the surrounding area is the optimal location for competing for dung balls. The position update formula for thief dung beetles is:
The position of the stealing dung beetle at the iteration is , where g is a random vector following a normal distribution, A is a constant.
When modeling the main steam temperature system using the DBO algorithm, to enhance the algorithm’s optimization capability and thereby obtain a more accurate model, some improvements can be made to address the limitations of the DBO algorithm, so as to improve control performance during subsequent control processes.
3.1.2. SPM Chaotic Mapping Population Initialization
Population initialization has a significant impact on the optimization effectiveness of the DBO algorithm. Proper population distribution at the initial stage can enhance population diversity and reduce the probability of falling into local optima. Therefore, the SPM chaotic mapping is introduced in the improved bald eagle search algorithm. Huang et al. proposed the SPM chaotic mapping, which combines the Sine map and the Piece Wise Linear Chaotic Map (PWLCM) [23]. The definition of the SPM chaotic mapping is:
Among them, ∈ (0, 1), ∈ (0, 1), at which point the chaotic system will enter a chaotic state, is a Gaussian perturbation of the standard normal distribution, the initial value of the sequence is a random number taken from [0, 1), and is the modulo operation (remainder after division).
Under general circumstances, when set to = 0.4 and = 0.3 around, the system exhibits stronger ergodicity. In the HDBO algorithm proposed in this paper, is set to 0.4 and to 0.3. When the population size is 300, comparing the SPM chaotic mapping with random initialization population distribution, as shown in Figure 5, it can be observed that the SPM chaotic mapping initializes a more uniform population distribution.
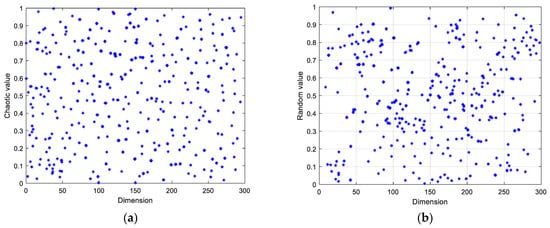
Figure 5.
(a) Initialize population distribution for SPM mapping; (b) Initialize population distribution using a random method.
3.1.3. OOA Algorithm
To address the issue of the weak global exploration capability of the DBO algorithm, the Osprey exploration behavior strategy is introduced. Ospreys, with their powerful vision, can detect the location of underwater fish, identify their positions, and prey on them, endowing the Osprey exploration behavior with strong exploration capabilities in identifying optimal areas and escaping local optima. In the OOA [24], for each osprey, the positions of other ospreys with better objective function values in the search space are considered as underwater fish.
The osprey randomly detects the location of one of the fish and attacks it. Based on the osprey’s movement simulation towards the fish, calculate the new position of the corresponding osprey:
If the objective function value at the new position is better, replace the previous position of the fish hawk according to the following formula:
In the formula represents the new position of the fish hawk in the exploration phase, represents its new position in the dimension; is the fitness value corresponding to ; is the fish selected by the fish hawk, is its dimension; is a random number between [0, 1]; is a random number in the set {1, 2}.
When the dancing dung beetle encounters obstacles and the deflection angle is 0, π/2, or π, the update of the dung beetle’s position stagnates, which easily leads to local optimal stagnation. Therefore, an exponential factor is used to search around the best position:
In the formula randn is a pseudo-random number that conforms to the standard normal distribution between (0, 1).
3.1.4. T-Distribution Perturbation
To further enhance the balance between global exploration and local exploitation in the DBO algorithm, this paper introduces adaptive t-distribution disturbance during the foraging phase of small dung beetles. t(iter) represents the T-distribution mutation disturbance with the number of iterations, iter, as the degrees of freedom parameter, which is used to perturb the foraging behavior of small dung beetles. In the initial stage of iteration, the T-distribution disturbance is similar to Cauchy mutation, enabling the DBO algorithm to have strong global exploration capabilities at this time. In the later stages of iteration, the T-distribution disturbance resembles Gaussian mutation, allowing the algorithm to excel in local exploitation and improving the convergence speed. The update method for new positions is shown in Formula (13):
3.1.5. HDBO Algorithm Process
The implementation steps of the HDBO algorithm proposed in this paper are as follows. The algorithm flowchart is shown in Figure 6.
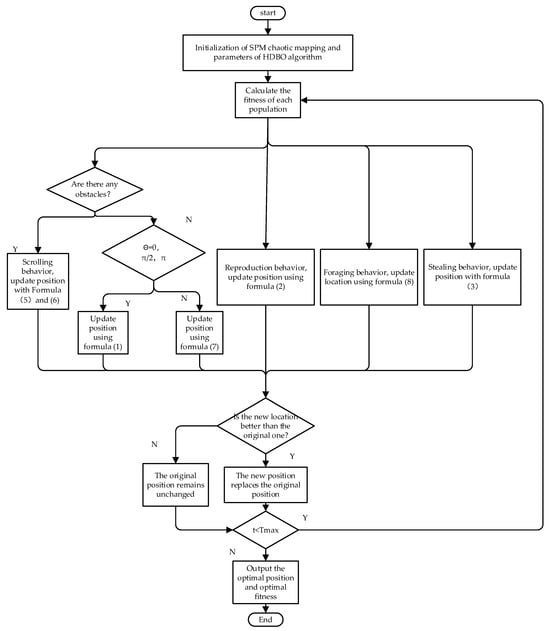
Figure 6.
HDBO algorithm flowchart.
Step 1: Initialize the dung beetle population using SPM mapping to increase population diversity.
Step 2: Calculate the fitness values of the dung beetle population.
Step 3: The dung beetles update their positions using Formulas (5) and (6) during the unobstructed ball-rolling phase, use Formula (1) or Formula (7) to update their positions when encountering obstacles during the ball-rolling process.
Step 4: For reproducing and foraging dung beetles, update their positions using Formulas (2) and (8), respectively. For stealing dung beetles, update their positions using Formula (3).
Step 5: Update the current optimal position.
Step 6: Determine if t is the maximum number of iterations. If yes, stop updating; otherwise, return to “Step 2” and continue.
Step 7: Output the optimal position and optimal fitness.
3.2. BiTCN Timing Modeling Principle
CFB boiler data is a multidimensional time series. Temporal Convolutional Network (TCN) combines the characteristics of traditional convolutional networks with the ability to adapt to data sequences, enabling it to capture local relationships in the operating state of CFB and reduce computational load. TCN is stacked by residual blocks, each containing causal convolution, dilated convolution, and residual connections. As an extended structure of the TCN model, BiTCN incorporates the entire operating time series of the CFB boiler into the model for learning, serving as the basic neural network structure for predicting the next operating state of the CFB boiler. It is combined with HDBO to enhance prediction performance. Figure 7 shows the network structure.
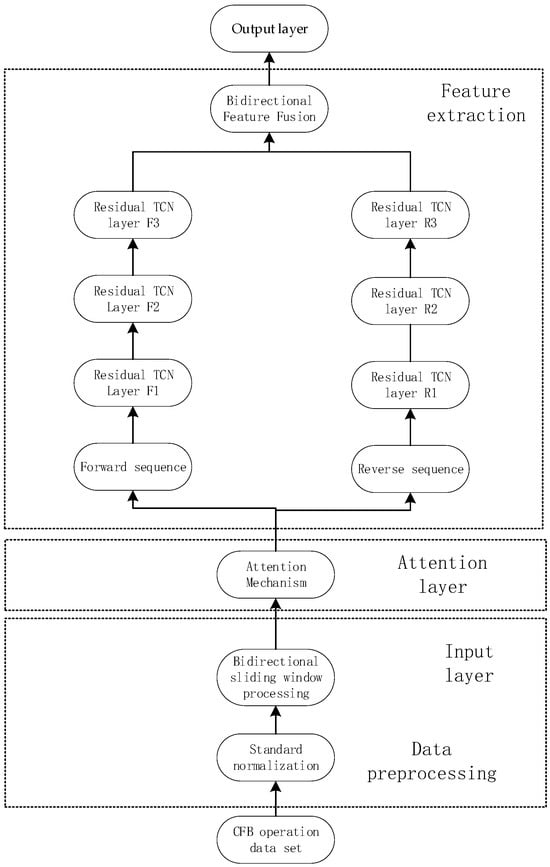
Figure 7.
Attention-BiTCN network structure.
In the data preprocessing stage, the min-max standard normalization process is carried out, that is, the differences between the data are eliminated in a unified dimensional way, and all the values in the data set are mapped to the range [0, 1], as shown in the Formula (14).
where is the normalized value, is the original data, is the minimum value of the dimension, and is the maximum value of the dimension.
In this paper, the bidirectional sliding window method is used to process the data into forward sequence and reverse sequence. In order to improve the bidirectional correlation of CFB boiler operation data, forward and reverse sequences were obtained by bidirectional sliding of normalized data. The length of the sequence after sliding window is shown in Formula (15).
where is the window length, is the slide step length, , are the sample length, and is the length of the generated sequence.
The bidirectional sequence is obtained through the sliding window algorithm index value of the normalized data , as shown in Formula (16).
where is the normalized data, and the forward sequence and reverse sequence are obtained by sliding window index of the normalized data.
The forward sequence and reverse sequence generated by sliding window processing are shown in Formula (17).
Attention mechanism is a deep learning method proposed by imitating the thinking behavior of human brain. This method focuses on more critical, important information, reduces attention to unimportant information, eliminates useless information, solves the problem of information overload caused by excessive network parameters. This paper combined the attention mechanism with BiTCN to explore the ability of the attention mechanism to extract global information features at different positions before and after BiTCN, filter out unimportant information, verify the attention effect of the focused important information, and improve the efficiency and accuracy of model training. The attention weight coefficient and the eigenvalues obtained by weighted calculation are shown in Formula (18) and Formula (19), respectively.
where, is the attention weight coefficient at position , is the deep feature of the data at position , is the deep feature of the data, is the contextual selection feature, is the feature generated after the attention mechanism.
TCN is a process of expansion causality convolution, which mainly consists of three parts: causality convolution, expansion convolution and residual convolution. The TCN framework in this paper is composed of three layers, which are stacked by residuals with exponentially increasing expansion coefficients. Each layer of residuals retains important features of time series information and significantly improves the convolution effect of time series.
One-dimensional data is input into causal convolution, and when trained by one-dimensional convolution kernel, the output value at time t is only related to the value of the previous t moments and the values before the previous layer, as shown in Formula (20).
where, is the one-dimensional causal convolution kernel.
Unlike traditional convolution, expansive convolution is one-dimensional convolution. Through interval sampling, the expansion of the receptive field increases exponentially with the expansion coefficient, that is, a larger receptive field can be obtained by using fewer network layers. Using the expansion coefficient for interval sampling can significantly reduce the complexity of the network structure and the calculation amount of the model. By introducing dilatative convolution, the receptive field of TCN model is more flexible and can learn more comprehensive temporal information features. When processing one-dimensional data , the output value of the hidden layer at time t is shown in Formula (21).
where is the convolution kernel element at position , is the size of the convolution kernel, is the element after interval sampling, and is the expansion coefficient.
TCN introduces residual connections to train multi-layer networks. The original features are first added to the features extracted from the model, and then the short-circuit connection is carried out, which not only retains the important original features in the information extraction process, avoids the emergence of ladder disappearance or overfitting problems, but also improves the stability and depth of the model. The residual connection output is shown in Formula (22).
where is the input data and is a nonlinear transformation.
The residual block is mainly composed of causal expansion convolution, activation function (linear correction unit ReLU), weight normalization layer, space Dropout layer, and residual connection. Let the TCN model consist of k residuals stacked, and the output value after processing residuals is shown in Formulas (23) and (24).
where is the output value of the th layer in the th residual block, and , is the serial number of the residual block.
Forward and reverse features extracted from the model in this paper are fused, and the generation process is shown in Formula (25).
where is the fusion feature generated after fusion; is the fusion function, and the forward and reverse features are splice; is the output of the forward network, that is, the output of the forward third-layer residual block; is the output of the reverse network, that is, the output of the reverse third-layer residual block.
3.3. Integrated Model Based on HDBO-BiTCN
A comprehensive model is established for the thermal efficiency, NOx, and SO2 emissions of the CFB boiler based on HDBO-BiTCN. The process is shown in Figure 8. The parameters of the BiTCN model affect the training duration and forecasting performance of the model. Improper adjustment of the learning rate may lead to overfitting [25]. The regularization coefficient can prevent the neural network model from underfitting [20]. The number of key-value pairs affects the modeling ability of BiTCN. Therefore, the above three hyperparameters are optimized. This paper selects the DBO optimization algorithm to optimize the three hyperparameters existing in Deep-BiTCN. Some important parameter Settings are shown in Table 2.
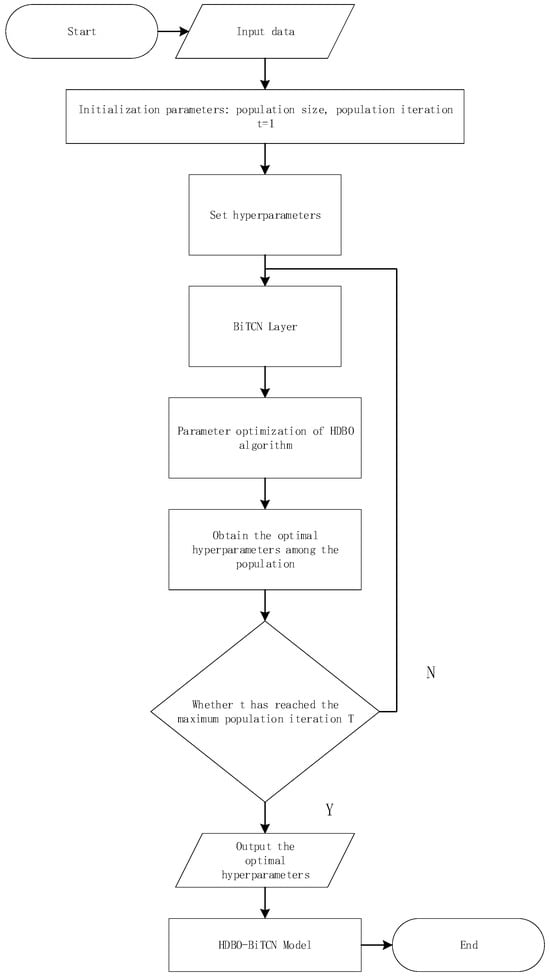
Figure 8.
HDBO-BiTCN flow chart.

Table 2.
Important parameter Settings.
3.4. Variable Selection
The denitrification method for the CFB boiler is SNCR direct urea solution injection. The simulation experimental data is sourced from the power plant’s CEMS. Some of the collected data, as shown in Figure 9, include load, total coal feed rate, separator inlet temperature, oxygen content (volume fraction of oxygen in the flue gas), and urea solution main pipe flow rate. The sampling period is 60 s, with a total of 1500 sampling points.
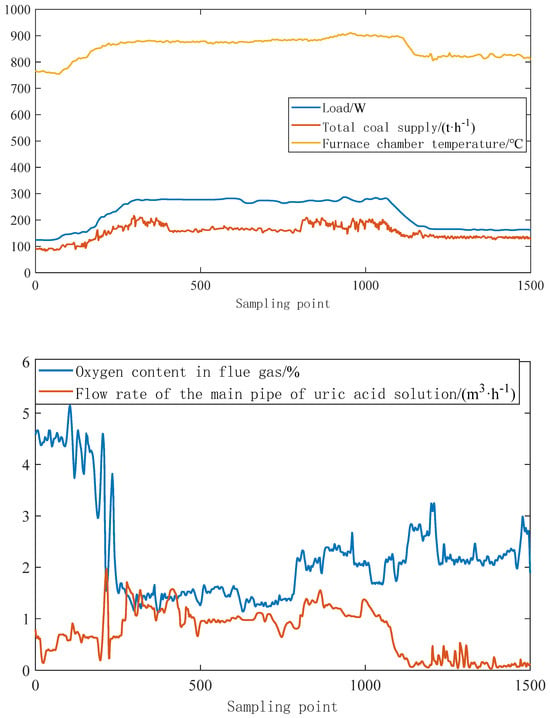
Figure 9.
Part of actual operation data of the power plant.
Firstly, the selection range of input variables for the model is determined through mechanism analysis. Then, the correlation between input variables and combustion efficiency, as well as SO2-NOx emission concentration, is determined by the Pearson coefficient method to obtain reasonable input variables for the model. Standardization and dataset division are carried out. After BiTCN is trained, the relative error of model training is calculated, and the three hyperparameters of BiTCN are optimized by HDBO to obtain the precise dynamic models of combustion efficiency and SO2-NOx.
This paper selects 1500 data samples from the DCS of a 300 MW subcritical circulating fluidized bed unit under different operating conditions for testing the model’s adaptability during the training process and adjusting the model parameters. The data from 1050 to 1200 are used as the first test set. The second test set contains data from 1201 to 1500, which is mainly used to verify the model’s generalization ability.
After completing the selection and division of data, based on the mechanism and actual situation on site, the input variables of the model are determined through analysis. During the combustion process of CFB boilers, there are many factors that affect the thermal efficiency and the mass concentrations of SO2 and NOx. After analyzing the reverse balance calculation process of thermal efficiency and the generation mechanism of NOx, 13 influencing variables were initially selected, including load, bed temperatures of the front and rear walls, coal feeding amounts on the left and right sides, the flow rates of primary air on the left and right sides at the burner inlet, the temperatures of primary air on the left and right sides at the burner inlet, the flow rates of secondary air on the left and right sides, the temperatures of secondary air on the left and right sides, the inlet temperature of the separator, oxygen content, flue gas temperature, the average carbon content of fly ash in the dust collector, coal type calorific value, and urea main pipe flow rate. In total, there are 19 variables. The adjustable parameters include the following: the coal feed rates on the left and right sides (, ), the primary air flow rates (, ), primary air temperatures (, ), the secondary air flow rates (, ), the secondary air temperatures (, ), and the oxygen content in the flue gas . The other non-adjustable parameters include the load , the temperature of the front and rear wall beds (, ), the inlet temperature of the separator , the flue gas temperature , the average carbon content of the dust collector fly ash , the calorific value of the coal type , and the flow rate of the urea pipe .
The evaluation of variance contribution ratios for key parameters via Principal Component Analysis (PCA) [26] is detailed in Table 3 and Table 4, with all principal components exceeding the 86% significance threshold. This outcome confirms that the established parameter framework comprehensively covers the critical operational parameter space governing CFB boiler combustion efficiency and nitrogen/sulfur pollutant emission characteristics, thereby providing a complete dimensional basis for precise boiler performance characterization.

Table 3.
Variable parameter contribution degree.

Table 4.
Non-adjustable parameters contribution degree.
4. Result Analysis
4.1. Establish a Multi-Objective Integrated Model of HDBO-BiTCN
Establishing a comprehensive boiler model is a crucial prerequisite for achieving combustion optimization. Upon determining the input variables, the BiTCN comprehensive model is developed using MATLAB 2022a. The learning rate is constrained within the range of [0.0001, 0.01], while the regularization parameters are set between [0.0001, 0.001]. Additionally, the key values for the attention mechanism are defined within the bounds of [2, 50]. The optimal values for the learning rate, regularization parameters, and key values are determined through the application of the HDBO algorithm. For the HDBO, the parameters are configured as follows: a population size of 50 and a maximum number of iterations set to 100. The resultant optimization fitness curve, illustrating the convergence and efficiency of the process, is presented in Figure 10.
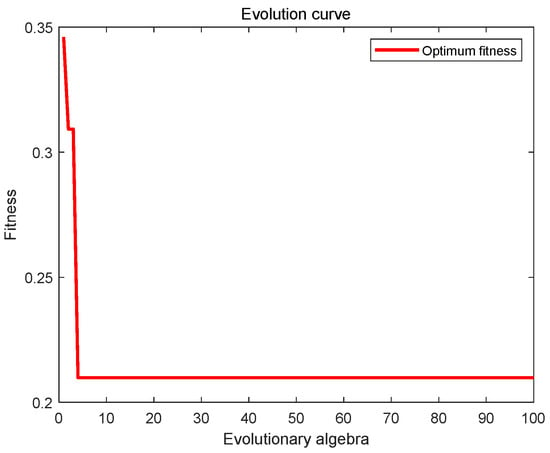
Figure 10.
Fitness function curve.
As shown in Figure 11, the results converge after approximately 5 iterations, with the operation results being Learning rate = 0.001, Regularization = 4.67 × 10⁻⁴, Keys = 10. By using MATLAB to input the optimized parameters into BiTCN, a comprehensive model of the CFB boiler is established based on 70 sets of training samples. The simulation results are shown in Figure 11, Figure 12 and Figure 13.
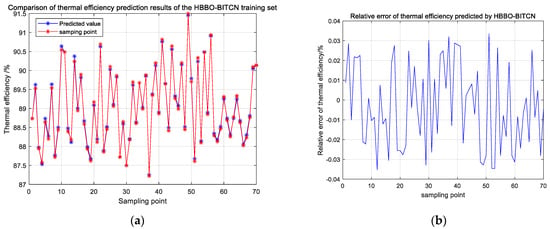
Figure 11.
(a) Prediction results of model thermal efficiency; (b) Prediction error of model thermal efficiency.
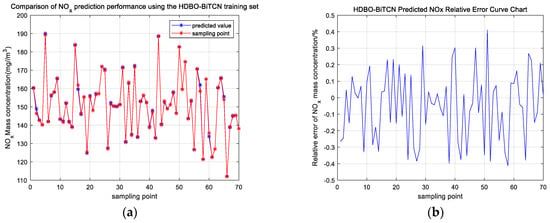
Figure 12.
(a) Prediction results of model NOx emission concentration; (b) Prediction error of model NOx emission concentration.
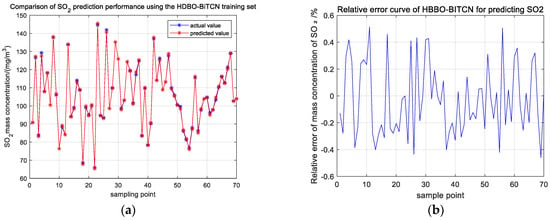
Figure 13.
(a) Prediction results of model SO2 emission concentration; (b) Prediction error of model SO2 emission concentration.
As evidenced in Figure 11, Figure 12 and Figure 13, the integrated model exhibits commendable tracking performance about boiler thermal efficiency and the mass concentrations of NOx and SO2, characterized by a high degree of fitting accuracy. Specifically, the average relative error between the predicted and actual thermal efficiency of the training samples is merely 0.04%. Similarly, the average relative errors for the predicted and actual mass concentrations of NOx and SO2 in the training samples are both 0.45%. These results collectively underscore the robust approximation capabilities of the established integrated model, while also highlighting the efficacy of the HDBO algorithm in optimizing the parameters of the BiTCN.
4.2. Case Study of Multi-Objective Combustion Optimization
Due to the strict environmental protection policy, the pollutant emissions of coal-fired units must be lower than the ultra-low emission standards, of which the NOx emission concentration and SO2 emission concentration shall not exceed 50 mg/m3 and 35 mg/m3 respectively.
By adjusting the adjustable parameters in the combustion process, the combustion optimization is transformed into a multi-objective optimization problem. However, there is a strong coupling characteristic between thermal efficiency and NOx emissions [27], so the objective function is defined as:
According to Formula (1), the multi-objective optimization problem is simplified and transformed into a single objective optimization problem, and the objective function formed is as follows:
where, , , and represent boiler thermal efficiency, NOx emission concentration, and SO2 emission concentration, respectively; α, β, and γ represent the weight of boiler thermal efficiency and pollutant emission level in the comprehensive optimization objective, respectively. Depending on the priority of the plant evaluation, the three values are 0.3, 0.4, and 0.3, respectively. In order to ensure that the above three indicators play the same role in the optimization process, the boiler heat efficiency, NOx emission concentration, and SO2 emission concentration are normalized.
The method for optimizing the objective function is to achieve the optimal values of three indicators by searching for the optimal adjustable parameters. Therefore, the selected auxiliary variables are further divided into adjustable parameters and non-adjustable parameters. The adjustable parameters include the coal feed rates on the left and right sides (, ), the primary air flow rates (, ), the primary air temperatures (, ), the secondary air flow rates (, ), the secondary air temperatures (, ), and the oxygen content in the flue gas . The other non-adjustable parameters remain constant during the optimization process.
The optimization range of adjustable parameters is set based on the original operating data of the boiler collected on-site and combined with the actual operating conditions. The constraint conditions for each parameter are as follows:
Improving boiler thermal efficiency and reducing NOx and SO2 emissions are three processes that are both complementary and contradictory. In practical optimization processes, each power plant needs to coordinate the relationship between them based on specific circumstances. When the focus differs, the optimization goals of the power plant will also vary.
Firstly, using the established comprehensive model of HDBO-BiTCN boiler thermal efficiency and NOx and SO2 emission mass concentration, the HDBO algorithm is employed to optimize 11 adjustable variables, including coal feed rate. Then, data samples under high, medium, and low load conditions are selected for optimization separately. With an initial population size of 100 and after 200 iterations, the variation processes of thermal efficiency and NOx and SO2 emission mass concentration under the three conditions are obtained. The optimization process of the objective function under a 50% rated load condition is shown in Figure 14.
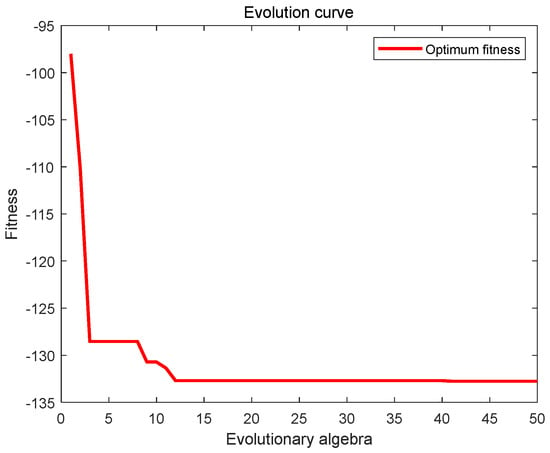
Figure 14.
Optimizing the evolution curve.
Secondly, the optimal adjustable parameter values are obtained as shown in Table 5. The non-adjustable parameters remain unchanged during the optimization process. The load is 300 MW, the temperature of the front and rear wall beds is 850 °C, the inlet temperature of the separator is 880 °C, the flue gas temperature is 140 °C, the average carbon content of the dust collector fly ash is 8%, the calorific value of the coal type is 18.8 MJ/kg, and the flow rate of the urea pipe is 1.4 t/h.

Table 5.
Optimal adjustable parameter value.
Finally, the comparison results of each adjustable parameter and optimization target parameter before and after optimization are obtained, as shown in Table 6.

Table 6.
Comparison results of parameters after multi-objective optimization.
The optimized CFB boiler not only improves combustion thermal efficiency but also reduces NOx emissions, indicating that the established HDBO-BiTCN integrated optimization model has achieved ideal results. Based on the specific operating conditions of the boiler, the weights α, β, and γ in the optimization objective function can be appropriately adjusted to achieve optimization goals when actual demands change. Based on this solution, the energy-saving and environmentally friendly potential of the CFB boiler itself can be further explored, fundamentally reducing urea usage, saving denitrification costs, and improving the economy of the power plant.
This study aims at the multi-objective optimization requirements of the combustion process of CFB boilers. By introducing spm initialization, oaa algorithm and local disturbance mechanism to improve DBO, the optimization ability of the algorithm in complex industrial scenarios has been significantly enhanced. The experimental results show that the improved DBO algorithm outperforms the second-generation non-dominated ranking genetic Algorithm (NSGA-II) [9] and the Adaptive Genetic Algorithm (AGA) [10] in the three key indicators of combustion efficiency, SO2 emissions and NOx emissions. Among them, the combustion efficiency is increased by an average of 0.5–1%. SO2 and NOx emissions were reduced by 15.1% and 30% respectively. This advantage stems from the deep integration of the hydrodynamic characteristics of CFB boiler combustion and practical operation experience during the algorithm improvement process. By constructing the HDBO-BiTCN model, the optimization process is more in line with the nonlinear dynamic characteristics under the variable load conditions of the boiler. Compared with the general optimization strategy of the traditional algorithm, it shows stronger engineering adaptability and environmental benefits.
5. Conclusions
Given the nonlinear and strong coupling characteristics of CFB boilers, this paper proposes a BiTCN optimization modeling method based on HDBO and optimizes and controls the combustion efficiency and pollution emission according to the model. The results show that the optimization strategy not only significantly improves the thermal efficiency of the boiler, but also dramatically reduces the emissions of NOx and SO2, which provides strong technical support for the green and low-carbon transformation of the energy industry. This achievement is not only in line with the macro policy of optimizing energy structure and reducing carbon emissions but also contributes to the achievement of the global sustainable development goals. Looking ahead, we will continue to deepen our research and promote the application of this technology in more fields, helping to build a cleaner and more efficient energy system and contributing to the sustainable development of society and draws the following conclusions:
(1) The operation of a CFB boiler is nonlinear, and the combustion efficiency is coupled with pollution emission.
(2) The enhanced HDBO algorithm significantly improved model prediction performance when integrated with BiTCN, utilizing SPM chaotic mapping for initial population generation, OOA-driven rolling strategies, and t-distribution perturbation enhanced foraging behavior.
(3) The experimental results show that the combustion efficiency of the optimized CFB boiler reaches 91.21%, which is 1% and 0.5% higher than that of references [9,10], and NOx and SO2 emissions are reduced to 11.23 mg/m3 and 23.75 mg/m3 respectively, which are 15.1% and 30% lower than those of references [9] and [20], respectively. The solution offers an innovative approach to the “efficiency-environment” trade-off in industrial applications, and at its core lies the deep integration of time-physical mechanisms with intelligent optimization strategies. This method has the potential to be extended to the coordinated control of coal-fired units and the optimization of new energy systems.
Author Contributions
G.C. and D.Y.: Methodology, Software, Writing—original manuscript. F.C.: Conceptualization, Writing—Reviewing and Editing. All authors commented on the manuscript. All authors have read and agreed to the published version of the manuscript.
Funding
The research was funded by the National Natural Science Foundation of China under Grant No. 62173136.
Institutional Review Board Statement
Not applicable.
Informed Consent Statement
Not applicable.
Data Availability Statement
The data that support the findings of this study are available from the corresponding author upon reasonable request.
Conflicts of Interest
The authors declare that they have no known competing financial interests or personal relationships that could have appeared to influence the work reported in this paper.
References
- Xu, J.; Cui, Z.; Ma, S.; Wang, X.; Zhang, Z.; Zhang, G. Data based digital twin for operational performance optimization in CFB boilers. Energy 2024, 306, 132532. [Google Scholar] [CrossRef]
- Yan, G.; Qiao, J.; Wu, Y.; Zheng, L.; Xue, X. NOx concentration modeling in CFB coal-fired power plants based on feature engineering and deep random forest. Process Saf. Environ. Prot. 2025, 195, 106754. [Google Scholar] [CrossRef]
- Xiankun, H.; Zhang, B.; Xiaoli, Z. Gas-Solid Flow, Combustion Characteristics, and Gas Emissions in a 75 t/h CFB Boiler Based on the CPFD Method. J. Therm. Sci. 2025, 34, 323–336. [Google Scholar]
- Zhang, Y.; Zhang, B.; Wu, Z. Multi-Model Modeling of CFB Boiler Bed Temperature System Based on Principal Component Analysis. IEEE Access 2019, 8, 389–399. [Google Scholar] [CrossRef]
- Li, N.; Hu, Y. A novel NOx prediction model using the parallel structure and convolutional neural networks for a coal-fired boiler. Energy Sci. Eng. 2023, 11, 1589–1600. [Google Scholar] [CrossRef]
- Ji, Z.; Tao, W.; Ren, J. Boiler furnace temperature and oxygen content prediction based on hybrid CNN, biLSTM, and SE-Net models. Appl. Intell. 2024, 54, 8241–8261. [Google Scholar] [CrossRef]
- Krzywanski, J.; Czakiert, T.; Blaszczuk, A. A generalized model of SO2 emissions from large- and small-scale CFB boilers by artificial neural network approach. Fuel Process. Technol. 2015, 137, 66–74. [Google Scholar] [CrossRef]
- Feng, H.; Rui, W.; Jie, S. A performance evaluation framework for deep peak shaving of the CFB boiler unit based on the DBN-LSSVM algorithm. Energy 2022, 238, 121659. [Google Scholar]
- Han, L.; Wang, L.; Yang, H.; Jia, C.; Meng, E.; Liu, Y.; Yin, S. Optimization of Circulating Fluidized Bed Boiler Combustion Key Control Parameters Based on Machine Learning. Energies 2023, 16, 5674. [Google Scholar] [CrossRef]
- Ren, L. Combustion efficiency control method of circulating fluidized bed boiler based on adaptive genetic algorithm. J. Phys. Conf. Ser. 2024, 2717, 012040. [Google Scholar] [CrossRef]
- Ye, Y.; Lin, H.; Zhou, H. Modeling and prediction of key parameters of circulating fluidized bed boiler based on Transformer. J. Taiwan Inst. Chem. Eng. 2014, 162, 105622. [Google Scholar] [CrossRef]
- Hong, F.; Chen, J.; Zhang, Z.; Wang, R.; Gao, M. Time Series Risk Prediction Based on LSTM and a Variant DTW Algorithm: Application of Bed Inventory Overturn Prevention in a Pant-Leg CFB Boiler. IEEE Access 2020, 8, 156634–156644. [Google Scholar] [CrossRef]
- Yue, G.; Cai, R.; Lu, J.; Zhang, H. From a CFB reactor to a CFB boiler—The review of R&D progress of CFB coal combustion technology in China. Powder Technol. 2017, 316, 28. [Google Scholar]
- Zhang, M. Characteristic-particle-tracked modeling for CFB boiler: Coal combustion and ultra-low NO emission. Powder Technol. 2020, 374, 632–647. [Google Scholar] [CrossRef]
- Li, G.; Niu, P. Combustion optimization of a coal-fired boiler with double linear fast learning network. Soft Comput. 2016, 20, 149–156. [Google Scholar] [CrossRef]
- Zhang, X.; Ye, J.; Gao, L.; Ma, S.; Xie, Q.; Huang, H. Short-term wind power prediction based on ICEEMDAN decomposition and BiTCN–BiGRU-multi-head self-attention model. Electr. Eng. 2024, 107, 2645–2662. [Google Scholar] [CrossRef]
- Fu, J.; Wu, C.; Wang, J.; Haque, M.M.; Geng, L.; Meng, J. Lithium-ion battery SOH prediction based on VMD-PE and improved DBO optimized temporal convolutional network model. J. Energy Storage 2024, 87, 111392. [Google Scholar] [CrossRef]
- Wang, W.; Cui, X.; Qi, Y.; Xue, K.; Liang, R.; Bai, C. Prediction Model of Coal Gas Permeability Based on Improved DBO Optimized BP Neural Network. Sensors 2024, 24, 2873. [Google Scholar] [CrossRef]
- Huang, Y.; Shi, M. What are the environmental advantages of circulating fluidized bed technology?—A case study in China. Energy 2021, 220, 119711. [Google Scholar]
- Yu, H.; Gao, M.; Zhang, H.; Yue, G.; Zhang, Z. Data-driven optimization of pollutant emission and operational efficiency for circulating fluidized bed unit. Energy 2023, 281, 128338. [Google Scholar] [CrossRef]
- Qin, N.; Li, R.J. Online simplified model and experimental comparison of CFB boiler thermal efficiency. Appl. Therm. Eng. 2020, 171, 115021. [Google Scholar] [CrossRef]
- Xue, J.; Shen, B. Dung beetle optimizer: A new meta-heuristic algorithm for global optimization. J. Supercomput. 2023, 79, 7305–7336. [Google Scholar] [CrossRef]
- Huang, Y.-B.; Li, H.; Wang, Y.; Xie, Y.-R.; Zhang, Q.-Y. A high security BioHashing encrypted speech retrieval algorithm based on feature fusion. Multimed. Tools Appl. 2021, 80, 33615–33640. [Google Scholar] [CrossRef]
- Lei, W.; Han, J.; Wu, X. Improved Osprey Optimization Algorithm with Multi-Strategy Fusion. Biomimetics 2024, 243, 670. [Google Scholar] [CrossRef]
- Huang, B.; Hong, W.; Shao, K.; Wu, H. Sensitivity Analysis Study of Engine Control Parameters on Sustainable Engine Performance. Sustainability 2024, 16, 11107. [Google Scholar] [CrossRef]
- Greenacre, M.; Groenen, P.J.; Hastie, T.; d’Enza, A.I.; Markos, A.; Tuzhilina, E. Principal component analysis. Nat. Rev. Methods Primers 2022, 2, 100. [Google Scholar] [CrossRef]
- Wu, H.; Xie, F.; Han, Y.; Zhang, Q.; Li, Y. Effect of cetane coupled injection parameters on diesel engine combustion and emissions. Fuel 2022, 319, 123714. [Google Scholar] [CrossRef]
Disclaimer/Publisher’s Note: The statements, opinions and data contained in all publications are solely those of the individual author(s) and contributor(s) and not of MDPI and/or the editor(s). MDPI and/or the editor(s) disclaim responsibility for any injury to people or property resulting from any ideas, methods, instructions or products referred to in the content. |
© 2025 by the authors. Licensee MDPI, Basel, Switzerland. This article is an open access article distributed under the terms and conditions of the Creative Commons Attribution (CC BY) license (https://creativecommons.org/licenses/by/4.0/).