Article

Research on Coupling Coordination Level Between New-Quality Productivity and Industrial Structure Upgrading in the Yangtze River Economic Belt Urban Area

School of Geographic Sciences, East China Normal University, Shanghai 200241, China
*
Author to whom correspondence should be addressed.
Sustainability 2025, 17(11), 5201; https://doi.org/10.3390/su17115201
Submission received: 27 April 2025 / Revised: 27 May 2025 / Accepted: 29 May 2025 / Published: 5 June 2025

Abstract

:
New-quality productivity and industrial structure upgrading has become a primary area of concern with respect to regional economic transformation and sustainable development. Based on static panel data of 108 prefecture-level-and-above cities in the Yangtze River Economic Belt from 2013 to 2022, the projection pursuit model, coupling coordination degree model, and obstacle degree model were used to study the spatiotemporal patterns and key obstacle factors in the coupling of new-quality productivity and levels of industrial upgrading. Results show the following: (1) The average coupling coordination degree increased from 0.42 in 2013 to 0.53 in 2022, exhibiting a three-stage trend of “initial advancement, rapid growth, and high-level fluctuation”. (2) Regionally, a gradient pattern of “downstream leading, midstream following, and upstream catching up” persists, but regional gaps have narrowed significantly. (3) Spatially, the coupling coordination level shows a pattern of “high in the east, low in the west, led by the core, and breakthrough in the local area”, with significant positive aggregation characteristics. (4) The main obstacle factors across the entire area include digital patents (7.03%), green patents (7.03%), and the number of high-tech enterprises (6.96%), but the weights of the obstacle factors vary greatly across different areas. These findings provide scientific support for green transformation, regional integration, and sustainability-oriented industrial policy design in the Yangtze River Economic Belt.

1. Introduction

Against the strategic backdrop of addressing global climate change and advancing the goal of carbon neutrality, “high-quality development” has become a prominent topic of discussion in the government, academia, and industry over the past three years, advocating a shift in China’s economy from factor-driven growth to innovation-driven intensive development underpinned by green innovation. The Chinese government believes that high-quality development needs to be driven by new theories of productivity. It has therefore proposed that new-quality productivity is generated by the deep transformation and upgrading of industries, with its basic connotation being the leap forward in the optimization and combination of workers, means of production, and objects of labor. Its main characteristic is innovative and advanced productivity. New-quality productivity represents the most dynamic and influential part of the industrial system, playing a key role in promoting the construction of a modern industrial system and high-quality economic development. It is evident that new-quality productivity is not only the product of industrial transformation and upgrading but also their driving force [1].
The Yangtze River Economic Belt spans the eastern, central, and western regions of China, covering 11 provinces and municipalities. Its economic output accounts for nearly half of the country’s total. The transformation of industrial structure not only profoundly affects the regional development pattern, but also undertakes the demonstrative mission of exploring the synergistic path of economic growth and ecological protection. However, with the acceleration of global industrial chain restructuring and the domestic economy entering a stage of high-quality development, the Yangtze River Economic Belt is facing multidimensional transformation pressures: the reconfiguration of global value chains is accelerating and forcing the upgrading of industrial competitiveness [2], carbon intensity constraints require the reshaping of industrial energy structures, and spatial mismatches and path-dependence of innovation factors are constraining the effectiveness of transformation. Against this backdrop, the synergistic development of new-quality productivity and industrial upgrading has transcended purely economic issues and has become a key pivot for integrating the quality of economic growth and the benefits of ecological protection and climate resilience. These dynamics align closely with the strategic goals outlined in national plans such as the Yangtze River Economic Belt Development Outline, the 14th Five-Year Plan, and China’s commitment to achieve carbon neutrality by 2060. The findings of this study provide empirical support for these policy frameworks by identifying where coordination between productivity and industrial upgrading is strongest or weakest, thereby helping to prioritize differentiated policy interventions across regions. Moreover, understanding the spatial pattern of coordination and its key obstacles contributes to refining initiatives such as regional integration, innovation-driven development, and green industrial transformation—key pillars in current national development strategies. In addition, it is worth paying attention to the fact that environment-oriented technological innovation represented by green patents is bringing changes in the development model through a dual path: reshaping the industrial efficiency curve through the enhancement of cleaner production technologies, and promoting the green reconfiguration of the industrial chain through the leap in the technological paradigm. This techno-economic paradigm shift has made green productivity deeply embedded in the new high-quality productivity system, and has become a key to cracking the ternary equation of synergistic economic–environmental–social development.
In this context, how can we assess the level of the new-quality productivity and the industrial structure upgrading to reflect the sustainability of regional development? What is the development trend and regional imbalance of the coordination between new-quality productivity and industrial structure upgrading in the Yangtze River Economic Belt? What are the obstacle factors affecting this coordination? The answers to these questions are of far-reaching significance for promoting the construction of a modernization system and achieving sustainable regional development. To ensure the concept is clear and internationally relatable, we define new-quality productivity as a multidimensional form of productivity arising from the integration of digital transformation, green innovation, and high-quality human capital. This concept extends traditional productivity by embedding sustainability and technological sophistication as core drivers of economic output.
This aligns with global frameworks such as the OECD’s concept of knowledge-based capital, which emphasizes the role of intangible assets in economic growth, and the World Economic Forum’s focus on productivity enablers for the Fourth Industrial Revolution, including digital infrastructure and innovation ecosystems. Empirical studies on smart productivity and green total factor productivity also highlight similar mechanisms [3,4]. Based on these insights, we construct our evaluation system using three dimensions: new-quality laborers, labor materials (infrastructure), and labor objects (industry targets), detailed in Section 3.

2. Literature Review

2.1. New-Quality Productivity

Research on new-quality productivity first requires a clear understanding of its concept and connotations. Scholars have analyzed them from multiple perspectives, including political economy, geography, and management. Specifically, political economists believe that new-quality productivity transcends traditional productivity in terms of laborers, means of labor, and objects of labor, representing the development and innovation of Marxist productive force theory [5]. Geographers believe that new-quality productivity is not only a capability for coordinating new human–land relationships and promoting harmonious coexistence between humans and nature, but also the key driver of industrial revolution toward intelligent revolution and agricultural civilization toward ecological civilization, as well as the driving force behind the construction of a beautiful China [6]. Management scholars, on the other hand, view new-quality productivity as an update of a company’s dynamic capabilities [7]. Based on an analysis of its conceptual framework, some scholars have attempted to establish relevant indicators to conduct a comprehensive evaluation from multiple dimensions. For example, calculations have been made based on three elements: new-quality labors, new-quality labor material, and new-quality labor object [8]; a comprehensive evaluation system has been constructed based on scientific and technological, green, and digital productivity [9]. Some scholars have drawn on the “physical-logical-human” systems methodology to construct indicators for new-quality productivity [10]. Building on the evaluation indicators, they have found that the distribution of new-quality productivity exhibits spatial heterogeneity. They have attempted to conduct a spatiotemporal analysis of the measured levels of new-quality productivity at the provincial, municipal, and river basin levels [10,11,12] and analyzed the evolution of their spatial correlation network structures [13]. In addition, scholars have also studied the relationship between the two, including the relationship between new-quality productivity and high-quality development, new industrialization, the digital economy, the modern industrial system, green development, and foreign trade [14,15,16,17,18,19]. Although most existing studies originate from the Chinese policy and academic context, the concept of new-quality productivity is resonant with global perspectives on productivity evolution. For example, the OECD highlights “knowledge-based capital” as a key source of productivity, encompassing human capital, software, data, and intellectual property. Similarly, the World Economic Forum identifies digital connectivity, AI, and green innovation as major enablers of economic transformation in the Fourth Industrial Revolution. These international frameworks emphasize the increasing importance of intangible, digital, and sustainable factors, corresponding closely to the connotations of new-quality productivity as proposed in this study. However, most of the relevant research focuses on one-way relationships and lacks exploration of two-way interactive mechanisms.

2.2. Industrial Structure Upgrading

Research on industrial structure upgrading is a classic issue. Scholars aiming at establishing measurements have attempted to classify industrial structure upgrading into indicators such as rationalization [20], advancement [21], intensification [22], and efficiency [23]. Internationally, some scholars have evaluated industrial upgrading from a global value chain perspective, trying to measure the degree of industrial upgrading in various countries through factor analysis to extract indicators such as global value chain participation and upstream intensity [24]. Research thus suggests that current studies on industrial structure upgrading primarily focus on the macro level, with only a few scholars giving consideration to its micro perspective and constructing an industrial structure upgrading index from the perspective of enterprise entry [25]. In terms of regional case studies, scholars have used quantitative methods to measure regional differences in the optimization and upgrading of industrial structures in the Yangtze River Economic Belt and analyzed their spatial convergence [26]. Other scholars have attempted to expand research on industrial structures and have studied the relationship between industrial structure upgrading and water resources, digital technology, new-quality productivity, and green development efficiency [27,28,29,30].

2.3. The Interactive Relationship Between New-Quality Productivity and Industrial Structure Upgrading

In studying their interactive relationship, scholars have found that new-quality productivity promotes industrial structure upgrading by influencing technological innovation levels [31] and improving resource allocation efficiency [32]. A few studies also focus on the regional heterogeneity of the influencing pathways, analyzing the spatial differentiation of the impact of new-quality productivity on industrial upgrading at the provincial [29] and municipal levels [32]. As research on the unilateral impact of new-quality productivity on industrial structure upgrading has gradually matured, some scholars have begun to focus on the bidirectional relationship between these two concepts. Building on the development of measurement indicators for new-quality productivity, they have studied the coupled coordination relationship between these factors and industrial structure advancement at the provincial level, thereby enriching the existing research on their mutual influence [33].
A review of the existing literature reveals that while extensive research has been conducted on new-quality productivity, industrial structure upgrading, and their inter-relationships, several gaps remain. From a research perspective, scholars have been unable to clarify the interactive mechanisms between the two and have not attempted to identify the obstacles to their coupling coordination; from a research scale perspective, studies on industrial structure upgrading primarily focused on the macro level, overlooking the underlying micro-level drivers. Lastly, studies on the coupling coordination level between the two have been limited to the provincial level, with little research conducted at more refined scales such as prefecture-level cities. Given this, this study aims to take the 108 prefecture-level-and-above cities in the Yangtze River Economic Belt as the research object, utilize panel data from 2013 to 2022 for each city, and employ the projection pursuit model, coupled coordination model, and obstacle degree model to analyze the spatiotemporal evolution characteristics of the coupling coordination level between new-quality productivity and industrial structure upgrading, as well as its obstacle factors, with the aim of providing theoretical support and empirical references for in-depth research into the synergistic mechanisms between new-quality productivity and industrial structure upgrading in cities along the Yangtze River Economic Belt.
Internationally, the interaction between productivity drivers and structural upgrading has also received increasing attention. For example, studies in OECD economies have shown how digital infrastructure and AI adoption contribute to higher productivity and faster transitions toward knowledge-intensive industries [3]. Simultaneously, industrial upgrading—such as the shift from manufacturing to services—has been shown to reshape innovation pathways and labor market composition, reinforcing productivity growth [34]. In developing countries, structural upgrading through participation in global value chains (GVCs) has also created feedback loops that foster technological learning and local productivity improvements [35]. These international experiences highlight the importance of systemic coordination between productivity reform and industrial policy, which aligns with the framework proposed in this study.

3. Materials and Methods

3.1. Research Area and Research Data

The Yangtze River Economic Belt spans China’s eastern, central, and western regions, accounting for 43.1% of its population and 46.5% of its GDP, making it a crucial growth pole for the Chinese economy. This paper takes the Yangtze River Economic Belt as its research area and sets the sample data period as 2013–2022. It excludes data from Xianyang City, Qianjiang City, Tianmen City, Bijie City, Tongren City, and autonomous prefectures, due to their severe data deficiencies during this period. Ultimately, 108 prefecture-level-and-above cities within the Yangtze River Economic Belt were selected as the research sample. Based on their spatial location within the Yangtze River basin, the Yangtze River Economic Belt is divided into the upstream area (Yunnan, Guizhou, Sichuan, and Chongqing), the midstream area (Hubei, Hunan, and Jiangxi), and the downstream area (Anhui, Zhejiang, Jiangsu, and Shanghai) [36]. This regional division is commonly used in Chinese academic and policy research, as it reflects both the hydrological flow of the Yangtze River and the administrative–geographical distribution of provinces. The upstream–midstream–downstream classification also aligns with major national strategies such as the Yangtze River Economic Belt Development Plan. However, it should be noted that this division does not fully capture functional economic networks or industrial agglomeration patterns, which may cross these administrative boundaries. For example, some midstream cities may share more industrial linkages with downstream hubs than with other cities in their segment. Therefore, while this tripartite structure provides a practical analytical framework, it has certain limitations when analyzing spatial interactions or cross-regional coordination mechanisms.
The research data are sourced from the China Urban Statistical Yearbook (2013–2022), provincial and municipal statistical yearbooks, annual reports of listed companies, the National Intellectual Property Administration, the Digital Finance Research Center at Peking University, and the registered enterprise database compiled by Cnopendata (https://www.cnopendata.com/). Missing data have been supplemented using linear interpolation.

3.2. Indicator System Construction

3.2.1. New-Quality Productivity Indicators

Based on the connotation and constituent elements of new-quality productivity, and in accordance with the principles of data availability and comparability at the municipal level, this study attempts to construct a measurement indicator system centered on three core dimensions: new-quality laborers, new-quality labor objects, and new-quality labor means. The labor structure and labor quality reflect the quantity and quality of new-quality labor [37]. At the same time, emerging industry and green industry serve as the primary objects of new-quality productivity, indicating the development level of new-quality labor objects. The greenification level [38], digitalization level, innovation level [39], and infrastructure indicators are designed to measure the new-quality productivity from different dimensions based on their primary characteristics. Based on this, 8 principle layers and 23 indicator layers were established to quantify the development level and dynamic evolution patterns of new-quality productivity (Table 1). Although the indicator system includes a relatively large number of variables, each indicator was selected based on theoretical relevance, policy alignment, and data availability at the municipal level. The structure follows a “system layer–principle layer–indicator layer” hierarchy that reflects core dimensions of productivity and structural upgrading—such as innovation, digitalization, labor quality, and green transformation. Factor analysis was not employed in this study to preserve the thematic clarity and interpretability of each component, particularly for regional policymakers and stakeholders. This design enables targeted diagnosis of specific constraint factors, which would be obscured under aggregated indices. Nonetheless, future studies may apply exploratory factor analysis or principal component methods to assess latent constructs or reduce redundancy across dimensions.

3.2.2. Industrial Structure Upgrading Indicators

Industrial structure upgrading refers to the process of adjusting and optimizing the proportion of various industries in the national economy [40]. This enables the industrial system to leap from a low-value-added to high-value-added system, thereby improving the overall efficiency and competitiveness of the national economy. Industrial structure upgrading indicators are constructed from macro and micro perspectives to measure industrial structure upgrading more comprehensively. At the macro level, industrial structure rationalization and advancement are used as measures. When measuring industrial structure advancement, considering the Yangtze River Economic Belt’s important mission of “ecological priority and green development” in the national strategy, its industrial structure upgrading path must not only achieve high-quality economic structural transformation but also balance pollution reduction, carbon emission reduction, and green innovation. Therefore, the ratio of tertiary industry value added to secondary industry value added is used to measure industrial structure upgrading. The evaluation methods and quantitative formulas for industrial structure rationalization (ISR) are as follows [41]:
I S R i , t = 1 1 3 i = 1 3 | ( Y i , t / Y t ) ( L i   t / L t ) |
In the formula, ISRi,t represents the structural deviation index, i.e., an indicator of the rationalization of the industrial structure; Yi,t/Yt denotes the proportion of the three sectors in total output, i.e., the output structure; Li,t/Lt denotes the proportion of employment in the three sectors relative to total employment, i.e., the employment structure. The larger the value of ISRi,t the better the match between the output structure and the employment structure and the higher the level of rationalization. At the micro level, following relevant studies, the upgrading of the industrial structure is measured using the tertiary industry enterprise entry ratio to total enterprises [25] to account for the quantitative adjustments of micro-enterprises at the extensive margin (Table 1).

3.2.3. Data Standardization

To ensure comparability across indicators with varying units and scales, all raw data were normalized using min-max standardization. For indicators with a positive contribution to the target (positive indicators), the transformation formula is as follows:
Z i j = X i j X j m i n X j m a x X j m i n
For indicators with a negative contribution (negative indicators), the following formula is used:
Z i j = X j m i n X i j X j m a x X j m i n
where Xij denotes the original value, Xjmin and Xjmax represent the minimum and maximum of the j-th indicator across all cities and years, and Zij is the normalized result. This method ensures that all variables are transformed into a [0, 1] range, facilitating subsequent model computation.

3.3. Research Methods

The projection pursuit model [42] is particularly well-suited for high-dimensional, nonlinear indicator systems, and its ability to avoid artificial weighting makes it more objective than traditional methods such as PCA or entropy weight methods. The coupling coordination degree model [43] enables us to capture the interactive dynamics between two complex systems (new-quality productivity and industrial structure upgrading) and assess their synchronization levels over time and across space. Finally, the obstacle degree model [44] is valuable for identifying the relative importance of constraints within multidimensional indicator systems, helping to pinpoint regional bottlenecks in development. Together, these models provide a comprehensive, multiscale analytical framework suitable for complex regional studies.
Following the logical sequence of “measurement-analysis-diagnosis”, the present study employs a projection pursuit model to calculate the new productive capacity and industrial structure upgrading index of the Yangtze River Economic Belt. As a second step, a coupling coordination degree model has been used to measure the coupling coordination level of the two systems. The selection of models and parameter settings follows established practice in regional coordination studies. In the projection pursuit model, an improved genetic algorithm was used for optimizing projection direction parameters, enhancing global search ability and reducing the likelihood of local minima. For the coupling coordination degree model, the weight coefficients for the two subsystems were set to α = β = 0.5, assuming equal importance of new-quality productivity and industrial structure upgrading in driving regional sustainable development. These settings are consistent with the relevant literature and ensure balanced evaluation of system interactions. The classification standards for the coupling coordination level are shown in Table 2. Finally, an obstacle degree model serves to diagnose the obstacle factors affecting the coupling coordination development of the two systems, and conduct an analysis based on the results.

4. Spatial and Temporal Evolution Characteristics of Coupling Coordination Level

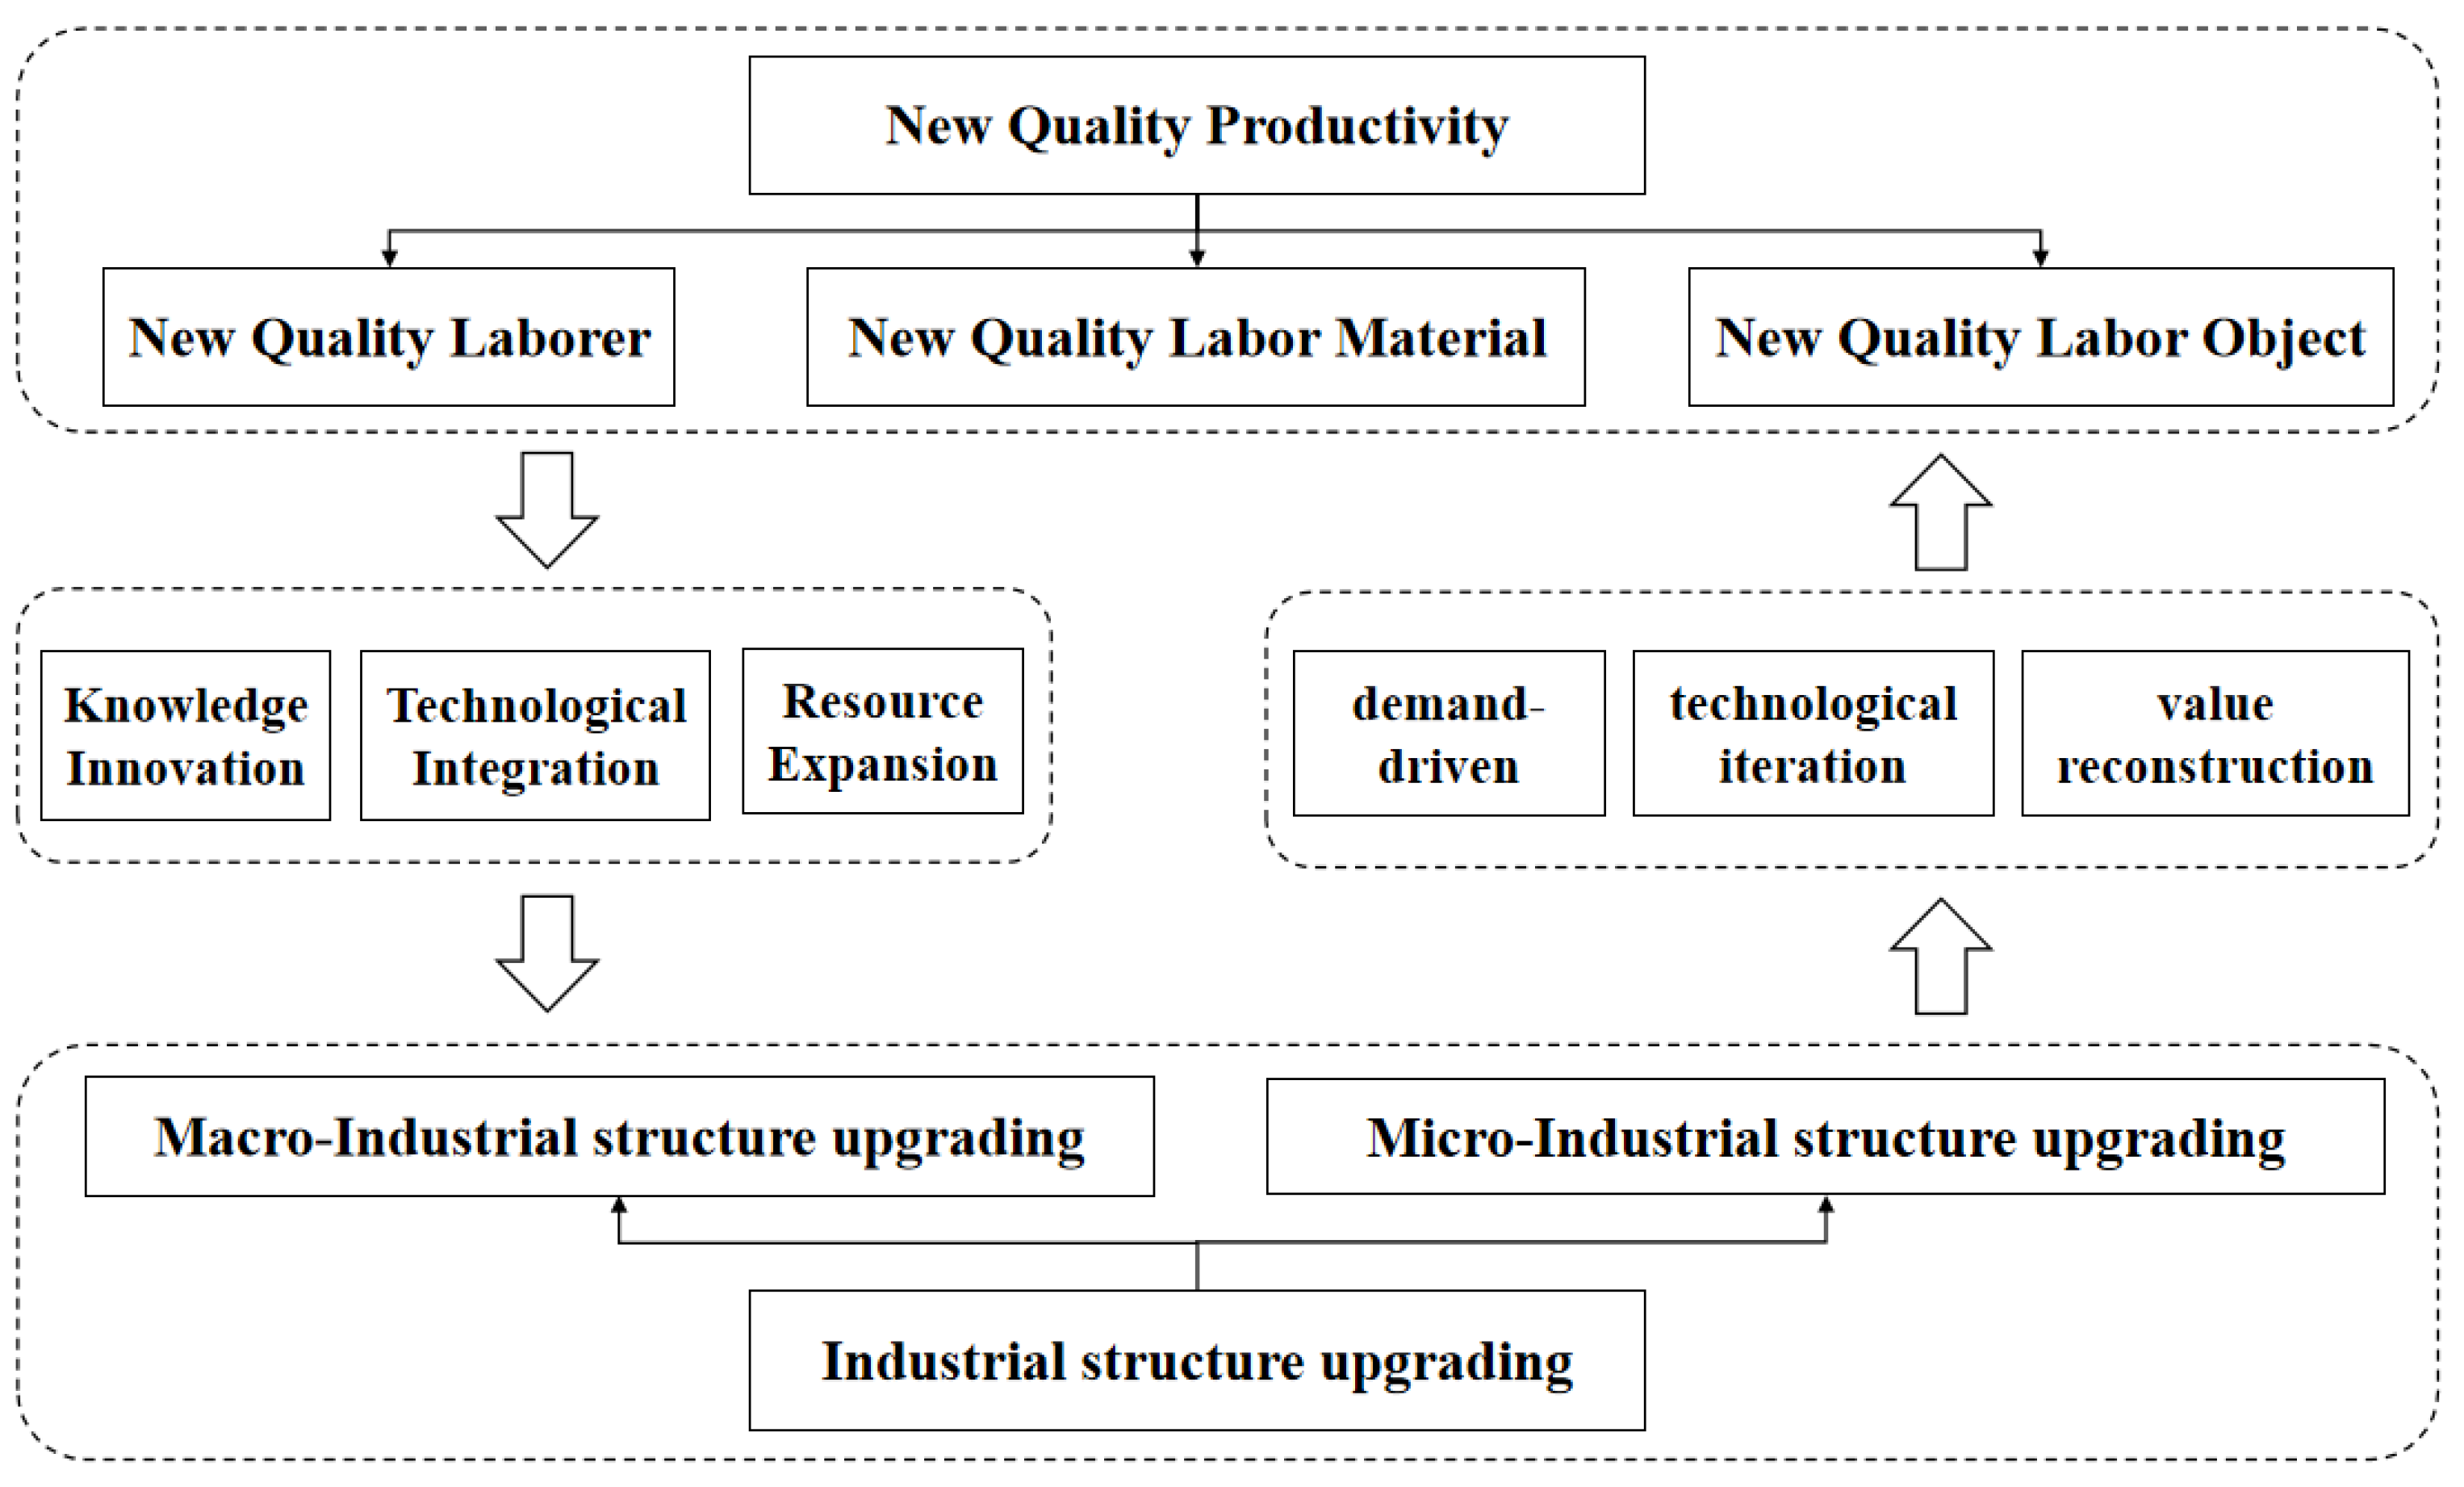
4.1. The Coupling Coordination Mechanism Between New-Quality Productivity and Industrial Structure Upgrading

New-quality productivity is a key driving force for industrial restructuring and upgrading. First, new-quality laborers can turn the cutting-edge knowledge and skills they have acquired into actual productivity through knowledge innovation, thereby promoting the intelligent transformation of traditional industries and the development of emerging industries. For example, artificial intelligence engineers and data analysts can inject digital and intelligent technologies into traditional industries, thus improving industrial structures. Second, through technological integration [45], new-quality labor materials utilize intelligent equipment and digital infrastructure to restructure production processes, thereby driving industries toward high-value-added and high-tech directions. For example, high-tech technologies like industrial robots and intelligent sensing devices can achieve production automation and precision, reducing costs and improving efficiency in traditional manufacturing. Third, through resource expansion, new-quality labor objects break traditional production boundaries and create new growth points [46]. For example, the rapid development of fields such as artificial intelligence, biotechnology, and new energy has created demand for new products, thereby driving the horizontal expansion of industrial structure upgrading.
Industrial structure upgrading can, in turn, support the development of new-quality productivity. First, industrial structure upgrading drives demand, forcing high-skilled labors to upgrade their knowledge structure and skills [47], thereby forming a positive feedback loop between skills and industry. For example, the surging demand for interdisciplinary talents by the high-tech industry has pushed the optimization of higher education and vocational training systems. Second, industrial structure upgrading drives the labor materials’ development of intelligent and green means of production through technological iteration [48]. For example, the rapid development of the new energy industry has laid the technological foundation for the iteration of charging stations, promoting their integration with 5G connectivity and smart grid technology to optimize charging power. Finally, industrial structure upgrading expands the application scenarios of labor objects through value reconstruction, thereby enhancing their economic value [49]. For example, the financial industry’s digital transformation converts data into credit assessment tools, upgrading data from “simple records” to “decision-making assets”, thereby becoming part of emerging industries.
In summary, the interaction between new-quality productivity and industrial structure produces positive synergies, and as the relationship between the two becomes increasingly close, it ultimately tends toward positive interaction (Figure 1).

4.2. The Temporal Evolution Characteristics of Coupling Coordination Level

4.2.1. Overall Sequence Evolution

From a temporal perspective (Figure 2), the average coupling coordination degree between new-quality productivity and industrial structure upgrading in the Yangtze River Economic Belt increased from 0.42 in 2013 to 0.53 in 2022, indicating that the relationship between new-quality productivity and industrial structure upgrading became increasingly close, with synergistic effects gradually strengthening. In terms of trend changes, the coupling coordination level of the Yangtze River Economic Belt exhibited distinct phased characteristics from 2013 to 2022.
The period from 2013 to 2014 marked the initial development phase, during which new-quality productivity was just starting to grow. Thus, industrial structure upgrading primarily relied on traditional pathways [50], and significant disparities existed between regions. From 2014 to 2019, the region entered a phase of rapid leapfrog development, driven by both policy guidance and technological innovation. The Belt and Road Initiative and the Outline Plan for the Development of the Yangtze River Economic Belt provided a clear direction for high-quality regional development, with ecological priority and green development becoming the main themes [51]. At the same time, the promotion of supply-side structural reforms has pushed production capacity out of the market, releasing space for the aggregation of factors and resources in advanced manufacturing and high-tech industries. The period from 2019 to 2022 was a stage of high volatility, during which the state accelerated the implementation of policies in the digital economy, green manufacturing, and high-end industries to promote the deep integration of new-quality productivity into the regional industrial system. However, between 2020 and 2022, despite an overall upward trend, the acute impact of the COVID-19 pandemic led to a slowdown in coordination growth in some cities, with some even experiencing a slight decline, particularly in mid-tier cities. This fluctuating development indicates the need to strengthen resilience and adaptability of the coordinated development of new-quality productivity and industrial structure upgrading in the face of sudden public health emergencies.

4.2.2. Regional Time-Series Evolution

By region (Figure 2), the three regions consistently showed a gradient distribution of “downstream leading, midstream following, and upstream catching up”, but the gap narrowed year by year and reached its minimum in 2019.
Specifically, the coupling coordination degree of the upstream area increased from 0.39 in 2013 to 0.49 in 2022, an increase of 0.10, although the overall level is still slightly lower than the average value of the whole belt. The years from 2016 to 2019 were a period of obvious accelerated enhancement, with an average annual increase of more than 0.02, mainly thanks to the support of the national Western development strategy and the construction of open channels such as China–European Union liner, the New Western Land–Sea Corridor, and other open channel construction brought about by the synergistic effect of industry. However, limitations in ecological carrying capacity and talent mobility bottlenecks still constrain the region from further enhancement; the coupling coordination degree of the midstream region grows from 0.41 to 0.52, with a cumulative increase of 0.11, and the overall fluctuation is relatively small, showing a steady upward trend. The growth between 2016 and 2018 is obvious and reflects the initial results of the driving effect of the provincial capital city and the optimization of the regional industrial structure. The 2020 pandemic caused an impact on the midstream region. In 2020, the pandemic had a significant impact on core cities such as Wuhan, and the coupling degree of coordination fell, but with the support of policy repair and local contingency mechanisms, it recovered and continued to improve in 2022. The downstream region was always in a leading position, with a coupling degree of coordination rising from 0.45 in 2013 to 0.56 in 2022, an increase of 0.11. It was the first region to break through the “reluctant coordination” range and stabilize at a high level. Benefiting from its strong economic foundation, well-developed industrial chains, and advantages in the concentration of innovative resources, this region has demonstrated strong momentum in developing new productivity and maturing industrial synergies, thus achieving remarkable results, especially in the integration of industrial intelligence, greening, and digitalization.

4.3. Spatial Distribution Characteristics of Coupling Coordination Level

In order to more intuitively demonstrate the spatial evolution characteristics of the synergistic development of the new-quality productivity and industrial structure upgrading in the Yangtze River Economic Belt, this paper selects 2013, 2016, 2019, and 2022 as the representative node years, and draws the spatial distribution maps of the degree of coupling and coordination by using the GeoDa 1.20 (see Figure 3). These four years reflect the evolutionary trajectory of regional development from starting exploration to speeding up expansion until synergy optimization. Among them, 2013 serves as the starting point of the time series of this study; 2016 is the key node of the policy turnaround; 2019 represents the effectiveness period after the deepening of the development strategy of the Yangtze River Economic Belt; and 2022 is the latest data node, which is able to comprehensively present the cumulative effect of the policy implementation and the developmental effect of the economic transformation. At the same time, 2022 reflects the level of synergistic development of new-quality productivity and the upgrading of the industrial structure under the impact of epidemic conditions. The spatial distribution evolution can be seen in the figure below.
(1)
In 2013, the dominant types of regional coupling coordination were mild imbalance (32.4%) and near imbalance (50%). At that time, only Shanghai was in a state of good coordination. Cities in the primary coordination and reluctant coordination stages accounted for 14.8%, primarily provincial capital cities along the Yangtze River Economic Belt, such as Hangzhou, Nanjing, Chengdu, Guiyang, etc. Baoshan and Lincang had relatively low coupling coordination levels, remaining in the serious imbalance stage.
(2)
In 2016, the main type of regional coordination was near imbalance (57.4%), with Hangzhou being the only new city added to this category. Cities in the primary coordination stage accounted for 4.6%, including Chengdu, Nanjing, Suzhou, Wuxi, and Wuhan. Cities in a state of mild imbalance decreased to 16.7%, while cities in a state of reluctant coordination increased to 19.44%. There were no cities in a state of serious imbalance.
(3)
In 2019, the regional coupling coordination type was dominated by near imbalance (47.2%) and reluctant coordination (40.7%). Shanghai rose to become a high-quality coordinated city; the number of good coordination cities increased to three, with Suzhou and Nanjing added to the list, and the proportion of primary coordination types rose to 8.33%. There were no cities with serious imbalance or mild imbalance.
(4)
In 2022, the regional coupling coordination type was still dominated by near imbalance (45.4%) and reluctant coordination (41.3%). There was still only one city with high-quality coordination, namely Shanghai, while the number of cities with good coordination increased to four, with Chengdu being added to the list.
Overall, the spatial coordination pattern of new-quality productivity and industrial structure upgrading in the Yangtze River Economic Belt indicates a “high east, low west, core-led, and localized breakthrough” trend: the high east, low west pattern remains prominent, with the Yangtze River Delta region standing out as a high ground for coordinated development due to its advantages in institutional innovation, active market mechanisms, and efficient factor mobility. Shanghai, in particular, has consistently maintained its leading position as a growth pole for regional development. Leading the trajectory of growth are core cities such as Nanjing, Suzhou, and Chengdu, which are provincial capitals and sub-provincial cities with advanced higher education, industrial platforms, and policy support. These cities have maintained high levels of coordination, driving the formation of a “point-to-area” radiation effect across the region. Resource-based cities are experiencing localized growth, such as Yichun, which is leveraging its lithium ore resources to develop the new energy industry, driving the upgrading of the industrial chain toward higher-end segments, and achieving high-quality development of new-quality productivity, thereby promoting coordinated improvement in surrounding areas.

4.4. Analysis of Spatial Correlation of Coupling Coordination Level

4.4.1. Global Spatial Autocorrelation Analysis

Based on GeoDa software, the spatial correlation of the coupling coordination degree of various cities between 2013 and 2022 was examined using the global Moran’s I index to identify whether there is a spatial clustering effect and its changing trend over time.
As shown in Table 3, the Moran’s I index of coupling coordination among cities in the Yangtze River Economic Belt was always positive and passed the 0.01 significance level test, indicating that the coupling coordination level between new-quality productivity and industrial structure upgrading exhibits a significant positive spatial clustering pattern and is not randomly distributed. The annual variation in the global Moran’s I index is relatively large, and phase characteristics can be identified. From 2013 to 2016, the Moran’s I index showed an overall upward trend, rising from 0.252 to a peak of 0.304, with spatial characteristics gradually transforming from a “dispersion effect” to a “polarization effect”; from 2016 to 2019, instead, it showed a downward trend, and spatial clustering effects weakened, indicating that the spatial dependence of the coupling coordination between new-quality productivity and industrial structure upgrading during this period tended to decline. From 2020 to 2022, due to the impact of the pandemic, Moran’s I index fluctuated, yet overall still exhibited positive spatial clustering characteristics.

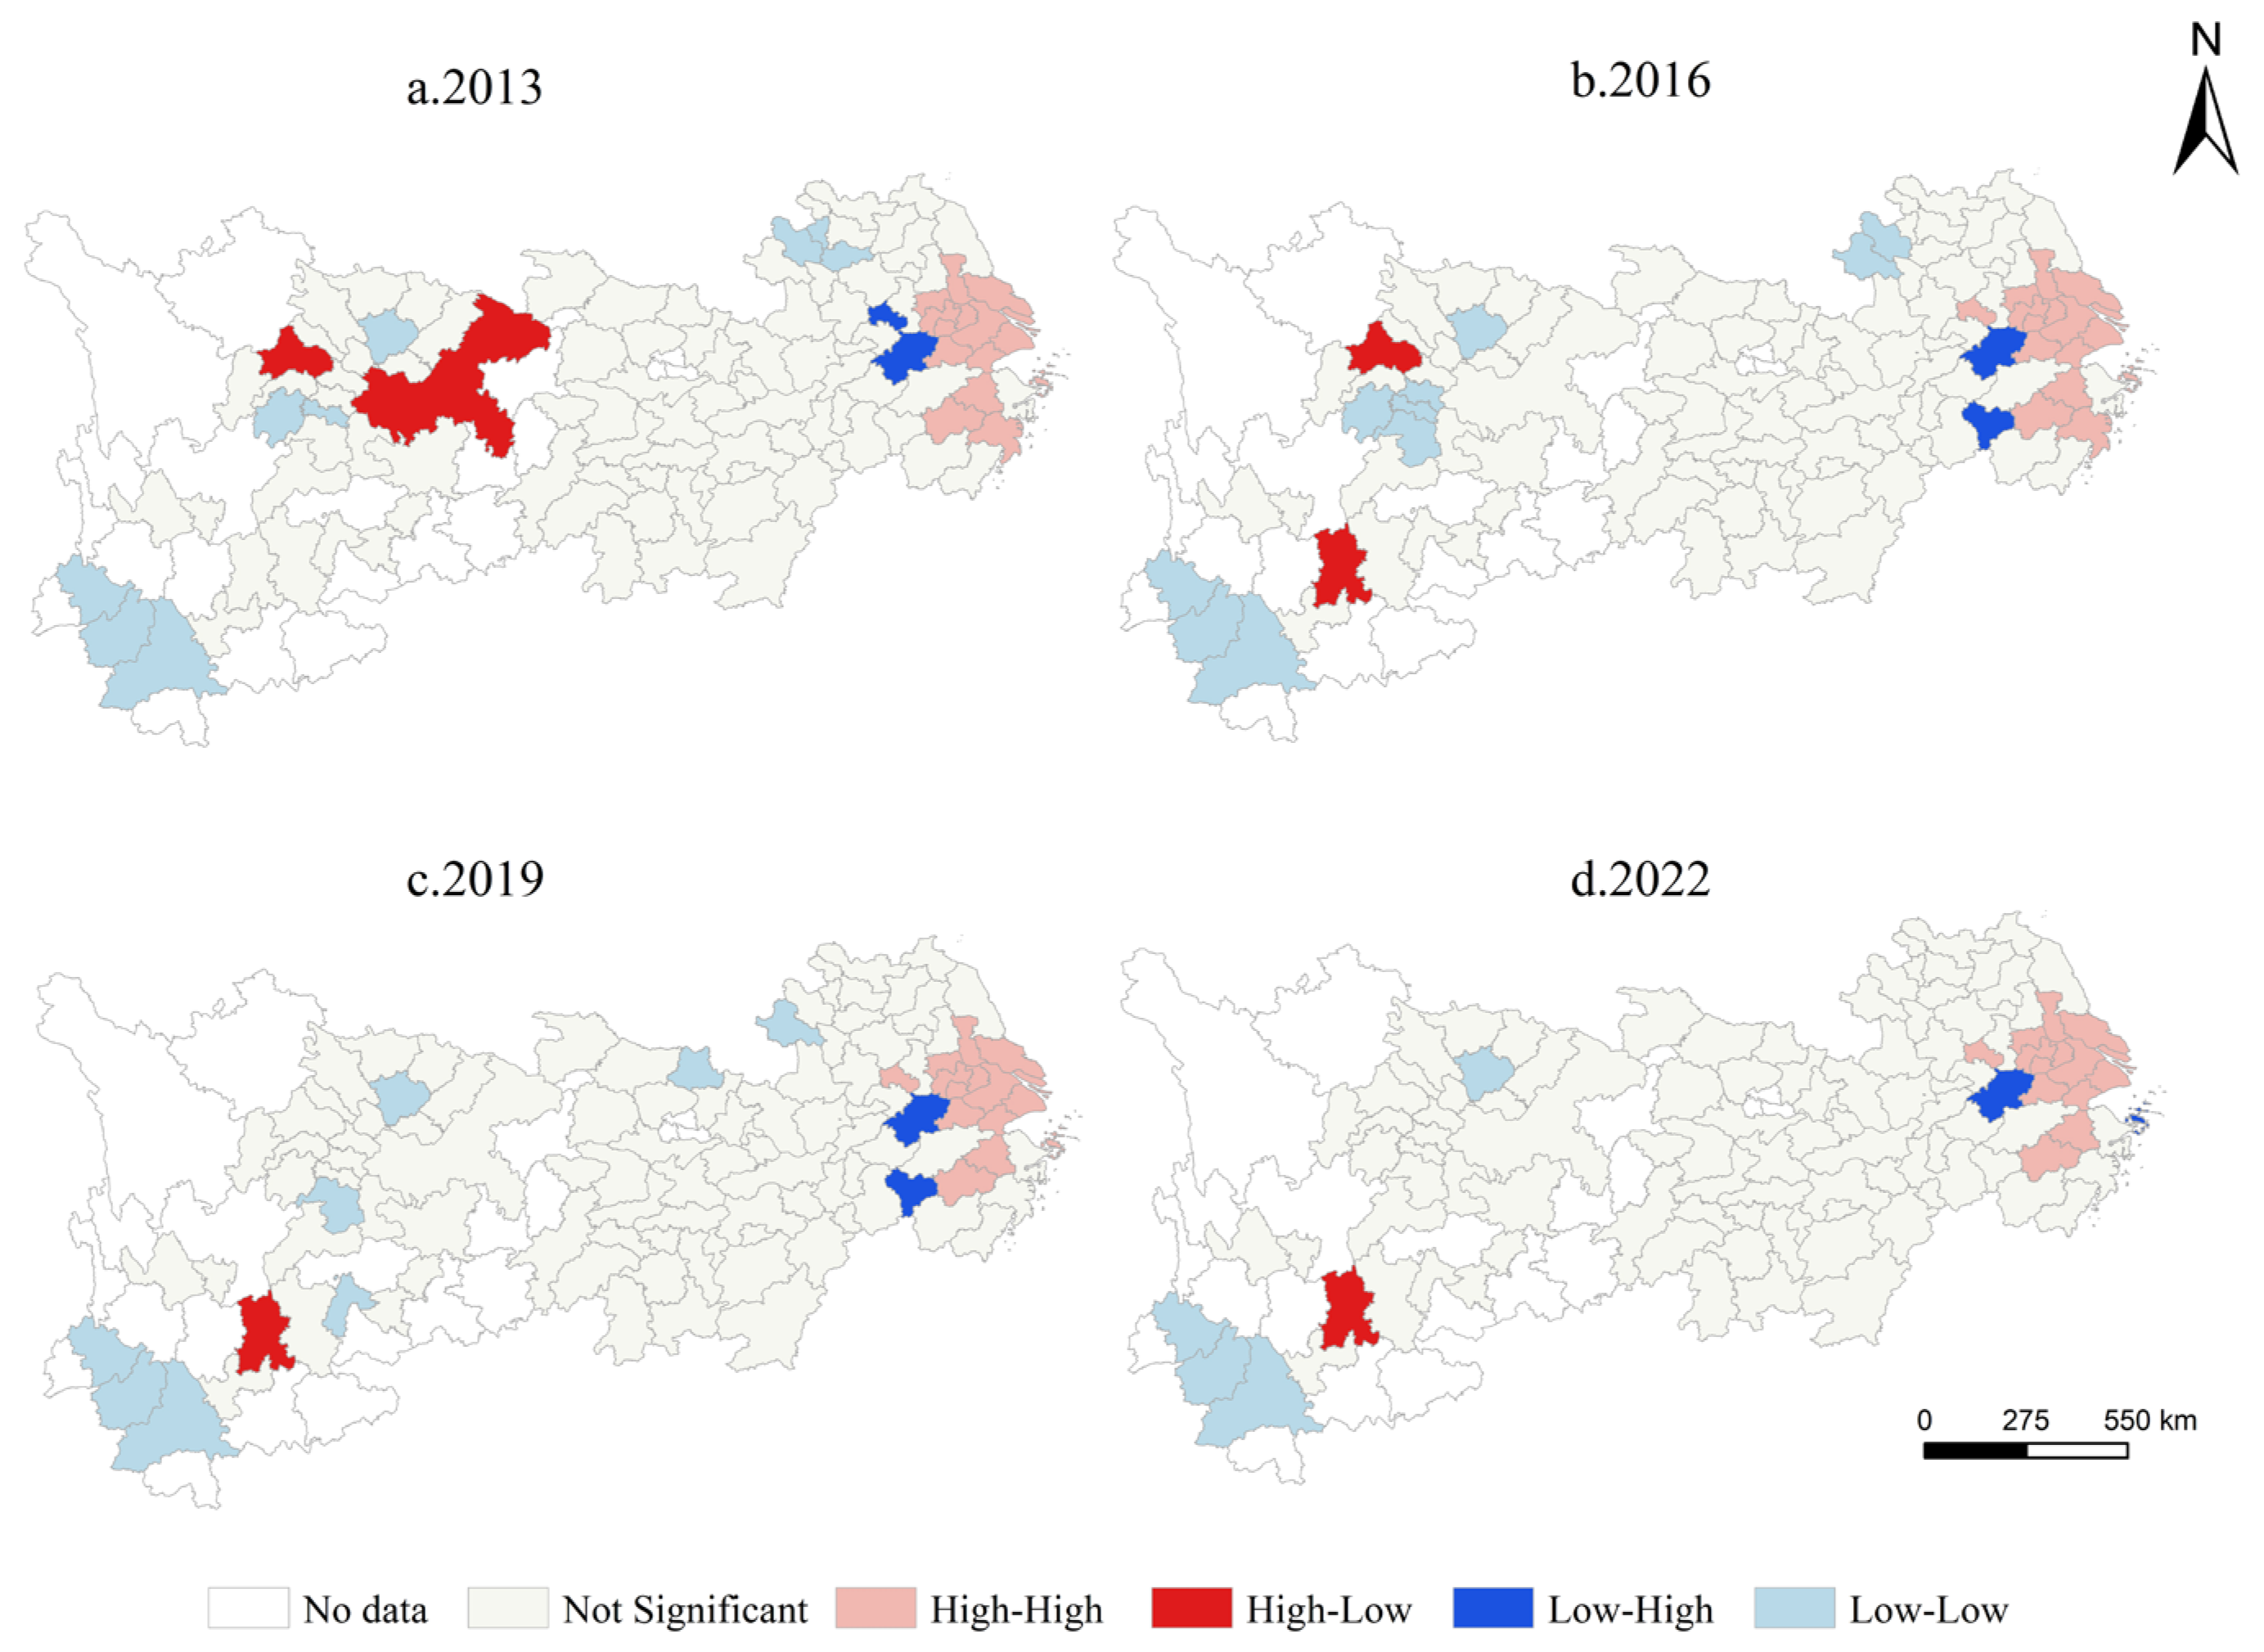
4.4.2. Local Spatial Autocorrelation Analysis

Based on the global autocorrelation phase characteristics, combined with the LISA aggregation map of the coupling coordination degree, its spatial aggregation characteristics were further identified. These are shown in Figure 4.
(1)
In 2013, “high-high” clusters were mainly concentrated in 13 cities such as Shanghai, Suzhou, and Hangzhou; “high-low” clusters were concentrated in Chengdu and Chongqing; “low-high” clusters were concentrated in Xuancheng and Ma’anshan; and “low-low” clusters were concentrated in 9 cities such as Nanchong, Lincang, Bozhou, and Leshan.
(2)
In 2016, the “high-high” cluster continued to expand, mainly concentrated in 14 cities including Shanghai, Suzhou, Hangzhou, Shaoxing, and Nantong; the “high-low” cluster appeared in Chengdu and Kunming; and the “low-high” cluster appeared in Quzhou and Xuancheng. The “low-low” cluster expanded to 10 cities including Ziyang, Neijiang, Baoshan, and Nanchong.
(3)
In 2019, the number of “high-high” cluster decreased by 1, mainly concentrated in 13 cities including Shanghai, Suzhou, Hangzhou, Nantong, and Wuxi. “Low-low” clusters decreased in 9 cities including Liupanshui and Suizhou, while “high-low” clusters appeared in 1 city, Kunming.
(4)
In 2022, the “high-high” cluster concentration further decreased, mainly concentrated in 12 cities such as Shanghai, Suzhou, Nantong, Wuxi, and Jiaxing; the “high-low” concentration remained in Kunming; the “low-high” cluster concentration appeared in 2 cities, Xuancheng and Zhoushan; and the “low-low” cluster concentration decreased to 4 cities, appearing in Baoshan, Lincang, Pu’er, and Nanchong.
Overall, the spatial distribution shows an evolutionary pattern of “high in the east and low in the west, with scattered points forming a network”. It can be observed that “high-high” clusters are consistently concentrated in the core urban agglomerations of the lower Yangtze River region, displaying typical features of agglomeration. High-value cities are adjacent to one another, enhancing regional development synergy. In contrast, “low-low” clusters repeatedly appear in upstream cities, particularly concentrated in the southwestern inland areas, indicating that new-quality productivity and their synergy with industrial structure have yet to achieve systematic advancement in these regions. Spatial isolation characteristics are evident between upstream and downstream areas. From the perspective of spatial connectivity, there is a serious “disconnection” phenomenon between the upstream and downstream areas of the Yangtze River, especially between the middle of the upstream area and the downstream area of Suzhou, Shanghai, and Zhejiang. Despite the presence of “high-high” cities in the middle reaches, these have not formed close connections with the upstream and downstream areas, indicating that regional coordination has not yet been fully established and that spatial barriers persist. The “ring diffusion” pattern is transitioning to “discrete evolution”. Although the “high-high” regions previously exhibited a distinct ring-layer structure, they have gradually evolved toward smaller clusters and multiple centers in recent years. The emergence of “low-high” cities such as Zhoushan and Xuancheng indicates that the spillover effects of high-value cities are beginning to spread outward, reflecting a shift in development from polarization to dispersion and balance. Specifically, Xuancheng has benefited from the Yangtze River Delta regional integration strategy, which promotes cross-provincial industrial relocation and infrastructure connectivity. Its proximity to Nanjing and Wuhu has facilitated the inflow of high-end manufacturing investment and technology spillovers. Similarly, Zhoushan’s positioning within Zhejiang’s marine economy plan and green port initiatives has supported its transformation toward low-carbon logistics and offshore industries. These cases suggest that “low-high” clusters may represent early-stage policy-induced transformation zones where strategic investments and institutional alignment are enabling cities to leapfrog in coordination levels despite a relatively weaker starting point. Recognizing and supporting these transition zones through targeted financial, innovation, and governance support may accelerate spatial rebalancing in the Yangtze River Economic Belt. These spatial clusters and transition patterns provide valuable insights for formulating targeted policies that recognize the importance of spatial externalities and interregional connectivity in driving balanced development.

5. Analysis of Obstacle Factors of Coupling Coordination Level

5.1. Results Analysis

To further identify the core limiting factors affecting the coupling coordination level between new-quality productivity and industrial structure upgrading in the Yangtze River Economic Belt, the obstacle degree model was employed to identify main obstacle factors from 2013 to 2022. As it was found that the main obstacle factors showed little variation, and the overall obstacle degree showed an upward trend, two representative years, 2013 and 2022, were selected for the study (Table 4).

5.1.1. Overall Obstacle Factor Evolution

Overall, the primary obstacles at the indicator level for the coupling coordination level of the Yangtze River Economic Belt between 2013 and 2022 have consistently been digital patents (X13), green patents (X15), and the number of high-tech enterprises (X19), with their obstacle levels increasing, respectively, from 6.48%, 6.48%, and 6.38% in 2013 to 7.03%, 7.03%, and 6.96% in 2022. Specifically, digital patents (X13), an important indicator of digital innovation capabilities, have consistently ranked as the top obstacle factor, reflecting the low quality and sluggish growth of patent output in the digital technology field in the Yangtze River Economic Belt. Despite the rapid development of the digital economy in this area, patent numbers and technological accumulation lag behind, with high patent application duplication rates and low innovation practicality, resulting in insufficient support for digital empowerment of industrial upgrading. Green patents (X15) follow closely behind, indicating that green innovation capabilities have yet to form a strong foundation. These patents often involve cutting-edge fields such as energy conservation, environmental protection, new energy, and new materials, which are difficult to commercialize. Institutional barriers such as insufficient financial incentives, lack of financial tools, and inadequate intellectual property protection further restrict the promotion and industrialization of green technologies, thereby affecting the overall improvement of regional green productivity. These persistent obstacles can be attributed to underlying institutional and systemic weaknesses within the innovation environment. In many cities across the Yangtze River Economic Belt—particularly in midstream and upstream regions—there is a disconnect between patent generation and industrial application. Digital and green patents often lack market orientation, resulting in a high proportion of low-quality or repetitive filings. Weak university–industry collaboration limits technology transfer, while the absence of robust intellectual property financing tools (such as patent-backed loans or IP funds) reduces the incentive for firms to invest in high-value patents. Moreover, regulatory fragmentation and inconsistent enforcement of IP rights diminish the protection and commercial value of innovation outputs. These systemic constraints reduce the effectiveness of digital and green technologies in supporting industrial upgrading, despite formal increases in patent counts. The number of high-tech enterprises (X19) has ranked among the top three for ten consecutive years, reflecting the need to strengthen the innovation capabilities of enterprises, especially in central and western regions. As an important platform for the aggregation of innovation factors, the uneven development of high-tech enterprises will directly affect the efficiency of industrial structure transformation and development momentum in the region.

5.1.2. Regional Obstacle Factor Evolution

In 2013, the main obstacle factors in the upstream area were digital patents (X13, 6.36%), green patents (X15, 6.35%), and the number of high-tech enterprises (X19, 6.34%), showing a high degree of consistency with the overall national pattern. However, by 2022, the ranking of obstacles in the region changed significantly: the number of high-tech enterprises (X19, 6.96%) jumped to first place, followed by digital patents (X13, 6.94%) and high-tech labor (X3, 6.92%). This indicates that the development of high-tech industries has become the core constraint to the coordinated development of new-quality productivity and industrial structure upgrading in the region. In addition, green patents no longer appear among the top three obstacles in the region, which is closely related to the country’s continuous promotion of the concept of “ecological priority and green development” in recent years. As the national ecological security barrier, the green innovation environment and policy incentives in the upstream sector have gradually improved, leading to higher conversion efficiency of green technology achievements [52] and the initial transformation of ecological advantages into development advantages.
In 2013, the main obstacle factors in the midstream area were largely consistent with those at the national level and in the upstream area, namely digital patents (X13, 6.48%), green patents (X15, 6.48%), and the number of high-tech enterprises (X19, 6.38%). By 2022, the main obstacle factors remained stable at X13, X15, and X19, but their constraint levels increased to 7.13%, 7.11%, and 7.06%, respectively, thus being compared to other regions nationwide. This is an indication of the prominent issues that mid-tier cities face in matching supply and demand for green and digital technologies, with relatively weak practical application capabilities for patented technologies, leading to obstacles in the conversion of innovation outputs into practical applications.
In 2013, the main obstacle factors in downstream areas were green patents (X15, 6.59%), digital patents (X13, 6.58%), and the number of high-tech enterprises (X19, 6.38%). Among these, the obstacle level of green patents exceeded that of digital patents, reflecting the prominent contradiction between the development of green technology and traditional high-energy-consuming and high-polluting industries in the region. With the continuous deepening of policies such as “green development” and “carbon neutrality”, the obstacle index for green patents (X15) rose to 7.06% in 2022, once again ranking first, while the second and third places were occupied by digital intelligence information construction (X11, 7.06%) and digital patents (X13, 7.03%). Digital and intelligent information infrastructure (X11) made its debut among the top obstacle factors. This may be attributed to the fact that infrastructure development in downstream areas has reached saturation, and without breakthroughs in incremental technologies, its relative contribution to supporting the development of new-quality productivity has declined.

6. Conclusions and Recommendations

6.1. Conclusions

Based on the analytical framework for the coupling coordination mechanism between the development of new-quality productivity and industrial structure upgrading, this study employed the projection tracing model to measure the levels of new-quality productivity and industrial structure upgrading in cities along the Yangtze River Economic Belt from 2013 to 2022. The coupling coordination degree model was utilized to evaluate the coupling coordination levels between new-quality productivity and industrial structure upgrading. Finally, the obstacle degree model was applied to analyze the factors hindering the coupling coordination between the two. The main conclusions are as follows.
From a time-series perspective, the overall level of coordination between new-quality productivity and industrial structure upgrading in the Yangtze River Economic Belt has continuously improved from 2013 to 2022, showing stage-specific characteristics of “initial improvement, rapid leap forward, and high-level fluctuation”. By region, the level of coordination and integration shows a gradient distribution pattern of “downstream leading, midstream following, and upstream catching up,” but the gap is narrowing year by year.
From a spatial distribution perspective, the coupling coordination level between new-quality productivity and industrial structure upgrading in the Yangtze River Economic Belt presents an “east-high, west-low, core-led, and localized breakthrough” pattern, with significant positive agglomeration characteristics: the “high-high” cluster is predominantly distributed in the core urban agglomerations of the lower reaches of the Yangtze River, exhibiting typical clustering characteristics, while “low-low” clusters repeatedly appear in upstream cities. There is a clear spatial isolation between upstream and downstream areas, with a transition phenomenon from “ring-shaped diffusion” to “dispersed evolution”.
By identifying the obstacle factors, it has been found that, from a whole-basin perspective, digital patents, green patents, and the number of high-tech enterprises are the main obstacle factors; from a sub-basin perspective, the degree of obstacles in digital patents, green patents, the number of high-tech enterprises, high-tech labor, and digital information construction varies across different regions.
While this study is confined to the Yangtze River Economic Belt, existing research in other regions provides relevant comparative insights. For instance, studies in the Pearl River Delta have shown a similar pattern of high coupling coordination driven by digital manufacturing clusters and innovation policy spillovers [53]. In contrast, the Beijing–Tianjin–Hebei region shows strong innovation capacity but weaker coordination due to fragmentation in industrial restructuring and environmental regulation [54]. In western transition zones such as Ningxia and Gansu, coupling remains low, constrained by structural rigidities and limited innovation resources [55]. These findings support the broader applicability of this study’s framework while also highlighting the need for differentiated regional strategies based on development stage, innovation maturity, and policy alignment.

6.2. Recommendations

(1) Regional spatial integration and upstream–downstream linkage mechanisms should be strengthened. There are spatial disconnections in development pace and coordination levels between the upstream, midstream, and downstream areas of the Yangtze River. These should be addressed by leveraging “cross-regional platforms” to break down administrative boundaries and achieve “integration of elements”, “integration of markets”, and “integration of systems” for new-quality productivity. The National Development and Reform Commission (NDRC), together with provincial governments and river basin coordination bodies, should lead efforts to establish cross-regional coordination platforms. These platforms should align with the “Yangtze River Economic Belt Development Plan” and emphasize institutional integration across urban agglomerations such as the Chengdu–Chongqing region and the Yangtze River Delta. Moreover, ecological zoning should be integrated into spatial planning to ensure resource efficiency and environmental carrying capacity are considered.
(2) The construction of green and resilient infrastructure network along the river should be promoted. Spatial analysis indicates that there are constraints on inter-regional coordination between upstream and downstream areas, which can be addressed by enhancing infrastructure connectivity. First, the Yangtze River shipping hub system should be improved to eliminate logistical challenges between upstream and downstream sectors of the industrial chain [56]. Second, the Ministry of Transport, along with the Ministry of Ecology and Environment, should jointly promote infrastructure investments under the “Green and Low-Carbon Transport System Action Plan”. This includes prioritizing rail and port connectivity projects between upstream (e.g., Chongqing) and downstream (e.g., Nanjing, Shanghai) logistics hubs, and incorporating carbon resilience indicators into project evaluation criteria. Third, aviation transport capacity should be enhanced by building a regional aviation network and a system of small and medium-sized hub airports to unlock the development potential and external connectivity of central and western cities. In parallel, the construction of green infrastructure and climate-resilient transportation systems should be accelerated to reduce carbon emissions and disaster vulnerability.
(3) Differentiated and tiered management among cities should be emphasized. The Yangtze River Economic Belt covers a vast area and includes numerous cities with diverse functional roles, ranging from global cities to resource-based and eco-friendly small and medium-sized cities. Therefore, in promoting the coordinated development of new-quality productivity and industrial structure upgrading, it is essential to fully consider the comparative advantages and existing foundations of each city, implement differentiated and tiered management, and enhance the accuracy and scientific nature of regional policies. Environmental performance indicators and climate adaptation needs should be incorporated into the classification system to guide cities toward suitable sustainable pathways.
(4) In promoting the high-quality development of the Yangtze River Economic Belt, three areas should be further focused upon. First, the mechanism for the transformation of digital and green technology achievements should be strengthened [57], the intellectual property financial service system improved, and the integration of the “patent + capital + industry” model promoted. Second, the cultivation of high-tech enterprises should be accelerated and guidance and support for start-ups and “specialized, refined, distinctive, and innovative” enterprises strengthened. Third, we should build a new industrial ecosystem centered on digital and intelligent infrastructure and improve the application efficiency of information technology and regional coordination capabilities, to facilitate a systematic leap in the development of new-quality productivity. Additionally, policy support should prioritize low-carbon industries, circular economy models, and ecosystem-based disaster risk reduction to achieve co-benefits for economy and environment. Currently, these regions primarily rely on resource-based and processing industries that are low value-added, and should instead be guided by the integration of industrial chains and innovation chains [58]. This can be achieved by establishing specialized industrial funds to support the upgrading and extension of key links in the industrial chain. The establishment of a sustainability-oriented industrial fund is advocated to fill gaps in the green industrial chain, extend high-value-added segments, and foster collaborative innovation and high-quality development.
(5) In addition, the spatial autocorrelation findings based on Moran’s I and LISA indicate that regional development policies should not treat cities in isolation. Instead, spatial clusters—especially “high-high” agglomerations in the lower reaches and “low-low” clusters in upstream regions—should be addressed through coordinated spatial planning. For example, downstream cities such as Suzhou and Shanghai can serve as innovation spillover hubs to support midstream and upstream cities through intercity collaboration mechanisms, shared R&D platforms, and talent mobility initiatives. The emergence of “low-high” transition zones (e.g., Xuancheng, Zhoushan) suggests potential leverage points for cross-regional development pilots. Thus, spatial policy should evolve from static regional classifications to dynamic coordination zones informed by real-time spatial data.

6.3. Challenges and Obstacles in Implementing Recommendations

The implementation of the recommended actions to enhance the coupling coordination between new-quality productivity and industrial structure upgrading will face several key challenges. One significant obstacle is the financial limitations within certain regions, particularly those in the upstream areas of the Yangtze River Economic Belt, where investments in digital infrastructure and green technologies may be constrained by budgetary restrictions. Additionally, the uneven distribution of human capital and technological capabilities presents a challenge, as more developed regions may have the requisite workforce and innovation capacity, while less developed areas struggle with skill gaps and technological deficiencies. This necessitates targeted interventions in education and training to bridge these gaps. Furthermore, institutional and regulatory barriers, such as fragmented governance structures and lack of intergovernmental coordination, could impede the effective execution of these strategies. Overcoming these challenges will require coordinated efforts, sustainable financing models, and the development of robust institutional frameworks that ensure consistent policy implementation across regions. Only through a multifaceted approach to addressing these barriers can the recommendations be effectively realized in practice.
While the study offers valuable insights into the coupling coordination between new-quality productivity and industrial structure upgrading in the Yangtze River Economic Belt, it is not without its limitations. The reliance on secondary data, primarily from official reports and statistical yearbooks, may not fully capture the complexity and dynamism of regional economic activities, especially in less formal or undocumented sectors. Additionally, the focus on a single region may limit the broader applicability of the findings to other geographical contexts, particularly those with differing economic structures, industrial capacities, or levels of technological adoption. Future research could address these limitations by expanding the scope to include multiple regions with varied economic profiles, utilizing primary data sources, and considering the impact of external factors, such as global economic shifts, policy reforms, or emerging technological disruptions. Moreover, a more granular analysis of specific industries or micro-level factors, such as firm-level innovation dynamics and labor market transformations, could further illuminate the mechanisms underlying the relationship between new-quality productivity and industrial structure upgrading, thereby enhancing the generalizability and depth of future studies.
In addition to the data limitations mentioned, the study has several methodological constraints. First, while the projection pursuit model captures nonlinearity in multidimensional data, the coupling coordination model assumes a simplified functional relationship between subsystems, which may not reflect more complex feedback dynamics. Second, the indicator system includes multiple variables that may be partially collinear (e.g., green patents and green industry measures), potentially affecting the stability of model outputs. Third, the analysis is static in nature and does not incorporate lagged policy or economic effects, but many policy impacts, especially those related to innovation systems, unfold over time. Future research could improve upon this by introducing panel vector autoregression (PVAR) models or Granger causality testing to better assess temporal dynamics and causal pathways. Moreover, machine learning-based feature selection could help refine the indicator system by identifying the most influential variables while minimizing redundancy.

Author Contributions

Conceptualization, M.J. and X.J.; methodology, M.J.; validation, M.J. and X.J.; formal analysis, M.J. and X.J.; investigation, M.J. and X.J.; resources, M.J. and X.J.; data curation, M.J. and X.J.; writing—original draft preparation, M.J.; writing—review and editing, M.J. and X.J. All authors have read and agreed to the published version of the manuscript.

Funding

This research received no external funding.

Institutional Review Board Statement

Not applicable.

Informed Consent Statement

Not applicable.

Data Availability Statement

The original contributions presented in this study are included in the article. Further inquiries can be directed to the corresponding author.

Conflicts of Interest

The authors declare no conflict of interest.

References

  1. Bai, Y.; Yan, X.; Wang, Z. New quality productivity empowers the construction of modern industrial system: A study based on the perspective of factor composition. China Soft Sci. 2024, 4, 21–34. [Google Scholar]
  2. Zhao, L.; Li, F.; Wang, Q. Development Strategy of the Yangtze River Economic Belt and Employment: Promotion or Inhibition? A Difference-in-Differences Analysis Based on the Panel Data of Prefecture-level Cities. Resour. Environ. Yangtze Basin 2021, 30, 2569–2580. [Google Scholar]
  3. Acemoglu, D.; Restrepo, P. Artificial Intelligence, Automation, and Work. In The Economics of Artificial Intelligence: An Agenda; Agrawal, A., Gans, J., Goldfarb, A., Eds.; University of Chicago Press: Chicago, IL, USA, 2019; pp. 197–236. [Google Scholar]
  4. Jaffe, A.B.; Newell, R.G.; Stavins, R.N. A Tale of Two Market Failures: Technology and Environmental Policy. Ecol. Econ. 2005, 54, 164–174. [Google Scholar] [CrossRef]
  5. Shao, C.H.; Dong, H.; Gao, Y. New Quality Productivity and Industrial Structure in China: The Moderating Effect of Environmental Regulation. Sustainability 2024, 16, 6796. [Google Scholar] [CrossRef]
  6. Fang, C.; Sun, B. The connotation of new quality productive forces and research priorities for driving urban-rural integrated development from the geographical perspective. Acta Geogr. Sin. 2024, 79, 1357–1370. [Google Scholar]
  7. Huang, S. Managerial essence and analytical framework of new quality productive forces. J. Shandong Norm. Univ. (Soc. Sci.) 2025. Available online: https://www.cnki.com.cn/Article/CJFDTOTAL-SDSS202501011.htm (accessed on 28 May 2025).
  8. Han, W.; Zhang, R.; Zhao, F. The Measurement of New Quality Productivity and New Driving Force of the Chinese Economy. J. Quant. Technol. Econ. 2024, 41, 5–25. [Google Scholar]
  9. Lu, J.; Guo, Z.; Wang, Y. Levels of development of new quality productivity, regional differences and paths to enhancement. J. Chongqing Univ. (Soc. Sci. Ed.) 2024. Available online: https://www.cnki.com.cn/Article/CJFDTOTAL-CDSK202403001.htm (accessed on 28 May 2025).
  10. Zeng, P.; Qin, Y.; Zhou, L. Measurement and spatiotemporal pattern of new quality productive forces level in Chinese cities. Prog. Geogr. 2024, 43, 1102–1117. [Google Scholar]
  11. Ji, X.; He, Z.; Li, Z.; Zhang, Y. Measurement, Spatiotemporal Characteristics and Influencing Factors of Development Level of New Quality Productive Forces at the Provincial Level. Econ. Geogr. 2024, 44, 104–112. [Google Scholar]
  12. Li, W.; Yang, Z. Spatio-temporal evolution and obstacle factors of new quality productive forces in the Yellow River Basin. J. Henan Norm. Univ. (Nat. Sci. Ed.) 2025. Available online: https://www.cnki.com.cn/Article/CJFDTotal-HNSX20250317001.htm (accessed on 28 May 2025).
  13. Wang, Q.; Wang, N.; Wang, J. Evolution of spatial correlation network structure and influencing factors of new quality productivity in Chinese cities. World Reg. Stud. 2024. Available online: https://read.cnki.net/web/Journal/Article/SJDJ20241024001.html (accessed on 28 May 2025).
  14. Du, C.; Shu, S.; Li, Z. Mechanism and path of new quality Productivity in promoting high-quality economic development. Econ. Rev. J. 2023. Available online: https://www.cnki.com.cn/Article/CJFDTOTAL-JJZH202312003.htm (accessed on 28 May 2025).
  15. Yu, D.; Ma, L. New quality productivity and new industrialization: Theoretical interpretation and interactive path. Tianjin Soc. Sci. 2023. Available online: https://www.cnki.com.cn/Article/CJFDTOTAL-TJSK202306012.htm (accessed on 28 May 2025).
  16. Zhou, W.; Ye, L. New quality productivity and digital economy. J. Zhejiang Gongshang Univ. 2024. Available online: https://www.cnki.com.cn/Article/CJFDTOTAL-ZJZF202402002.htm (accessed on 28 May 2025).
  17. Guo, H.; Hou, X. Theoretical logic and path selection of promoting the construction of modern industrial system with new quality productivity. J. Xi’ Univ. Financ. Econ. 2024. Available online: https://www.cnki.com.cn/Article/CJFDTOTAL-SXGY202401003.htm (accessed on 28 May 2025).
  18. Han, W.; Dong, X.; Tang, X. Dialectical relationship and practical path of new qualitative productivity and green development. J. UESTC (Soc. Sci. Ed.) 2024. Available online: https://www.cnki.com.cn/Article/CJFDTOTAL-DKJB202403002.htm (accessed on 28 May 2025).
  19. Yuan, H.; Han, M. New quality productive forces enabling high-quality development of foreign trade: Theoretical Logic and Realization Path. Intertrade 2024. [Google Scholar] [CrossRef]
  20. Fan, D.C.; Liu, Y.; Li, H. The Causality between China’s Fiscal Expenditure on Science and Technology and Industrial Structure Rationalization: An Empirical Study. In Proceedings of the 21st International Conference on Management Science & Engineering (ICMSE), Helsinki, Finland, 17–19 August 2014; pp. 780–785. [Google Scholar]
  21. Dai, S.L.; Wang, Y.Y.; Zhang, W.M. The Impact Relationships between Scientific and Technological Innovation, Industrial Structure Advancement and Carbon Footprints in China Based on the PVAR Model. Int. J. Environ. Res. Public Health 2022, 19, 9513. [Google Scholar] [CrossRef]
  22. Dryakhalov, V.; Shaikhiev, T.; Shaikhiev, I.; Zagidullina, I.; Bonev, B.; Nenov, V. Intensification of breaking of water-in-oil emulsions by membranes treated in the area of corona discharge or in the plasma flow. Bulg. Chem. Commun. 2015, 47, 109–114. [Google Scholar]
  23. Setiawan, M.; Emvalomatis, G.; Lansink, A.O. Structure, conduct, and performance: Evidence from the Indonesian food and beverages industry. Empir. Econ. 2013, 45, 1149–1165. [Google Scholar] [CrossRef]
  24. Griffeth, R.W.; Lee, T.W.; Mitchell, T.R.; Hom, P.W. Further Clarification on the Hom, Mitchell, Lee, and Griffeth (2012) Model: Reply to Bergman, Payne, and Boswell (2012) and Maertz (2012). Psychol. Bull. 2012, 138, 871–875. [Google Scholar] [CrossRef] [PubMed]
  25. Zhang, Q.; Li, Q. How can digital inclusive finance help upgrade industrial structure?—From the perspective of enterprise entry. J. Mod. Financ. 2025. Available online: https://www.cnki.com.cn/Article/CJFDTOTAL-CSJR202501002.htm (accessed on 28 May 2025).
  26. Zhang, Y.; Liu, L. Regional differences and spatial convergence of industrial structure optimization and upgrading in the Yangtze River economic belt under the background of green development. World Reg. Stud. 2021. Available online: https://www.cnki.com.cn/Article/CJFDTOTAL-SJDJ202105010.htm (accessed on 28 May 2025).
  27. Hong, C.Y.; Shen, D.J. Is industrial structure determined on water endowment in China? An empirical study of 31 provinces between 2011 and 2021. J. Clean. Prod. 2024, 479, 144075. [Google Scholar] [CrossRef]
  28. Sun, H.; Lee, H. A Study on the Transformation and Upgrading of China’s Industrial Structure under the Digital Technology. J. Sinol. China Stud. 2023, 97, 561–579. [Google Scholar]
  29. Wu, Y.; He, Z. Theoretical logic of new-quality productivity affecting the industrial upgrading and its configuration approachesL: A dynamic QCA analysis based on the provincial panel data. J. Yunnan Minzu Univ. (Philos. Soc. Sci. Ed.) 2024. Available online: https://www.cnki.com.cn/Article/CJFDTOTAL-YNZZ202405008.htm (accessed on 28 May 2025).
  30. Zhu, B.Z.; Zhang, M.F.; Zhou, Y.H.; Wang, P.; Sheng, J.C.; He, K.J.; Wei, Y.M.; Xie, R. Exploring the effect of industrial structure adjustment on interprovincial green development efficiency in China: A novel integrated approach. Energy Policy 2019, 134, 110946. [Google Scholar] [CrossRef]
  31. Huang, M.; Cao, Q. Research on the impact of new quality productivity on promoting industrial structure upgrading—Based on the mediating effect of technological innovation. Stat. Manag. 2024. Available online: https://www.cnki.com.cn/Article/CJFDTOTAL-TNGL202411012.htm (accessed on 28 May 2025).
  32. Xu, L.; Liu, Y.; Liu, S. Impact of new quality productive forces and resource allocation efficiency on industrial structure upgrading in resource-based cities. China Min. Mag. 2024. Available online: https://www.cnki.com.cn/Article/CJFDTOTAL-ZGKA202503005.htm (accessed on 28 May 2025).
  33. Li, X.; Yang, S. New quality productivity and advanced industrial structure: Two-way empowerment or one-way drive. Stat. Decis. 2024. Available online: https://www.cnki.com.cn/Article/CJFDTOTAL-TJJC202419003.htm (accessed on 28 May 2025).
  34. Rodrik, D. Structural Change, Fundamentals, and Growth: An Overview. World Dev. 2013, 82, 20–31. [Google Scholar]
  35. Gereffi, G. Global value chains, development, and emerging economies. Camb. J. Econ. 2018, 42, 335–361. [Google Scholar]
  36. Chen, M.; Liu, W.; Wang, S.; Liu, Y. Spatial-temporal differentiation of urban eco-efficiency in the Yangtze River Economic Belt and its driving factors. China Popul. Resour. Environ. 2020, 30, 121–127. [Google Scholar]
  37. Lin, Z.; Chen, H. Labor Structure, Wage and Efficiency of Economic Growth. In Proceedings of the 4th International Conference on Intelligent Human-Machine Systems and Cybernetics (IHMSC), Nanchang, China, 26–27 August 2012; pp. 167–170. [Google Scholar]
  38. Amowine, N.; Balezentis, T.; Zhou, Z.X.; Streimikiene, D. Transitions towards green productivity in Africa: Do sovereign debt vulnerability, eco-entrepreneurship, and institutional quality matter? Sustain. Dev. 2024, 32, 3405–3422. [Google Scholar] [CrossRef]
  39. Iordanis, P.; Grigorios, E.; Läpple, D.; Thorne, F.; Wallace, M. The contribution of innovation to farm-level productivity. J. Product. Anal. 2024, 62, 239–255. [Google Scholar] [CrossRef]
  40. Lin, S.; Hwang, S.-J.; Hwang, Y.-S. The Impact of Digital Trade on Chinese Consumer Pattern: The Mediating Effect of Industrial Structure Upgrading. J. Korea Res. Soc. Cust. 2024, 25, 181–201. [Google Scholar] [CrossRef]
  41. Deng, H.; Yang, L.; Pan, X. High-Speed Rail and Industrial Upgrading in China: Facts and Mechanisms. J. Financ. Econ. 2020. Available online: https://www.cnki.com.cn/Article/CJFDTOTAL-CJYJ202006004.htm (accessed on 28 May 2025).
  42. Liu, Y.; Tang, J. Evaluation and spatial-temporal evolutionof the quality of tourism development in the Yangtze River Economic Belt. Econ. Geogr. 2022. Available online: https://www.cnki.com.cn/Article/CJFDTOTAL-JJDL202204023.htm (accessed on 28 May 2025).
  43. Chen, X.; Zhou, J.; Liao, Y. Coupling evolution and influencing factors of carbon emissions-urban high quality development level in Yangtze River Delta. World Reg. Stud. 2024. Available online: https://www.cnki.com.cn/Article/CJFDTOTAL-SJDJ202403009.htm (accessed on 28 May 2025).
  44. Nie, H.; Zhang, Y.; Li, H. Spatiotemporal evolution and multi-scale barrier factor analysis of tourism ecological resilience in Yellow River Basin. Arid Land Geography. Arid Land Geogr. 2025. Available online: https://kns.cnki.net/kcms2/article/abstract?v=En0qcdJbrGl4pYPJPpBQboqvGlj-17CZObengGjosfacnL6U9O9hRZ3S7ldnaM4gGEwv2NGC7EiZJQBdvRZjhBOdpacsokK7sbtZEGv9ryEkvmLiEq9q2Jw0R2_uckIQg_VwfRtU6WDaxTtOmel0NGO0Hq9D8BTuxUmrYDeJcEPoNpSlDAOPpw==&uniplatform=NZKPT&language=CHS (accessed on 28 May 2025).
  45. Alenezi, A.; Alshammari, M.H.; Ibrahim, I.A. Optimizing Nursing Productivity: Exploring the Role of Artificial Intelligence, Technology Integration, Competencies, and Leadership. J. Nurs. Manag. 2024, 2024, 8371068. [Google Scholar] [CrossRef] [PubMed]
  46. Mathur, M.; Agarwal, S. Sustainability Dynamics of Resource Use and Economic Growth. New Delhi TERI 2015. Available online: https://www.teriin.org/policybrief/files/aug15/files/downloads/Discussion_paper_Sustainability_Aug2015.pdf (accessed on 28 May 2025).
  47. Zhang, W.; Xuan, Y.; Sui, B.; Wei, W. Industrial intelligence, labor structure and industrial structure upgrading. Stud. Sci. Sci. 2021, 39, 1384–1395. [Google Scholar]
  48. Pearson, H. Work without Labor: Life in the Surround of a Rural Prison Town. Cult. Anthropol. 2021, 36, 167–192. [Google Scholar] [CrossRef]
  49. Shu, X.; Huo, W.D. How to Break Through the “Cascade Effect” to Realize the Industrial Structure Optimization-Based on the Consideration of Huawei’s Binary Interaction Mode of Industry Upgrading. In Proceedings of the International Conference of the Economic-Management-and-Trade-Cooperation (EMTC), Xi’an, China, 12–13 April 2014; pp. 185–189. [Google Scholar]
  50. Zhou, S.J.; Shan, F.X. Discovery of innovation effect and spillover effect: Evidence from intelligent manufacturing promoting low-carbon development. J. Innov. Knowl. 2023, 8, 100383. [Google Scholar] [CrossRef]
  51. Wu, Z.; Yuan, Z. General Strategy of Exploiting and Protecting Yangtze River Water Resources in Response to the Green Development of Yangtze River Economic Zone. J. Yangtze River Sci. Res. Inst. 2021, 38, 132. [Google Scholar]
  52. Chen, Z.G.; Zhang, Y.Q.; Wang, H.S.; Ouyang, X.; Xie, Y.X. Can green credit policy promote low-carbon technology innovation? J. Clean. Prod. 2022, 359, 132061. [Google Scholar] [CrossRef]
  53. Zou, Z.; Yuan, X.; Zhang, Z.; Li, X.; Zhou, C. Spatiotemporal Evolution and Influencing Factors of Coupling and Coordination between the Ecosystem Service Value and Economy in the Pearl River Delta Urban Agglomeration of China. Land 2024, 13, 1670. [Google Scholar] [CrossRef]
  54. Cui, Y. The Coordinated Relationship among Industrialization, Environmental Carrying Capacity and Green Infrastructure: A Comparative Research of Beijing–Tianjin–Hebei Region, China. Environ. Dev. 2022, 44, 100775. [Google Scholar] [CrossRef]
  55. Cui, H.; Cheng, L.; Zheng, Y.; Wang, J.; Zhu, M.; Zhang, P. Analysis of the Dynamic Changes and Driving Mechanism of Land Green Utilization Efficiency in the Context of Beijing–Tianjin–Hebei Synergistic Development. Land 2025, 14, 222. [Google Scholar] [CrossRef]
  56. Liu, T.; Zhang, P.; Xu, Y. Research on Water Level Trends of the Middle Yangtze River Based on Mann-Kendall and ARIMA Model. Appl. Mech. Mater. 2014, 513–517, 3016–3019. [Google Scholar] [CrossRef]
  57. Liu, P.Z.; Huang, T.; Shao, Y.T.; Jia, B. Environmental regulation, technology density, and green technology innovation efficiency. Heliyon 2024, 10, e23809. [Google Scholar] [CrossRef] [PubMed]
  58. Li, Y.Q.; Yan, Y.; Fang, P. Collaborative Innovation Model and Simulation Research of Industrial Innovation Chain. In Proceedings of the 6th International Symposium on Project Management (ISPM), Chongqing, China, 21–23 July 2018; pp. 1034–1041. [Google Scholar]
Figure 1. The coupling coordination mechanism between new-quality productivity and industrial structure upgrading.
Sustainability 17 05201 g001
Figure 2. Time-series changes in the coupling coordination degree between new-quality productivity and industrial structure upgrading in the Yangtze River Economic Belt.
Sustainability 17 05201 g002
Figure 3. Spatial distribution evolution of coupling coordination degree between new-quality productivity and industrial structure upgrading in the Yangtze River Economic Belt.
Sustainability 17 05201 g003
Figure 4. LISA agglomeration evolution of coupling coordination between new-quality productivity and industrial structure upgrading in the Yangtze River Economic Belt.
Sustainability 17 05201 g004
Table 1. Evaluation index system of new-quality productivity and industrial structure upgrading.
System LayerPrinciple LayerIndicator LayerAttribute
New
quality productivity
New-quality laborLabor structureR&D personnel ratio (X1)+
information service personnel ratio (X2)+
Labor force qualityHigh-tech laborers (X3)+
Entrepreneurial activity (X4)+
Level of higher education (X5)+
Education expenditure (X6)+
New-quality labor materialInfrastructureMobile phone penetration rate (X7)+
Internet penetration rate (X8)+
pilot city for broadband China or not (X9)+
Number of development zones (X10)+
Digital and intelligent information infrastructure development (X11)+
Digitalization levelDigital financial inclusion (X12)+
Digital patent (X13)+
Greenification levelEnergy consumption efficiency (X14)
Green patent (X15)+
Innovation levelNumber of patents per capita (X16)+
Scientific expenditure (X17)+
New-quality labor objectEmerging industryStrategic emerging enterprises number (X18)+
High-tech enterprises number (X19)+
Artificial intelligence enterprises number (X20)+
E-commerce level (X21)+
Green industryIndustrial waste management (X22)+
Three types of waste emissions (X23)
Industrial structure upgradingIndustrial structure upgradingMicro-industrial structure upgradingTertiary industry enterprise entry ratio (X24)+
Macro-industrial structure upgradingindustrial structure advancement (X25)+
industrial structure rationalization (X26)+
Table 2. Classification criteria of coupling coordination degree.
Coupling Coordination DegreeCoupling Coordination LevelCoupling Coordination DegreeCoupling Coordination Level
(0.0, 0.2)Extreme imbalance[0.5, 0.6)Reluctant coordination
[0.2, 0.3)Serious imbalance[0.6, 0.7)Primary coordination
[0.3, 0.4)Mild imbalance[0.7, 0.8)Good coordination
[0.4, 0.5)Near imbalance[0.8, 1.0)High-quality coordination
Table 3. Moran’s I index of the coupling coordination level of new-quality productivity and industrial structure upgrading in the Yangtze River Economic Belt from 2013 to 2022.
2013201420152016201720182019202020212022
Moran’s I0.2520.2790.2480.3040.2720.2510.1910.2550.1950.210
Z value3.9094.3213.8484.7084.2183.9043.0193.9843.0783.307
p value0.0000.0000.0000.0000.0000.0000.0030.0000.0020.000
Table 4. Indicator levels of obstacle factors in the Yangtze River Economic Belt.
AreaYearNo. 1No. 2No. 3
The entire area2013X13 (6.48)X15 (6.48)X19 (6.38)
The entire area2022X13 (7.03)X15 (7.03)X19 (6.96)
Upstream area2013X13 (6.36)X15 (6.35)X19 (6.34)
Upstream area2022X19 (6.96)X13 (6.94)X3 (6.92)
Midstream area2013X13 (6.48)X15 (6.48)X19 (6.38)
Midstream area2022X13 (7.13)X15 (7.11)X19 (7.06)
Downstream area2013X15 (6.59)X13 (6.58)X19 (6.38)
Downstream area2022X15 (7.06)X11 (7.06)X13 (7.03)
Disclaimer/Publisher’s Note: The statements, opinions and data contained in all publications are solely those of the individual author(s) and contributor(s) and not of MDPI and/or the editor(s). MDPI and/or the editor(s) disclaim responsibility for any injury to people or property resulting from any ideas, methods, instructions or products referred to in the content.

