1. Introduction
Since the middle of the 20th century, the level of carbon dioxide (CO
2) has increased. Particularly, in the past four decades, the rise of CO
2 emissions has been exponential [
1]. The rise in emissions is linked to numerous adverse environmental impacts, including climate change and air pollution. In response, the Paris Agreement was established in 2015 and signed by 196 countries. Its primary goal is to implement actions and policies to limit global temperature rise to no more than 1.5 °C above pre-industrial levels [
2]. More recently, in December 2023, the 28th Conference of the Parties (COP28) was held in the United Arab Emirates (UAE). This summit reinforced the objectives of the Paris Agreement, highlighting the urgent need to achieve global net-zero emissions by mid-century and maintain the temperature increase below 1.5 °C.
Cities play a crucial role in this context, accounting for approximately 70% of global emissions while occupying only 3% of the Earth’s surface [
2]. Therefore, innovative initiatives and targeted policies must prioritize urban areas to reduce carbon emissions effectively. Carbon neutrality refers to balancing the amount of carbon emitted with the amount absorbed or offset through carbon sinks [
3]. The city of Valencia is actively aligning with European strategies by participating in the “100 Climate-neutral Cities by 2030” initiative [
4]. Additionally, Valencia has published its Sustainable Energy and Climate Action Plan (SECAP) [
5] under the framework of the Covenant of Mayors for Climate and Energy [
6].
1.1. State of the Art
Carbon neutrality is a balance between the greenhouse gases emitted into the atmosphere and those removed or offset, resulting in a net-zero carbon footprint. The concept of a carbon neutral neighborhood (CNN) involves applying carbon neutrality principles at the local scale to accelerate urban decarbonization and climate action. In Valencia, the Benicalap neighborhood—a traditional residential area—has been selected as a pilot site for implementing this model. Achieving carbon neutrality at the neighborhood level requires significant societal transformations, including policy shifts, business models, urban governance, and education systems. The European Union underscores the importance of CNNs in promoting new forms of governance, active citizen participation, and innovative financing mechanisms to drive this transition [
7]. To assess emissions effectively, the Greenhouse Gas Protocol categorizes them into three scopes: Scope 1 includes direct emissions; Scope 2 accounts for indirect emissions from purchased energy; and Scope 3 covers all other indirect emissions, such as transportation, goods consumption, and waste [
2].
Once the emissions inventory has been established, strategies must be proposed to reduce emissions, such as transitioning to renewable energy, improving energy efficiency, and promoting sustainable mobility. For those emissions that cannot be eliminated, offsetting measures—like reforestation or investing in carbon credits—must be implemented to ensure that the total emissions released are balanced by the amount removed, thereby achieving carbon neutrality.
Despite growing interest in carbon neutral strategies, there remains a lack of consensus regarding methodologies for calculating carbon inventories, particularly at the neighborhood level. Most existing studies are conducted at national, regional, or city-wide scales, often overlooking the detailed quantification of emissions and mitigation potential at the local scale. Several studies have broadly examined urban decarbonization; some have focused on assessing energy sustainability in cities to support climate adaptation [
8], while others have analyzed the spatial and temporal dynamics of carbon emissions [
9] or evaluated the PV potential in urban areas for CO
2 emission purposes [
10]. Finally, ref. [
11] developed a novel agent-based model (ABM) to explore optimal trade-offs in the ecological modernization of enterprises. The model addresses a bi-objective optimization problem, balancing two conflicting goals: minimizing the Integrated Volume of Total Emissions and maximizing the Integrated Index of Industrial Production. The ABM provides insights into sustainable industrial strategies that align environmental and economic objectives by simulating enterprise behavior and interactions in various policy and technological scenarios. Additionally, integrated approaches to assessing climate-related risks and adaptation strategies in urban areas have been proposed [
12]. Emotional and behavioral drivers that influence household energy use—such as those that affect cooling behaviors in subtropical metropolitan cities—have also been studied using the extended theory of planned behavior [
5].
Regarding data and tools, researchers have used LiDAR technology to quantify point-source CO
2 emissions [
13,
14], while urban classification based on physical and emissions characteristics has supported localized sustainability planning. Other work has focused on modeling place-based and nature-based solutions to support carbon neutrality goals by analyzing the contribution of metropolitan areas to decarbonizing the residential stock, including a case in Spain, or by analyzing the impact of transportation on climate change [
15]. Further studies have explored the role of energy storage, electrification, spatio-temporal energy sharing, and hydrogen technologies in supporting the transition toward carbon neutral districts [
16]. Innovations in urban green energy development also play a critical role in achieving emissions neutrality at the local scale [
17].
Other studies have focused on particular sectors. The GHG Protocol, the most widely used methodology to manage and mitigate emissions [
18], provides a guideline of sectors to consider within Scope 3. Some of the most relevant sectors to be considered are food, waste management outside the city, and the consumption of goods and services, such as clothes, furniture, and appliances. In the case of food and beverage consumption, emissions vary greatly depending on habits. It is estimated that the related daily emissions per inhabitant in northern areas are around 3.26 kgCO
2, and in southern areas, they are 2.93 kgCO
2 [
19]. Analyzing the entire life cycle assessment would produce results of around 1600 and 2000 kgCO
2 per year per person, respectively [
20]. In the case of waste treatment, the average person is estimated to produce 7.6 kg of garbage per month, or 91.2 kg per person per year [
21]. A study conducted in Germany determined that emissions from the production, transport, use, and disposal of clothing can produce between 240 and 530 kgCO
2 per year per person [
22,
23]. According to Belkhir and Elmeligi (2018) from McMaster University in Canada, the carbon emissions linked to smartphone use make up approximately 1% of all global emissions [
23].
Within Spain, the Ministry for the Ecological Transition (MITECO) estimates that 47% of national emissions belong to Scope 3 [
24]. In Valencia, Scope 3 emissions represent approximately 63% of total emissions, largely driven by transportation not registered in the locality and by the consumption of goods and services [
19]. In the case of the Benicalap neighborhood, Scope 3 emissions accounted for 77% of total emissions in 2021. Recent work has developed a methodology for estimating and mitigating Scope 3 emissions at the neighborhood level, further highlighting the importance of understanding local dynamics [
20].
1.2. Contributions of This Research
This research contributes to the current body of knowledge by proposing a practical and transparent methodology for calculating carbon inventories in a residential neighborhood, covering all three emission scopes. This study also evaluates the potential impact of decarbonization strategies that include energy efficiency measures across sectors such as building retrofits, mobility improvements, and behavioral changes, as well as the deployment of renewable energy sources to cover residual energy demand. The findings provide evidence-based insights for policymakers, urban planners, and stakeholders interested in replicating effective strategies for achieving carbon neutrality at the neighborhood scale. Differences between the analysis and local results (when available) have been estimated. Nevertheless, many of the produced results have not been previously estimated, so, in many cases, there is no information—either from the government or from a third party—regarding these findings. This highlights both the novelty and the value of the analysis, while also reinforcing the importance of continued data collection and transparency at the local level to support evidence-based climate action.
2. Methodology
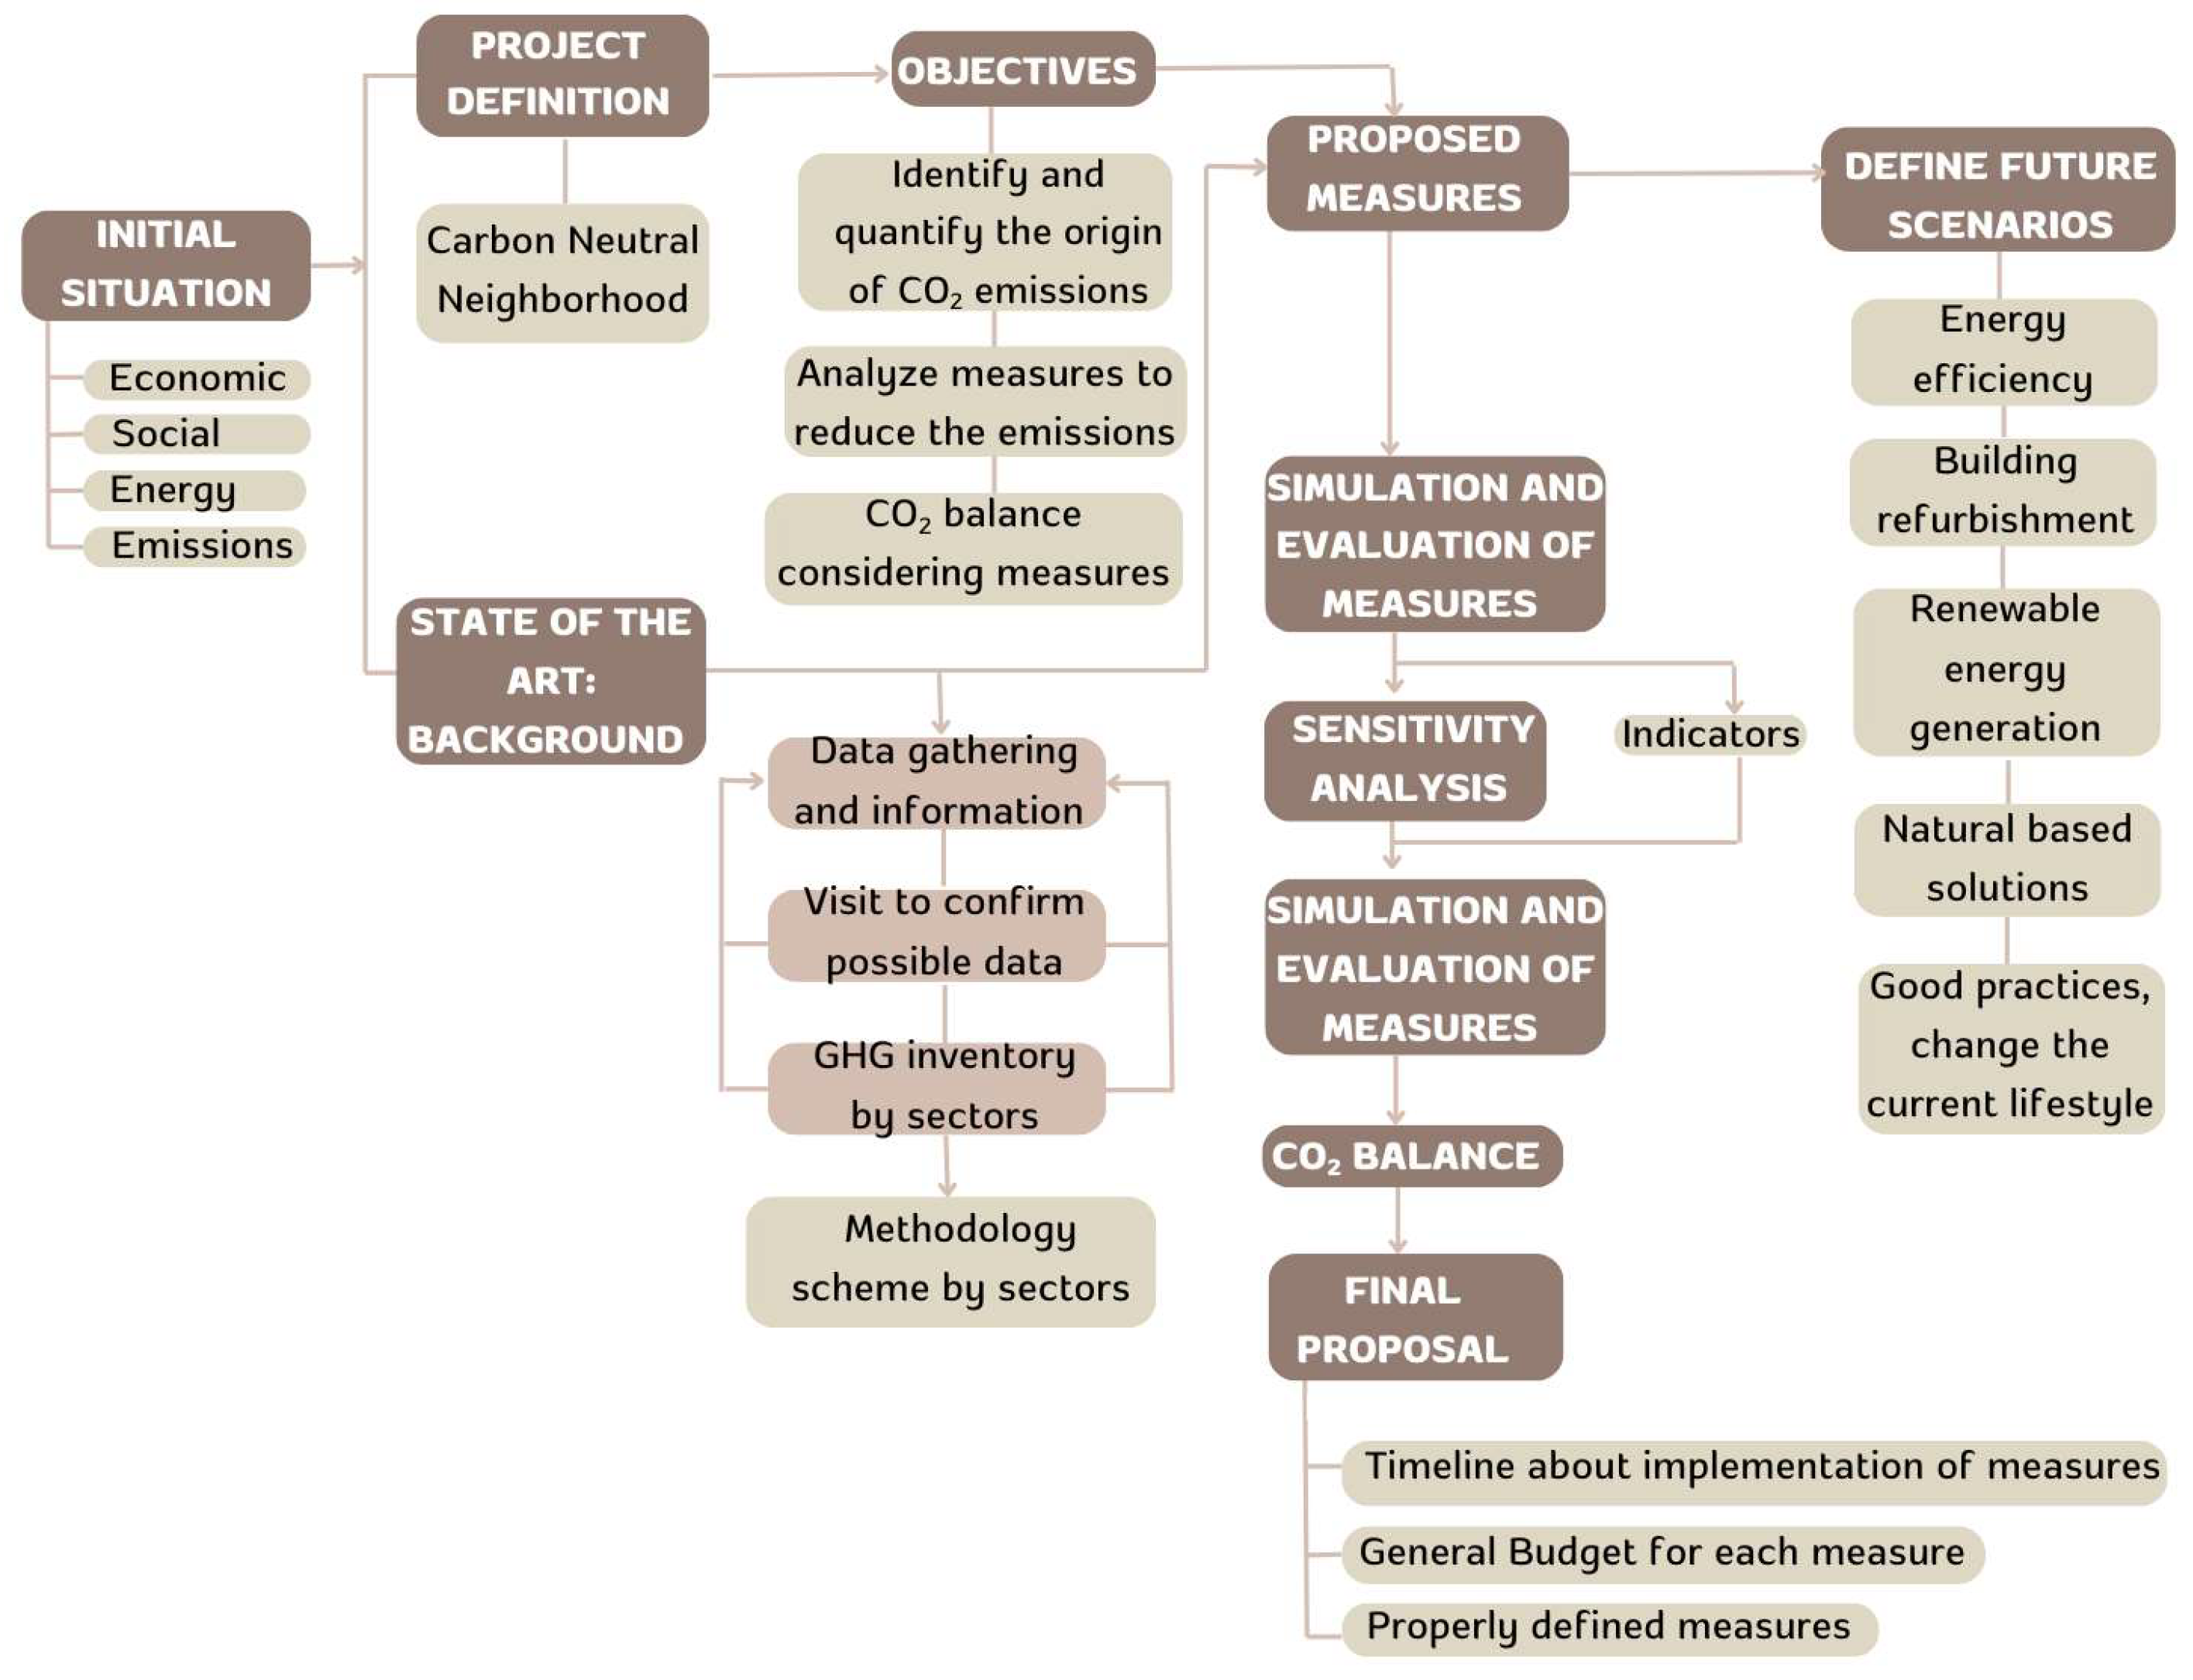
The procedure developed and implemented for this study is outlined in
Figure 1. The methodology, refined from [
25], was adapted to meet the Valencia City Council’s request within the framework of the Urban Energy Transition Chair to develop technological roadmaps for decarbonizing the Benicalap neighborhood [
26]. The initial step involves defining the project’s scope and objectives, with carbon neutrality as the central guiding principle. Based on this objective, the following elements were established:
Figure 1.
General procedure scheme. Adapted from [
28].
Figure 1.
General procedure scheme. Adapted from [
28].
This method will be applied by gathering information through state-of-the-art research and analyzing the initial situation as follows:
Characteristics of the area: These include details regarding the surface, population, information about the population (age, gender, etc.), as well as the use of public and private transport and the presence of green areas.
If necessary, visit the neighborhood to confirm green area availability, following the available cartographic data, especially if this information has not been updated.
Divide energy consumption into residential, industrial, and service sectors.
Create a GHG inventory by sector, obtaining data on the characteristics of the sectors in Benicalap, the emissions per type of sector, and other aspects relevant to developing this inventory.
A list of measures is proposed to conduct a multilevel analysis of the initial situation’s economic, technical, social, and environmental impacts. The proposed measures are based on renewable generation systems, the evolution of the transport fleet for both private and public transport to sustainable options, the implementation of nature-based solutions, and energy efficiency measures in public lighting.
Considering the proposed measures, it is necessary to analyze the impact and contribution to CO2 reduction that each measure can produce with respect to the initial situation. In this way, it will be possible to determine which action has a greater impact, as it is important to develop measures that consider not only CO2 reduction but also economic impact, social effects, etc. With all these data priorities, the different measures are organized along a temporal line.
Also, a CO2 balance is required to evaluate the impact of different measures proposed to achieve carbon neutrality in cities. Starting from the initial situation and considering the CO2 emissions for the following years, along with the CO2 reduction based on the proposed measures, a CO2 balance roadmap by 2030 is presented.
Finally, it should be noted that the presented methodology, especially the GHG emissions inventory, requires a significant amount of specific input data (such as electricity consumption, traffic intensity and vehicle fleet composition, the consumption of goods, and emission factors for products, fuel, and electricity). Usually, these data are not directly available at the neighborhood level. However, these data are usually public and may be available at the city or district level (or even at the street or postal code level, as in the case of electricity consumption or traffic statistics) or the national level (as in the case of goods consumption statistics and emission factors for fuels and goods—Scope 3 emission factors). Therefore, in this methodology, specific data have been used as much as possible, and, when necessary, the necessary input data have been estimated from aggregated sources, such as those at the city or national level, using downscaling factors, as described in Section Downscaling Factors for the Benicalap Neighborhood.
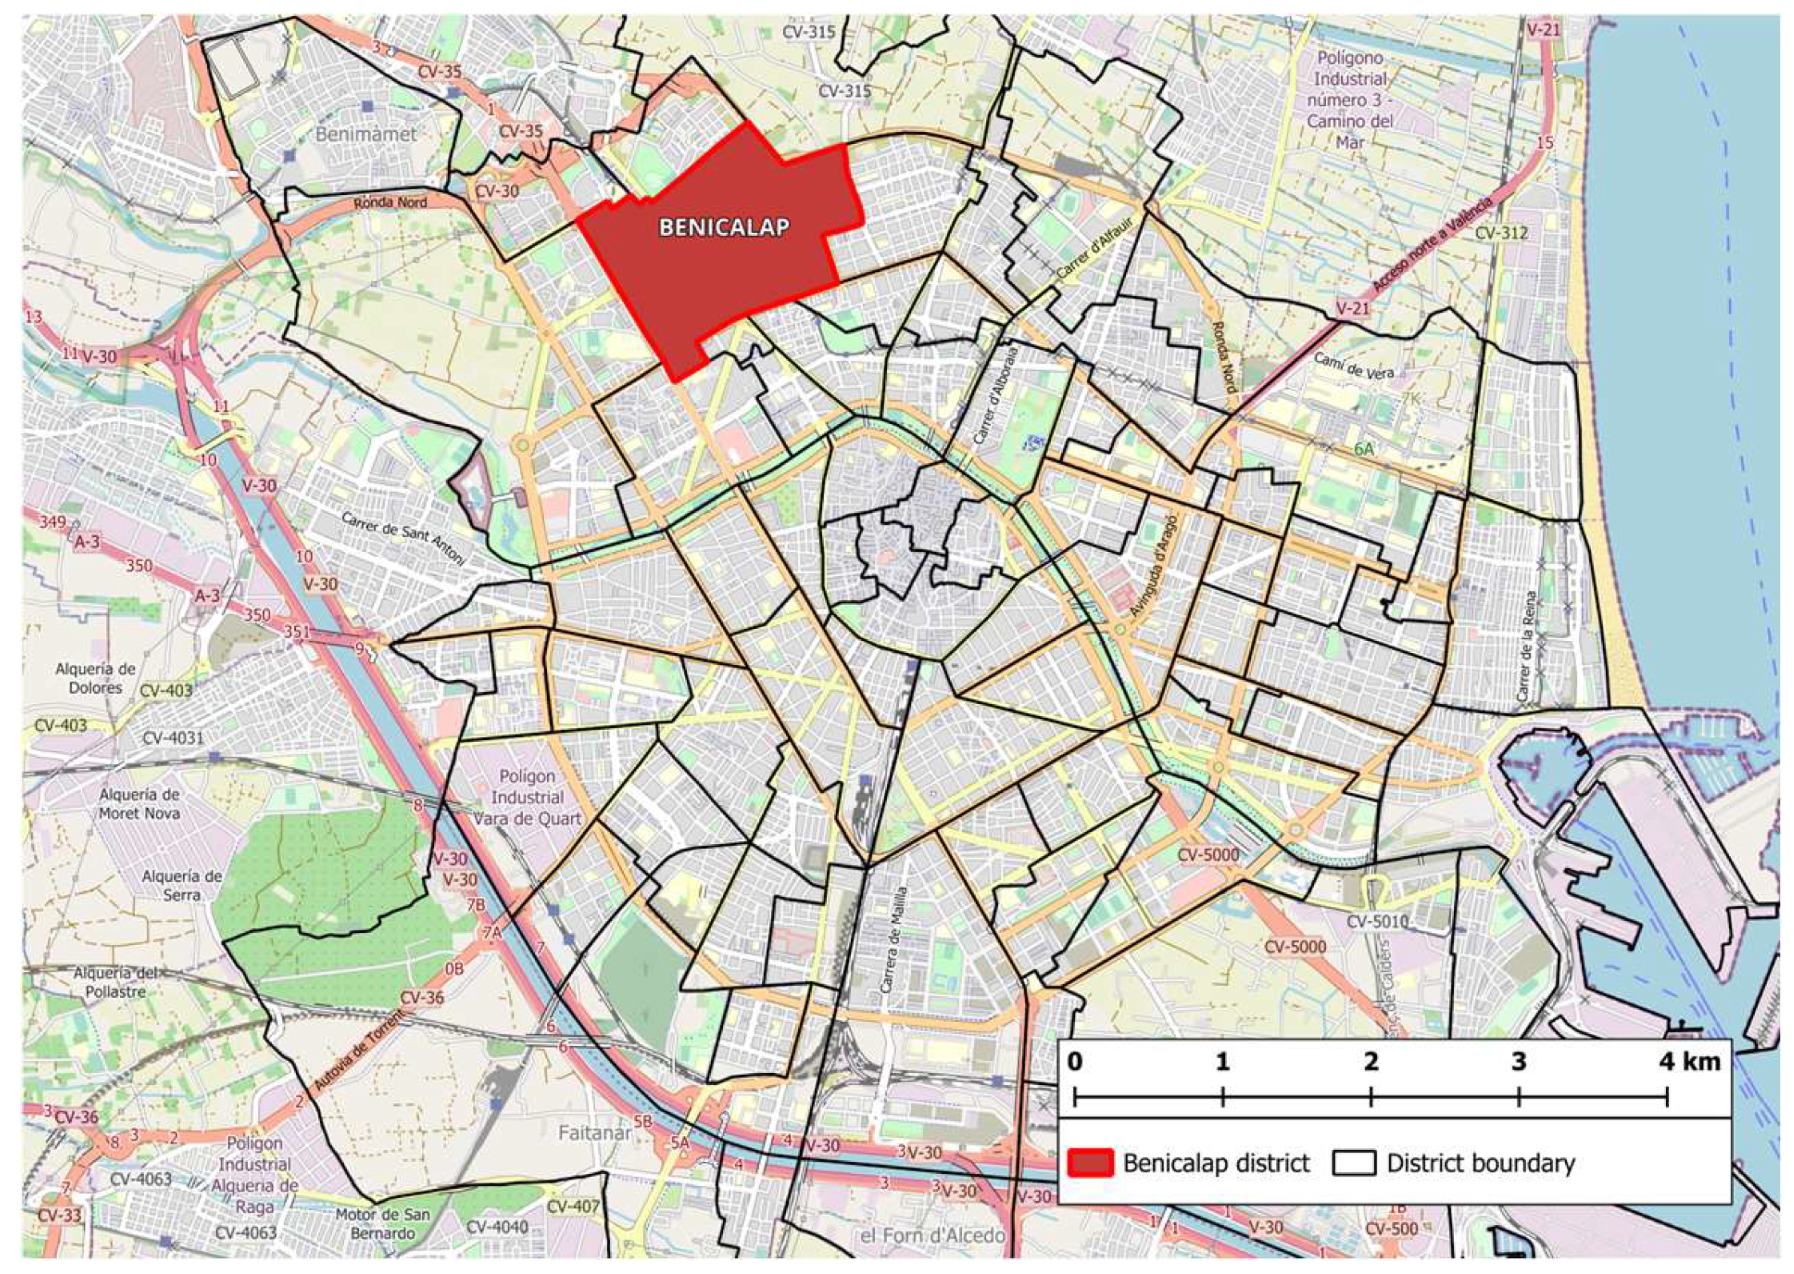
2.1. Case Study: Neighborhood of Benicalap
Benicalap is located north of Valencia and covers a surface area of 1.72 km2. The neighborhood has a population of 41,483, resulting in a population density of 24,132 inhabitants/km2. The neighborhood has a total of 18,968 houses distributed across 1053 buildings, and the majority of the buildings were built between 1961 and 1980.
In terms of energy consumption, the Benicalap neighborhood uses approximately 77,085 MWh of electricity and 44,650 MWh of natural gas annually. The residential sector is the largest electricity consumer, accounting for 45,604 MWh per year. The services sector follows, being Valencia’s second most significant economic activity, which consumes 30,344 MWh annually. The industrial sector represents the smallest share, with an annual electricity consumption of 1136 MWh.
The selection of the Benicalap neighborhood as the case study for this research was based on a combination of strategic, technical, and contextual criteria aligned with the objectives of urban decarbonization. Benicalap is a densely populated residential neighborhood located in the northern part of Valencia, Spain. With over 41,000 inhabitants and a land area of 1.72 km2, it offers a scale that is both manageable for data analysis and sufficiently representative to draw meaningful conclusions for broader urban contexts.
One of the main motivations for choosing Benicalap was its alignment with local and European climate policy initiatives. Valencia is one of the cities selected under the European Union’s “100 Climate-Neutral Cities by 2030” mission, and Benicalap has been identified as a strategic pilot site within this framework. This status makes it a prime candidate for testing decarbonization methodologies that could be replicated across other city districts or in similar urban environments elsewhere in Europe. The neighborhood’s inclusion in Valencia’s Sustainable Energy and Climate Action Plan (SECAP) further reinforces its relevance as a testing ground for localized carbon neutrality interventions.
Another important factor was the availability and granularity of the data required to build a robust greenhouse gas (GHG) inventory. Publicly accessible datasets for energy consumption (electricity and natural gas), transportation (traffic intensity, vehicle fleet composition, and modal split), and waste management made it feasible to accurately calculate emissions across Scopes 1, 2, and 3. In addition, Benicalap’s relatively uniform residential character, which primarily consists of mid-rise buildings constructed in the second half of the 20th century, provides a coherent physical and socio-economic framework for evaluating the impact of different mitigation measures.
Furthermore, Benicalap represents a prototypical Mediterranean urban neighborhood, characterized by high population density, limited green space, and an aging building stock. These features pose common challenges for urban decarbonization, particularly in southern European contexts. By applying a methodological framework to Benicalap, this study aims to develop insights and tools transferable to neighborhoods with similar typologies, thus contributing to the broader scalability and applicability of neighborhood-scale carbon neutrality strategies.
Downscaling Factors for the Benicalap Neighborhood
Downscaling has been applied to obtain the specific data for Benicalap by using available data at the district, city, or county levels. These factors were derived by comparing data at different scales and were primarily based on population and area. The factors used in this case are included in
Table 1, where the population and area factors for city data are 0.052 and 0.016, respectively, while the corresponding factors for district data are 0.875 and 0.774, respectively. The downscaling factors used are included in
Table 1.
2.2. Tools Used
The development of the GHG Inventory and the evaluation of the proposed reduction measures requires the use of the following tools to achieve the presented results:
QGIS version 3.42: This study employs a specialized tool to estimate the rooftop surface area available for installing photovoltaic (PV) systems on buildings. The overall methodology is outlined below. First, geospatial data were utilized to identify and quantify the roof areas that are suitable for PV installation in Valencia. This information was sourced from the Spanish Inspire Cadastral Downloader, which provides detailed cadastral data, including references, the number of above-ground floors, building usage types, and the number of residential units. The cadastral data are organized by municipality, and the dataset corresponding to Valencia was used to generate a geospatial layer. Using this layer, the surface area of each building geometry was calculated with a geospatial analysis tool, applying the area expression to determine the total rooftop area available for PV deployment in the Benicalap neighborhood (
Figure 2). However, to obtain the information by neighborhood, a new layer containing the administrative divisions of the neighborhoods was downloaded from the Spanish government [
30]. This layer was then overlapped with the Valencia layer, and the Valencia layer was cut to obtain the data for each neighborhood. The data obtained using this method allowed us to determine the available roof surface area for PV panel installation in each neighborhood of Valencia. To avoid incorrect calculations, polygons with only one floor and polygons with areas smaller than 20 m
2 were excluded from the analysis.
Overall, the project utilized geospatial data and QGIS software to obtain information about available roof surfaces for PV panel installation in Valencia by neighborhood.
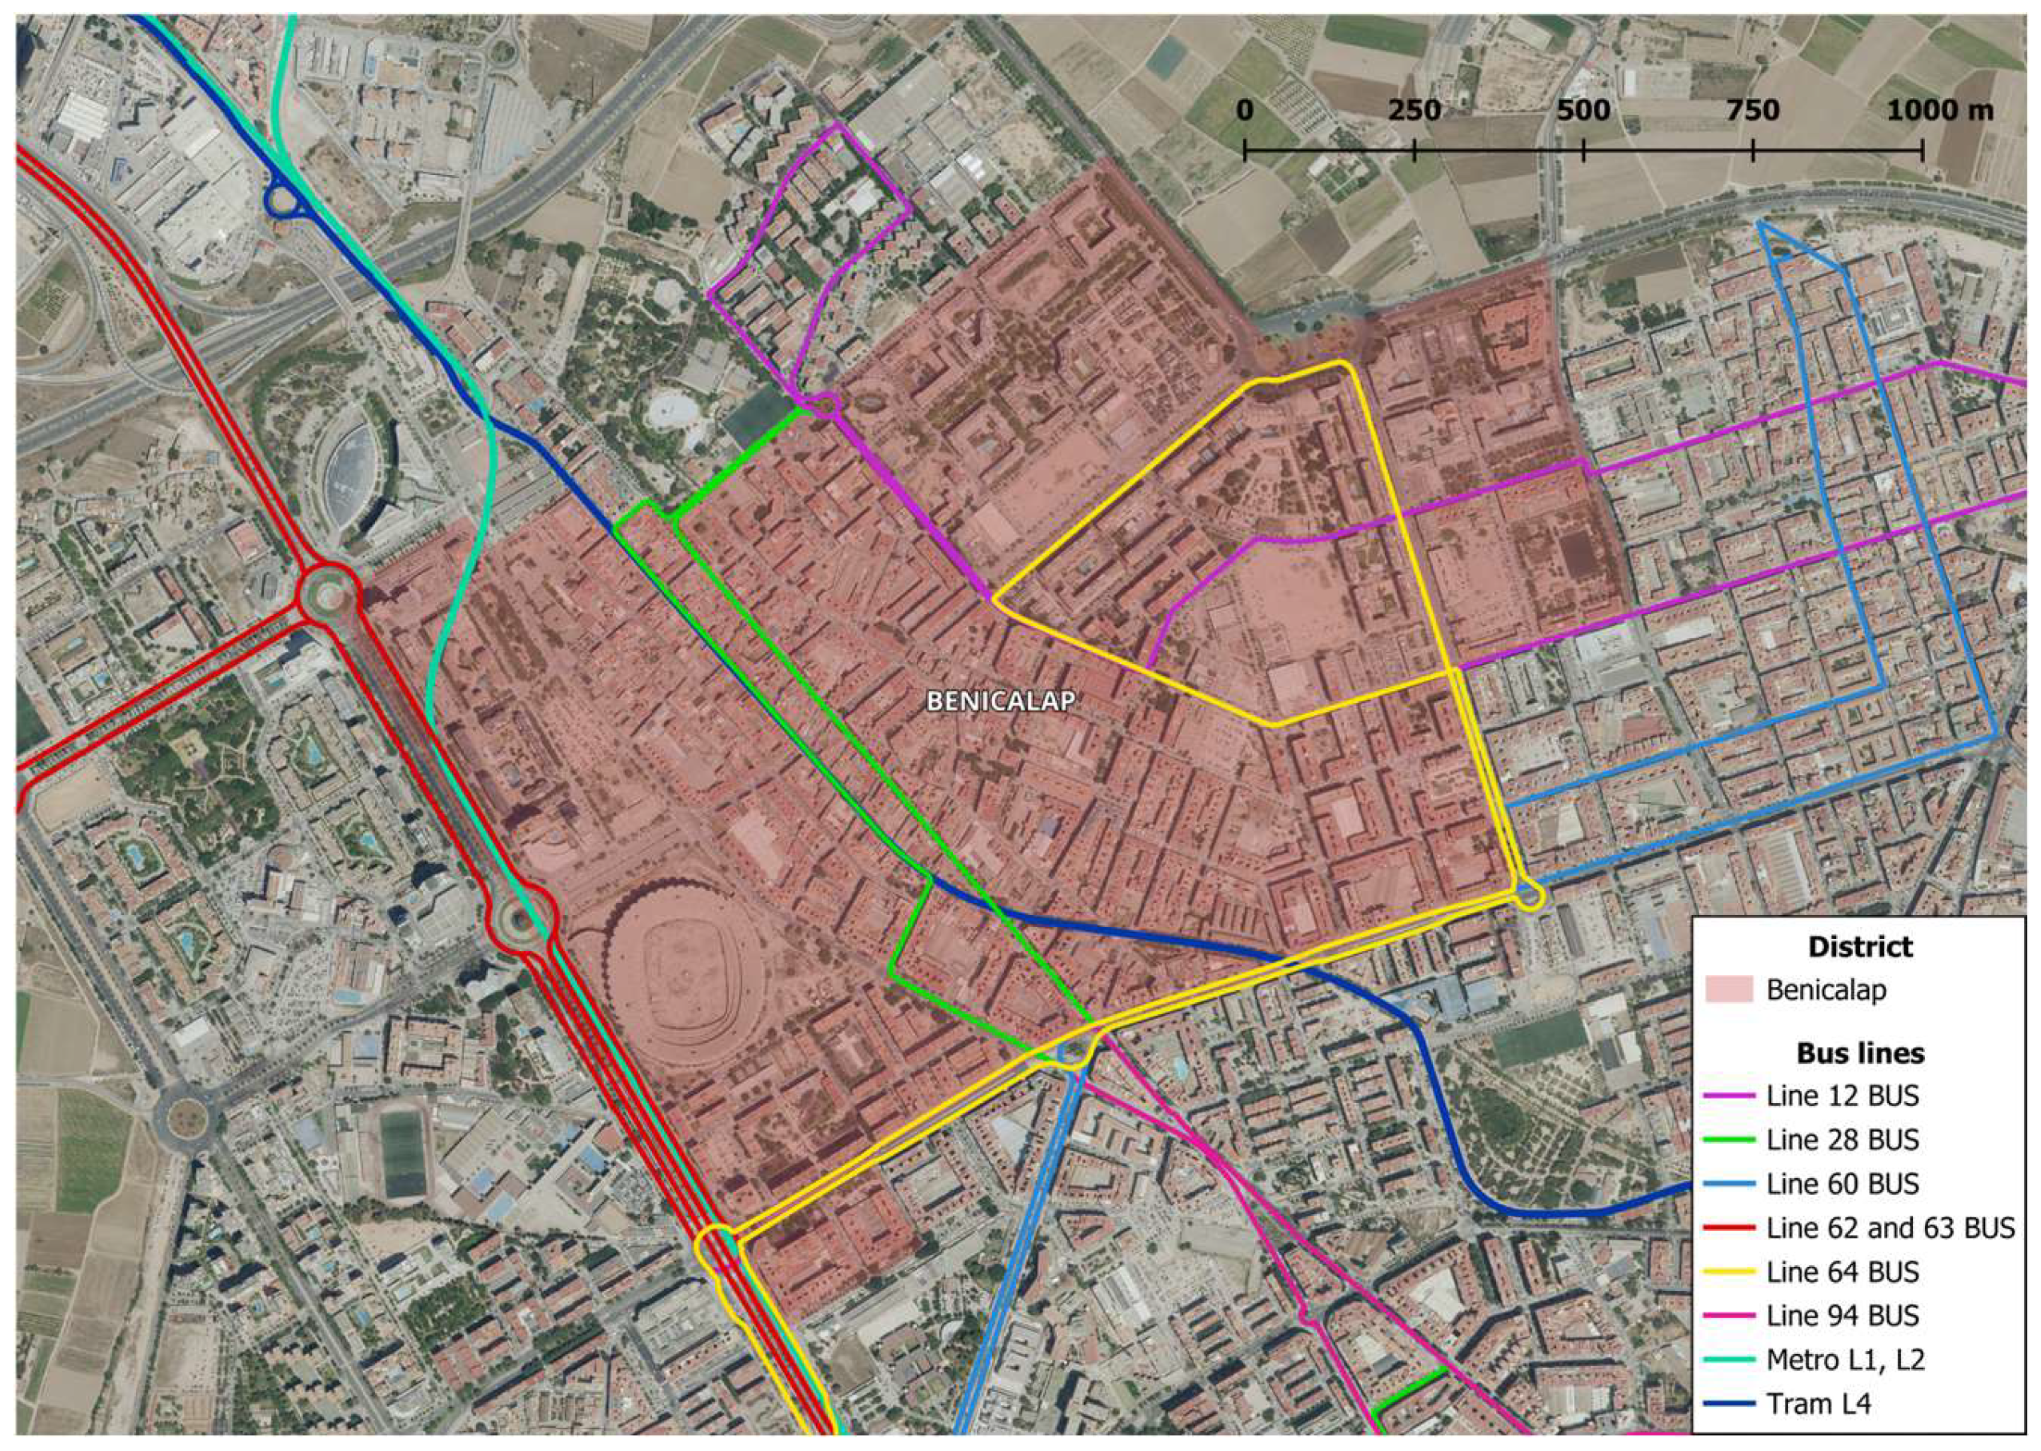
Google Earth version 7.3: Google Earth was used to estimate various distances—such as the length of public transport routes within the neighborhood—and to gain an overall spatial understanding of key features through its interactive mapping capabilities (
Figure 3).
Datadis: Datadis is an online tool that provides daily electricity consumption values for different neighborhoods based on user-entered zip codes. A uniform consumption rate is assumed for households and businesses in the area to estimate electricity consumption for a whole ZC. The consumption rate is calculated by dividing everyday consumption per sector (residential, industrial, and commercial) by the number of customers (kWh/customer). This rate is then multiplied by the number of households, industries, or businesses in each sector to determine the total electricity consumption for the entire area.
PVGIS 5.2: PVGIS is an online tool used to obtain and introduce solar radiation data into the simulations developed with Homer.
Homer 2.68: Homer is a tool used to dimension and evaluate the neighborhood’s photovoltaic potential as one measure to try to reduce emissions associated with electricity consumption. Homer has been employed in the scientific field to choose the best option when several renewable systems are used [
10,
31,
32]. A total of ten simulations were developed for the Benicalap neighborhood, considering five different percentages of the usable rooftop area and two distinct panel inclinations. The selected tilt angles were 35°, representing the optimal angle for solar generation in Valencia, and 15°, which was included to assess how a lower inclination affects energy production. This comparison allows for the evaluation of not only energy output but also practical factors, such as the number of PV panels that can be installed, initial investment costs, and overall system profitability. The potential energy generation from the PV installations was calculated using HOMER software, following the methodology described in [
10,
33].
2.3. Carbon Footprint
The greenhouse gas (GHG) inventory was developed by categorizing all emissions into distinct sectors. The groups considered in this analysis include buildings (covering electricity and gas consumption), transport, goods consumption, waste, and public lighting.
2.3.1. Buildings
Data on Valencia’s total electricity and gas consumption were used to estimate the emissions resulting from operating several kinds of buildings in Benicalap. This information was then extrapolated to the neighborhood of Benicalap. Electricity consumption was calculated using Datadis, while gas consumption data were obtained from Valencia City Hall [
34] (
Figure 4).
Equation (1) includes the calculation procedure for obtaining the building GHG emissions associated with electricity supply, where
is the electricity supply of sector i (which can be residential, commercial/services, or industrial) in the neighborhood, and
is the corresponding emission factor for electricity.
Equation (2) includes the calculation procedure for obtaining the building GHG emissions associated with gas supply, where
is the natural gas supply in the neighborhood, and
is the corresponding emission factor for energy supply i.
was estimated using available data for the city regarding the total gas consumption by sector i (residential, commercial, industrial) and the number of subscribers in each sector in the city of Valencia. Afterward, the average consumption per subscriber
per sector was calculated by dividing the total gas consumption by the number of subscribers in the city. Later, the total natural gas consumption was calculated using the number of subscribers for each sector,
, in the neighborhood, as described in Equation (3).
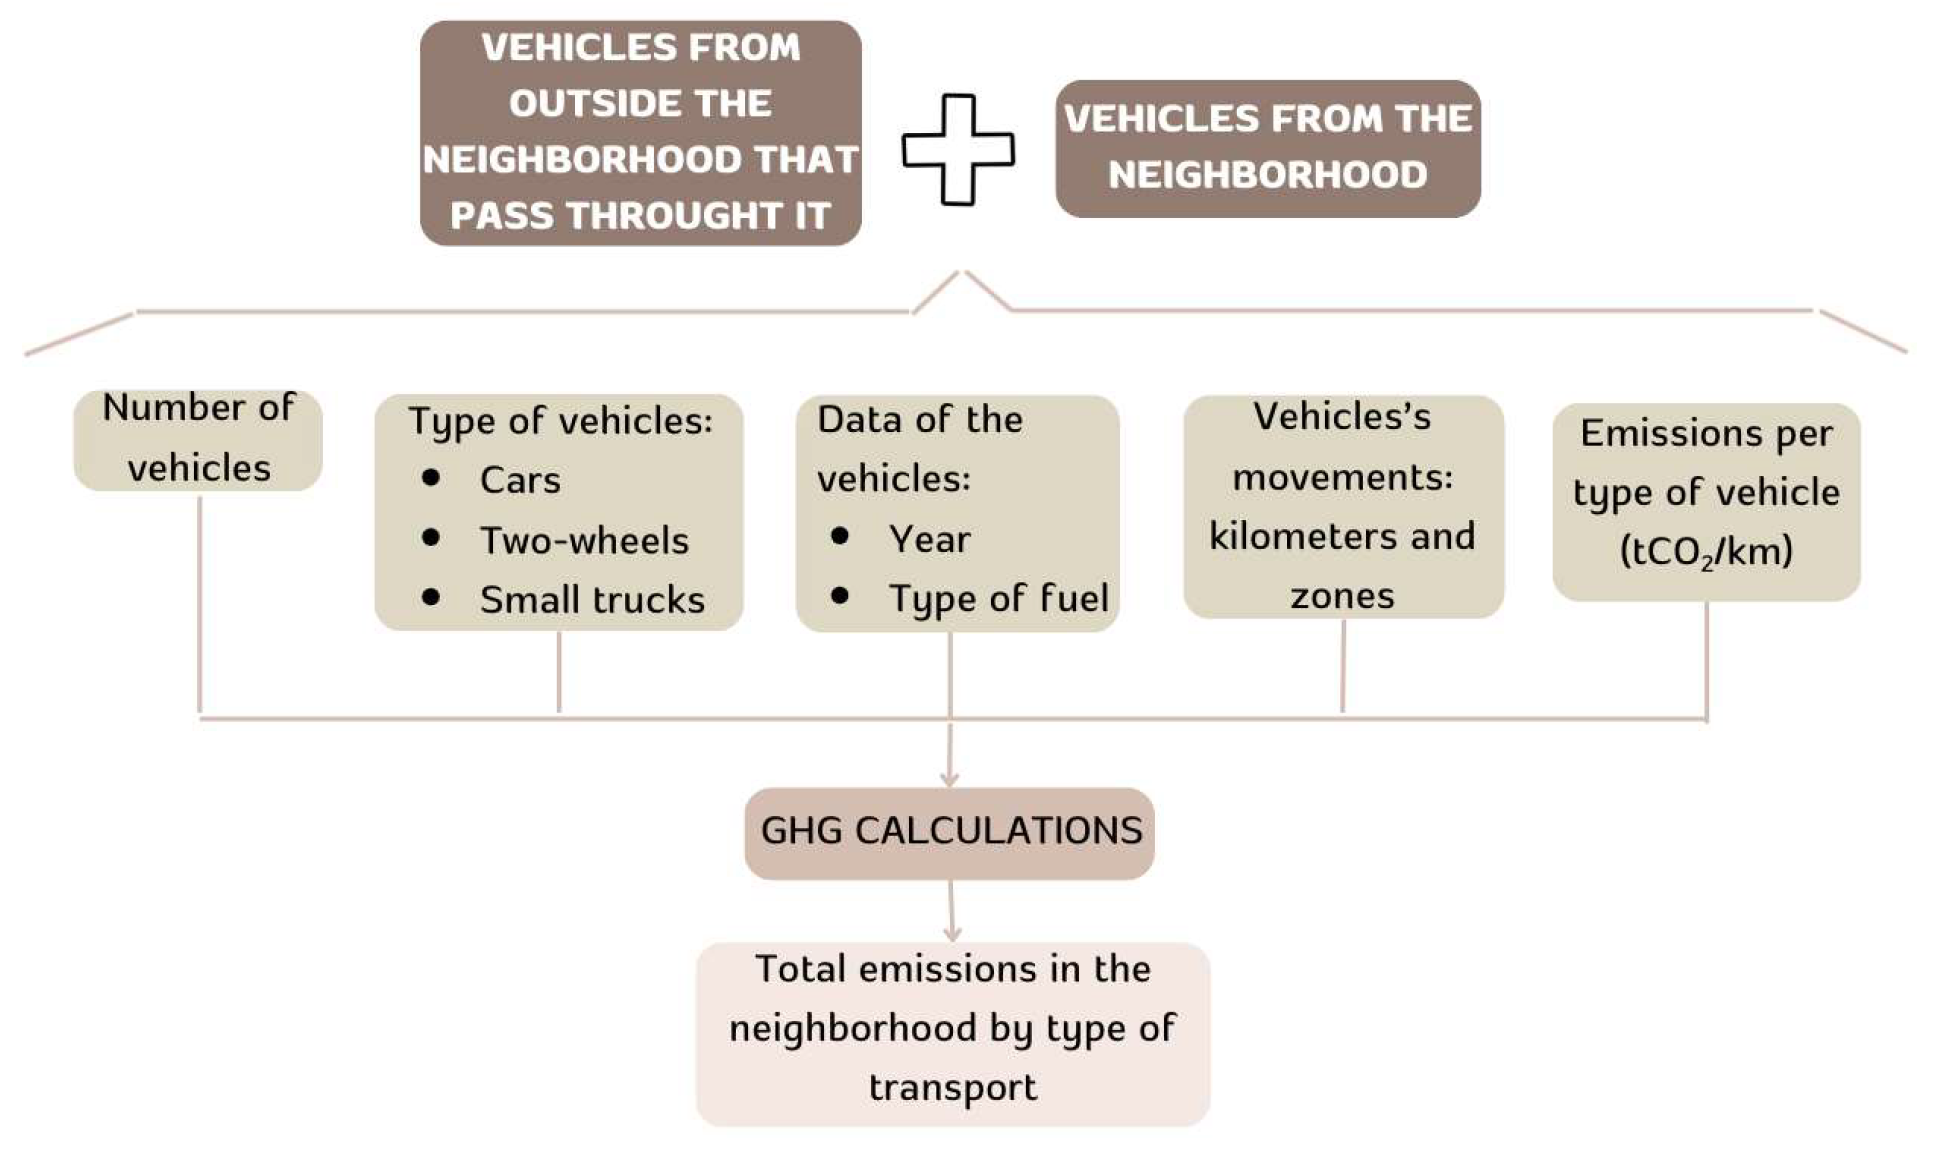
2.3.2. Transport
To determine the emissions produced by various modes of transportation, these modes have been classified into two categories: private transport and public transport. The methodologies used to estimate the emissions in each category are presented in
Figure 5 and
Figure 6.
To determine the private transport situation in Valencia, specifically in Benicalap, the personal vehicles chosen included small trucks, passenger cars, two-wheelers, and bicycles. To evaluate the emissions, first, the number of each type of private transport in the city of Valencia was obtained [
35]. These vehicles were calculated based on the European Regulation that sorts the cars into various groups depending on the fuel type and year of matriculation: Pre Euro, Euro 1, Euro 2, Euro 3, Euro 4, Euro 5, and Euro 6. About 30 types of vehicles can be defined as a combination of small trucks, cars, two-wheelers, bicycles, and European Regulation groups. According to city and neighborhood statistics regarding private vehicle fleets, the number of vehicles of each type (
) and the average emission factor per kilometer for each type of vehicle i (
) are estimates. According to city statistics and surveys, the annual average distance traveled per type of vehicle (
in km per year) and the percentage of this distance that is traveled inside the neighborhood
, which is 33% (expressed per unit for calculations, so
= 0.33), are also provided. Equation (4) describes the calculation for obtaining the GHG emissions of vehicles in the neighborhood (
.
Another relevant source of emissions associated with private transport is the greenhouse gases emitted by vehicles that are not registered within the neighborhood but pass through it,
, which contribute to local emissions. These are classified as indirect emissions, falling under Scope 3 rather than Scope 1. To estimate these emissions, data on the “IMD: Intensidad Media Diaria de Vehículos”—the average daily traffic volume for each j road segment,
—was used for the main roads in Valencia, as provided in [
35]. The calculation also considered the length (in kilometers) of each road segment (
) within the neighborhood, the percentage of vehicles of type i (
) expressed per unit, and the average emission factor per kilometer for each type of vehicle i (
). Equation (1) describes the calculation procedure for
, and as some of the vehicles pertain to the neighborhood, according to municipal statistics, it has been considered that 80% (
= 0.8) of the monitored traffic intensity (accounted for in
) is from outside the neighborhood. Equation (5) describes the method of calculation for
.
The public transport in Valencia comprises four principal means of transportation, including seven metro lines, four tram lines, and a wide range of bus lines, which will be detailed for the Benicalap “Valenbisi” service and the bicycle-sharing service. The public transport activity, including the metro, trams, and buses, is calculated by considering the distance of every line that passes through the neighborhood, the number of trips performed per type of day, including weekdays, weekends, and holidays, and the emissions related to each mean of transport. Valencia has 2750 bicycles [
36] divided into 277 stations and 5502 locking points. Based on the map of all the stations in the city, there are 66 bicycles in Benicalap.
Equation (6) describes the calculation of GHG due to public transport (
) based on the distance of line i within neighborhood limits, the number of trips per year (NT), and type of transport (bus, tram, or metro, as well as all subtypes according to fuel type or electricity) assigned to line i.
Based on Valencia’s “Sustainable Urban Mobility Plan”, the aim is to implement measures for decarbonizing the transport system, improving pedestrian mobility, increasing the number of cycle paths and public bicycles to promote cycling, promoting public transportation over private vehicles, and analyzing the current transportation system to identify zones with poor connections. Additionally, the goal is to encourage the use of electric cars in public and private transportation.
Electric vehicle (EV): For electric vehicles (EVs), usage projections are based on the ”Plan de impulso del vehículo eléctrico y despliegue de la infraestructura de recarga en la Comunitat Valenciana” [
37].
Table 2 presents the forecasted number of EVs in the Valencian Community. To estimate the corresponding figures for the city of Valencia, a downscaling factor was calculated using the ratio between the population of Valencia and that of the entire Valencian region, resulting in a value of 15.64%. However, given that Valencia is a major urban center with a higher concentration of charging infrastructure and more favorable conditions for EV adoption, this percentage was adjusted upward to 25%.
Electric bus measure: To evaluate the public bus fleet (EMT) of Valencia, the focus is on the new cars acquired in the past three years. Most of the fleet comprises combustion vehicles, and some hybrid buses comprise a significant percentage. However, only a few electric buses are in the fleet, which is a key area that requires improvement. Therefore, the evaluation will assess the progress and potential for incorporating more electric buses into the fleet to reduce emissions and promote sustainable transportation. The total number of EMT buses has been obtained (EMT Valencia, 2020) [
38], but the more updated report is from 2020, so the prediction has been obtained from the “Roadmap for the Energy Strategy of Valencia 2020–2030” [
39].
2.3.3. Goods
The consumption of goods in society nowadays is very remarkable because it can be qualified as consumerist [
40]. The purchase and use of a higher number of necessary goods result in increased CO
2 emissions related to these processes, which could be reduced by implementing good practices in consumption. The goods considered in this inventory include food, clothes, and other manufactured products.
It is essential to consider the CO
2 emission factors for each item included to calculate the emissions generated by consumption. This information is provided in
Table 3. The data are directly presented as annual CO
2 emissions per capita (tCO
2/cap) for clothing and other manufactured products.
If the previously mentioned data are combined, the CO
2 emissions per capita can be calculated, as shown in
Table 4. To calculate the emissions related to consumption in Benicalap, the CO
2 emissions and the total population for each category are considered.
Equation (7) describes the calculation procedure for GHG emissions related to the consumption of goods, where
is the consumption of good i (which can be different types of food, clothes, or manufactured products),
is the corresponding emission factor, and
corresponds to the total number of inhabitants in the neighborhood.
2.3.4. Waste
Other emissions considered in this inventory are related to the generation and management of waste. The total waste generation in the neighborhood, categorized by waste type, has been identified; in this case, for Valencia, it is 406.7 kg/cap. The data that include these values are obtained from [
34] and scaled to Benicalap using downscaling factors.
After downscaling, it is necessary to divide the waste type into management categories. In this case, the categories considered include landfilling, recycling, energy generation, and composting [
43], representing 56.70%, 18.30%, 13.50%, and 11.5% of total waste generation, respectively [
44].
The total emissions associated with waste generation and management are outlined in
Table 5. These emissions consider the values mentioned and the emission factors for each waste management category.
Equation (8) includes the calculation procedure for waste GHG emissions, where
the generated mass (in kg) per type of waste,
, and kind of treatment,
;
is the corresponding emission factor; and
corresponds to the total number of inhabitants in the neighborhood.
2.3.5. Public Lighting
Public lighting installed in streets, gardens, parks, monuments, and other public elements is responsible for a portion of the CO
2 emissions of neighborhoods. Also, this analysis and data are included in [
34], where they are divided into the different districts of Valencia. In this case, the results are focused on Benicalap, which has 4002 points of light and a consumption of 2025 MWh. To adapt the district’s data to the selected neighborhood, the downscaling factors from
Table 1 have been considered. In this case, the factors used, are more appropriate due to the type of distribution of public lighting in the area.
Public lighting in spaces like parks, streets, and others predominantly relies on various lighting technologies, including high-pressure sodium lamps, LED lights, metal halide lamps, and some less common types. Since 2015, efforts have been underway to replace all the existing lights in Valencia with LEDs. According to data from 2020 [
34], approximately 30% of public lighting in Valencia was already using LEDs by that year. The ultimate goal is to achieve 100% LED public lighting by 2030. This initiative is part of a broader effort to enhance energy efficiency, reduce carbon emissions, and improve the sustainability of urban environments.
Other authors have studied the electricity savings produced by changing lights to LEDs [
44,
45]. The energy-saving estimation comparing the initial and final situation (2020 vs. 2030) is 65%. This is considered energy-saving, considering that 30% of the LEDs have been installed.
Equation (9) includes the calculation procedure for public lighting GHG emissions associated with electricity consumption, where
is the electricity consumption associated with public lighting in the neighborhood, and
is the corresponding emission factor for electricity.
2.3.6. Carbon Sequestration
In this study, the potential green areas in the Benicalap District were estimated using Google Earth to identify regions that are free of buildings or other constructions, have a low density of vegetation, or are in a poor state of conservation. Nature-based solutions (NBS) involve integrating nature into urban environments, emulating natural ecosystems to achieve environmental, social, and economic benefits, thereby enhancing urban sustainability. Given Benicalap’s characteristics—an urban area with high building density and minimal plant coverage, mostly limited to individual trees or small gardens—the implementation of NBS is significant. These solutions could help address the lack of green spaces, improve air quality, reduce the urban heat island effect, and increase the overall well-being of residents by creating more accessible and sustainable green areas.
To propose NBS, the current NBS strategies implemented in Benicalap need to be identified. The Geoportal of the city of Valencia [
46] was used to access information about the city’s green zones, including the name of the green zone and the neighborhood it belongs to. Based on these data, the total green zone area in Benicalap was calculated. It was found that Benicalap has 39 green areas, covering a total of 135,228 m
2 and representing 7.87% of the entire surface area of the neighborhood.
Given the previous analysis of green areas and the environmental data from the Valencia Town Hall [
29], it is possible to estimate the types of trees planted in the green zones of Benicalap. By using a tree inventory alongside the CO
2 absorption factor for each species and their respective ages, the absorption potential of the green zones can be calculated. However, due to the absence of data on the age of the plants and the difficulty in acquiring such information, the potential has instead been estimated using a general absorption factor for green zones in the city of Valencia, which is 1.58 tons of CO
2 per hectare per year [
47]. Based on this factor, the current CO
2 absorption capacity in the green areas of Benicalap is estimated to be 21.37 tons of CO
2 per year. This figure represents the contribution of Benicalap’s green zones to mitigating carbon emissions, emphasizing the importance of maintaining and expanding these areas as part of urban sustainability efforts.
Figure 7 shows the current green zone in Benicalap according to Geoportal of Valencia.
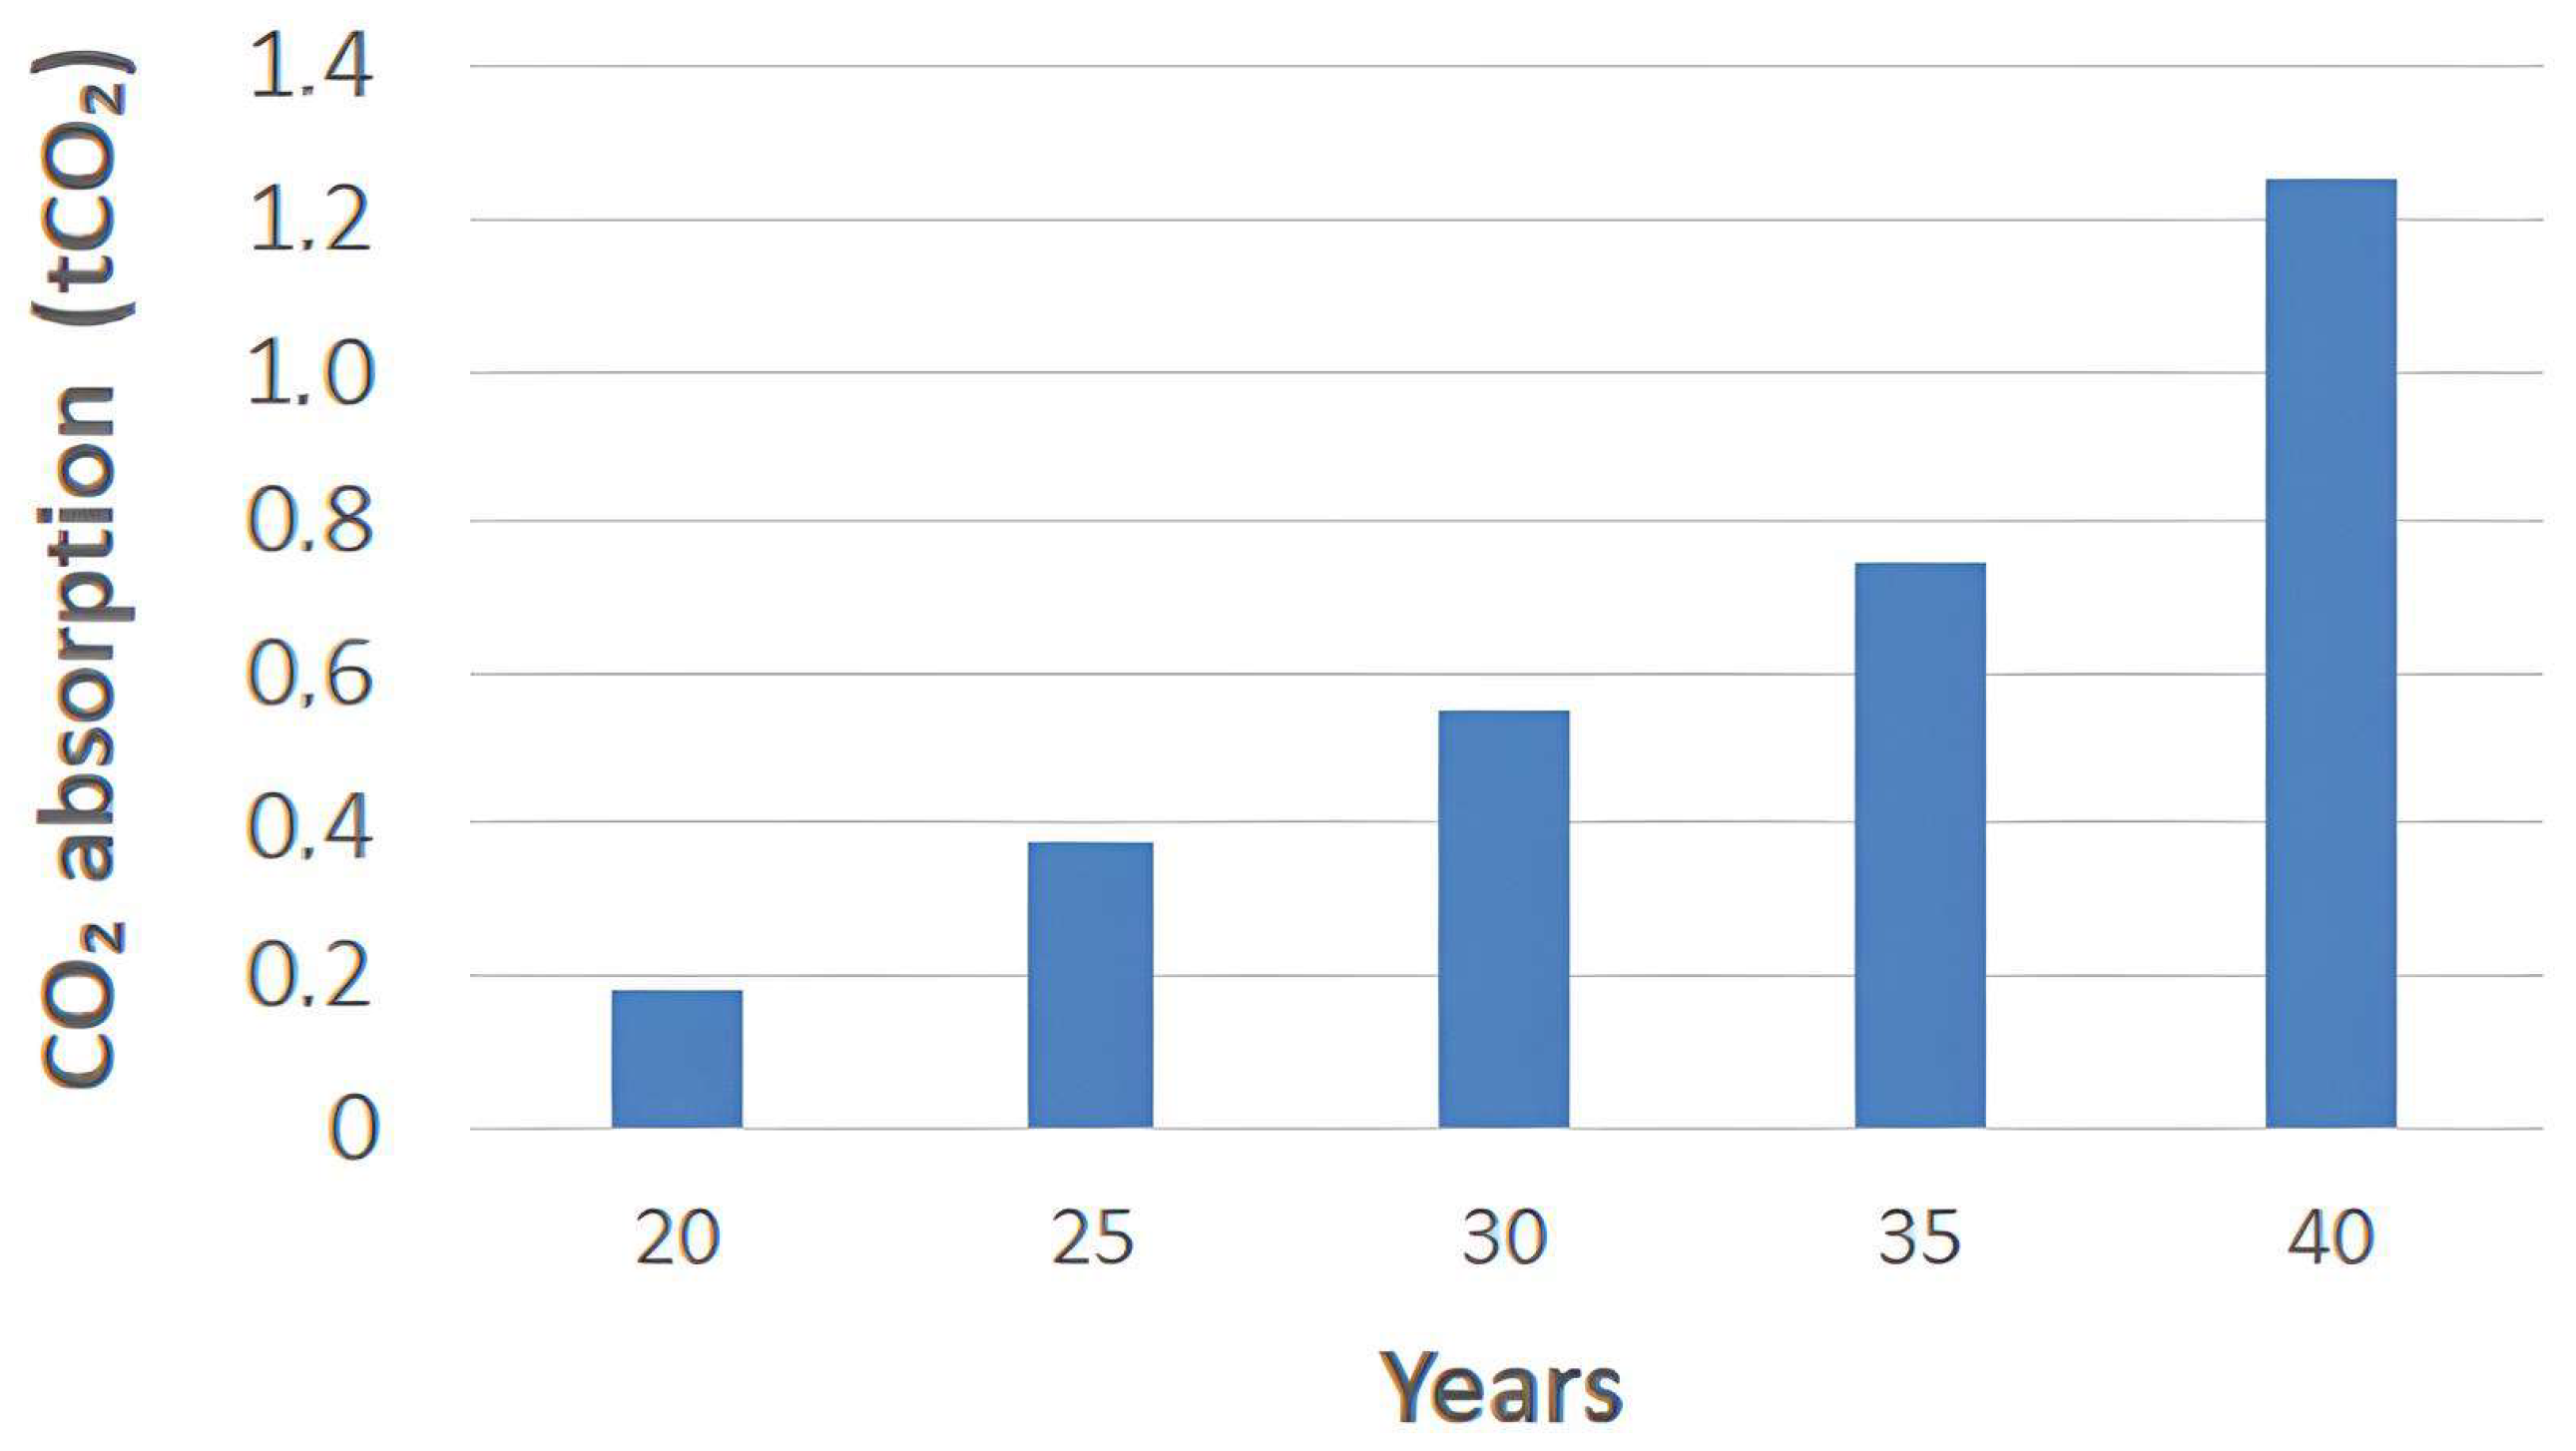
To assess the future CO
2 absorption potential of the green areas in Benicalap, it is essential to quantify two distinct concepts. First, an increase in CO
2 absorption is expected in the existing green zones over time, assuming that these areas are not expanded. This is because older trees have a higher CO
2 absorption capacity. As the trees mature, their absorption factor increases, leading to higher overall CO
2 sequestration by the existing vegetation. The data from [
47] were used to analyze the curve of accumulated absorption for common vegetation in the city of Valencia, as shown in
Figure 8. Using this curve, a tendential absorption curve was created for the green zones of Benicalap. This curve was adjusted by considering the percentage of each tree species in relation to the total tree population in Valencia. The data for the tendential curve come from a study by MITECO and the National Forest Inventory [
43]. Secondly, the potential for expanding green zones in Benicalap was evaluated. A total of 83,300 m
2 of land was identified as potential land for future green zones. However, due to limitations such as garden designs and the need to reserve space for other uses, like parking or future infrastructure, only 70% of this area can be developed as green zones. This means that the future green area in Benicalap is estimated to be 58,310 m
2. These estimates allow for a more comprehensive understanding of the potential for increased CO
2 absorption in Benicalap’s green zones, both from the maturation of existing vegetation and the expansion of green spaces in the area.
In Benicalap, 83,300 m2 has been identified as potential land for future green zones. However, due to constraints like garden designs and the need to reserve space for other uses, such as parking or future infrastructure, only 70% of this area can be developed as green spaces. This results in a future green area of approximately 58,310 m2. This calculation accounts for the land-use limitations and provides a more realistic estimate of the area that can be converted into green zones for environmental and urban sustainability improvements.
3. Results
Following the proposed methodology, the outcomes are presented and categorized by scope, corresponding to the suggested measures. The following sections explain the results:
3.1. Emission Inventory by Scope
This report presents the inventory analysis results in
Table 6, showing the total amount of greenhouse gas emissions in tCO
2 and the percentage of emissions contributed by each scope for each economic sector. The inventory analysis results indicate that most greenhouse gas emissions in the Benicalap neighborhood, accounting for 77% of the total emissions, arise from Scope 3 sources. This indicates that emissions from the value chain of the reporting entities are the most significant contributors to the overall greenhouse gas impact of the area. Scope 1 sources, such as the on-site combustion of fossil fuels, contribute 15% of the emissions, while Scope 3 sources, such as purchased electricity, account for 7.43%.
3.2. Carbon Neutrality Measures
The following sections show carbon neutrality measures, quantifying the potential reduction for every proposed action.
3.2.1. Nature-Based Solutions (NBS)
The same calculation process used for existing green zones was used to determine the CO2 absorbed in new green areas. However, since the new zones will contain younger vegetation, their age has been considered to be 3 years instead of the 15 years used for existing green areas. This adjustment acknowledges that younger vegetation absorbs CO2 slower than mature vegetation.
To ensure the effective implementation of this plan, the total surface area designated for the new green areas has been split into five phases of 20% each. The performance of each phase will occur annually, starting in 2024 and concluding in 2028. This phased approach will fully implement the new green areas according to the plan’s timeline. This approach allows for the proper establishment and growth of vegetation in each phase, allowing the new green areas to absorb CO2 effectively and provide other ecosystem services.
The mean value of CO
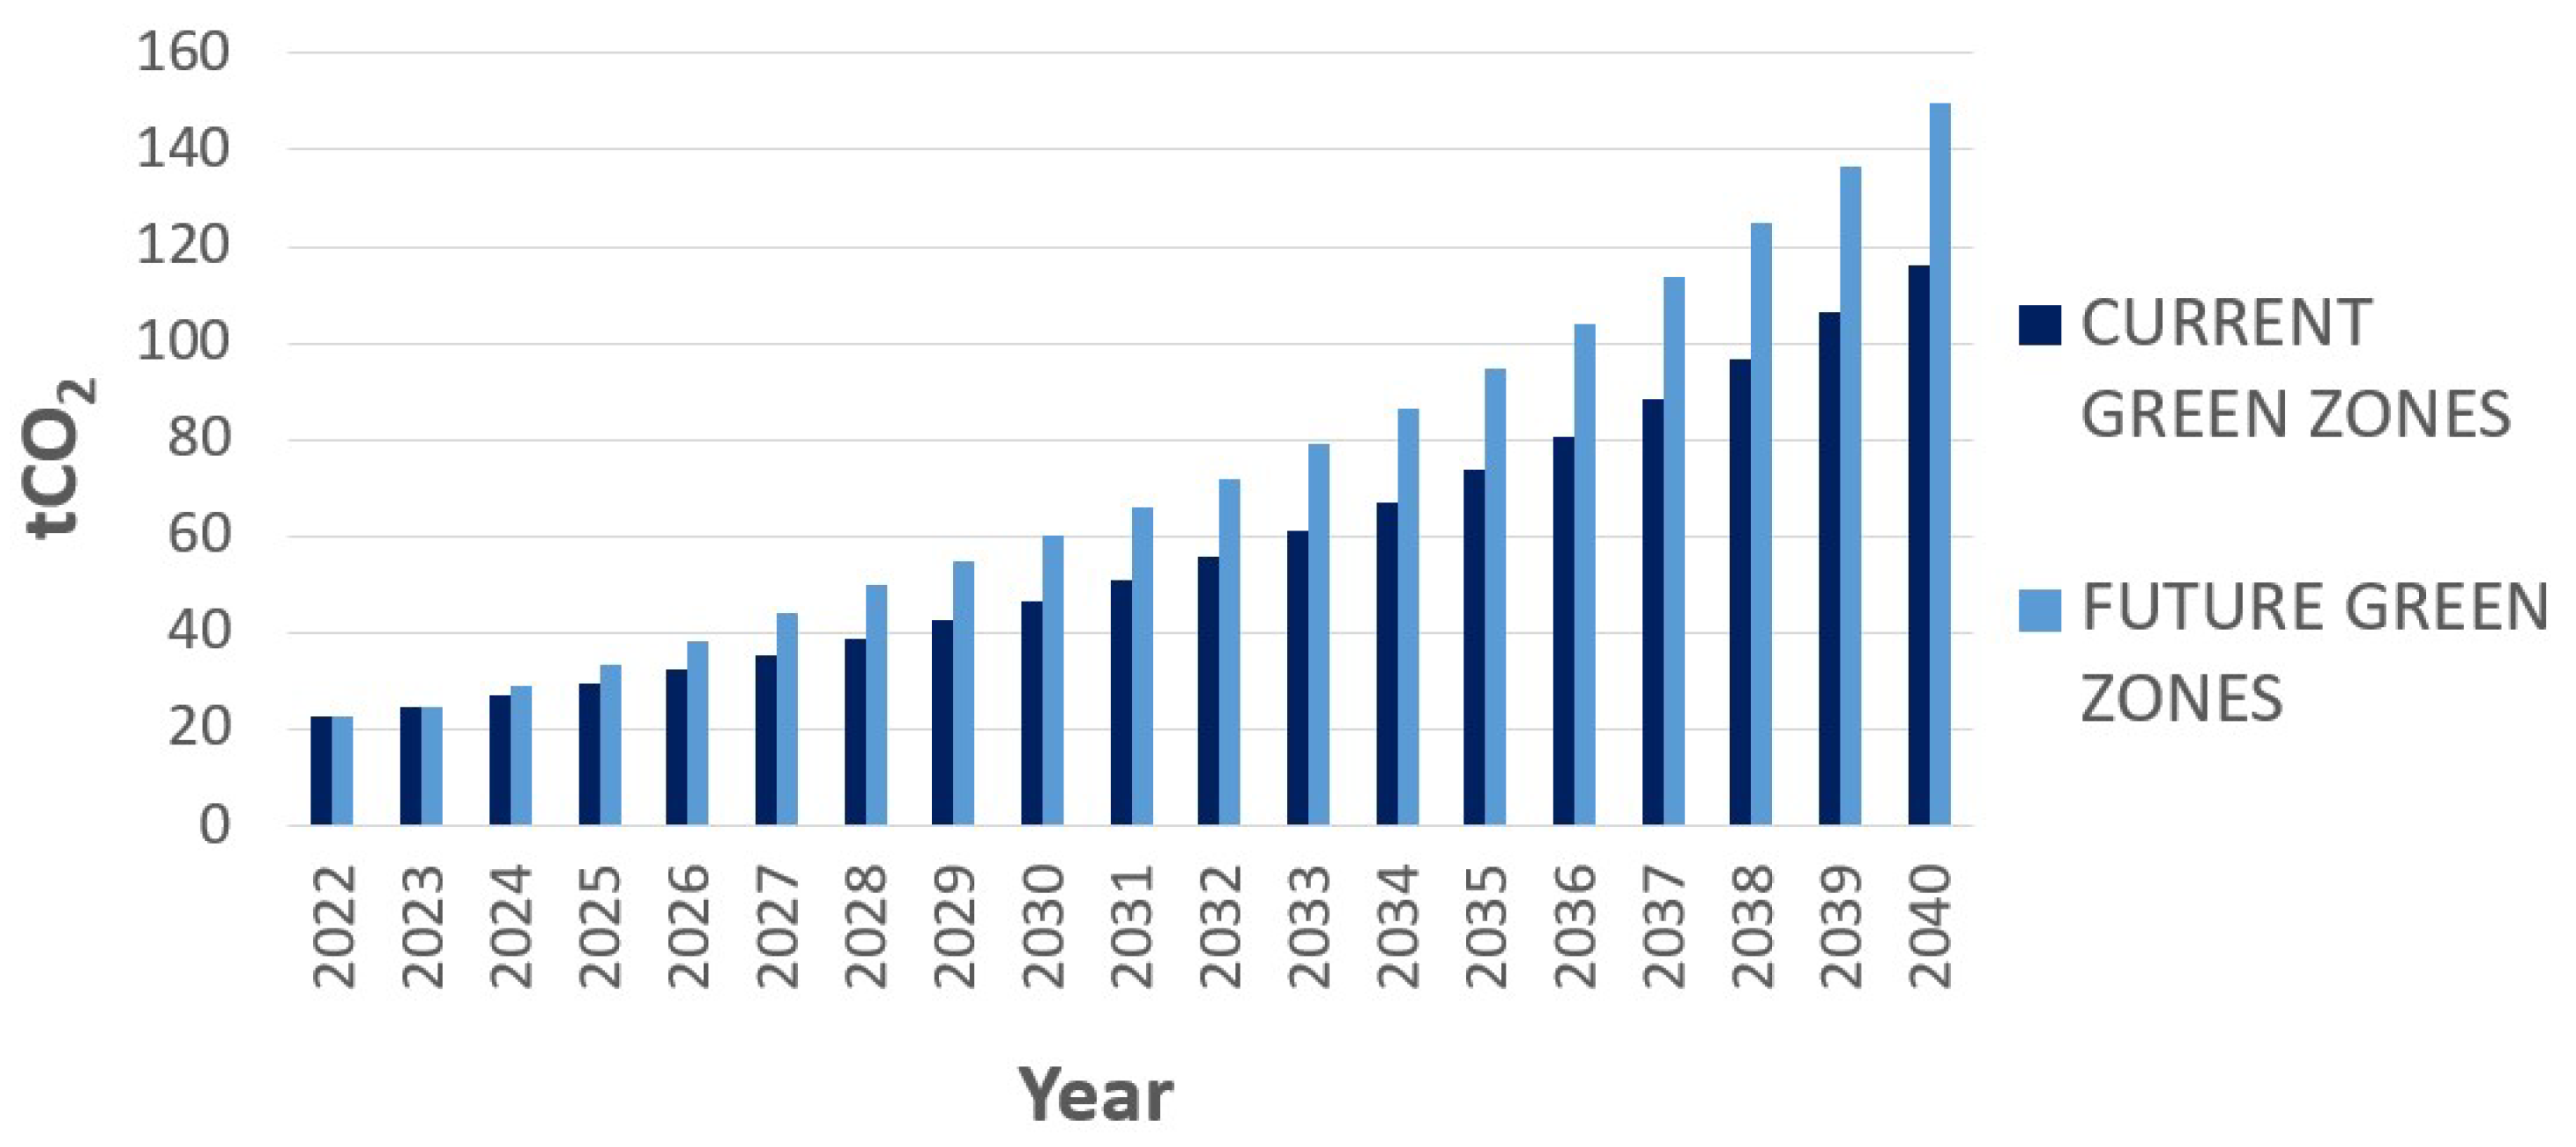
2 absorbed per year in Benicalap is 5.2 tCO
2/year, between 2.2 and 10.2 tCO
2/year. The current green zones and the planned green areas of Benicalap are graphed in
Figure 9. A comparison between the current and proposed zones of the accumulated CO
2 absorption is presented in
Figure 10.
3.2.2. PV Generation
The results of the simulations for Benicalap, which consider five different percentages of the useful area and two different inclinations of the panels, are shown in
Table 7.
According to the results, two filters were applied to select the best option for the green zone development in Benicalap. The first filter focused on the useful surface percentages. For Benicalap, two options were selected based on the simulation results, including a 38% useful surface area and two different inclinations: 15° and 35°. The second filter was based on higher photovoltaic (PV) production, comparing the payback periods for the selected options. These factors were considered to determine the most efficient and cost-effective option for integrating photovoltaic systems within the green zones. The details regarding PV production and capital costs can be found in the referenced data (
Table 8), which will provide further insights into the economic and energy efficiency of the proposed solutions.
After carefully considering all the available options, the most suitable choice for Benicalap is the solar panel installation with an inclination angle of 15°. Although the initial investment required for this option may be higher, it offers the highest total photovoltaic energy production. This option has been selected because a smaller inclination angle between the panels results in a shorter distance between the rows. This allows for more photovoltaic panels to be installed, resulting in higher energy production. While the initial costs may be greater, the long-term benefits of increased energy production make this option the most cost-effective choice. It also aligns with the neighborhood’s sustainability goals and reduces their carbon footprint. In conclusion, the 15° inclination angle option is the most effective and efficient choice for the Benicalap community. It maximizes the energy output of the installation while aligning with its sustainability goals, making it the best long-term solution.
3.2.3. Sustainable Transport
The proposed measures for transport improvement are explained below.
Electric vehicle measure: The data for the electric vehicles in Benicalap are calculated and detailed in
Table 9 [
48].
The penetration of electric vehicles (EVs) in cities involves replacing older, gasoline-powered vehicles with new electric ones. In the context of CO
2 emissions, the CO
2 emissions associated with electric transport are considered in this analysis. As part of this transition, the CO
2 emissions related to traditional vehicles are removed from the CO
2 inventory, assuming that removing old cars aligns directly with the penetration of new electric vehicles in a 1:1 ratio. This approach ensures that the analysis reflects the reduction in emissions due to the shift from fossil fuel-based transport to electric vehicles. Additionally, the changes in emissions related to public transport resulting from this transition are detailed in the referenced data (
Table 10), which accounts for the modification in emissions due to the adoption of electric vehicles in the city’s transportation system.
Electric bus measure: In
Table 11, future predictions for implementing electric buses in the Benicalap neighborhood are presented. Based on the kilometers traveled by public buses in the Benicalap neighborhood, the next emission values were obtained for combustion, hybrid, and electric buses, as detailed in
Table 12.
Increase the number of cycle paths: The Benicalap neighborhood has 133 ”Valenbisi” public bicycle system locking points. With a 50% proportion of bicycles per locking point, approximately 66 public bicycles are available in the neighborhood. Based on the area’s population, one bicycle is currently available for every 629 people in Benicalap. To promote active transportation and increase bicycle accessibility, the goal is to lower this ratio to 100 people per bicycle. This would require the addition of a further 284 bikes in the neighborhood. However, before implementing this plan, assessing the current cycling infrastructure in Benicalap, including the existing cycle paths and the potential for additional paths is essential. By analyzing this information, it will be possible to determine the most effective way to add more bicycles to the “Valenbisi” system in the neighborhood.
3.2.4. Public Lighting Emissions Savings
The CO
2 emissions savings resulting from installing LEDs in public lighting for 2025 and 2030 are included in the referenced data (
Table 13). These savings are calculated for two scenarios: Scenario 1: The emission factor for electricity remains the same as it is currently, meaning that the calculation assumes that the CO
2 emissions associated with electricity generation do not change over time. Scenario 2: The emission factors are adjusted based on the estimated electricity mix in 2030. This scenario accounts for the expected changes in the electricity grid, such as a greater proportion of renewable energy sources, which would reduce emissions. These scenarios allow for the comparison of the CO
2 savings resulting from the installation of LED lighting under different future conditions, considering both the current and projected changes in the electricity mix.
3.3. GHG Emission Reductions According to the Proposed Measures
Table 14 shows the potential emission reductions if the proposed measures are implemented, with PV generation and the transition to sustainable transport being the most important measures.
Figure 11 shows the emissions balance, considering the proposed measures for 2030.
3.4. Comparison to Similar Works
The comparative analysis of decarbonization strategies between La Carrasca and Benicalap reveals significant differences in the emission reduction achieved per inhabitant across both Scope 1 and Scope 2 measures (
Table 15). Each neighborhood’s distinct urban typologies and land-use profiles primarily drive these differences.
La Carrasca exhibits a higher potential for per capita emission reductions across all evaluated categories. This is particularly evident in deploying photovoltaic (PV) systems and electric vehicle (EV) strategies, where reductions reach up to 0.87 tCO2/inh and 0.65 tCO2/inh, respectively. These elevated values are attributed to two major universities (UPV and UV) within the neighborhood, which contribute disproportionately to electricity demand and institutional transportation needs. Consequently, mitigation measures targeting these large consumers will yield greater per capita impacts.
In contrast, Benicalap, a densely populated residential district with nearly 12 times the population of La Carrasca, demonstrates a more distributed but less intense emissions profile. Despite achieving a higher absolute reduction (19,885 tCO2 compared to 7488 tCO2), its per capita reductions remain lower due to the diffused nature of its energy and transport demands. For instance, PV deployment in Benicalap achieves only 0.119 tCO2/inh, reflecting limited rooftop availability and lower energy intensity per household.
Nature-based solutions (NBS) show minimal per capita impact in both neighborhoods, with values falling below 0.11 tCO2/inh. However, the disparity is especially notable in Benicalap (0.0021 tCO2/inh), where dense urbanization constrains the expansion of green infrastructure. Conversely, La Carrasca benefits from available open institutional land, allowing for the inclusion of new vegetated areas and associated carbon sequestration potential.
Energy efficiency measures, including building retrofits and public lighting upgrades, also result in higher per capita savings in La Carrasca (~0.54 tCO2/inh) than in Benicalap (~0.236 tCO2/inh). Again, this result is driven by the high baseline energy consumption in university and service-sector buildings concentrated in La Carrasca, which magnifies the effect of retrofit interventions.
These findings highlight the importance of contextualizing decarbonization strategies to local conditions. Institutional energy users in smaller populations can skew per capita outcomes, while larger residential areas may require broader, more systemic interventions to achieve similar decarbonization levels. These insights support the need for tailored urban climate action plans that recognize the heterogeneity of neighborhood energy profiles and leverage site-specific opportunities for carbon mitigation.
4. Conclusions
Cities worldwide face the challenge of mitigating the effects of climate change. In this context, cities must change their planning to adapt to climate change challenges by means of new urban sustainable plans, new policies, innovation actions, and technological projects or initiatives focused in their decarbonization process. This research presents a methodology for determining the greenhouse gas emissions inventory for Benicalap, a neighborhood located in the Mediterranean compact city of Valencia (Spain). It proposes measures to decarbonize the neighborhood and therefore reduce the city’s carbon footprint.
The GHG emissions inventory for Benicalap reveals that the consumption of goods is the primary source of CO2 emissions, followed by private transport and electricity consumption. Therefore, PV generation and sustainable transport measures are crucial for reducing CO2 emissions. For instance, the electrification of vehicles can significantly reduce emissions associated with private transport, while PV generation can reduce electricity consumption from non-renewable sources.
Based on the initial GHG inventory, four measures have been proposed to decarbonize the Benicalap neighborhood: nature-based solutions (NBS), photovoltaic (PV) generation, sustainable transport, and efficiency in public lighting. Upon analyzing the potential of each measure, PV generation emerges as the highest contributor to CO2 emission reduction, followed by sustainable transport and the electrification of vehicles. These measures are expected to significantly reduce emissions in the neighborhood.
In contrast, the actions focused on efficiency in public lighting and nature-based solutions (NBS) have a relatively low impact, contributing less than a 1% reduction in overall emissions. Considering the global impact by 2030, the total CO2 emission reduction in Benicalap is estimated at approximately 50.7% compared to the initial emissions from Scopes 1 and 2. While this is a substantial reduction, it is not enough to achieve a carbon neutral neighborhood, indicating the need for additional measures or strategies to reduce emissions further and reach carbon neutrality.
However, the proposed measures for reducing emissions focus on Scopes 1 and 2, and it is essential to address Scope 3 emissions to mitigate the overall greenhouse gas impact of the neighborhood effectively. Scope 3 emissions are indirect emissions that result from the activities of the neighborhood but occur outside its boundaries. As identified in the GHG inventory, the consumption of goods and services is the main source of Scope 3 emissions. Although it is difficult to quantify the effect of measures related to Scope 3 emissions due to the difficulty associated with obtaining reliable information, people’s behavior is vital in reducing such emissions. Therefore, future research should focus on developing measures to reduce emissions in Scope 3. Awareness campaigns, education, and incentives can encourage individuals to adopt more sustainable lifestyles and reduce their carbon footprint in the neighborhood. Additionally, improvements in the production process of the products responsible for CO2 emissions can reduce emissions in Scope 3. For example, improving the efficiency of production processes or implementing renewable energy in electricity production can help reduce emissions.
This study has some limitations that affect the accuracy and comprehensiveness of the carbon footprint assessment. One of the main constraints is the limited availability of reliable localized data at the neighborhood and district levels, necessitating estimations, assumptions, and data from other cities or broader geographic scales. This reliance on mixed methodologies, combining bottom-up and top-down approaches, may introduce uncertainties in the results. Additionally, in some cases, the methodology developed assumes a fixed annual emissions balance and does not account for temporal variations or the real-time monitoring of activities. Some emission factors are based on standard databases rather than direct measurements, which may not fully reflect local conditions. These limitations highlight the need for improved data collection systems and more granular, geolocated information to enhance the precision and applicability of future urban decarbonization strategies.
Regarding its replicability, although the methodology proposed in this study is designed to be flexible and applicable to various urban realities, its practical use is limited by several challenges. One of the main obstacles is the scarcity of detailed and localized data, particularly at the neighborhood level. While the model could be adapted to other cities, its success depends on the availability of disaggregated information on key sectors such as energy, mobility, and waste. Applying this framework would likely be more straightforward in urban areas with more advanced digital infrastructures. However, in contexts in which data are limited or fragmented, additional efforts would be needed to ensure the robustness of the outcomes.


 ,
, 


