Abstract
Flood hazards caused by intense short-term precipitation have led to significant social and economic losses and pose serious threats to human life and property. Accurate disaster risk assessment plays a critical role in verifying disaster statistics and supporting disaster recovery and reconstruction processes. In this study, a novel Large-Scale Flood Risk Assessment Model (LS-FRAM) is proposed, incorporating the dimensions of hazard, exposure, vulnerability, and coping capacity. Multi-source heterogeneous data are utilized for evaluating the flood risks. Soil erosion modeling is incorporated into the assessment framework to better understand the interactions between flood intensity and land surface degradation. An index system comprising 12 secondary indicators is constructed and screened using Pearson correlation analysis to minimize redundancy. Subsequently, the Analytic Hierarchy Process (AHP) is utilized to determine the weights of the primary-level indicators, while the entropy weight method, Fuzzy Analytic Hierarchy Process (FAHP), and an integrated weighting approach are combined to calculate the weights of the secondary-level indicators. This model addresses the complexity of large-scale flood risk assessment and management by incorporating multiple perspectives and leveraging diverse data sources. The experimental results demonstrate that the flood risk assessment model, utilizing multi-source data, achieves an overall accuracy of 88.49%. Specifically, the proportions of areas classified as high and very high flood risk are 54.11% in Henan, 31.74% in Shaanxi, and 18.2% in Shanxi. These results provide valuable scientific support for enhancing flood control, disaster relief capabilities, and risk management in the middle and lower reaches of the Yellow River. Furthermore, they can furnish the necessary data support for post-disaster reconstruction efforts in impacted areas.
1. Introduction
In recent years, extreme climate events have exhibited a new trend of increased frequency and intensity. Short-term rainstorm floods caused by meteorological factors, such as extreme precipitation and typhoons, have increased to varying degrees, posing serious threats to people’s property and safety. According to the “2022 Global Assessment Report on Disaster Risk Reduction” [1] published by the United Nations Office for Disaster Risk Reduction, global natural disasters were complex in 2022, with 60 major floods accounting for 48% of the total frequency of natural disasters. According to the “Climate Conditions of Asia 2023” [2] report released by the World Meteorological Organization (WMO), Asia is the most disaster-prone region in the world, with over 80% of disasters related to flood and storm events, which cause the highest number of casualties and economic losses. According to the 2024 statistical data [3], heavy rainfall and flooding events were widespread globally in 2024. Between April and May alone, catastrophic rainfall occurred in regions such as South China, the United Arab Emirates and Oman, Central Asia, southern Brazil, East Africa, and South Asia. Notably, extreme rainfall events were observed in typically arid areas such as Dubai and the Taklamakan Desert, highlighting the increasingly unpredictable nature of hydrometeorological hazards. These developments underscore the growing complexity of flood formation mechanisms and the challenges posed by the short lead times available for effective flood forecasting and emergency response. Given the frequent occurrence of rainstorm-induced flood disasters, timely and accurate assessment of flood-affected areas is critical for disaster verification, emergency management, and post-disaster recovery. In this context, the integration of multi-source data has emerged as a crucial technical approach for large-scale disaster analysis, supporting both immediate emergency response and long-term disaster risk reduction efforts. Furthermore, precise flood risk assessment not only enhances emergency response efficiency but also provides a scientific foundation for recovery planning and resource allocation.
Recent advancements in data-driven flood risk mapping frameworks have demonstrated the feasibility of large-scale applications. Waleed et al. [4] developed a national-scale flood susceptibility model for Pakistan based on XGBoost and LightGBM algorithms, highlighting the scalability of machine learning methods for flood risk assessments. Similarly, Zhao et al. [5] integrated the hydrodynamic model (HiPIMS) with land use scenarios in the Luan River Basin, China, revealing that urban expansion increased flood risk by 15%. While these approaches have advanced risk mapping capabilities, limitations persist, particularly in addressing multi-dimensional risk factors.
In addition to these challenges, soil erosion—a critical process influencing surface hydrology and flood generation—has yet to be fully integrated into large-scale flood risk assessments. Soil erosion alters infiltration rates, increases surface runoff, and exacerbates sediment transport, thereby significantly affecting the intensity, duration, and spatial extent of flood events [6,7,8,9]. Previous studies [10,11,12,13] have demonstrated that soil erosion models effectively reflect hydrological changes, particularly in regions characterized by high precipitation and limited soil conservation measures. However, the integration of soil erosion dynamics into comprehensive flood risk frameworks remains limited.
The theoretical foundations for disaster risk assessment emphasize a holistic view of risk components. The Intergovernmental Panel on Climate Change (IPCC) Sixth Assessment Report (AR6) [14,15] and the Sendai Framework for Disaster Risk Reduction 2015–2030 [16] define disaster risk as the product of hazard, exposure, and vulnerability, with each element influenced by climatic and anthropogenic factors. Despite these theoretical advances, operationalizing a comprehensive multi-dimensional risk assessment framework remains a major research challenge.
Assessment methodologies have evolved from qualitative, expert-driven approaches to more quantitative, integrated methods. Traditional expert judgment methods [17] offered simplicity but suffered from subjectivity and data limitations. Probabilistic Risk Assessment (PRA) techniques [18,19] have since quantified disaster probabilities and consequences based on historical datasets; however, their effectiveness is constrained by data incompleteness and inability to predict unprecedented extreme events [20,21,22]. Recent years have witnessed a shift towards semi-quantitative and integrated approaches [23,24,25], including risk matrix methods [26,27,28,29], the Analytic Hierarchy Process (AHP) [30,31,32], and Geographic Information Systems (GIS)-based assessments [33,34,35,36], providing enhanced spatial and dynamic analysis capabilities. Nonetheless, single-method approaches often fall short in capturing the inherent complexity of disaster risks, thus promoting the rise in integrated frameworks such as multi-criteria decision analysis (MCDA) [37,38,39,40,41].
In conclusion, based on the aforementioned research background, this paper proposes a new large-scale flood disaster risk assessment framework (LS-FRAM), aimed at enhancing the accuracy of flood risk assessment in the Loess Plateau region by integrating multi-source heterogeneous remote sensing data and soil erosion models. The framework combines the Analytic Hierarchy Process (AHP) with the entropy weight method and Fuzzy Analytic Hierarchy Process (FAHP), considering multiple evaluation criteria and scientifically calculating the weight of each indicator. This allows for a comprehensive evaluation of the complex impacts of large-scale flood disasters. The contributions of this study are twofold:
- (1)
- It constructs a large-scale flood disaster risk assessment framework based on multi-source heterogeneous data, covering natural, social, and economic dimensions, and proposes a risk indicator system for large-scale rainstorm-type floods suitable for the Loess Plateau region.
- (2)
- It introduces a new flood risk assessment model (LS-FRAM) that systematically combines soil erosion models with multi-criteria decision analysis, enabling a more detailed analysis of the geographic factors influencing flood occurrence and their feedback mechanisms with soil loss, thereby improving the accuracy of disaster prediction and assessment.
2. Study Area and Multi-Source Data
The Yellow River originates from the Bayan Kara Mountains on the Qinghai–Tibet Plateau, traversing nine provinces and regions, namely Qinghai, Sichuan, Inner Mongolia, Henan, Shaanxi, and Shanxi, before ultimately reaching the Bohai Sea. The main stream spans approximately 5464 km in length and covers a drainage basin area of approximately 752,000 km2. This study focuses on the middle and lower reaches of Henan, Shaanxi, and Shanxi as the primary research areas. The region’s landscape is characterized by plateaus, plains, and mountains. The Loess Plateau experiences significant soil erosion and flooding in its middle reaches due to the loose soil and sparse vegetation coverage. This is exacerbated during heavy rainstorms, leading to the transportation of substantial sediment. The sediment accumulation downstream has reached a critical level, leading to a gradual reduction in the flood discharge capacity of the river channel, resulting in the formation of an elevated riverbed. The damages resulting from floods are more severe. The middle and lower reaches are characterized by a temperate monsoon climate, which is often accompanied by frequent meteorological disasters. During the summer season, numerous rainstorms occur, primarily concentrated within the flood season. This region is among the areas in China that are most severely impacted by floods. Therefore, performing a flood risk analysis of the area holds significant reference value for enhancing future emergency and governance measures. The specific geographical location overview is depicted in Figure 1.
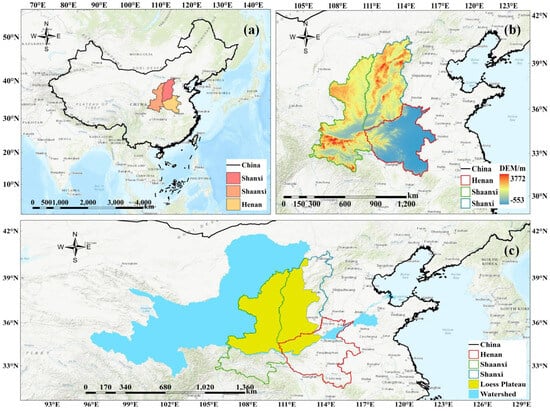
Figure 1.
Schematic of study area in middle and lower reaches of Yellow River: (a) regional map of China; (b) study area; and (c) Yellow River Basin and Loess Plateau region.
This study examines disaster causation factors and disaster-prone environments in the middle and lower reaches of the Yellow River. Utilizing a variety of data sources and considering geographical features, population distribution, economic conditions, and other relevant factors, the research integrates 19 data sources. Therein, slope, slope length, rainfall erosivity, soil erodibility, cover and management factors, and soil and water conservation measure factors are used to calculate the soil erosion modulus. Therefore, the experimental required 14 original indicators including metrics such as the rainstorm days, flood season precipitation, precipitation variability, soil erosion modulus, elevation variation coefficient (ECV), relief amplitude, impervious areas, drainage density, population density, GDP density, cultivated land, emergency shelter, medical institution, and road network density. The particular origins and circumstances of their data are delineated in Table 1.

Table 1.
Data resources and indicators for flood risk assessment.
3. Methodology
This paper proposes a large-scale flood disaster risk assessment framework (LS-FRAM), which enhances the accuracy of flood risk assessment in the Loess Plateau region. This framework comes from four dimensions: hazard, exposure, vulnerability, and coping capacity. Multi-source heterogeneous data are integrated to achieve comprehensive risk assessment. Key indicators are selected through Pearson correlation analysis, resulting in the identification of 12 secondary-level indicators. Based on this, the AHP is utilized to determine the weights of the primary-level indicators, while the entropy weight method, FAHP, and an integrated weighting approach are combined to calculate the weights of the secondary-level indicators. The technical process is shown in Figure 2.
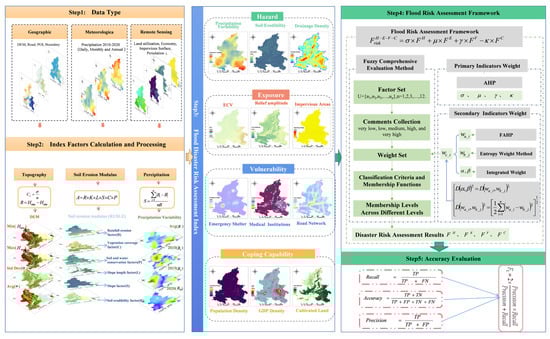
Figure 2.
Large-scale flood risk assessment flow.
The large-scale flood disaster risk assessment framework developed in this study is constructed based on four key dimensions: hazard, exposure, vulnerability, and coping capacity, incorporating a total of 14 secondary indicators. Following a Pearson correlation analysis, two indicators exhibiting high correlation with the number of heavy rain days and flood season precipitation were excluded to reduce redundancy. Consequently, 12 secondary indicators were ultimately selected for analysis, as illustrated in Figure 3. Specifically, the hazard dimension includes annual precipitation variability, degree of soil erosion, and river network density. The exposure dimension comprises elevation variation coefficient, terrain ruggedness, and impervious surface proportion. The vulnerability dimension involves population density, GDP density, and proportion of arable land. Finally, the coping capacity dimension encompasses the number of medical institutions, the number of emergency shelters, and road network density. Given that the selected indicators are expressed in different units, dimensionless normalization was performed to eliminate the effects of varying scales and to achieve uniformity across all indicators. Through this process, a comprehensive and standardized framework for large-scale flood disaster risk assessment was established.
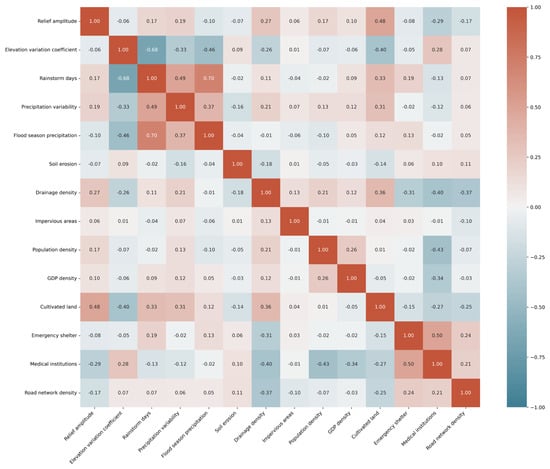
Figure 3.
Pearson analysis results of large-scale flood disaster risk assessment indicators.
3.1. Large-Scale Flood Disaster Risk Assessment Framework
The United Nations International Strategy for Disaster Reduction (UNISDR) defines risk as the potential loss of life or property that a social system may encounter during a specific period. By combining the definition of risk in the Sendai Framework [8] and the expression of natural disaster risk, a risk assessment model for rainstorm-induced flood disasters has been established. To better reflect the overall characteristics of the indicators, weights are introduced into the model, completing the analysis of the risk in the study area. The mathematical expression is shown in Equation (1).
where is the flood risk result, is the hazard result, is the exposure result, is the vulnerability result, is the coping capacity result. and are the primary-level indicator weights, respectively. , and represent the evaluation results for hazard, exposure, vulnerability, and coping capacity, respectively, obtained using the fuzzy comprehensive evaluation method. The computation methods for , and are consistent with that of as illustrated in Equation (20). In the fuzzy comprehensive evaluation framework, indicator weights correspond to the secondary-level indicator weights within the risk assessment model. The weights of the secondary indicators were determined using a combination of the FAHP, the entropy weight method, and the integrated weighting approach.
- (1)
- Hazard
The hazard is primarily considered from two aspects: precipitation and soil erosion. Ultimately, three indicators were selected: precipitation variability, soil erosion modulus, and river network density. Therein, soil erosion is the phenomenon characterized by the degradation, removal, transportation, and deposition of soil and its parent material due to external forces such as water, wind, freezing-thawing cycles, or gravity. Soil erosion exacerbates flood disasters by increasing surface runoff, causing river channel sedimentation, elevating flood sediment content, and weakening ecological buffering capacity. The soil erosion modulus calculation is derived from the revised universal soil loss equation (RUSLE) [48,49,50,51], with its specific mathematical representation presented in Equation (2):
where A is the soil erosion modulus, in t/(hm2·a); RA is the rainfall erosivity factor, in MJ·mm/(hm2·h·a); K is the soil erodibility factor, in t·hm2·h(hm2 MJ·mm); L is the slope length factor; S is the slope factor; C is the vegetation coverage factor; and P is the factors of soil and water conservation measures.
In addition, extreme precipitation is also a major cause of rainstorm-induced flooding. As precipitation increases, the risk of flooding also rises. Therefore, daily, monthly, and annual rainfall data were selected to calculate the number of rainstorm days from 2010 to 2020, the total rainfall during the flood season (June–September), and annual precipitation variability. Pearson correlation analysis showed a strong correlation between the number of rainstorm days and flood season precipitation. Ultimately, precipitation variability was chosen as the precipitation-related factor for analysis. The term “precipitation variability” denotes the potential range of fluctuations or oscillations in precipitation occurrences. A higher degree of variability indicates a greater likelihood of abnormal precipitation events transpiring [52]. In this study, merge and convert the daily precipitation data obtained from NOAA meteorological stations by employing the inverse distance weighting (IDW) method for interpolation.
- (2)
- Exposure
Exposure refers to the probability of a population, socio-economic factors, and infrastructure being exposed to flooding during a disaster. In this study, exposure is assessed using evaluation factors selected from both natural and social disaster-prone environments, including the coefficient of variation in elevation, topographic relief, and impervious surfaces. During extreme rainfall events, a large amount of surface runoff is generated, and the poor or nonexistent water infiltration capacity of impervious surfaces is one of the main causes of large-scale flooding.
- (3)
- Vulnerability
Vulnerability reflects the degree to which a region is adversely affected by flood disasters and its ability to mitigate their impacts, making it an important factor in assessing regional climate change adaptation. Vulnerability is influenced by factors such as population, economy, and environment. Therefore, three indicators—population density, GDP density, and the proportion of cultivated land—were selected as vulnerability factors.
- (4)
- Coping capacity
Coping capacity refers to a region’s ability to respond to disasters, which consists of pre-disaster prediction, emergency response during the disaster, and post-disaster recovery. The evaluation of disaster coping capacity is conducted from three aspects: emergency sheltering, transportation, and medical services. A well-developed transportation network and comprehensive emergency facilities can ensure effective evacuation and timely disaster avoidance. POI data are primarily obtained from the A map (Gaode) Open Platform and converted into batches using iterative tools in GIS. After conversion, kernel density analysis in spatial analysis is applied. Kernel density analysis utilizes a kernel function to calculate the value per unit area based on point or polyline features, fitting individual points or polylines into a smooth conical surface to compute the density of point features surrounding each output raster cell.
3.2. Determining the Indicator Weights for Large-Scale Flood Disaster Risk Assessment
In this paper, AHP is employed to compute the primary-level weights of flood risk factors [53]. Additionally, FAHP and the entropy weight method are utilized to ascertain the secondary-level weights [54,55]. The study employs a combination of subjective and objective weighting methods. This approach addresses the limitations of using a single AHP to assess the consistency of the judgment matrix and mitigates the errors commonly associated with separate subjective and objective weighting methods.
(1) The specific steps for determining the weights of the primary-level indicators using the AHP are as follows:
First, a hierarchical structure is established. Second, a pairwise comparison matrix is constructed by using a scale of 1–9 and their reciprocals to quantify the relative importance between each pair of elements. Third, the subjective weights of the indicators are calculated. Fourth, a consistency check is performed. If the consistency ratio (CR) is less than 0.1, the matrix is considered to have acceptable consistency; if CR ≥ 0.1, the consistency of the judgment matrix is deemed unsatisfactory and needs to be revised and re-evaluated.
(2) The specific steps of FAHP are outlined as follows:
(a) The scale was determined to develop a fuzzy judgment matrix, and the 0.1–0.9 scaling method was used to compare and establish a fuzzy judgment matrix pairwise rij, where rij is the importance of the i-th element relative to the j-th element within the fuzzy logic framework.
(b) The fuzzy judgment matrix was normalized to calculate the eigenvectors, eigenvalues, and weights of the matrix. For the determination of the weights, the least squares method was used through Equation (3),
where n is the number of indicators, i.e., the dimension of the matrix. a is a tuning parameter introduced in the least squares method to balance the error term. Where , Wa_i represents the weight of the secondary indicator calculated using the Fuzzy Analytic Hierarchy Process (FAHP).
(c) A positive complementary matrix was converted to a positive reciprocal matrix, and the consistency ratio (CR) values were used for the consistency check analysis. CR < 0.1 indicates completion of the consistency check, while CR < 0.1 indicates failure. The consistency indicator (CI) was calculated through Equation (4):
where λmax is the maximum eigenvalue, n is the total number of indicators. RaiWa_i is the difference between the product of the judgment matrix and the weight vector, i is the index of different indicator factors.
The analysis indicates a positive correlation between the value and the error, suggesting that as the error increases, so does its magnitude. Therefore, in the process of inspection, the random CR calculation Equation (5) is utilized, with the necessary values being acquired through reference to Table 2 for random consistency.In Table 2, t represents the order of the judgment matrix. When the random CR falls below 0.1, the calculated hierarchical ranking weights are accurate and justifiable. Otherwise, the judgment matrix must be recalibrated until it meets the required standards.
Table 2.
Random CRs.
The specific process of the entropy weight method is given as follows:
Data standardization processing involves the selection of the forward normalization Equation (6) for positive indicators and the backward normalization Equation (7) for negative indicators.
where Mij and Nij are the values of the indicators after forward and backward normalization, respectively. Mij and Nij represent the normalized values of the j-th indicator of the i-th sample after positive and negative normalization, respectively. Xij is the original value of the j-th indicator for the i-th sample, where j = 1, 2, 3, …, n. Xmax and Xmin represent the maximum and minimum values among the n indicators, respectively.
The proportion of the j indicator value in sample i was calculated through Equation (8):
where m is the number of samples participating in the evaluation. Xij is the original value of the j-th indicator for the i-th sample, while Yij is the proportion of the j-th indicator value in the i-th sample.
The indicator information entropy was calculated according to Equation (9).
where gj is the entropy value of the j-th indicator, with a range of [0, 1]. Yij is the proportion of the j-th indicator value for the i-th sample, and m is the total number of samples.
The information entropy redundancy was obtained according to Equation (10), and qj represents the entropy redundancy of the j-th indicator.
The indicator weights were calculated through Equation (11):
where n is the number of indicators, and Wb_j is the weight of the j-th secondary indicator obtained through the entropy weight method. qj is the entropy redundancy of the j-th indicator.
The single indicator evaluation score was determined using Equation (12), and Sj is the evaluation score of the j-th indicator.
The combination weights can be obtained based on the calculation of the subjective and objective weights. The concept of a distance function is introduced to mitigate the impact of significant fluctuations in the data. The equation for calculating the integrated weight is presented using Equation (13):
where α and β are the allocation coefficients, the sum of α and β is equal to 1. wa_i and wb_i represent the subjective and objective weights, respectively. wc_i denotes the combined weight calculated based on both subjective and objective weights using a distance function. The results of this calculation are presented in the “integrated weight” column of Table 3.
Table 3.
Weights and attributes of indicators in flood risk evaluation.
The difference between subjective and objective weights is represented by a distance function as shown in Equation (14):
Accordingly, using the sample point data as input, the calculated weights of the primary-level and secondary-level indicators in this study are presented in Table 3.
3.3. Fuzzy Comprehensive Evaluation of Large-Scale Flood Disaster Risk
Fuzzy comprehensive evaluation is a method based on fuzzy mathematics that utilizes the principle of fuzzy relation synthesis to quantify factors that are unclear and difficult to quantify, followed by a comprehensive evaluation [56,57,58]. There is a lack of a standardized and specific measurement criterion for defining and assessing flood risks, characterized by significant fuzziness. Therefore, the fuzzy comprehensive evaluation method is widely used in risk assessment. The specific evaluation process is outlined as follows:
- (1)
- Factor set: Based on the evaluation system established previously, the factor set was determined, and the second category indicators were used as the factor set U = {u1, u2, u3, …, un}, n = 1, 2, 3, …, 12.
- (2)
- Comments collection: The assessment of risk levels was generally divided into 5 categories: very low, low, medium, high, and very high.
- (3)
- Weight set: The weight set used to assess the risk based on the weights calculated in the preceding section was determined as . The weight set for vulnerability, exposure, and coping capacity was calculated as . Where represents the set of secondary indicator weight vectors corresponding to hazard, exposure, vulnerability, and coping capacity, respectively.
- (4)
- Classification criteria and membership functions: The natural discontinuity method was employed to classify the normalized data. The expression of the membership function is given through Equations (15)–(19). Where un is the evaluation set constructed by the secondary indicators, where n is the secondary indicators. unvl refers to the membership degree of the n-th secondary indicator to the evaluation set v1, l = 1, 2, …, 5. Before calculating the membership degree, the dataset of each secondary indicator must be divided by the discontinuity points ei (i = 1, 2, …, 5), which serve as the defining points for the five membership degree levels. The membership function can be expressed as follows:
- ①
- v1 can be determined as follows:
- ②
- v2 can be computed as follows:
- ③
- v3 can be obtained as follows:
- ④
- v4 can be calculated as follows:
- ⑤
- v5 can be achieved as follows:
- (5)
- Membership levels across different levels: The established membership function was implemented using the Con function in the grid calculator, determining 5 membership levels based on the specified level discontinuity points. The evaluation level was determined through the principle of maximum membership degree. The different membership levels of hazard, exposure, vulnerability, and coping capacity layers can be calculated using Equation (20).
- (6)
- Disaster risk assessment results: Based on the fuzzy matrix calculation and membership degree layer analysis, the evaluation result matrix for the 4 primary indicators, namely hazard, exposure, vulnerability, and coping capacity, has been derived. The grid layer containing 4 primary indicator factors and 5 levels of membership degrees, along with the weight of the primary indicator, is fully determined by applying Equation (1) to finalize the calculation of the risk of rainstorm-induced flood disasters.
4. Experimental Results and Analysis
4.1. Index Weight Calculation and Risk Classification
Using AHP for determining the weights of primary indicators requires the classification of normalized secondary indicators to establish a membership function for fuzzy comprehensive evaluation. The specific calculation results are presented as follows:
- (1)
- The risk assessment in this model framework involves the weighted multiplication of hazard, exposure, vulnerability, and coping capacity. In Equation (1), are the weights of the primary indicators, determined through AHP. The specific calculation results are shown in Table 4.
Table 4. AHP analysis results for flood risk evaluation.
- (2)
- The normalized data for classification criteria and membership functions were classified using the natural discontinuity method, and the classification values are detailed in Table 5.
Table 5. Normalized grid grading point values for flood risk indicators.
4.2. Extraction of Indicator Layer Elements and Comprehensive Calculation Results
The middle and lower reaches of the Yellow River flow through the Loess Plateau area, and the soil erosion is serious, which can easily cause sediment deposition on the ground during the flood season. Therefore, the model indicating the degree of soil and water erosion, namely the soil erosion mode, is added to the risk. The results are shown in Figure 4.
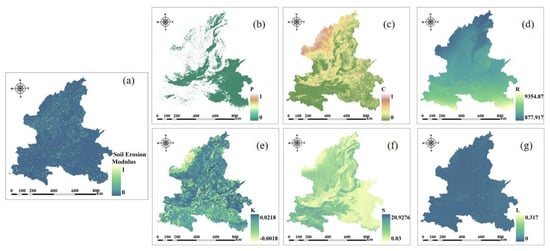
Figure 4.
Visualization results of soil erosion modulus calculation with (a) normalized soil erosion modulus; (b) soil and water conservation factors; (c) vegetation coverage factor; (d) rainfall erosion factor; (e) soil erodibility factor; (f) slope factor; and (g) slope length factor.
According to the theory of fuzzy comprehensive evaluation, 12 secondary indicators were processed and analyzed utilizing GeoScenePro 4.0 software. The results of the kernel density analysis are depicted in Figure 5j,k, while the results of factor normalization are presented in Figure 5. Furthermore, 12 secondary indicators were established with discontinuity points at different levels, and a grid calculator was employed to compute the five membership levels for each indicator, resulting in a total of 60 grid layers. After the completion of the weight set calculation, the fuzzy comprehensive evaluation models, which consist of hazard, exposure, vulnerability, and coping capacity components, are solved individually. In accordance with the principle of maximum membership degree, the fuzzy superposition tool is employed for accomplishing the level division.
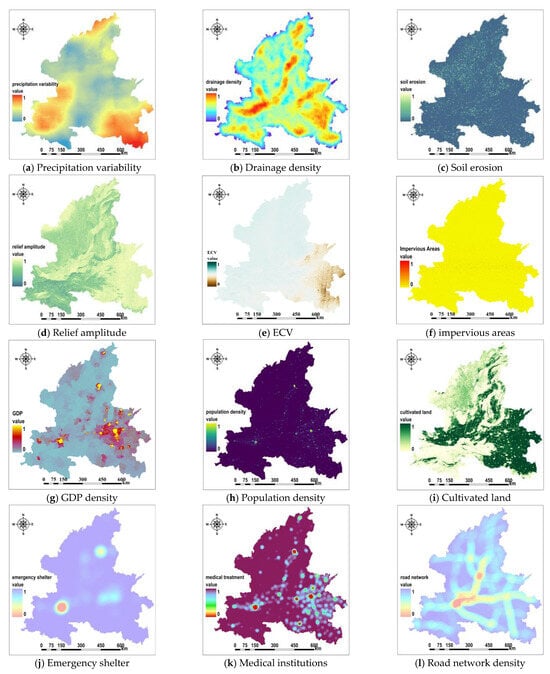
Figure 5.
Visualization results of multi-perspective indicator factors.
4.3. Comprehensive Risk Assessment of Large-Scale Flood Disaster
This study conducts a statistical analysis of flood risk from four dimensions: hazard, exposure, vulnerability, and coping capacity. The experimental results are presented in Figure 6. By comprehensively analyzing the spatial distribution characteristics of these factors, the formation mechanisms and spatial heterogeneity of high-risk areas are systematically revealed. The results indicate that flood risk exhibits significant spatial heterogeneity, with the proportion of high-risk areas decreasing sequentially from Henan Province to Shaanxi Province and Shanxi Province. The distribution of high-risk areas highly coincides with the proportion of cultivated land and impermeable surfaces (such as in the eastern plains of Henan Province), confirming the amplifying effect of human activities on risk.
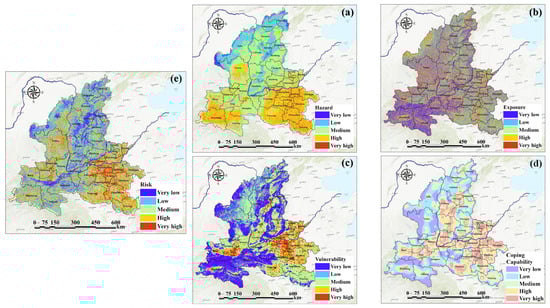
Figure 6.
Large-scale flood disaster risk assessment results: (a) hazard; (b) exposure; (c) vulnerability; (d) coping capability; and (e) risk.
Therein, the hazard of large-scale flood disasters is one of the key factors in risk assessment. The higher-hazard areas in Henan Province are primarily concentrated in the southern region, with high-hazard areas dispersed across the province. Cities such as Zhengzhou, Jiaozuo, and Xinxiang are characterized by drainage density, high precipitation variability, and unstable rainfall, which increase the likelihood of extreme precipitation events. Xinyang, located in the Nanyang Basin, has low-lying, flat terrain and poor drainage and flood control capabilities, contributing to higher flood hazards in areas like Zhengzhou, Jiaozuo, Xinxiang, Xinyang, and Kaifeng. In contrast, the proportion of high-hazard areas in Shanxi and Shaanxi provinces is relatively lower, with the areas of greatest concern mainly located in the Yellow River Basin and the Loess Plateau.
Exposure is influenced by natural environmental factors such as topography and terrain, and it exhibits distinct spatial characteristics, as shown in Figure 6. The high-exposure areas for large-scale flood disasters are primarily located in flood-prone areas, low-lying regions, or areas with poor drainage. The elevation variation coefficient and topographic roughness significantly affect the formation of floods. In areas with higher elevations and more rugged terrain, floods are typically more concentrated, with stronger destructive power but a limited impact range due to the terrain constraints. Conversely, in low-lying areas, floods spread faster, last longer, and cause greater economic losses. Therefore, the elevation variation coefficient and topographic roughness are considered negative indicators, with higher variation and roughness indicating a lower flood disaster risk in those regions. The high exposure areas in the study region are mainly distributed in the eastern plains of Henan and the low-lying areas in the northern parts of Shanxi and Shaanxi, where the population density is high, and the proportion of impervious surfaces is also large. The landforms are primarily mountainous and hilly, making it a low-exposure area.
Vulnerability denotes the extent to which a geographical area is negatively impacted by flood disasters and its capacity to alleviate their consequences [59]. As provincial capitals, Zhengzhou, Xi’an, and Taiyuan have more concentrated populations and economies. Assuming the same level of flood disaster, areas with higher population and economic density will face greater losses, and thus their vulnerability is higher. Different land use types exhibit varying levels of sensitivity to flood disasters. As an agricultural province, Henan, with cities such as Kaifeng, Zhoukou, Jiaozuo, Puyang, and Shangqiu located in the North China Plain, has a high proportion of cultivated land and is highly agricultural. Therefore, its vulnerability is higher during flood events, and the resulting damage is more severe. Future flood disaster prevention and control efforts should focus on the treatment of vulnerable populations and the construction of flood control infrastructure in high-vulnerability areas.
Coping capacity includes predictive capabilities before the disaster, emergency rescue capabilities during the disaster, and recovery abilities after the disaster. As shown in Figure 6, Zhengzhou, Xi’an, and Taiyuan, as provincial capitals, are important transportation hubs with dense road networks and abundant medical resources, resulting in stronger overall disaster response capabilities. In contrast, economically underdeveloped regions have sparse road networks and limited medical resources, leading to lower disaster response capabilities. Cities with convenient transportation, dense road networks, and abundant medical resources can respond quickly and launch effective rescue operations during a disaster. Additionally, economically developed regions generally have more robust flood control facilities, stronger disaster warning systems, and faster post-disaster reconstruction. Therefore, in risk assessments, coping capacity is negatively correlated with disaster risk.
For better analysis, statistical and quantitative calculations of the visualization results are presented in Table 6.
Table 6.
Statistics results by regions.
The evaluation results indicate that high-risk areas in Henan, Shaanxi, and Shanxi Provinces account for 54.11%, 31.74%, and 18.2%, respectively. The proportion of high-hazard areas in Henan Province is 75.72% (high 63.69% and very high 12.03%), significantly higher than the other two provinces. Typical cities such as Zhengzhou, Xinyang are concentrated in very high-hazard areas due to the high precipitation variability and low-lying terrain. In Shaanxi Province, high areas account for 41.26%, primarily distributed in the Loess Plateau and the Yellow River Basin, which is closely related to soil erosion and high topographic relief. In Shanxi Province, high-hazard areas account for only 15.58%, but medium-risk areas account for 48.58%, indicating that while the overall risk is relatively low, localized areas still require attention. The proportions of high-exposure areas in the three provinces are 38.31%, 37.59%, and 39.96%, respectively. The high vulnerability areas in Henan, Shaanxi, and Shanxi account for 38.28%, 7.07%, and 8.04%, respectively.
According to the evaluation results, areas with low or very low coping capacity in Shanxi, Shaanxi, and Henan account for 37.74%, 63.45%, and 19.78%, respectively. Both Shanxi and Shaanxi have large areas of the Loess Plateau, characterized by significant terrain variations and numerous ravines, making transportation construction challenging, with limited options for route selection. Furthermore, the ecological environment in the Loess Plateau is fragile, and production and construction activities in these areas should prioritize ecological protection to prevent soil erosion and the destruction of ecological balance.
Shaanxi Province is located in the middle reaches of the Yellow River, with terrain following a north–south high, central low pattern. About 40% of the province’s area is on the Loess Plateau. Due to severe soil erosion, loose soil, and sparse vegetation, coupled with a temperate monsoon climate and uneven rainfall distribution concentrated in the summer, the flood risk in this province is relatively high during extreme rainfall events. High and relatively high-risk areas account for 31.74% of the province’s total area, primarily concentrated in cities such as Xi’an, Baoji, Hanzhong, and Xianyang. Shanxi Province is located on the left bank of the Yellow River in the middle reaches, with terrain dominated by the Loess Plateau, characterized by rugged terrain and intersecting valleys. Precipitation is greatly influenced by the terrain, with mountainous areas and limited plains. During heavy rainfall, water collects in the valleys and basins, leading to higher flood risks in cities along the rivers. High and relatively high-risk areas account for 18.2% of the province’s total area, mainly in cities such as Xinzhou, Changzhi, Jincheng, and Taiyuan. Henan Province has the largest proportion of high and relatively high-risk areas, reaching 54.11%. These areas are primarily distributed in economically developed and densely road-networked cities such as Zhengzhou, Xinxiang, Jiaozuo, Luoyang, and Kaifeng. As coping capacity improves, the increasing impervious areas exacerbate the urban “heat island effect,” leading to higher surface temperatures, increased surface runoff, and reduced infiltration. This also results in a decrease in vegetation coverage, further intensifying the risk to people, the economy, and infrastructure during floods. Low-risk areas are mainly located in high-altitude, steep mountainous and hilly regions with higher forest coverage and lower precipitation, where risks and vulnerabilities are generally lower. Most of Henan Province lies in high and relatively high-risk areas, which should receive increased attention in terms of flood control infrastructure and emergency rescue in the future.
4.4. Validation of Flood Risk Assessment Models
The experiment employs precision, recall, F1 score, and accuracy metrics to assess the performance of the large-scale disaster risk assessment proposed in this study. In this section, TP is the number of true positives, TN is the number of true negatives, FP is the number of false positives, and FN is the number of false negatives.
Accuracy is defined as the ratio of correctly classified samples to the total number of samples, serving as a statistical metric applicable to the entire sample set. The mathematical expression is presented in Equation (21):
Precision, also referred to as positive predictive value, serves as an evaluative metric for predicting results. The ratio of accurately classified positive samples to the total number of samples identified as positive by the classifier. Precision is a statistical metric that pertains to certain samples, emphasizing the statistical aspects of data classified as positive by the classifier. It is defined by Equation (22):
The recall rate is defined as the ratio of correctly classified positive samples to the total number of true positive samples. The recall rate serves as a statistical measure for certain samples, emphasizing the statistical characteristics of actual positive samples. It is expressed as follows (23):
F1 score is the harmonic mean of accuracy and recall, providing a balanced evaluation that takes into account both the accuracy and recall of classification models. The statistical indicator serves as a measure for assessing the accuracy of classification models. The variable has a maximum value of one and a minimum value of 0. The model’s performance improves with higher values, which is determined through Equation (24):
The experiment employed the flood inundation range extraction results generated by U-Net++ [60]. Additionally, flood and non-flood points were randomly chosen using ArcGIS. A total of 642 non-flood points and 648 flood points were chosen in Henan. According to the equation provided above, accuracy was determined based on the spatial distribution of the entities within the risk zoning. The specific results are illustrated in Figure 7.
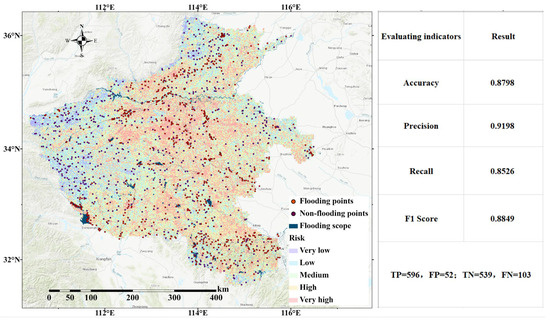
Figure 7.
Flood disaster risk assessment model precision calculation results.
Additionally, according to the “2021 National Ten Natural Disasters Report” released by the Ministry of Emergency Management, the assessment confirmed the significant losses incurred in the disaster events impacting Henan, Shaanxi, and Shanxi [61]. The loss statistics are presented in Figure 8, indicating that the risk level zoning results align closely with the disaster situation. Based on the list of the top ten natural disasters in China in 2021 released by the Ministry of Emergency Management, this study verifies the results by focusing on disaster events that caused significant losses in Henan, Shaanxi, and Shanxi provinces. According to Section 6 of the Flood Disaster Assessment Standard (SL 579-2012) [62], five key indicators—direct economic losses, number of collapsed houses, affected population, disaster-related fatalities, and affected crop area—were selected for statistical analysis. The results show that Henan Province experienced the most severe losses among the three provinces. The distribution of disaster risk levels corresponds well with the actual disaster impacts, demonstrating the reliability of the risk zoning outcomes.
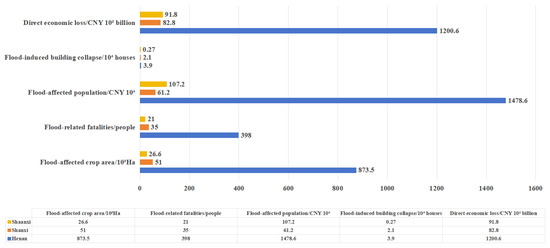
Figure 8.
Statistical results of flood disaster losses in study area.
5. Discussion
This study focuses on the Loess Plateau region and establishes a large-scale flood disaster risk assessment system driven by multi-source data. A practical indicator framework is constructed from four dimensions: hazard, exposure, vulnerability, and coping capacity. Based on a hybrid weighting approach that combines subjective and objective methods, the LS-FRAM assessment model is developed, achieving flood risk zoning at a spatial resolution of 1 km. Compared with previous studies [63,64], this research differs from those based solely on remote sensing data. At the data level, it integrates multi-source heterogeneous data, including remote sensing imagery, topographic and geomorphological data, meteorological data, land use, and socioeconomic information. This approach enhances the model’s comprehensiveness and spatiotemporal adaptability, making it particularly suitable for large-scale and topographically complex areas for risk monitoring and early warning.
Secondly, unlike data-driven machine learning models [65,66], this study introduces a hybrid weighting strategy combining the Analytic Hierarchy Process (AHP), the entropy weight method, and fuzzy comprehensive evaluation. This approach reduces dependence on large volumes of historical flood samples, thereby improving the model’s applicability and generalization ability in data-scarce areas. Furthermore, the introduction of fuzzy methods better captures the uncertainties and ambiguities in multi-factor weight assignment, enhancing the credibility of the assessment results.
Additionally, this study introduces the “soil erosion modulus” as a critical disaster-forming factor for large-scale flood risk in the Loess Plateau. It emphasizes the significant impact of geomorphic evolution and slope disturbances on the disaster-forming capacity of short-term heavy rainfall events. Experimental results demonstrate that this indicator shows strong explanatory power in the Loess region. Moreover, the assessment results reveal that the proportions of high- and medium-risk zones in Henan, Shaanxi, and Shanxi provinces are 54.11%, 31.74%, and 18.2%, respectively, showing high spatial consistency with actual events such as the catastrophic rainstorm in Henan Province in 2021. This consistency validates the effectiveness and applicability of the model.
Despite establishing a relatively systematic large-scale flood risk assessment model, this study still has certain limitations. The current precipitation data have a spatial resolution of 1 km, which may not adequately capture the influence of micro-topographic features and local micro-environmental factors on flood accumulation. Future research could incorporate advanced techniques such as high-resolution remote sensing, radar-precipitation fusion, and spatiotemporal interpolation to optimize data downscaling. Additionally, future efforts will explore the use of advanced machine learning methods, such as graph neural networks and Bayesian frameworks, to adaptively model weight structures and nonlinear factor relationships, thereby further improving assessment accuracy and automation levels.
In conclusion, the proposed LS-FRAM model demonstrates notable innovations in both multi-source data integration and indicator selection. It provides a valuable technical basis for the refined identification of large-scale flood disaster risks. Nonetheless, further research is needed to enhance the model’s generalizability, standardization of indicators, and predictive capabilities for extreme events, aiming to strengthen pre-disaster risk identification and post-disaster rapid response capabilities.
6. Conclusions
This study takes the Yellow River’s middle and lower reaches as an example and conducts a comprehensive analysis based on data such as precipitation variability, soil erosion degree, population, and topography. Using a 1 km × 1 km grid cell as the risk assessment scale, the spatial distribution of rainstorm-type flood disaster risk in the middle of the Yellow River and the lower reaches was obtained. The experimental results show that the large-scale flood disaster risk assessment model driven by multi-source data has an accuracy of 88.49%. The areas of high and relatively high risk in Henan, Shaanxi, and Shanxi provinces account for 54.11%, 31.74%, and 18.2%, respectively. The high-risk areas in the study area are relatively concentrated, with Henan Province having the highest proportion of high and relatively high-risk zones, accounting for more than 50% of the province’s total area. In subsequent disaster reduction efforts, the construction of emergency facilities in medium- and high-risk areas should be prioritized to reduce environmental hazards, as well as the vulnerability of populations and the economy, and their exposure to disasters, thereby enhancing the region’s disaster reduction capabilities.
Due to global climate change and the increasing frequency of extreme weather events, global warming has led to higher water vapor content in the atmosphere, which exacerbates the risks of heavy rainfall and flood disasters. It has also caused more frequent and prolonged heat waves and droughts, leading to the melting of polar glaciers and ice caps, rising sea levels, and an increased risk of large-scale flood disasters. Therefore, this study conducts a spatial division of the risk of large-scale rainstorm-type floods, providing data support for future flood control construction and emergency rescue efforts in key areas.
Author Contributions
M.W. and H.Z. proposed the methodology and wrote the manuscript. J.Y. and L.H. contributed to improving the methodology. H.K. and A.Q. helped edit and improve the manuscript. All authors have read and agreed to the published version of the manuscript.
Funding
This research was jointly supported by Funded by Science Research Project of Hebei Education Department (No. QN2025357; No. ZC202311); by the Hebei Natural Science Foundation (Grant No. D2020512001); by the National Natural Science Foundation of China (Grant No. 42101343); by the National Natural Science Foundation of China (Grant No. 5047803); by the National natural disaster risk remote sensing monitoring prewarning and emergency application platform construction (Grant No. 2021YFB3901204); and the Science technology research and development plan self-fund program of Langfang (Grant No. 2022011020).
Institutional Review Board Statement
Not applicable.
Informed Consent Statement
Not applicable.
Data Availability Statement
The data are not publicly available due to restrictions privacy.
Conflicts of Interest
The authors declare no conflicts of interest.
References
- United Nations Office for Disaster Risk Reduction. Global Assessment Report on Disaster Risk Reduction 2022: Our World at Risk: Transforming Governance for a Resilient Future; UN: New York, NY, USA, 1901. [Google Scholar]
- Clima, T.; Te, W. State of the Climate in Asia; WMO: Geneva, Switzerland, 2024. [Google Scholar]
- Zhang, W.; Zhou, T.; Ye, W.; Zhang, T.; Zhang, L.; Wolski, P.; Risbey, J.; Wang, Z.; Min, S.-K.; Ramsay, H.; et al. A Year Marked by Extreme Precipitation and Floods: Weather and Climate Extremes in 2024. Adv. Atmos. Sci. 2025, 42, 1045–1063. [Google Scholar] [CrossRef]
- Waleed, M.; Sajjad, M. High-Resolution Flood Susceptibility Mapping and Exposure Assessment in Pakistan: An Integrated Artificial Intelligence, Machine Learning and Geospatial Framework. Int. J. Disaster Risk Reduct. 2025, 121, 105442. [Google Scholar] [CrossRef]
- Zhao, J.; Chen, H.; Liang, Q.; Xia, X.; Xu, J.; Hoey, T.; Barrett, B.; Renaud, F.G.; Bosher, L.; Zhou, X. Large-scale flood risk assessment under different development strategies: The Luanhe River Basin in China. Sustain. Sci. 2021, 17, 1365–1384. [Google Scholar] [CrossRef]
- Li, J.; Wang, G.; Song, C.; Sun, S.; Ma, J.; Wang, Y.; Guo, L.; Li, D. Recent intensified erosion and massive sediment deposition in Tibetan Plateau rivers. Nat. Commun. 2024, 15, 722. [Google Scholar] [CrossRef]
- Mahabaleshwara, H.; Nagabhushan, H.M. A study on soil erosion and its impacts on floods and sedimentation. Int. J. Res. Eng. Technol. 2014, 3, 443–451. [Google Scholar]
- Li, X.; Wei, X. Analysis of the relationship between soil erosion risk and surplus floodwater during flood season. J. Hydrol. Eng. 2014, 19, 1294–1311. [Google Scholar] [CrossRef]
- Yang, B.; Jiao, J.; Ma, X.; Zhao, W.; Ling, Q.; Zhang, X.; Han, J.; Du, P.; Chen, Y.; Chen, H. Distribution and formation of soil balls under heavy rainstorm conditions in the northern Loess Plateau. J. Hydrol. 2023, 625, 130103. [Google Scholar] [CrossRef]
- Wu, L.; Jiang, J.; Li, G.-X.; Ma, X.-Y. Characteristics of pulsed runoff-erosion events under typical rainstorms in a small watershed on the Loess Plateau of China. Sci. Rep. 2018, 8, 3672. [Google Scholar] [CrossRef]
- Dong, X.; Wang, X.; Yang, L.; Zhao, Z.; Van Balen, R.; Miao, X.; Liu, T.; Vandenberghe, J.; Pan, B.; Gibling, M.; et al. Quantitative assessment of the erosion and deposition effects of landslide-dam outburst flood, Eastern Himalaya. Sci. Rep. 2024, 14, 7038. [Google Scholar] [CrossRef]
- Paszkowski, A.; Laurien, F.; Mechler, R.; Hall, J. Quantifying community resilience to riverine hazards in Bangladesh. Glob. Environ. Change 2024, 84, 102778. [Google Scholar] [CrossRef]
- Borrelli, P.; Robinson, D.A.; Fleischer, L.R.; Lugato, E.; Ballabio, C.; Alewell, C.; Meusburger, K.; Modugno, S.; Schütt, B.; Ferro, V.; et al. An assessment of the global impact of 21st century land use change on soil erosion. Nat. Commun. 2017, 8, 2013. [Google Scholar] [CrossRef] [PubMed]
- IPCC. Climate Change 2022: Impacts, Adaptation and Vulnerability. In Contribution of Working Group II to the Sixth Assessment Report of the Intergovernmental Panel on Climate Change; Cambridge University Press: Cambridge, UK, 2022. [Google Scholar]
- Wang, Y.; Zhang, Q.; Lin, K.; Liu, Z.; Liang, Y.S.; Liu, Y.; Li, C. A novel framework for urban flood risk assessment: Multiple perspectives and causal analysis. Water Res. 2024, 256, 121591. [Google Scholar] [CrossRef] [PubMed]
- UNDRR. Sendai Framework for Disaster Risk Reduction 2015–2030; United Nations Office for Disaster Risk Reduction: Geneva, Switzerland, 2015. [Google Scholar]
- Lee, S. Determination of priority weights under multiattribute decision-making situations: AHP versus fuzzy AHP. J. Constr. Eng. Manag. 2015, 141, 05014015. [Google Scholar] [CrossRef]
- Liu, W.; Feng, Q.; Engel, B.A.; Yu, T.; Zhang, X.; Qian, Y. A probabilistic assessment of urban flood risk and impacts of future climate change. J. Hydrol. 2023, 618, 129267. [Google Scholar] [CrossRef]
- Salem, S.; Siam, A.; El-Dakhakhni, W.; Tait, M. Probabilistic resilience-guided infrastructure risk management. J. Manag. Eng. 2020, 36, 04020073. [Google Scholar] [CrossRef]
- Benito, G.; Lang, M.; Barriendos, M.; Llasat, M.C.; Francés, F.; Ouarda, T.; Thorndycraft, V.; Enzel, Y.; Bardossy, A.; Coeur, D.; et al. Use of Systematic, palaeoflood and historical data for the improvement of flood risk estimation. Review of Scientific Methods. Nat. Hazards 2004, 31, 623–643. [Google Scholar] [CrossRef]
- Nott, J. Extreme Events: A Physical Reconstruction and Risk Assessment; Cambridge University Press: Cambridge, UK, 2006. [Google Scholar]
- Shi, Y.; Zhai, G.; Zhou, S.; Lu, Y.; Chen, W.; Deng, J. How can cities respond to flood disaster risks under multi-scenario simulation? A case study of Xiamen, China. Int. J. Environ. Res. Public Health 2019, 16, 618. [Google Scholar] [CrossRef]
- Nobile, E.G.; Figueiredo, R.; Arrighi, C.; Romão, X.; Martina, M.L. Flood risk assessment of cultural heritage across countries and spatial scales. Int. J. Disaster Risk Reduct. 2025, 118, 105236. [Google Scholar] [CrossRef]
- Kappes, M.S.; Keiler, M.; von Elverfeldt, K.; Glade, T. Challenges of analyzing multi-hazard risk: A review. Nat. Hazards 2012, 64, 1925–1958. [Google Scholar] [CrossRef]
- Mastrantoni, G.; Masciulli, C.; Marini, R.; Esposito, C.; Mugnozza, G.S.; Mazzanti, P. A novel model for multi-risk ranking of buildings at city level based on open data: The test site of Rome, Italy. Geomat. Nat. Hazards Risk 2023, 14, 2275541. [Google Scholar] [CrossRef]
- Zhang, P.; Liu, X.; Shu, H. Hazard assessment of debris flow by using FLO-2D and hazard matrix: A case study of Qingshui Gully in the southern Gansu Province, China. Desalin. Water Treat. 2023, 315, 650–662. [Google Scholar] [CrossRef]
- Zhang, H. Study on grades of freeway meteorological disasters by risk matrix. Appl. Mech. Mater. 2012, 178–181, 2788–2792. [Google Scholar] [CrossRef]
- Kovačević, N.; Stojiljković, A.; Kovač, M. Application of the matrix approach in risk assessment. Oper. Res. Eng. Sci. Theory Appl. 2019, 2, 55–64. [Google Scholar] [CrossRef]
- Dumbravă, V.; Iacob, V.S. Using probability–impact matrix in analysis and risk assessment projects. Journal of Knowledge Management. Econ. Inf. Technol. 2013, 42, 76–96. [Google Scholar]
- Rehman, A.; Song, J.; Haq, F.; Mahmood, S.; Ahamad, M.I.; Basharat, M.; Sajid, M.; Mehmood, M.S. Multi-Hazard Susceptibility Assessment Using the Analytical Hierarchy Process and Frequency Ratio Techniques in the Northwest Himalayas, Pakistan. Remote Sens. 2022, 14, 554. [Google Scholar] [CrossRef]
- Pham, B.T.; Luu, C.; Van Dao, D.; Van Phong, T.; Nguyen, H.D.; Van Le, H.; von Meding, J.; Prakash, I. Flood risk assessment using deep learning integrated with multi-criteria decision analysis. Knowl. Based Syst. 2021, 219, 106899. [Google Scholar] [CrossRef]
- Wang, G.; Liu, L.; Shi, P.; Zhang, G.; Liu, J. Flood Risk Assessment of Metro System Using Improved Trapezoidal Fuzzy AHP: A Case Study of Guangzhou. Remote Sens. 2021, 13, 5154. [Google Scholar] [CrossRef]
- Cardoso, M.A.; Almeida, M.C.; Brito, R.S.; Gomes, J.L.; Beceiro, P.; Oliveira, A. 1D/2D stormwater modelling to support urban flood risk management in estuarine areas: Hazard assessment in the Dafundo case study. J. Flood Risk Manag. 2020, 13, e12663. [Google Scholar] [CrossRef]
- Bennett, G.L.; Panici, D.; Rengers, F.K.; Kean, J.W.; Rathburn, S.L. Landslide-channel feedbacks amplify channel widening during floods. npj Nat. Hazards 2025, 2, 7. [Google Scholar] [CrossRef]
- Bullen, J.; Miles, A. Exploring local perspectives on flood risk: A participatory GIS approach for bridging the gap between modelled and perceived flood risk zones. Appl. Geogr. 2024, 163, 103176. [Google Scholar] [CrossRef]
- Zhang, Z.; Zhang, J.; Zhang, Y.; Chen, Y.; Yan, J. Urban flood resilience evaluation based on GIS and multi-source data: A case study of Changchun city. Remote Sens. 2023, 15, 1872. [Google Scholar] [CrossRef]
- Liu, J.; Shi, X.-Z.; Yang, L.; Liu, C.-Y.; Wang, J.-C.; Zhu, R.-M.; Shi, X.-L.; Liu, Q.-F. Assessment of climate damage in China based on integrated assessment framework. Adv. Clim. Change Res. 2024, 15, 124–133. [Google Scholar] [CrossRef]
- Liu, G.; Zhang, Y.; Zhang, J.; Lang, Q.; Chen, Y.; Wan, Z.; Liu, H. Geographic-information-system-based risk assessment of flooding in Changchun urban rail transit system. Remote Sens. 2023, 15, 3533. [Google Scholar] [CrossRef]
- Dai, K.; Shen, S.; Cheng, C.; Song, Y. Integrated evaluation and attribution of urban flood risk mitigation capacity: A case of Zhengzhou, China. J. Hydrol. Reg. Stud. 2023, 50, 101567. [Google Scholar] [CrossRef]
- Rehman, A.; Song, J.; Haq, F.; Ahamad, M.I.; Sajid, M.; Zahid, Z. Geo-physical hazards microzonation and suitable site selection through multicriteria analysis using geographical information system. Appl. Geogr. 2021, 135, 102550. [Google Scholar] [CrossRef]
- Fernández, D.S.; Lutz, M.A. Urban flood hazard zoning in Tucumán Province, Argentina, using GIS and multicriteria decision analysis. Eng. Geol. 2010, 111, 90–98. [Google Scholar] [CrossRef]
- Peng, S.; Ding, Y.; Liu, W.; Li, Z. 1 km monthly temperature and precipitation dataset for China from 1901 to 2017. Earth Syst. Sci. Data 2019, 11, 1931–1946. [Google Scholar] [CrossRef]
- Didan, K. MOD13A3 MODIS/Terra Vegetation Indices Monthly L3 Global 1 km SIN Grid V006; NASA EOSDIS LP DAAC: Sioux Falls, SD, USA, 2015; Volume 10.
- Liu, Y.; Zhong, Y.; Ma, A.; Zhao, J.; Zhang, L. Cross-resolution national-scale land-cover mapping based on noisy label learning: A case study of China. Int. J. Appl. Earth Obs. Geoinf. 2023, 118, 103265. [Google Scholar] [CrossRef]
- Zhang, X.; Liu, L.; Zhao, T.; Gao, Y.; Chen, X.; Mi, J. GISD30: Global 30 m impervious-surface dynamic dataset from 1985 to 2020 using time-series Landsat imagery on the Google Earth Engine platform. Earth Syst. Sci. Data 2022, 14, 1831–1856. [Google Scholar] [CrossRef]
- Dobson, J.E.; Bright, E.A.; Coleman, P.R.; Durfee, R.C.; Worley, B.A. LandScan: A global population database for estimating populations at risk. Photogramm. Eng. Remote Sens. 2000, 66, 849–857. [Google Scholar]
- Zhao, N.; Liu, Y.; Cao, G.; Samson, E.L.; Zhang, J. Forecasting China’s GDP at the pixel level using nighttime lights time series and population images. GISci. Remote Sens. 2017, 54, 407–425. [Google Scholar] [CrossRef]
- Boussadia-Omari, L.; Ouillon, S.; Hirche, A.; Salamani, M.; Guettouche, M.S.; Ihaddaden, A.; Nedjraoui, D. Contribution of phytoecological data to spatialize soil erosion: Application of the RUSLE model in the Algerian atlas. Int. Soil Water Conserv. Res. 2021, 9, 502–519. [Google Scholar] [CrossRef]
- Angima, S.; Stott, D.; O’neill, M.; Ong, C.; Weesies, G. Soil erosion prediction using RUSLE for central Kenyan highland conditions. Agric. Ecosyst. Environ. 2003, 97, 295–308. [Google Scholar] [CrossRef]
- Farsana, F.; Varughese, A.; Joseph, A. Soil Erosion Estimation of Kunthippuzha Watershed Using GIS and RUSLE Model. Int. J. Environ. Clim. Change 2023, 13, 2956–2967. [Google Scholar] [CrossRef]
- Biswas, J.; Giri, B. RUSLE and AHP based soil erosion risk mapping for Jalpaiguri district of West Bengal, India. Proc. Indian Natl. Sci. Acad. 2023, 89, 869–883. [Google Scholar] [CrossRef]
- Hu, J.; Liu, Y.; Sang, Y.F.; Liu, C.; Singh, V.P. Precipitation variability and its response to urbanization in the Taihu Lake Basin, China. Theor. Appl. Climatol. 2021, 144, 1205–1218. [Google Scholar] [CrossRef]
- Lyu, H.M.; Shen, J.S.; Arulrajah, A. Assessment of geohazards and preventative countermeasures using AHP incorporated with GIS in Lanzhou, China. Sustainability 2018, 10, 304. [Google Scholar] [CrossRef]
- Saaty, T.L. Decision making—The Analytic Hierarchy and Network Processes (AHP/ANP). J. Syst. Sci. Syst. Eng. 2004, 13, 1–35. [Google Scholar] [CrossRef]
- Hategekimana, Y.; Yu, L.; Nie, Y.; Zhu, J.; Liu, F.; Guo, F. Integration of multi-parametric fuzzy analytic hierarchy process and GIS along the UNESCO World Heritage: A flood hazard index, Mombasa County, Kenya. Nat. Hazards 2018, 92, 1137–1153. [Google Scholar] [CrossRef]
- Cai, T.; Li, X.; Ding, X.; Wang, J.; Zhan, J. Flood risk assessment based on hydrodynamic model and fuzzy comprehensive evaluation with GIS technique. Int. J. Disaster Risk Reduct. 2019, 35, 101077. [Google Scholar] [CrossRef]
- Lv, C.; Gong, H.L. Snow Disaster Risk Assessment in China with the Multi-Layer Fuzzy Comprehensive Evaluation Method. Adv. Mater. Res. 2013, 726, 913–916. [Google Scholar] [CrossRef]
- Chen, H.; Xu, Z.; Liu, Y.; Huang, Y.; Yang, F. Urban Flood risk assessment based on dynamic population distribution and fuzzy comprehensive evaluation. Int. J. Environ. Res. Public Health 2022, 19, 16406. [Google Scholar] [CrossRef] [PubMed]
- Hinojos, S.; McPhillips, L.; Stempel, P.; Grady, C. Social and environmental vulnerability to flooding: Investigating cross-scale hypotheses. Appl. Geogr. 2023, 157, 103017. [Google Scholar] [CrossRef]
- Zhu, H.; Yao, J.; Meng, J.; Cui, C.; Wang, M.; Yang, R. A Method to Construct an Environmental Vulnerability Model Based on Multi-Source Data to Evaluate the Hazard of Short-Term Precipitation-Induced Flooding. Remote Sens. 2023, 15, 1609. [Google Scholar] [CrossRef]
- Ministry of Emergency Management of the People’s Republic of China. The Emergency Management Department Released the Top Ten Natural Disasters in China in 2021 [EB/OL]. Available online: https://www.mem.gov.cn/xw/yjglbgzdt/202201/t20220123_407199.shtml (accessed on 25 January 2022).
- SL 579-2012; Flood Disaster Assessment Standard. Ministry of Water Resources of the People’s Republic of China: Beijing, China, 2012.
- Wang, T.; Wang, H.; Wang, Z.; Huang, J. Dynamic risk assessment of urban flood disasters based on functional area division—A case study in Shenzhen, China. J. Environ. Manag. 2023, 345, 118787. [Google Scholar] [CrossRef]
- Amen, A.R.M.; Mustafa, A.; Kareem, D.A.; Hameed, H.M.; Mirza, A.A.; Szydłowski, M.; Saleem, B.K.M. Mapping of Flood-Prone Areas Utilizing GIS Techniques and Remote Sensing: A Case Study of Duhok, Kurdistan Region of Iraq. Remote Sens. 2023, 15, 1102. [Google Scholar] [CrossRef]
- Wu, X.; Zhu, H.; Hu, L.; Meng, J.; Sun, F. Analysis of short-term heavy rainfall-based urban flood disaster risk assessment using integrated learning approach. Sustainability 2024, 16, 8249. [Google Scholar] [CrossRef]
- Shikhteymour, S.R.; Borji, M.; Bagheri-Gavkosh, M.; Azimi, E.; Collins, T.W. A novel approach for assessing flood risk with machine learning and multi-criteria decision-making methods. Appl. Geogr. 2023, 158, 103035. [Google Scholar] [CrossRef]
Disclaimer/Publisher’s Note: The statements, opinions and data contained in all publications are solely those of the individual author(s) and contributor(s) and not of MDPI and/or the editor(s). MDPI and/or the editor(s) disclaim responsibility for any injury to people or property resulting from any ideas, methods, instructions or products referred to in the content. |
© 2025 by the authors. Licensee MDPI, Basel, Switzerland. This article is an open access article distributed under the terms and conditions of the Creative Commons Attribution (CC BY) license (https://creativecommons.org/licenses/by/4.0/).