Article

Characteristics and Lag Time of Meteorological Drought Propagation to Hydrological Drought in the Haihe River Basin

1
State Key Laboratory of Hydraulic Engineering Simulation and Safety, Tianjin University, Tianjin 300072, China
2
State Key Laboratory of Simulation and Regulation of Water Cycle in River Basin, China Institute of Water Resources and Hydropower Research, Beijing 100038, China
3
Institute of Bio-Geosciences (IBG-3, Agrosphere), Forschungszentrum Jülich, 52425 Jülich, Germany
4
College of Water Resources, North China University of Water Resources and Electric Power, Zhengzhou 450046, China
*
Author to whom correspondence should be addressed.
Co-first author.
Sustainability 2025, 17(11), 5134; https://doi.org/10.3390/su17115134
Submission received: 26 March 2025 / Revised: 26 May 2025 / Accepted: 27 May 2025 / Published: 3 June 2025
(This article belongs to the Special Issue Sustainable Water Management in Rapid Urbanization)

Abstract

:
Understanding the propagation dynamics from meteorological to hydrological droughts, particularly in regions heavily influenced by human activities, is essential for the effective monitoring and prevention of hydrological drought risks. This study focuses on the Haihe River Basin, investigating the evolution of meteorological and hydrological droughts using the Standardized Precipitation and Evapotranspiration Index and the Standardized Runoff Index, supplemented by run theory analysis. Using correlation analysis, we examine the propagation lag times between meteorological and hydrological droughts. Our results indicate a worsening drought trend in the Haihe River Basin over the past six decades. Notably, a turning point occurred in 1991, where meteorological droughts began to abate, while hydrological droughts intensified, highlighting a divergence in trends between meteorological and hydrological droughts. We identify four distinct pathways for the transition from meteorological to hydrological droughts in the region. This study identifies a hydrological drought lag time of 3 months. The occurrence of droughts in the Haihe River Basin is becoming increasingly frequent. Furthermore, our findings reveal that the severity of hydrological droughts is increasingly exceeding that of meteorological droughts, and the influence of meteorological conditions on hydrological droughts is diminishing, while human activities may become a more significant contributing factor. The findings from this research enhance our comprehension of how drought propagation trends and characteristics are shaped by significant human influences, thereby offering pivotal insights for managing water resources at the basin level.

1. Introduction

Drought is one of the most extensive and severe natural disasters worldwide, affecting millions of people directly every year [1,2]. The indirect impacts, such as reduced agricultural production and water shortages, have affected the lives of hundreds of millions, resulting in economic losses amounting to tens of billions of dollars [3]. Extreme drought conditions are even more severe [4,5,6,7,8], and this trend continues to worsen annually. In the future, the severity of droughts is expected to double across 30% of the world’s land area [9]. Drought poses a significant threat but is harder to predict compared with other disasters, as it is typically considered an abnormal condition characterized by natural water levels falling below the average over an extended period [10]. When a drought begins, it often means that it can no longer be prevented. Additionally, factors such as global warming in recent decades, intense human activities, and the complexity of drought have made it even more difficult to prevent drought in advance. This presents unprecedented challenges to water and food security [11], making the early prediction of drought development one of the most important yet challenging research topics in the scientific community [12].
China is no exception, suffering from severe droughts frequently since the 1950s, particularly in recent years where droughts have been more intense and covered all regions across the country [13]. Severe river cut offs in the Yellow River Basin [14], aggravated droughts in the Yangtze River Basin due to human activities [15], a significant reduction in agricultural output in northern China [16], and severe water shortages in southwest China have all had profound impacts on social and economic water use [17], particularly straining usage in the North China Plain, affecting local agricultural production and residents’ lives [18,19]. Furthermore, as China is affected by global warming, with temperatures rising by 1.5 to 2 °C, the losses caused by drought may double in the future [20].
Drought can be categorized into four types based on its nature [21]: meteorological drought, hydrological drought, agricultural drought, and socio-economic drought. In addition, groundwater drought is gradually being studied [22]. To better quantify drought characteristics, various drought indices have been developed to monitor the drought process. Meteorological drought indicators such as the Standardized Precipitation Index (SPI), Palmer Drought Severity Index (PDSI), and Standardized Precipitation Evapotranspiration Index (SPEI) have been used. The Standardized Streamflow Index (SSI), Standardized Runoff Index (SRI) [23,24], and Streamflow Drought Index (SDI) are used to characterize hydrological drought indices. The Standardized Soil Moisture Index (SSMI) and others are utilized to represent agricultural drought indices [25].
There is a strong connection between different types of droughts [26,27,28]. Among them, meteorological drought is generally considered the initial and critical factor for all other droughts [9]. Many researchers focus on the propagation characteristics of meteorological drought but often overlook that hydrological drought is the core link between meteorological drought and agricultural, socio-economic, and groundwater droughts [29,30]. Meteorological drought is primarily caused by insufficient precipitation and excessive evaporation in a specific area over a particular period [31], which is fundamental to the onset of drought. Meteorological drought reduces precipitation input (moisture flux) from the atmosphere to the land while increasing moisture output from the land to the atmosphere due to intensified evaporation, leading to land water deficit. When surface flow rates and lake or reservoir levels fall below the long-term average, it triggers the onset of hydrological drought [32]. A decrease in land runoff leads to a reduction or even absence of water flux in agriculture, society, and groundwater, thereby inducing different types of droughts. This process is known as drought propagation [26,33], with the propagation from meteorological to hydrological drought being the initial phase that significantly impacts land water resources and the hydrological cycle [34,35]. Many researchers focus on the propagation process and relationships from meteorological to hydrological drought [36]. However, there is currently no clear conclusion regarding the patterns of propagation from meteorological drought to hydrological drought in areas influenced by intensive human activities. How do the propagation characteristics evolve? What is the lag time? These questions remain unanswered in the context of today’s increasing influence of human activities.
Especially in the more complex and water-vulnerable eastern China, where the Haihe River Basin (HRB) is located, the uncertainty of drought propagation characteristics presents greater challenges to local water extraction, usage, and water resource management. The HRB has been severely affected by climate change and intense human activities, making it one of the regions experiencing the most severe water resource depletion in China and globally [37]. Over the past 60 years, there has been a 27% reduction in local water resources [38], with the water table dropping by up to 60 m [39]. Furthermore, the HRB, located on the North China Plain, is one of China’s main agricultural areas with a significant demand for water resources [19]. Some scholars have conducted preliminary explorations on the patterns of meteorological drought propagation to hydrological drought in the HRB, but only in small watershed areas; analyzed the meteorological drought propagation during typical extreme drought years, overlooking the long-term propagation characteristics [40]; and explored the patterns from meteorological drought to groundwater drought [41]. However, they have not resolved what the long-term patterns and evolution characteristics of meteorological drought propagation to hydrological drought in the HRB are and what the lag time is for the propagation from meteorological to hydrological drought.
Therefore, this study focuses on the HRB as a typical research area, aiming to analyze the characteristics and lag time of drought propagation from meteorological to hydrological drought in a region strongly influenced by human activities. The main steps include: (1) Systematically assessing the propagation characteristics of meteorological and hydrological droughts in the HRB based on trend analysis and copula functions. (2) Revealing the correlation between meteorological and hydrological droughts through cross wavelet analysis, identifying drought propagation paths based on run theory and matching analysis methods, and quantifying the timing, duration, and severity of drought propagation. (3) By using lag analysis and Pearson’s correlation analysis, we determine the timing of drought propagation from meteorological to hydrological in the HRB. This research provides a scientific basis for efficient regional water resource management, responding to the propagation of meteorological to hydrological drought, and mitigating drought risks, offering valuable response time for the region to address the significant losses caused by meteorological drought. This research aims to quantify the characteristics and lag time of meteorological-to-hydrological drought propagation, providing a foundational framework for future studies to explore climate–human interaction mechanisms.

2. Study Area and Data

2.1. Study Area

The HRB, located to the west of the Bohai Sea (Figure 1), between east longitude 112° to 120° and north latitude 35° to 43°, is one of China’s seven major river basins. It mainly encompasses the entire territories of Beijing and Tianjin, as well as most of Hebei Province, and also includes parts of Shanxi, Henan, Shandong, Inner Mongolia, and Liaoning provinces and autonomous regions. The HRB is primarily made up of three major water systems: the Hai River, Luan River, and Tuhaimejia River, covering a total area of about 318,000 km2. The terrain of the western part is mainly mountainous, while the eastern part is predominantly plains, with surface runoff from the mountain areas flowing to the plain areas and then eastward into the Bohai Sea. The basin is characterized by a typical temperate monsoon climate, with hot, rainy summers and cold, dry winters. The average annual precipitation is 523 mm, while the average monthly temperature is around 10.0 °C, showing a significant upward trend, with an average maximum monthly temperature of 17.0 °C and a minimum of 4.6 °C. The average annual evapotranspiration in the basin is 979 mm, showing a downward trend. The average annual relative humidity ranges from 50% to 70%, with average annual sunshine hours between 2400 and 3100 h. The basin frequently experiences meteorological disasters such as droughts, floods, sandstorms, and strong winds.

2.2. Data

2.2.1. Hydrological Data

Due to the Haihe River being one of the regions most severely affected by human activities in China, the river’s flow process is influenced by human extraction, usage, and regulation of water, making it difficult for the monitoring data to reflect the actual runoff process. This introduces uncertainty into the calculation of hydrological drought. To ensure the accuracy of this study, hydrological data were first validated through cross verification between the runoff data from 54 runoff observation stations in the HRB from the Hydrological Yearbook (1960–2017) and the latest surface runoff data from China’s third national water resource survey (2023). The two datasets were found to be largely consistent after comparison, ensuring the reliability of the station runoff dataset. Hydrological data processing then selected the runoff data from these stations, which are key control stations evenly covering the main sub-basins (as shown in Figure 1) and capable of comprehensively reflecting the cumulative effects of precipitation, underlying surface conditions, and human activities in the basin. Given the uniform distribution of the stations and their representation of independent hydrological confluence units, arithmetic averaging was used to aggregate the station data into basin-wide runoff series, avoiding artificial interference with natural confluence relationships through weighted processing. Due to the limited length of statistical data series, this study analyzes the runoff data series from 1960 to 2017.

2.2.2. Meteorological Data

To study meteorological drought in the HRB, this research utilizes basic meteorological observation data from China. These data include temperature, atmospheric pressure, humidity, wind, and precipitation. In the HRB, daily data from 32 meteorological stations were selected and processed into monthly data. This includes precipitation (P), average temperature (Tmean), relative humidity (RH), 2 m wind speed (U2), and sunshine duration (SD) on a monthly scale. The time series aligns with the runoff process, covering the years from 1960 to 2017. Meteorological time series were generated by spatially averaging monthly data from the 32 stations using the Thiessen polygon method, which weights each station’s data by its influence area to address spatial heterogeneity in climate variables. Potential evapotranspiration (ET0) was calculated using the Penman–Monteith equation, which requires monthly Tmean, RH, U2, and SD as input parameters. This method is recommended by the World Meteorological Organization for its accuracy in capturing evapotranspiration dynamics under various climatic conditions.

3. Methods

3.1. Drought Feature Identification

3.1.1. Drought Indices

The Standardized Precipitation Evapotranspiration Index (SPEI) is a drought index that considers the sensitivity of evapotranspiration to solar radiation [42], thus better reflecting actual drought characteristics compared with the Standardized Precipitation Index (SPI). The SPEI is calculated using observed precipitation data and [43]’s method for estimating reference evapotranspiration. Its positive and negative values represent wetter and drier conditions, respectively, with higher index values indicating wetter conditions and vice versa. This study utilizes the basic logistic distribution assumption from [44] for meteorological drought analysis.
The Standardized Runoff Index (SRI) is a commonly used index for hydrological drought assessment, similar to SPI [45]. It is generally assumed to follow a gamma distribution [46], so runoff typically follows a gamma distribution [47]; this study fits gamma probability distributions to collected statistical runoff data and then standardizes cumulative probabilities to obtain the SRI.
This study calculated the SPEI and the SRI across all time scales from 1 to 24 months. Through comparative analysis, three representative scales were selected for detailed evaluation: 1 month, 3 months, and 12 months. These scales were chosen because they, respectively, represent meaningful temporal resolutions (monthly, quarterly, and annual) and can effectively characterize the broader patterns within their respective time intervals (short-term, medium-term, and long-term). By focusing on these three scales, the study balances temporal diversity and analytical parsimony, avoiding the redundant display of all scales while retaining the ability to infer patterns across the full range of time scales.

3.1.2. Copula Function

The copula function is a multi-dimensional joint distribution function uniformly distributed in [0, 1], used to analyze the correlation of drought characteristics and the joint probability of occurrence, connecting the marginal distributions of multiple random variables to obtain their joint distribution function [48]. For an n-dimensional distribution function U, the marginal distributions of each variable are U1( x 1), U2( x 2), …, Un( x n). For any x R n , its n-dimensional copula function C is:
U ( x 1 , x 2 , , x n ) = P { X 1 x 1 , X 2 x 2 , , X n x n } = C [ U 1 ( x 1 ) , U 2 ( x 2 ) , , U n ( x n ) ]
where x 1 , x 2 , …, x n are the observed samples, and U ( x 1 ) , U ( x 2 ) , …, U n ( x n ) are the marginal distribution functions.

3.1.3. Trend and Change Point Analysis

The Mann–Kendall (MK) test is a non-parametric statistical method based on data ranks rather than the data itself, initially proposed by Mann and Kendall [49,50] and recommended by the World Meteorological Organization as an effective tool for extracting trends in time series data. Compared with other methods, the MK test is not influenced by individual outliers, enabling it to objectively reflect the overall trend of the sequence, thus finding wide application in analyzing climate parameters, hydrological sequences, and related fields [51]. In this study, the MK test was employed to analyze the temporal evolution trends of meteorological droughts, as well as the pivotal years of trend transitions.

3.2. Correlation Between Meteorological and Hydrological Drought

Wavelet coherence analysis [52] is a method that examines the covariance strength of two time series in the time and frequency domains, capable of revealing the correlation between two time series in the same time–frequency domain and quantifying the synchronicity or lag of the two time series at different time scales (such as monthly and annual scales). In addition, the wavelet regression method can also analyze the relationship between variables. The wavelet regression method aims to construct a prediction model, decomposes the time series into different frequency components through wavelet transformation, and then establishes the regression relationship between independent variables and dependent variables [53]. However, this study mainly aims to reveal the propagation characteristics of meteorological drought to hydrological drought. Therefore, compared with the wavelet regression method, the wavelet coherence method is more suitable for this study. The calculation formula of wavelet coherence is as follows:
R \ 2 = S s 1 W i a b s 2 S s 1 W i a s 2 . S s 1 W i b s 2
where S represents the smoothing operator, and a and b are time series. W i a s and W i b s are the respective wavelet transforms, 0 ≤ R \ 2 ≤ 1.
Wavelet coherence analysis decomposes two time-series into time–frequency domains via wavelet transform. The cross-wavelet spectrum in the numerator represents the joint variability of the two signals, calculated as the cross-wavelet power, while the denominator normalizes this using smoothed auto-wavelet powers via Gaussian filtering to reduce noise and edge effects, ensuring the correlation value ranges between 0 (no synchrony) and 1 (perfect synchrony). In drought studies, this method effectively captures how drought propagation patterns vary at monthly or annual scales by identifying dominant scales where droughts propagate and quantifies time lags via phase angles. We use Morlet wavelets, apply Gaussian smoothing to reduce noise, exclude low-coherence regions for reliability, and apply boundary reflection to avoid spurious results. This approach is ideal for revealing dynamic drought interactions and exploring the correlation between hydrological drought occurrence indicators, which is essential for revealing the main characteristics of hydrological drought in the HRB.

3.3. Identification of Meteorological and Hydrological Drought Events

Yevjevich [54] first introduced the theory of runs in 1967, defining a drought period as a span of time during which the Standardized Precipitation Evapotranspiration Index (SPEI) or Standardized Runoff Index (SRI) continuously falls below the proposed thresholds (i.e., specific values indicating drought conditions). The application of run theory to identify hydro-meteorological drought events has been widely used [55,56], and three characteristic variables are extracted for each drought event: duration D, severity S, peak M. The duration D of a drought is the length of time the drought event lasts, while the severity S characterizes the seriousness of the drought event, represented by the absolute value of the cumulative sum of monthly drought indices. The peak M represents the value of the drought index at the peak of the drought event, corresponding to the absolute value of the minimum drought index.
To address the comparability of drought propagation between meteorological and hydrological systems, consistent threshold criteria were adopted for both indices, following the framework proposed by Yevjevich [54]. The criteria for determining drought event thresholds were as follows: A drought event is initiated when SPEI or SRI values remain ≤−0.5 for two consecutive months, reflecting a sustained deficit in water availability. The event is terminated when the index first rises above −0.5, indicating a recovery to non-drought conditions. Brief intervals (≤1 month) between drought periods, where intermediate values remain <0, are treated as part of the same continuous event, with their durations and severities aggregated to avoid misclassifying short-term fluctuations. Single-month events (SPEI/SRI ≤ −0.5 for only one month) are excluded from the analysis to focus on prolonged drought impacts and ensure methodological consistency in event definition.

3.4. Drought Propagation Lag Time

To identify the lag time of drought propagation, this study employs the Pearson Correlation Coefficient (PCC) to analyze the correlation between meteorological drought and hydrological drought across different lag times from 1 to 12 months. The time scale of the SPEI series corresponding to the highest correlation coefficient is considered the lag time of drought propagation. This calculation method is widely used [22,48,57].

4. Results

4.1. Analysis of Meteorological and Hydrological Drought Characteristics

The relationship between hydrological drought and meteorological drought is very close; meteorological drought is the leading factor for the occurrence of hydrological drought [58]. By analyzing the past 58 years of meteorological elements, the meteorological drought index SPEI, and the hydrological drought index SRI propagation process in the HRB, this study explores the basic characteristics of drought occurrence in the HRB. As shown in Figure 2a,b, precipitation and potential evapotranspiration in the HRB have both shown a declining trend in the past. Through MK mutation analysis, it was found that meteorological drought turned a corner in 1991, with precipitation showing a significant decline before 1991 (p < 0.01), decreasing by 15.24 mm per decade; after 1991, the trend of precipitation change reversed, increasing at a rate higher than the previous declining rate (20.95 mm/10a), which is greatly related to global warming and changes in atmospheric circulation [59]. At the same time, the potential evapotranspiration also shifted from a decreasing trend to an increasing trend around 1991, and this increasing trend was also greater.
Based on the SPEI, further analysis was conducted on the historical changes in meteorological drought, as shown in Figure 2c, the overall SPEI in the HRB has shown a significant downward trend. Before 1991, the SPEI of the HRB showed a declining process, with a smaller magnitude (p < 0.05), and a declining rate of 0.068/10a. During this period, the meteorological drought in the HRB showed an intensifying trend; however, after 1991, a transformation occurred, and in the recent 30 years, SPEI has shown an upward trend (p < 0.05), and meteorological drought has been alleviated, but this trend is not prominent. Overall, the past meteorological drought index SPEI in the HRB has shown a declining trend, indicating an intensifying trend of meteorological drought. However, upon analyzing the SRI, as seen from Figure 2d, the index representing hydrological drought in the HRB, SRI, did not change around 1991. Over the past nearly 60 years, it has always maintained a decreasing trend, and compared with before 1991, the SRI still maintained a declining trend after 1991. Even the trend of increasing hydrological drought severity has become more pronounced, indicating that the hydrological drought in the HRB has not weakened due to the alleviation of meteorological drought.
Furthermore, this study selected three main indicators: drought duration (D), peak (P), and severity (S). Probability distributions such as GEV (Generalized Extreme Value), log-normal, gamma, normal, and Weibull were analyzed for each indicator, with results presented in Table 1. From Table 1, the optimal probability distribution for the peak is the log-normal distribution (AIC = 47.68, K-S test p-value = 0.786). For severity and duration, the GEV distribution is optimal (AIC = 133.38 and 120.73, respectively), balancing model complexity and goodness-of-fit, with K-S test p-values (0.807 and 0.878) confirming distribution validity (both > 0.05). In copula function selection, Clayton, Gumbel, and Frank are three copula types used to model asymmetric or symmetric dependencies. Specifically, the Clayton copula captures lower tail dependence, such as the dependence of extreme drought events; the Gumbel copula captures upper tail dependence, such as the dependence of wet events; and the Frank copula captures symmetric dependence for variables without significant tail extremes. The data were transformed via Probability Integral Transformation (PIT) to uniform variables, and the copula parameters (θ) were optimized using Maximum Likelihood Estimation (MLE). The AIC criterion selected the Frank copula as optimal for all variable pairs (peak and severity (P&S), peak and duration (P&D), duration and severity (D&S)), with minimum AIC values (−36.25, −17.98, −42.12) and corresponding θ (3.62, 2.22, 5.19) (Table 2).
Based on the Frank copula function, we jointly calculated the cumulative probability distribution of the hydrological drought indicators D&S, P&S, and P&D to investigate the propagation characteristics of hydrological drought in the HRB. The results are shown in Figure 3. From the figure, it can be seen that the joint probability value decreases with the decrease in drought characteristic values, showing a positive correlation among the three indicators. At the same time, the contour lines become denser, indicating that the greater the joint exceedance probability, the more likely it is for shorter duration and less intense hydrological drought events to occur in the HRB (Figure 3a); the probability of longer duration and more intense drought events occurring in the HRB is smaller; between drought duration and drought peak, the probability of drought peak does not significantly decrease in the tail extreme area, while the probability of drought duration decreases as the characteristic value increases (Figure 3b); and a similar pattern exists between drought severity and drought peak, where the probability of greater drought severity under a drought peak is lower (Figure 3c). It is evident that hydrological drought events occurring in the HRB have a significant positive correlation in terms of drought duration, peak, and severity, with the main type being those of short duration, low peak, and weak severity.

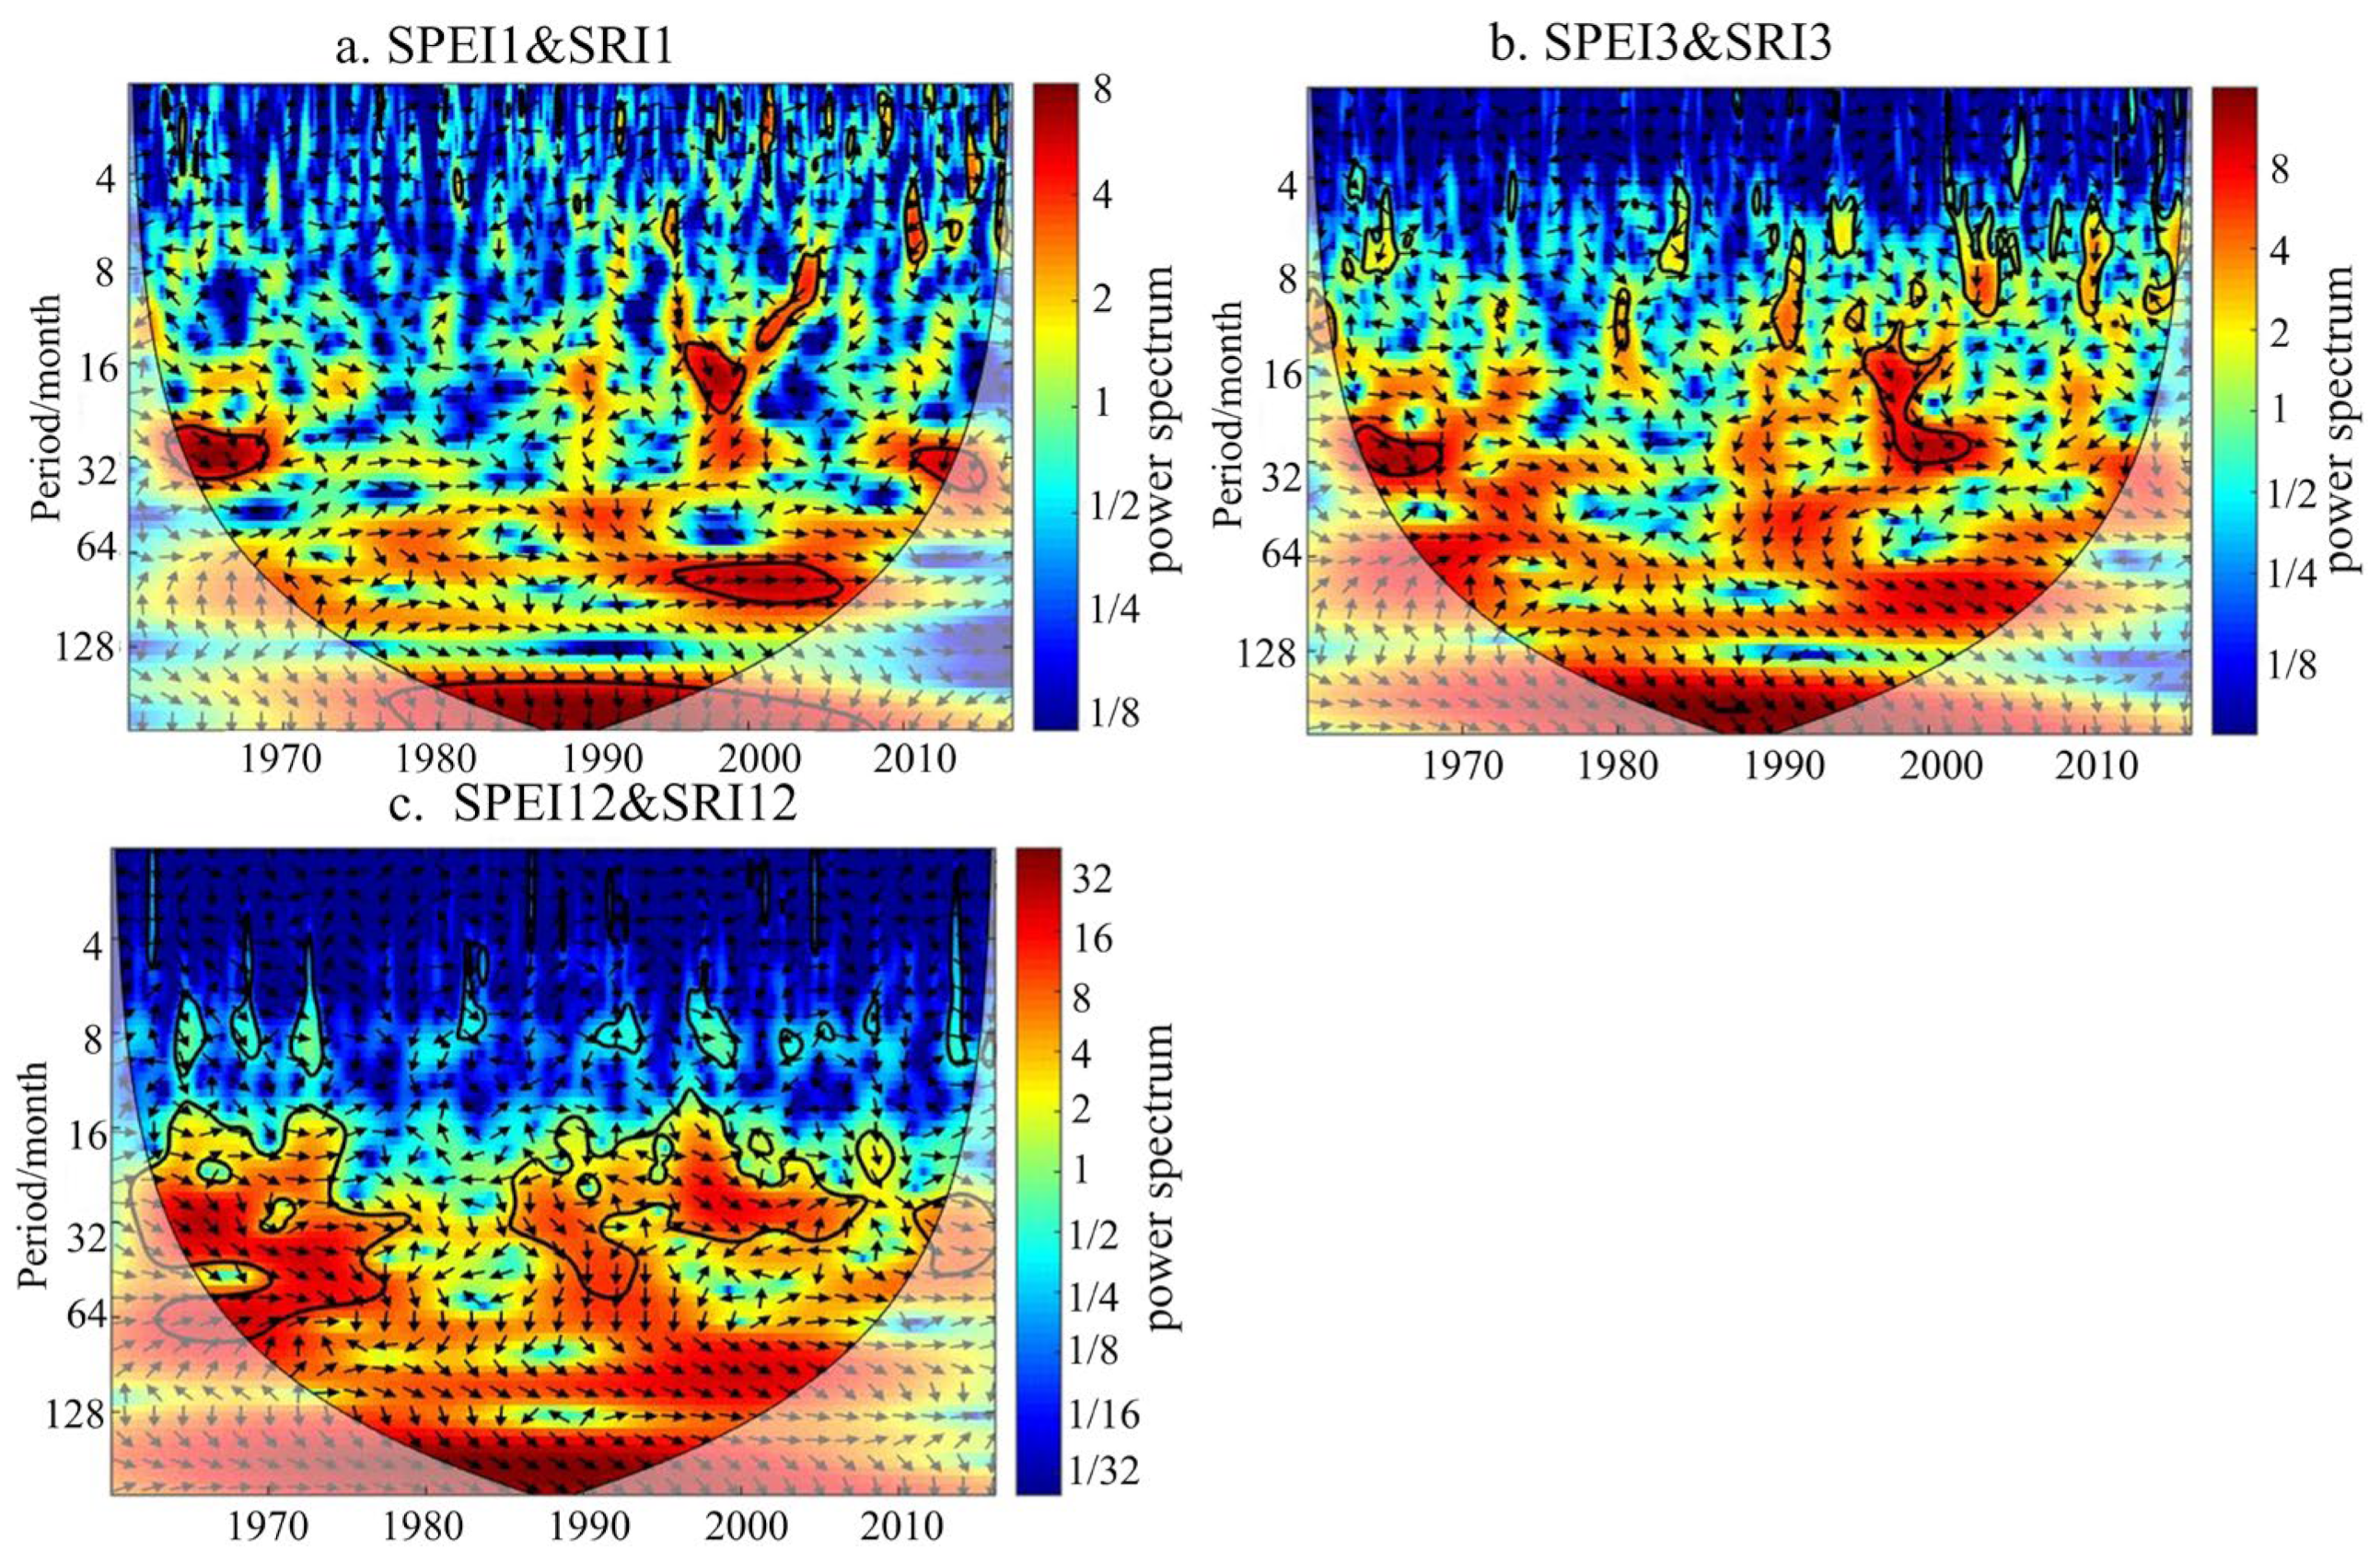
4.2. Correlation and Propagation Pathways Between Meteorological and Hydrological Drought

Hydrological drought typically does not occur independently of meteorological drought. To explore the correlation between meteorological and hydrological drought propagation, this study selects meteorological drought indices and hydrological drought indices at three different time scales: monthly (SPEI1/SRI1), seasonal (SPEI3/SRI3), and annual (SPEI12/SRI12), and performs cross-wavelet transforms. The cross-wavelet transform allows for the exploration of the non-linear relationships and significance between two datasets in the time–frequency domain, as shown in Figure 4. Figure 4a shows that SPEI1 and SRI1 have five distinct resonance periods, displaying a positive phase relationship, with the strongest positive correlation occurring between 1995 and 2005, approximately a 6-year cycle. SPEI1 and SRI1 are related over relatively long resonance periods, possibly due to atmospheric circulation influences. SPEI3 and SRI3 show significant positive correlations over two clear resonance periods in Figure 4b, with SPEI3 leading SRI3 by 1.5 months. SPEI12 and SRI12 show a positive correlation throughout the entire study period in Figure 4c, with resonance periods mainly ranging from 16 to 64 months. From 1960 to 1980, SPEI12 leads SRI12 by 1.5 months, and from 1985 to 1995, it leads by three months. The cross-wavelet analysis reveals that as the time scale increases, the correlation between the SPEI and the SRI gradually strengthens, with the strongest correlation at the annual time scale among the monthly, seasonal, and annual scales.
The relationship between meteorological drought and hydrological drought is not characterized by a simple linear driving relationship. We conducted research on the propagation pathways of meteorological drought to hydrological drought based on the calculated results of the annual-scale SPEI and SRI with the highest correlation. Figure 5a illustrates the propagation process of meteorological drought and hydrological drought from 1960 to 2017, indicating the existence of four propagation pathways. Firstly, the most common propagation pathway occurs when meteorological drought reaches a corresponding threshold, triggering the occurrence of hydrological drought. This is demonstrated in Figure 5b, where the meteorological drought and the hydrological drought occurred from September 1965 to June 1967, with the meteorological drought lasting for 11 months and subsequently leading to a 22-month hydrological drought. Additionally, the droughts in June 1972, October 1997, and July 2014 also followed this propagation pathway. However, not all meteorological droughts evolve into hydrological droughts. For instance, from July 1967 to August 1968, despite a 14-month duration of meteorological drought, a hydrological drought did not occur (Figure 5c). This is attributed to the duration or severity of the meteorological drought being below a certain threshold. Hydrological drought propagation has critical thresholds [57]. Nevertheless, it should be noted that the continuous occurrence of meteorological droughts can also trigger hydrological droughts, as seen after August 1968 when an increase in the intensity of meteorological drought led to hydrological drought, representing the second propagation pathway. On the other hand, the propagation of meteorological drought is not the sole driving factor for the formation of hydrological drought. As shown in Figure 5d, from June 1961 to May 1972, an 11-month hydrological drought occurred. During the same period, the HRB was relatively moist, and a meteorological drought did not occur. This propagation process represents the third pathway. The occurrence of such a hydrological drought is closely related to the influence of human activities [60]. Lastly, a hydrological drought may also result from the accumulation of multiple meteorological droughts, as depicted in Figure 5e. From December 1980 to July 1990, a continuous hydrological drought occurred (SRI < 0), while five intermittent meteorological drought events occurred (SPEI < 0), triggering the hydrological drought event. Similarly, multiple meteorological drought events in April 2004 led to a hydrological drought event, representing the fourth propagation pathway.

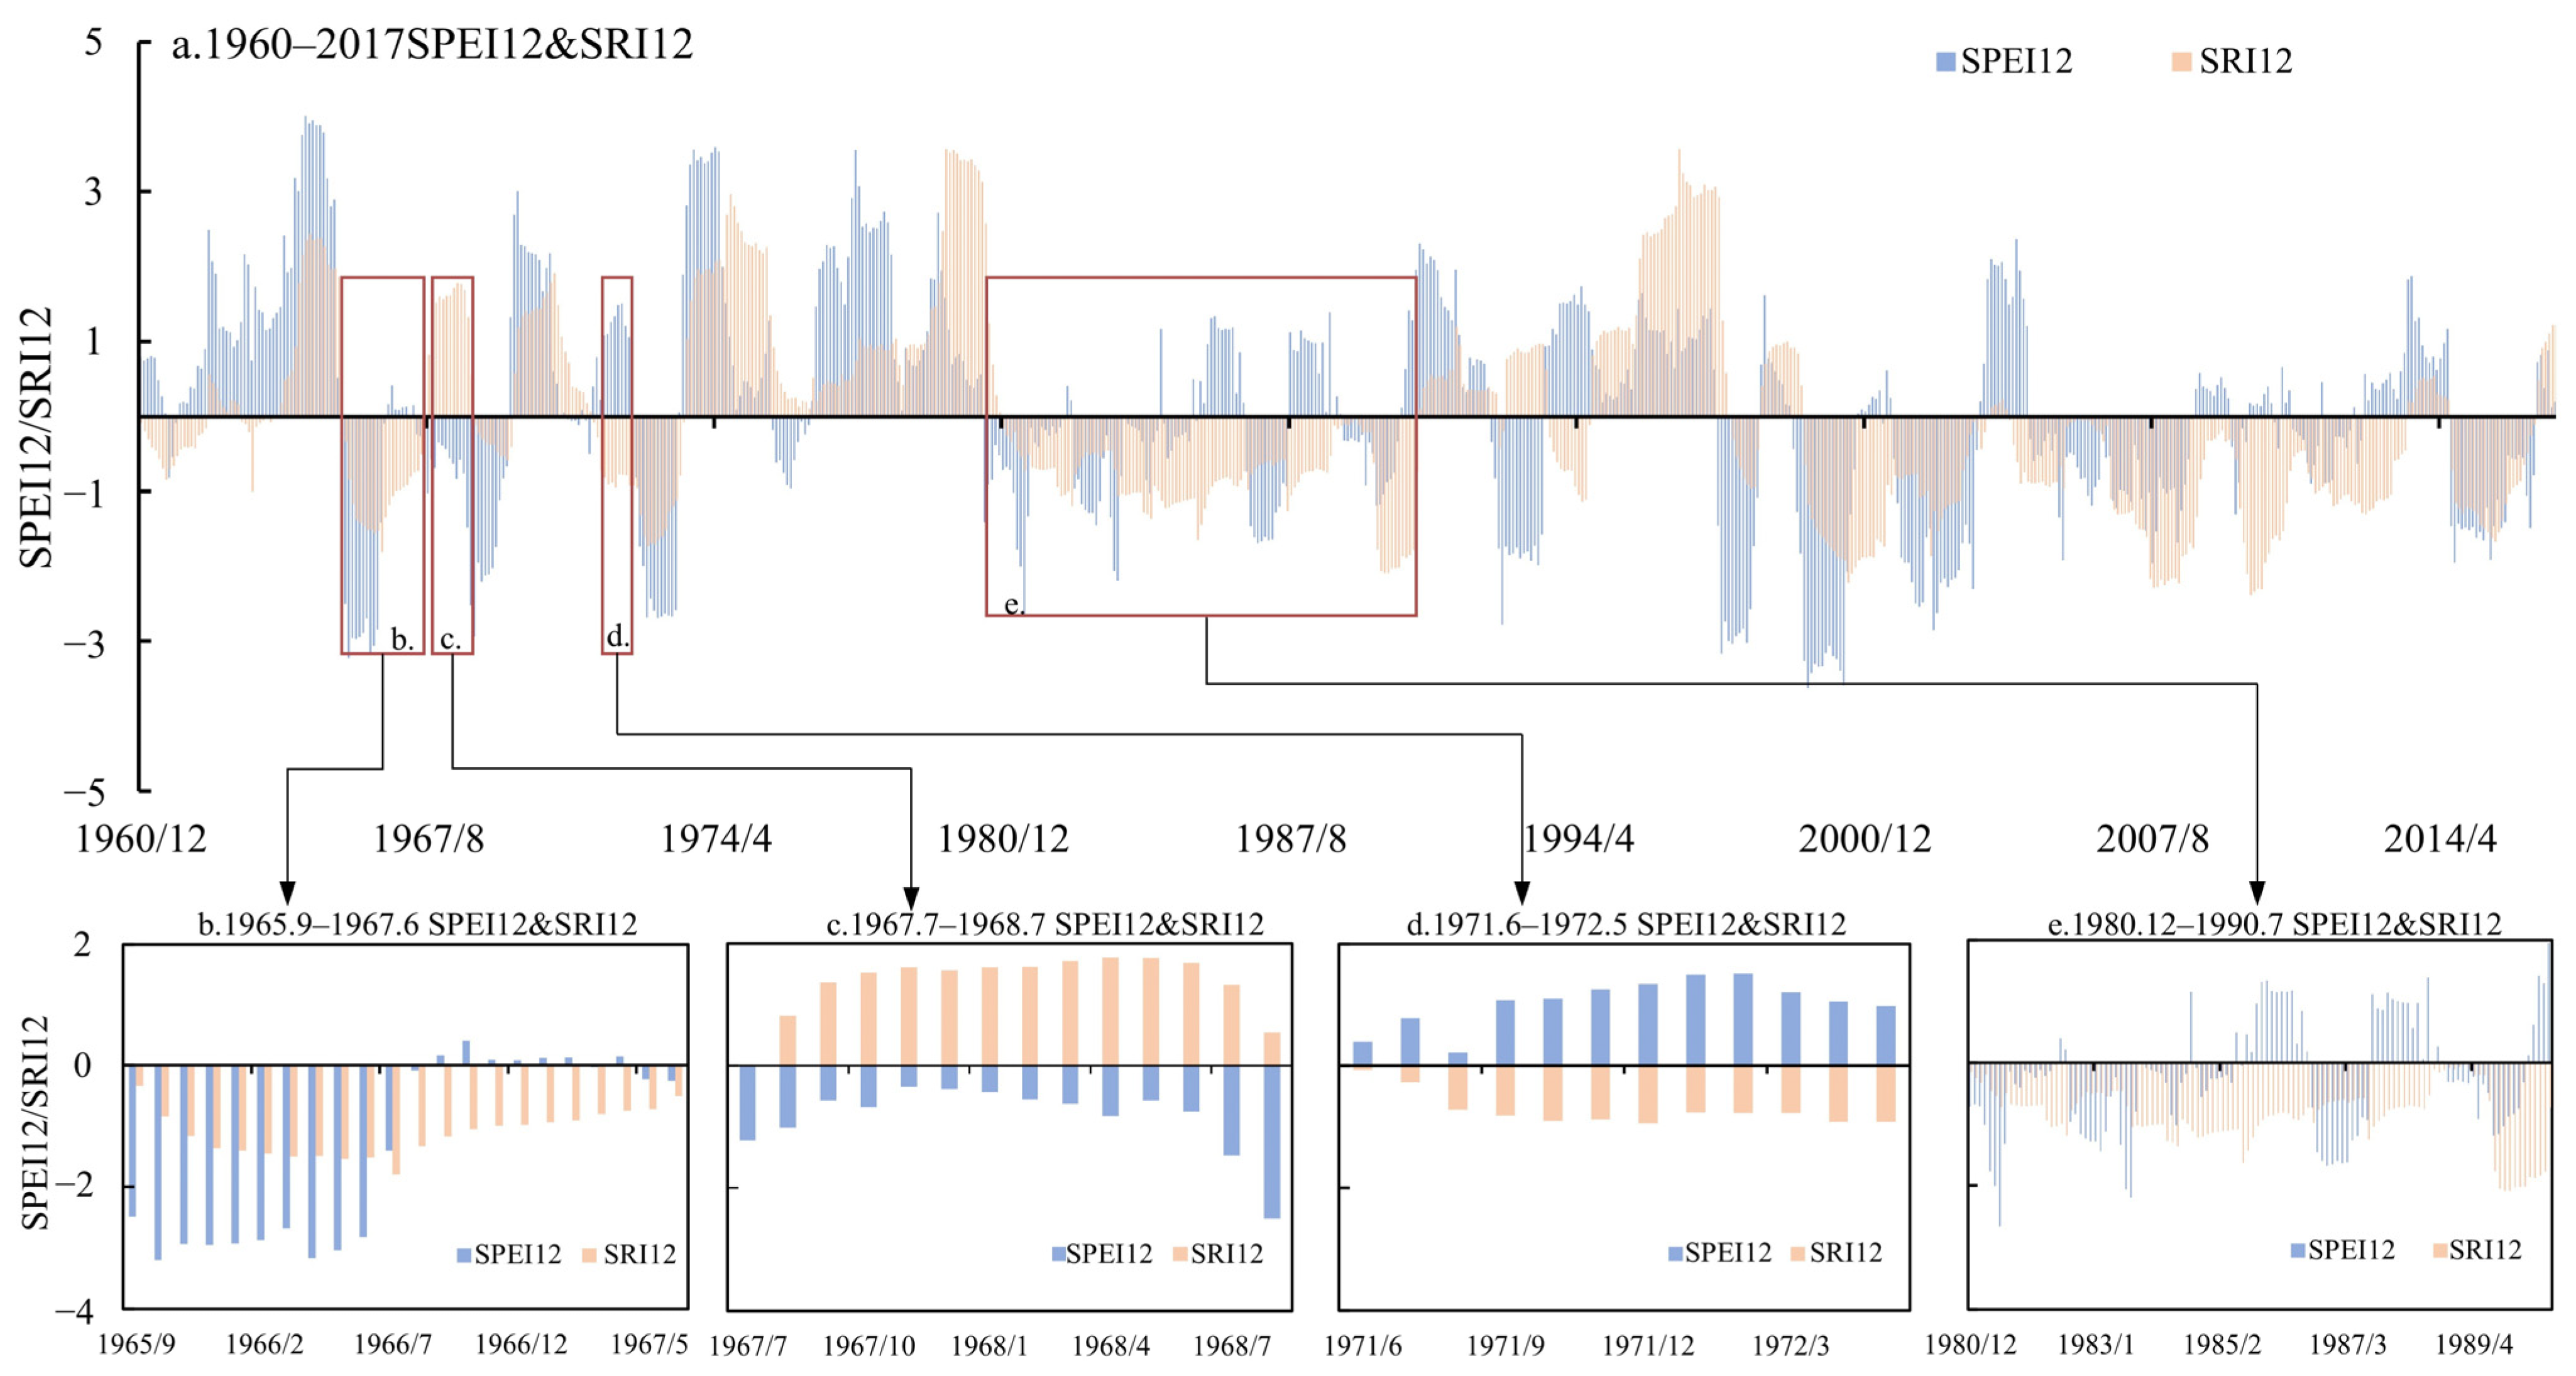
4.3. Analysis of the Evolution of Characteristics in the Propagation Events of Meteorological Drought to Hydrological Drought

Based on the above analysis, it is evident that hydrological drought and meteorological drought are strongly correlated on an annual scale. However, not all occurrences of meteorological drought lead to hydrological drought, and likewise, not all hydrological droughts are caused by meteorological drought [61]. To investigate the process of hydrological drought propagation caused by meteorological drought in the HRB, this study utilized run theory to extract the major meteorological and hydrological drought events that occurred from 1960 to 2017 (nearly 60 years), to explore the relationship between hydrological drought occurrences and meteorological drought. It also analyzed the changes in characteristic values corresponding to drought events, such as drought duration, severity, and peak. By using run theory to match drought events, it is possible to exclude drought events without direct causal relationships [62] and it can also compensate for the limitations of the SPEI and the SRI in accurately reflecting actual drought conditions [63]. This study considers multiple meteorological drought events with a short duration and intervals as a single drought event [60] and excludes meteorological drought events that did not evolve into hydrological drought events. The results are shown in Figure 6.
Over the past nearly 60 years, the HRB has experienced 24 meteorological droughts to hydrological drought propagation events. With 1991 as the year of change, 12 drought events occurred both before and after 1991, with no significant difference in drought duration and severity characteristics, as the division of drought events focuses on the occurrence of hydrological drought propagation. In the history of drought propagation events in the HRB, the shortest meteorological drought lasted 2 months, and the longest lasted 19 months, while the shortest hydrological drought also lasted 2 months, and the longest lasted 26 months. From the run theory results (Figure 6), it can be observed that past drought events can be roughly divided into three propagation periods. It was observed that 1960–1971, 1980–1997, and 2001–2015 were the three major periods of drought occurrence, with the statistical analysis of the drought propagation characteristics of the three periods shown in Table 3.
Over the past 58 years, the three major periods showed a trend of gradually increasing drought severity. In general, the total duration of meteorological droughts was 127 months, with 55 months occurring after 2001, accounting for 43.3% of the total drought events, where both meteorological drought severity and peak reached the maximum (15.8 and 2.5); while the total duration of past hydrological droughts was 147 months, with 72 months occurring after 2001, accounting for 49.0% of the total duration, the longest period among the three, with both drought severity and peak reaching the highest (22.0 and 2.5, respectively). It is evident that both meteorological and hydrological droughts in the HRB are intensifying and, from Figure 6 and Table 3, it can be more clearly observed that hydrological drought has surpassed the severity of meteorological drought since 2001, a phenomenon not mentioned in previous research.

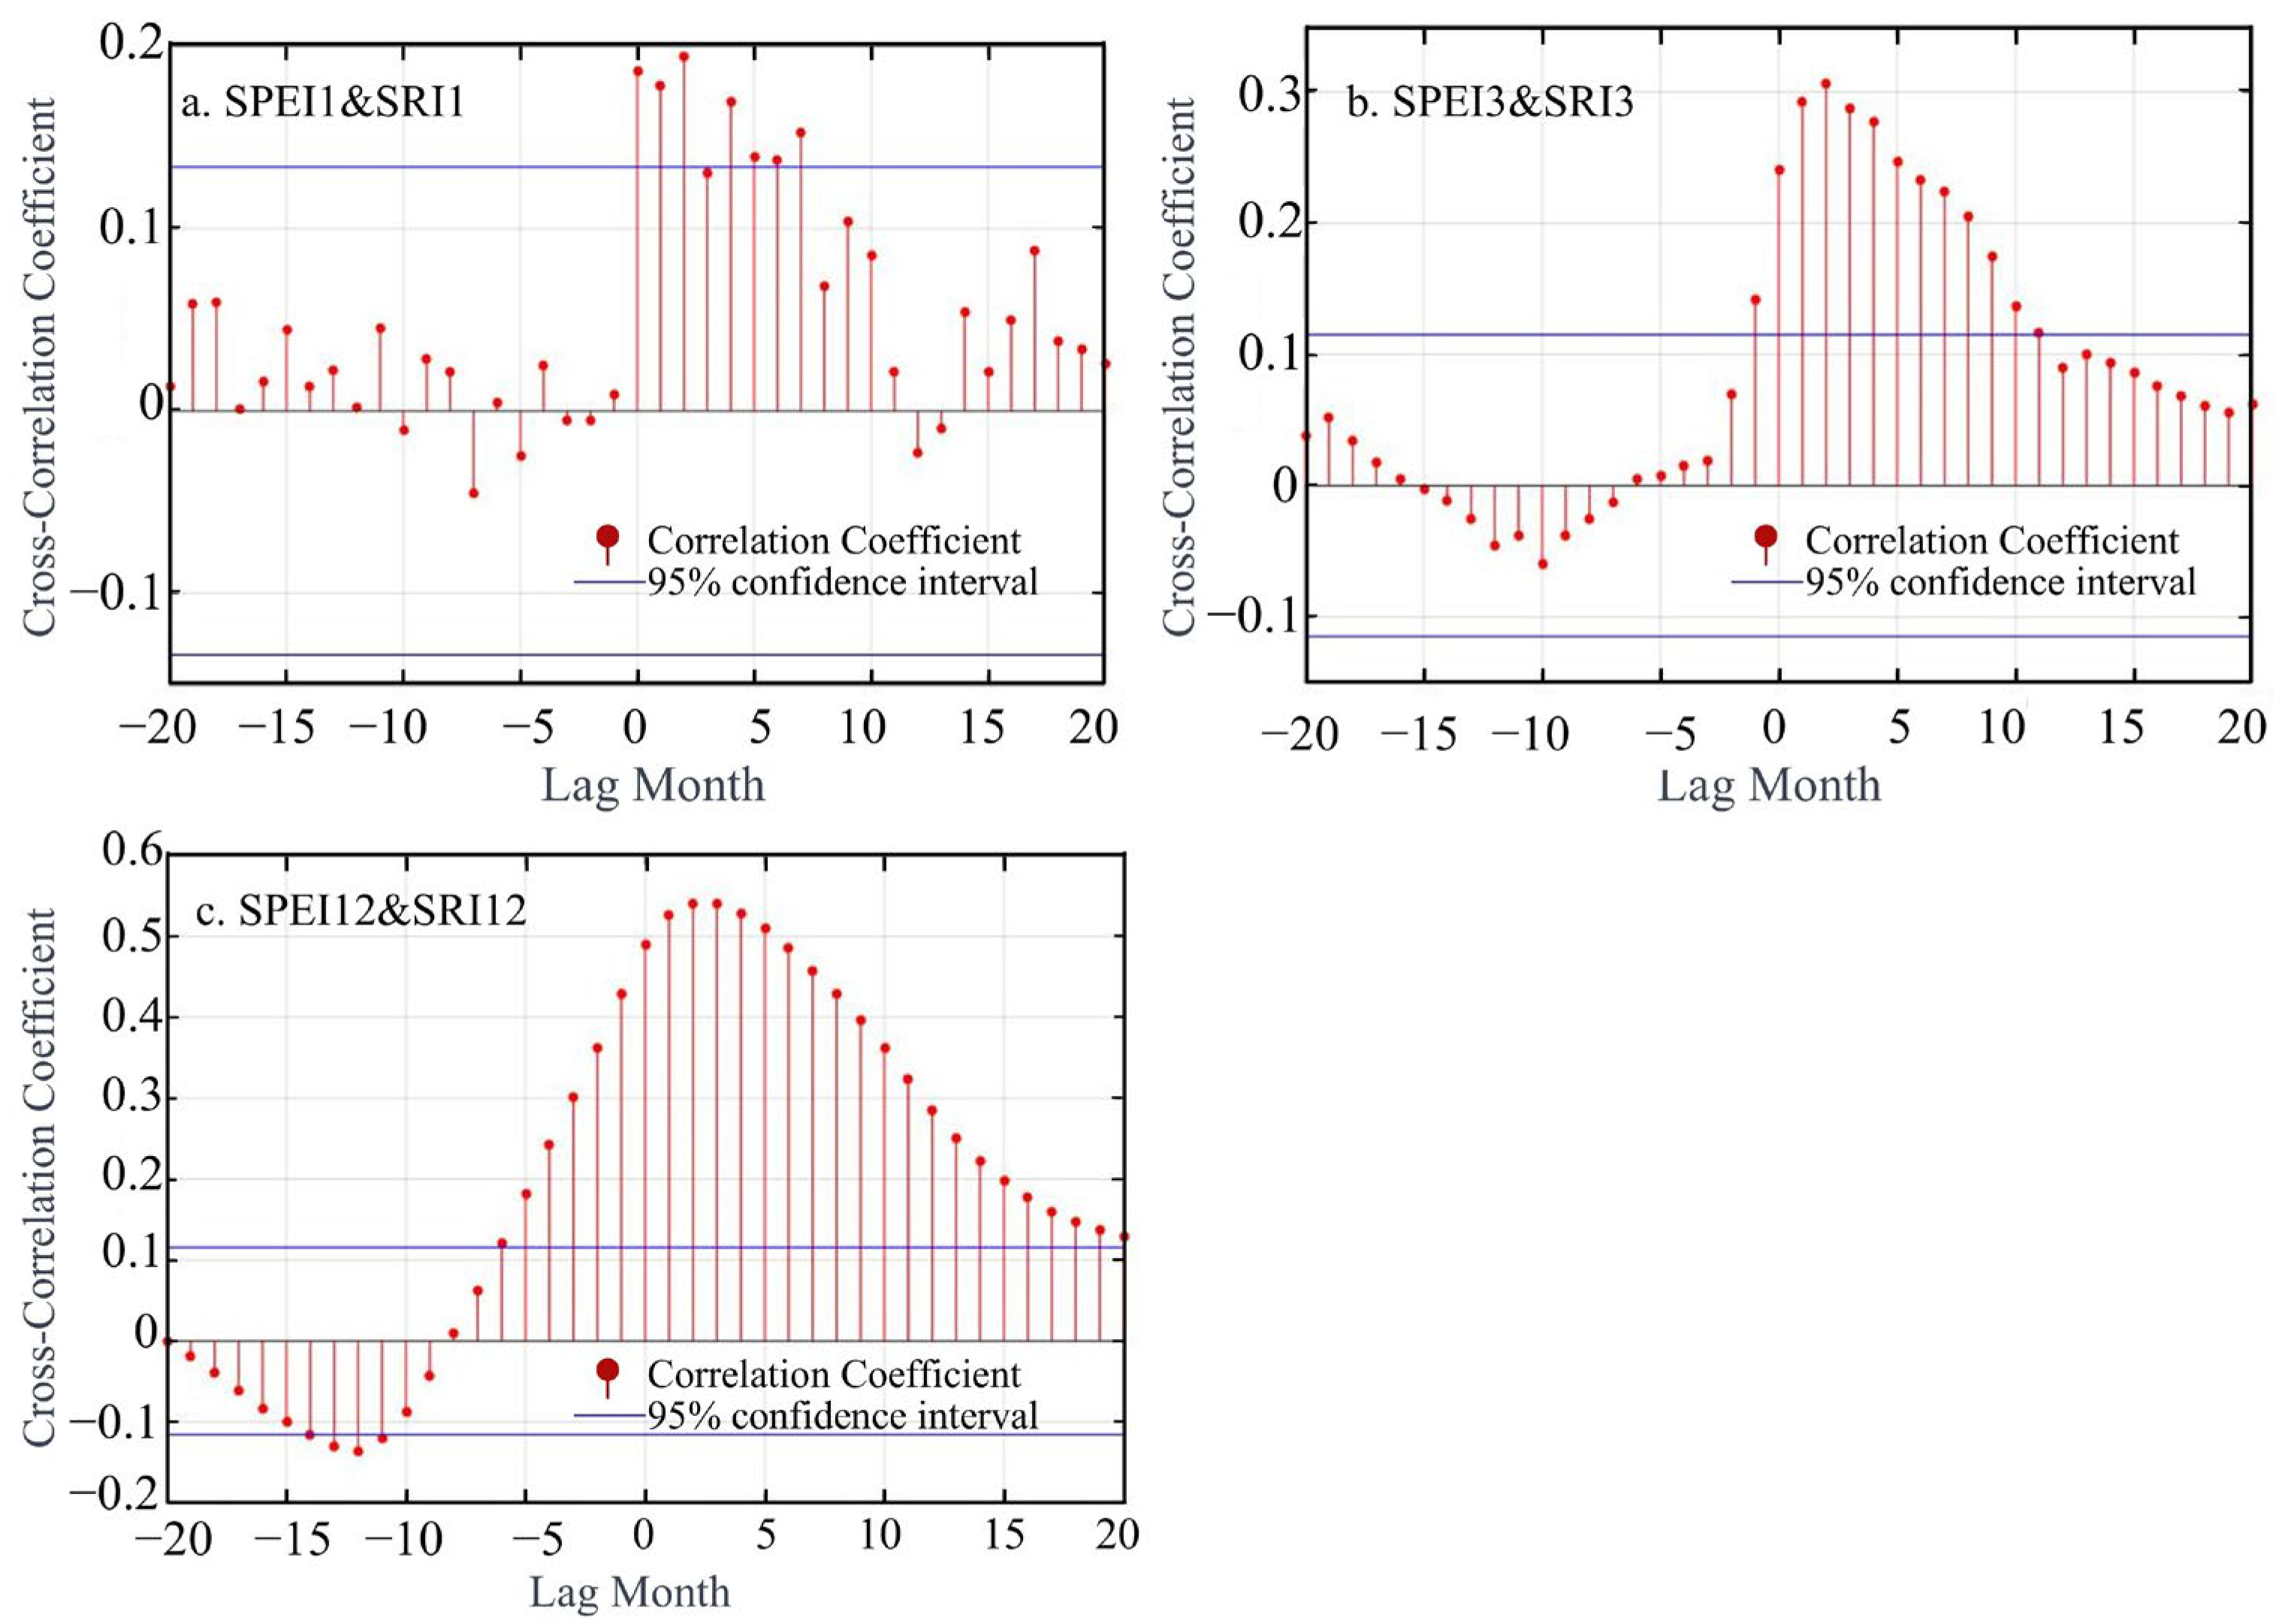
4.4. Analysis of Lag Time in the Propagation from Meteorological to Hydrological Drought

In the transmission from meteorological to hydrological drought, a prevalent lag phenomenon persists. This section further employs cross-correlation functions to analyze the lag periods of meteorological–hydrological drought at monthly, seasonal, and annual time scales, as illustrated in Figure 7. At different time scales, by examining various lag times and calculating the correlation coefficients between the SPEI and the SRI, the lag time corresponding to the maximum correlation coefficient is considered as the lag time. From Figure 7, it is evident that the correlation of meteorological–hydrological drought strengthens with increasing time scales. At the monthly time scale, the trend of correlation between meteorological drought and hydrological drought is not prominent, while significant trends are observed at the seasonal and annual scales. However, regarding lag time, it can be observed that both monthly and seasonal scales reach their maximum correlation coefficients at a lag of two months, whereas at the annual time scale, the maximum correlation coefficient is attained at a lag of three months.
Based on the conclusions drawn from Figure 7, the correlation of drought propagation at the annual scale was the strongest. Therefore, this study further analyzes the annual-scale meteorological and hydrological drought indices, which performed best in terms of cross-correlation coefficients, using the Pearson correlation coefficient and obtained the same conclusions. This method has been widely used in previous studies on similar topics [64]. Using Pearson’s correlation analysis to study the lag time of hydrological drought relative to meteorological drought in the HRB, among 12 propagation scenarios, the propagation time from meteorological drought to hydrological drought ranges from 0 to 11 months. The results show that when hydrological drought lags 2 and 3 months behind meteorological drought, the correlation between the two is greatest, with a correlation coefficient of 0.54 (Figure 8).

5. Discussion

5.1. Comparison with Other Studies

Global climate change and human activities have intensified changes in the global hydrothermal balance, leading to more frequent occurrences of droughts [24], and the HRB is no exception. This study comprehensively analyzes the changing characteristics and propagation patterns of meteorological and hydrological droughts in the HRB. In the past nearly 60 years, with 1991 as a turning point, the meteorological drought index showed a trend of initially decreasing and then increasing. However, overall, the meteorological drought index after 1991 was lower than before 1991, indicating more severe meteorological drought conditions post 1991. This aligns with the findings of Ling’s study [65]. This phenomenon is mainly due to the decrease in precipitation from 660 mm in 1990 to 361 mm in 1997, a 45.3% reduction. Although precipitation showed a rebounding trend afterward, the drought index remained lower compared with the previous period. During the same period, the hydrological drought index in the HRB showed the same decreasing trend, partly due to the propagation of meteorological drought and partly due to the intensified occurrence of hydrological drought caused by human activities [60,61,66]. Affected by both natural factors and human activities, hydrological drought events in the HRB exhibit longer durations compared with meteorological drought events, while their intensities and peaks are similar to those of meteorological droughts. However, it is noteworthy that in the recent period from 2001 to 2015, the severity of hydrological droughts has consistently surpassed that of meteorological droughts.
The time it takes for meteorological drought to propagate to hydrological drought is also influenced by multiple factors, including natural elements and human activities. Using Pearson’s correlation analyses, this study found that the lag time for the propagation from meteorological to hydrological drought in the HRB is three months. Compared with previous research, the lag time for the propagation of meteorological drought to hydrological drought varies among different regions. Zhang X [15] found that hydrological drought generally occurs 2–4 months after meteorological drought in the Yangtze River Basin. Wang, H [57], based on spatial datasets and using Pearson’s correlation analysis for the central Yunnan Plain in southwest China, determined that the months with the highest correlation coefficients indicate the lag months, showing that the lag time in the Dianzhong region ranges from 1 to 9 months, with longer times corresponding to higher levels of drought severity. Botai [67] and Zhang [68] studied the propagation process of meteorological drought in South Africa and found that during severe drought conditions, the lag time for drought propagation is 1–2 months. For long-duration events, the drought propagation lag time across South Africa ranges from 1 to 24 months, reflecting its unique climatic–hydrological interactions. Additionally, this study summarizes the different regional research conclusions in Table 4. The results from various regions vary significantly, which may relate to the climatic conditions of the basins; for instance, Zhou, Z [56] suggest that drought propagates faster in humid areas than in arid areas because the water cycle rate and moisture transport in humid regions are faster, thus shortening the drought propagation process. However, according to the statistical data in this study, this result may not be entirely applicable as the speed of propagation is also related to terrain changes [69,70], land surface conditions [63,71], vegetation coverage [72,73], and human activities [74], leading to significant differences in actual drought propagation times. In conclusion, this paper considers the research finding that the lag time for hydrological drought in the HRB, lagging three months behind meteorological drought, to be relatively reliable.
Furthermore, as can be seen from the propagation thresholds compiled in Table 4, there are fewer conclusions regarding critical propagation thresholds [75]. This is because, in drought propagation studies, the statistics of the time when hydrological drought occurs following meteorological drought are clearer. ‘Lag time’ studies the ‘delay time’ of hydrological drought occurrence compared with meteorological drought. Meanwhile, ‘propagation thresholds’ are more complex, concerning the ‘threshold’ for the propagation of meteorological drought to hydrological drought. Wang, H [57] used the Bayesian conditional probability method to determine that the thresholds for the propagation of meteorological drought to hydrological drought in the central Yunnan Plain range from 1.08 to 2.57 months. Guo, Y [76] used drought indices and run theory to study the thresholds of different levels of meteorological drought propagating to hydrological drought in the Wei River Basin, finding that the thresholds for moderate to extreme drought propagation range from 7.5 to 27.5 months. This study attempted to quantify drought propagation thresholds via non-linear fitting, but in-depth analysis revealed that the complex hydrological–human interactions in the Haihe Basin challenge the applicability of traditional threshold fitting methods. This issue requires further exploration using mechanistic models and long-term observational data, which will be our future research direction.
Table 4. Lag time and propagation threshold of meteorological drought to hydrological drought in previous studies.
RegionLag Time
(Month)
Propagation Threshold
(Month)
Source
Yangtze River Basin, China2–4-[15]
Central Yunnan, China1–91.08–2.57[57]
Pearl River Basin China2–5-[56]
India1–3-[77]
Wei River Basin, China-7.5–27.5[76]
Luanhe River Basin, China1–7-[61]
Henan, China1–6-[71]
Hanjiang, China6–10-[48]
United Kingdom1–9-[78]
Awash Basin, Ethiopia4–6-[79]
Western Cape, South Africa1–2-[67]
South Africa1–24-[68]

5.2. Has the Mechanism of Propagation from Meteorological Drought to Hydrological Drought Changed?

In the study of drought propagation, scholars often focus more on how meteorological drought propagates to hydrological drought, including propagation characteristics [58,80], propagation lag [21,81], the main influencing factors of the propagation process [65,82], etc. However, besides the traditional research content, this study also discovers a more interesting phenomenon, that is, the mechanism of meteorological drought propagating to hydrological drought may have changed.
Looking back at the trend graphs of the SPEI and the SRI shown in Figure 2 of this paper, it can be observed that before the turning point of 1991, both the meteorological and hydrological drought indices showed the same decreasing trend. However, after the 1991 turning point, their trends exhibited opposite changes: the meteorological drought index gradually rebounded, but the hydrological drought index continued to decrease, meaning that meteorological drought was alleviated, but hydrological drought became even more severe. From the run theory analysis results—Figure 6 and Table 3—it can also be seen that the peak, severity, and duration indices of hydrological drought have completely surpassed those of meteorological drought in recent years. Does this imply that the mechanism of propagation from meteorological to hydrological drought has changed? In other words, is the occurrence of hydrological drought gradually becoming disconnected from meteorological drought?
As is well known, under natural conditions, the occurrence of hydrological drought is caused by meteorological drought [77]. Meteorological drought is the phenomenon of water shortage caused when short-term precipitation falls below the long-term average [81], while the occurrence of hydrological drought is due to regional precipitation being below the average, resulting in surface water levels (such as lakes and rivers below the multi-year average depth) being below the long-term average [83]. From the perspective of water balance, it is known that under natural conditions, this propagation process will definitely occur, the changes in hydrological and meteorological droughts should have the same trends, and their propagation rate is influenced by the characteristics of the basin [78].
However, this study observes that in the HRB, where both natural variability and anthropogenic influences shape hydrological processes, drought propagation dynamics appear to have shifted over time. This shift, while not definitively attributed to human activities alone, is not unexpected in a basin characterized by intensive water management, rapid urbanization, and chronic groundwater depletion, which are known to disrupt natural drought pathways [84]. Numerous studies indicate that current droughts result from a combination of climate change and human activities [48,85,86], where human activities mainly affect the propagation process of hydrological drought [87], because the occurrence of hydrological drought is due to short-term regional precipitation being below the average, resulting in surface runoff lower than the multi-year average, with precipitation being the main source of water input in a region over a period under natural conditions. If human activities are considered, hydrological drought is a phenomenon caused by all short-term regional water inputs being less than the long-term average, leading to insufficient runoff. Therefore, if the distribution of regional water input is altered on a spatiotemporal scale, the connection between hydrological drought and meteorological drought (dominated by insufficient precipitation) gradually weakens, which is the fundamental reason for the disconnect between meteorological and hydrological drought propagation.
Human activities make the drought propagation process more complicated [85,88]. Many scholars have observed this phenomenon, increasingly introducing non-linear methods to explore the relationship between meteorological and hydrological droughts in the propagation from meteorological to hydrological drought [48,81], as traditional linear analysis methods are gradually becoming inapplicable [89]. Human activities can either promote or exacerbate hydrological drought, by affecting water storage in reservoirs [60,90] and inter-basin water transfer [82], for which reservoirs have a complex effect. Reservoirs alter the distribution of river water, storing river flow during the flood season, increasing the risk of drought during the flood season and hydrological drought downstream [91], but releasing flow during non-flood seasons, reducing the risk of hydrological drought during non-flood seasons. Additionally, small reservoirs may exacerbate the occurrence of hydrological drought [92], generally weakening the propagation from meteorological to hydrological drought, raising the propagation threshold of hydrological drought [81]. If inter-basin water transfer involves water being transferred in, it increases the regional surface water volume, mitigating the severity of hydrological drought [93], but if it involves water being transferred out, it can drastically exacerbate hydrological drought, such as in China’s Han River Basin [48]. On the other hand, human activities are more likely to exacerbate the occurrence of hydrological drought [94], including water abstraction from rivers [28], groundwater extraction [95], agricultural irrigation [23,96], soil and water conservation projects [97], returning farmland to forest [60], urbanization [61], etc., all of which can cause or further exacerbate hydrological drought.
Human activities in the Haihe River Basin (HRB) since the 1990s have significantly altered the natural hydrological cycle, exacerbating hydrological drought and reshaping water resource dynamics. Surface water runoff has drastically declined, with mountainous river discharges decreasing by over 50% compared with the 1960s, and seasonal river discontinuities becoming prevalent in the plains [98]. This decline, disproportionate to the 5.4% reduction in precipitation, is primarily attributed to reservoir construction (e.g., 26 large reservoirs built between the 1960s and 1970s intercepting 63% of runoff), expanded agricultural irrigation (15% increase in irrigated area since the 1980s), and urbanization-driven water demand. Concurrently, groundwater overexploitation peaked in the 1990s–2000s, with annual deficits reaching 6.135 billion m3 in the plains, leading to extensive groundwater depression cones [39]. By 1995, these cones covered 41,900 km2, with groundwater tables dropping from 15 m to 25 m in urban areas, primarily due to agricultural irrigation accounting for 70% of groundwater use [39]. To address water scarcity, the HRB became the world’s largest recipient of inter-basin water transfers, with the South–North Water Transfer Project’s emergency phase (pre-2014) delivering 1.6–5.2 billion m3 annually to urban centers [99]. However, early transfers prioritized urban needs, leaving the agricultural dependence on groundwater unaddressed—agriculture still accounted for 65% of total water use in 1998, exacerbating groundwater depletion in rural areas [39]. Agricultural water use itself increased sharply in the 1990s, driven by expanded cropland (a 15% increase since the 1980s) and inefficient flood irrigation (85% of practices). Collectively, these human activities—surface water diversion, groundwater overexploitation, unsustainable irrigation, and partial mitigation via inter-basin transfers—have transformed the HRB’s drought dynamics from meteorologically driven to anthropogenically amplified, underscoring the urgent need for integrated water resource management.
The phenomenon of the disconnect between hydrological and meteorological droughts in the HRB may have arisen from this. Not only in the HRB, but similar phenomena have also been observed in the Yellow River Basin [14]. In the future, meteorological droughts in the HRB may gradually weaken [100], but if the impact of human activities is not restricted, the uncertainty of hydrological drought occurrence will become increasingly severe, and it is even possible that hydrological droughts could occur without meteorological droughts, making the occurrence of hydrological droughts more difficult to predict. This phenomenon warrants our vigilance and efforts to prevent its occurrence. The details are shown in Table 5.
It should be noted that this study still has certain limitations. A key limitation of this study is the inability to fully isolate the independent effects of climate change and human activities on drought propagation. While we identified significant trend divergences between meteorological (SPEI) and hydrological (SRI) droughts after 1991 (Figure 2), the relative contributions of climate factors (e.g., increased evapotranspiration due to warming) versus anthropogenic interventions (e.g., reservoir regulation or groundwater extraction) remain unquantified. Future research could integrate climate model outputs with high-resolution human water use data (e.g., reservoir operation records or groundwater abstraction rates) to decompose their individual impacts on the precipitation–runoff relationship and drought propagation. Moreover, although this study analyzes nearly 60 years of meteorological and runoff drought data, extending the time series using historical reconstructed datasets could provide a more comprehensive understanding of drought propagation trends over centuries. Such analyses would help distinguish decadal fluctuations from true long-term changes, particularly in a basin profoundly affected by both climate variability and anthropogenic interventions.
Additionally, it is important to note that while this section preliminarily suggests that human activities have caused the decoupling between meteorological and hydrological droughts, this study only provides preliminary conclusions derived indirectly from trend comparison analysis—rather than directly analyzing the direct impacts of various human activities on hydrological droughts. Therefore, the current analysis remains qualitative, and future research is needed to conduct more in-depth quantitative analyses to reveal the specific quantitative drivers of hydrological droughts caused by different human activities.
Finally, this study primarily used in situ station monitoring data rather than remotely sensed datasets, driven by the need for basin-scale analysis. By averaging the data to analyze overall runoff and meteorological series across the Haihe River Basin, this approach effectively reduced local noise. However, the station data have limitations: they reflect only point-scale information, making it difficult to fully capture area-scale spatial heterogeneity, and spatial alignment between meteorological and hydrological stations poses challenges. While remotely sensed data can be used to study area-scale patterns, their accuracy still requires validation under complex conditions. Future research could integrate high-resolution remote sensing data with in situ observations to further dissect the heterogeneity of drought propagation at the sub-basin scale, enabling a more comprehensive understanding of drought propagation across the different spatial regions of the entire Haihe River Basin and the impacts of human activities.

6. Conclusions

In the increasingly severe “human-influence era”, understanding the propagation patterns of meteorological drought to hydrological drought in the regions most affected by human activities is crucial for mitigating the hazards caused by drought. This study comprehensively analyzed the propagation characteristics of meteorological droughts to hydrological droughts in the HRB over the past 60 years. Based on drought indices and correlation analysis, drought propagation times were calculated. Our results indicate:
  • Over the past 60 years, there has been an overall trend of worsening drought severity in the HRB. In 1991, there was a turning point where the SPEI shifted from a decreasing trend to an increasing trend, while the SRI continued to decline, with a greater decrease.
  • Joint probability analysis shows that the HRB mainly experiences short-duration, low-peak, and weak-severity hydrological drought events.
  • There is a positive correlation between meteorological drought and hydrological drought, with five distinct positive correlations at the monthly scale and two at the seasonal scale, with the strongest correlation at the annual scale.
  • There are four main pathways for the propagation of meteorological drought to hydrological drought, with meteorological drought leading to hydrological drought being the main propagation process.
  • The propagation of meteorological drought to hydrological drought is divided into three major periods. In the third period (2001–2015), the duration of hydrological drought accounts for 49% of the total duration, with hydrological drought severity exceeding that of meteorological drought.
  • Hydrological drought occurrence lags behind meteorological drought by three months.
It has been suggested that once a basin experiences drought, it may never fully recover [103]. Therefore, it is essential to be vigilant about the impact of anthropogenic factors on hydrological drought. This study takes the Haihe River Basin, which is strongly affected by human activities, as a typical case, and the revealed propagation characteristics are region specific. Future research can distill the common laws of drought propagation under different intensities of human activities through comparisons among multiple river basins. This study provides new insights into future hydrological drought management and response in the HRB and has implications for hydrological drought research in other basins.

Author Contributions

Conceptualization, K.L., B.G. and Q.W.; Data curation, K.L., Y.C. and B.G.; Funding acquisition, J.Z. and Y.Z.; Investigation, Y.C. and L.Z.; Methodology, K.L. and B.G.; Software, L.Z.; Supervision, K.L., L.Z. and Y.Z.; Writing—original draft, K.L. and B.G.; Writing—review and editing, K.L., B.G., Q.W. and Y.Z. All authors have read and agreed to the published version of the manuscript.

Funding

This work was supported by the National Key Research and Development Program Projects for the 14th Five-Year Plan (2021YFC3200200), National Natural Science Foundation Projects (52025093, 51979284), and the significant science and technology project of Ministry of Water Resources (SKR2022056).

Institutional Review Board Statement

Not applicable.

Informed Consent Statement

Not applicable.

Data Availability Statement

Data related to this research are not deposited in publicly available repositories but are included in this article. The data that support the findings of this study are available from the corresponding authors upon reasonable request.

Conflicts of Interest

The authors declare no conflicts of interest.

References

  1. Zhang, X.; Hao, Z.; Singh, V.P.; Zhang, Y.; Feng, S.; Xu, Y.; Hao, F. Drought propagation under global warming: Characteristics, approaches, processes, and controlling factors. Sci. Total Environ. 2022, 838, 156021. [Google Scholar] [CrossRef] [PubMed]
  2. Konapala, G.; Mishra, A. Quantifying Climate and Catchment Control on Hydrological Drought in the Continental United States. Water Resour. Res. 2020, 56, e2018WR024620. [Google Scholar] [CrossRef]
  3. Surendran, U.; Kumar, V.; Ramasubramoniam, S.; Raja, P. Development of drought indices for semi-arid region using drought indices calculator (DrinC)—A case study from Madurai District, a semi-arid region in India. Water Resour. Manag. 2017, 31, 3593–3605. [Google Scholar] [CrossRef]
  4. Fang, W.; Huang, S.; Huang, Q.; Huang, G.; Wang, H.; Leng, G.; Wang, L.; Guo, Y. Probabilistic assessment of remote sensing-based terrestrial vegetation vulnerability to drought stress of the Loess Plateau in China. Remote Sens. Environ. 2019, 232, 111290. [Google Scholar] [CrossRef]
  5. Han, Z.; Huang, S.; Huang, Q.; Leng, G.; Wang, H.; He, L.; Fang, W.; Li, P. Assessing GRACE-based terrestrial water storage anomalies dynamics at multi-timescales and their correlations with teleconnection factors in Yunnan Province, China. J. Hydrol. 2019, 574, 836–850. [Google Scholar] [CrossRef]
  6. Guo, Y.; Huang, S.; Huang, Q.; Wang, H.; Fang, W.; Yang, Y.; Wang, L. Assessing socioeconomic drought based on an improved Multivariate Standardized Reliability and Resilience Index. J. Hydrol. 2019, 568, 904–918. [Google Scholar] [CrossRef]
  7. Van Loon, A.F.; Van Lanen, H.A. Making the distinction between water scarcity and drought using an observation-modeling framework. Water Resour. Res. 2013, 49, 1483–1502. [Google Scholar] [CrossRef]
  8. Huang, S.; Wang, L.; Wang, H.; Huang, Q.; Leng, G.; Fang, W.; Zhang, Y. Spatio-temporal characteristics of drought structure across China using an integrated drought index. Agric. Water Manag. 2019, 218, 182–192. [Google Scholar] [CrossRef]
  9. Naumann, G.; Alfieri, L.; Wyser, K.; Mentaschi, L.; Betts, R.A.; Carrao, H.; Spinoni, J.; Vogt, J.; Feyen, L. Global Changes in Drought Conditions Under Different Levels of Warming. Geophys. Res. Lett. 2018, 45, 3285–3296. [Google Scholar] [CrossRef]
  10. Mishra, A.K.; Singh, V.P. A review of drought concepts. J. Hydrol. 2010, 391, 202–216. [Google Scholar] [CrossRef]
  11. Nam, W.-H.; Hayes, M.J.; Svoboda, M.D.; Tadesse, T.; Wilhite, D.A. Drought hazard assessment in the context of climate change for South Korea. Agric. Water Manag. 2015, 160, 106–117. [Google Scholar] [CrossRef]
  12. Wu, F.; Yang, X.; Yuan, X.; Ren, L.; Yuan, S.; Yuan, F.; Jiang, S.; Liu, Y.; Zhang, H. How will drought evolve in global arid zones under different future emission scenarios? J. Hydrol. Reg. Stud. 2024, 51, 101661. [Google Scholar] [CrossRef]
  13. Zhang, B.; He, C. A modified water demand estimation method for drought identification over arid and semiarid regions. Agric. For. Meteorol. 2016, 230, 58–66. [Google Scholar] [CrossRef]
  14. Wang, Y.; Wang, S.; Chen, Y.; Wang, F.; Liu, Y.; Zhao, W. Anthropogenic drought in the Yellow River basin: Multifaceted and weakening connections between meteorological and hydrological droughts. J. Hydrol. 2023, 619, 129273. [Google Scholar] [CrossRef]
  15. Zhang, X.; She, D.; Xia, J.; Zhang, L.; Deng, C.; Liu, Z. The changing characteristics of propagation time from meteorological drought to hydrological drought in the Yangtze River basin, China. Atmos. Res. 2023, 290, 106774. [Google Scholar] [CrossRef]
  16. Zhao, H.; Huang, Y.; Wang, X.; Li, X.; Lei, T. The performance of SPEI integrated remote sensing data for monitoring agricultural drought in the North China Plain. Field Crops Res. 2023, 302, 109041. [Google Scholar] [CrossRef]
  17. Li, Q.; Fan, G.; Zhou, D.; Yu, S.; Ya, O. Application of meteorological drought composite index in Southwest China in 2009–2010. J. Chengdu Univ. Inf. Technol. 2012, 27, 267–272. [Google Scholar]
  18. Liu, X.; Pan, Y.; Zhu, X.; Yang, T.; Bai, J.; Sun, Z. Drought evolution and its impact on the crop yield in the North China Plain. J. Hydrol. 2018, 564, 984–996. [Google Scholar] [CrossRef]
  19. Wang, S.; Mo, X.; Hu, S.; Liu, S.; Liu, Z. Assessment of droughts and wheat yield loss on the North China Plain with an aggregate drought index (ADI) approach. Ecol. Indic. 2018, 87, 107–116. [Google Scholar] [CrossRef]
  20. Su, B.; Huang, J.; Fischer, T.; Wang, Y.; Kundzewicz, Z.W.; Zhai, J.; Sun, H.; Wang, A.; Zeng, X.; Wang, G.; et al. Drought losses in China might double between the 1.5 degrees C and 2.0 degrees C warming. Proc. Natl. Acad. Sci. USA 2018, 115, 10600–10605. [Google Scholar] [CrossRef]
  21. Geng, G.; Zhang, B.; Gu, Q.; He, Z.; Zheng, R. Drought propagation characteristics across China: Time, probability, and threshold. J. Hydrol. 2024, 631, 130805. [Google Scholar] [CrossRef]
  22. Hellwig, J.; de Graaf, I.E.M.; Weiler, M.; Stahl, K. Large-Scale Assessment of Delayed Groundwater Responses to Drought. Water Resour. Res. 2020, 56, e2019WR025441. [Google Scholar] [CrossRef]
  23. Leng, G.; Tang, Q.; Rayburg, S. Climate change impacts on meteorological, agricultural and hydrological droughts in China. Global Planet. Change 2015, 126, 23–34. [Google Scholar] [CrossRef]
  24. Huang, S.; Huang, Q.; Chang, J.; Leng, G. Linkages between hydrological drought, climate indices and human activities: A case study in the Columbia River basin. Int. J. Climatol. 2016, 36, 280–290. [Google Scholar] [CrossRef]
  25. Hao, Z.; AghaKouchak, A. Multivariate standardized drought index: A parametric multi-index model. Adv. Water Resour. 2013, 57, 12–18. [Google Scholar] [CrossRef]
  26. Herrera-Estrada, J.E.; Satoh, Y.; Sheffield, J. Spatiotemporal dynamics of global drought. Geophys. Res. Lett. 2017, 44, 2254–2263. [Google Scholar] [CrossRef]
  27. Huang, S.; Li, P.; Huang, Q.; Leng, G.; Hou, B.; Ma, L. The propagation from meteorological to hydrological drought and its potential influence factors. J. Hydrol. 2017, 547, 184–195. [Google Scholar] [CrossRef]
  28. Liu, S.; Huang, S.; Xie, Y.; Huang, Q.; Wang, H.; Leng, G. Assessing the non-stationarity of low flows and their scale-dependent relationships with climate and human forcing. Sci. Total Environ. 2019, 687, 244–256. [Google Scholar] [CrossRef]
  29. Mehran, A.; Mazdiyasni, O.; AghaKouchak, A. A hybrid framework for assessing socioeconomic drought: Linking climate variability, local resilience, and demand. J. Geophys. Res. Atmos. 2015, 120, 7520–7533. [Google Scholar] [CrossRef]
  30. Wu, J.; Chen, X.; Yuan, X.; Yao, H.; Zhao, Y.; AghaKouchak, A. The interactions between hydrological drought evolution and precipitation-streamflow relationship. J. Hydrol. 2021, 597, 126210. [Google Scholar] [CrossRef]
  31. Vu, M.; Raghavan, V.; Liong, S.-Y. Ensemble climate projection for hydro-meteorological drought over a river basin in Central Highland, Vietnam. KSCE J. Civ. Eng. 2015, 19, 427–433. [Google Scholar] [CrossRef]
  32. Van Loon, A.; Laaha, G. Hydrological drought severity explained by climate and catchment characteristics. J. Hydrol. 2015, 526, 3–14. [Google Scholar] [CrossRef]
  33. Li, R.; Chen, N.; Zhang, X.; Zeng, L.; Wang, X.; Tang, S.; Li, D.; Niyogi, D. Quantitative analysis of agricultural drought propagation process in the Yangtze River Basin by using cross wavelet analysis and spatial autocorrelation. Agric. For. Meteorol. 2020, 280, 107809. [Google Scholar] [CrossRef]
  34. Van Loon, A.F.; Gleeson, T.; Clark, J.; Van Dijk, A.I.; Stahl, K.; Hannaford, J.; Di Baldassarre, G.; Teuling, A.J.; Tallaksen, L.M.; Uijlenhoet, R. Drought in the Anthropocene. Nat. Geosci. 2016, 9, 89–91. [Google Scholar] [CrossRef]
  35. Ma, F.; Luo, L.; Ye, A.; Duan, Q. Drought Characteristics and Propagation in the Semiarid Heihe River Basin in Northwestern China. J. Hydrometeorol. 2019, 20, 59–77. [Google Scholar] [CrossRef]
  36. Wu, J.; Chen, X.; Yao, H.; Gao, L.; Chen, Y.; Liu, M. Non-linear relationship of hydrological drought responding to meteorological drought and impact of a large reservoir. J. Hydrol. 2017, 551, 495–507. [Google Scholar] [CrossRef]
  37. Liu, J.; Qin, D.; Wang, H.; Wang, M.; Yang, Z. Dualistic water cycle pattern and its evolution in Haihe River basin. Chin. Sci. Bull. 2010, 55, 1688–1697. [Google Scholar] [CrossRef]
  38. Ma, M.; Zhao, Y.; Wang, Q.; Liu, R.; Li, E. The impacts of different levels of precipitation on water resources attenuation in the Haihe River Basin. China Rural Water Hydropower 2023, 2023, 55–62. [Google Scholar]
  39. Yang, H.; Meng, R.; Li, W.; Li, Z.; Zhi, C.; Bao, X.; Li, C.; Liu, F.; Wu, H.; Ren, Y. Groundwater resources of the Haihe River Basin and its development potential. Geol. China 2021, 48, 1032–1051. [Google Scholar]
  40. Yan, X.; Zhang, B.; Yao, Y.; Yang, Y.; Li, J.; Ran, Q. GRACE and land surface models reveal severe drought in eastern China in 2019. J. Hydrol. 2021, 601, 126640. [Google Scholar] [CrossRef]
  41. Zhao, A.; Xiang, K.; Zhang, A.; Zhang, X. Spatial-temporal evolution of meteorological and groundwater droughts and their relationship in the North China Plain. J. Hydrol. 2022, 610, 127903. [Google Scholar] [CrossRef]
  42. Vicente-Serrano, S.M.; Beguería, S.; López-Moreno, J.I. A multiscalar drought index sensitive to global warming: The standardized precipitation evapotranspiration index. J. Clim. 2010, 23, 1696–1718. [Google Scholar] [CrossRef]
  43. Thornthwaite, C.W. An approach toward a rational classification of climate. Geogr. Rev. 1948, 38, 55–94. [Google Scholar] [CrossRef]
  44. Xu, D.; Zhang, Q.; Ding, Y.; Zhang, D. Application of a hybrid ARIMA-LSTM model based on the SPEI for drought forecasting. Environ. Sci. Pollut. Res. 2022, 29, 4128–4144. [Google Scholar] [CrossRef]
  45. Zeng, X.; Zhao, N.; Sun, H.; Ye, L.; Zhai, J. Changes and relationships of climatic and hydrological droughts in the Jialing River Basin, China. PLoS ONE 2015, 10, e0141648. [Google Scholar] [CrossRef]
  46. Ding, Y.; Xu, J.; Wang, X.; Cai, H.; Zhou, Z.; Sun, Y.; Shi, H. Propagation of meteorological to hydrological drought for different climate regions in China. J. Environ. Manag. 2021, 283, 111980. [Google Scholar] [CrossRef]
  47. Wang, Y.; Peng, T.; Lin, Q.; Singh, V.P.; Dong, X.; Chen, C.; Liu, J.; Chang, W.; Wang, G. A new non-stationary hydrological drought index encompassing climate indices and modified reservoir index as covariates. Water Resour. Manag. 2022, 36, 2433–2454. [Google Scholar] [CrossRef]
  48. Wang, Z.; Chang, J.; Wang, Y.; Yang, Y.; Guo, Y.; Yang, G.; He, B. Temporal and spatial propagation characteristics of meteorological drought to hydrological drought and influencing factors. Atmos. Res. 2024, 299, 107212. [Google Scholar] [CrossRef]
  49. Mann, H.B. Nonparametric Tests Against Trend. Econometrica 1945, 13, 245–259. [Google Scholar] [CrossRef]
  50. Kendall, M.G. Rank Correlation Methods; Griffin: Oxford, UK, 1948. [Google Scholar]
  51. Sang, Y.-F.; Wang, Z.; Liu, C. Comparison of the MK test and EMD method for trend identification in hydrological time series. J. Hydrol. 2014, 510, 293–298. [Google Scholar] [CrossRef]
  52. Ciria, T.P.; Chiogna, G. Intra-catchment comparison and classification of long-term streamflow variability in the Alps using wavelet analysis. J. Hydrol. 2020, 587, 124927. [Google Scholar] [CrossRef]
  53. Kisi, O. Wavelet regression model for short-term streamflow forecasting. J. Hydrol. 2010, 389, 344–353. [Google Scholar] [CrossRef]
  54. Yevjevich, V.M. An Objective Approach to Definitions and Investigations of Continental Hydrologic Droughts; Colorado State University: Fort Collins, CO, USA, 1967; Volume 23. [Google Scholar]
  55. Chen, N.; Li, R.; Zhang, X.; Yang, C.; Wang, X.; Zeng, L.; Tang, S.; Wang, W.; Li, D.; Niyogi, D. Drought propagation in Northern China Plain: A comparative analysis of GLDAS and MERRA-2 datasets. J. Hydrol. 2020, 588, 125026. [Google Scholar] [CrossRef]
  56. Zhou, Z.; Shi, H.; Fu, Q.; Ding, Y.; Li, T.; Liu, S. Investigating the Propagation From Meteorological to Hydrological Drought by Introducing the Nonlinear Dependence With Directed Information Transfer Index. Water Resour. Res. 2021, 57, e2021WR030028. [Google Scholar] [CrossRef]
  57. Wang, H.; Wang, Z.; Bai, Y.; Wang, W. Propagation characteristics of meteorological drought to hydrological drought considering nonlinear correlations—A case study of the Hanjiang River Basin, China. Ecol. Inf. 2024, 80, 102512. [Google Scholar] [CrossRef]
  58. Haslinger, K.; Koffler, D.; Schöner, W.; Laaha, G. Exploring the link between meteorological drought and streamflow: Effects of climate-catchment interaction. Water Resour. Res. 2014, 50, 2468–2487. [Google Scholar] [CrossRef]
  59. Guan, B.; Jiang, S.; Zhao, Y.; Li, H.; Dong, Y.; Chang, H.; He, G.; Han, X. Spatial and temporal evolution of drought and its relationship with climate factors in the HaiHe River Basin. Water Resour. Prot. 2023, 39, 59–68. [Google Scholar]
  60. Zhang, Q.; Miao, C.; Guo, X.; Gou, J.; Su, T. Human activities impact the propagation from meteorological to hydrological drought in the Yellow River Basin, China. J. Hydrol. 2023, 623, 129752. [Google Scholar] [CrossRef]
  61. Xu, Y.; Zhang, X.; Wang, X.; Hao, Z.; Singh, V.P.; Hao, F. Propagation from meteorological drought to hydrological drought under the impact of human activities: A case study in northern China. J. Hydrol. 2019, 579, 124147. [Google Scholar] [CrossRef]
  62. Jiang, T.; Su, X.; Zhang, G.; Zhang, T.; Wu, H. Estimating propagation probability from meteorological to ecological droughts using a hybrid machine learning copula method. Hydrol. Earth Syst. Sci. 2023, 27, 559–576. [Google Scholar] [CrossRef]
  63. Das, S.; Das, J.; Umamahesh, N. Investigating the propagation of droughts under the influence of large-scale climate indices in India. J. Hydrol. 2022, 610, 127900. [Google Scholar] [CrossRef]
  64. Ding, Y.; Xu, J.; Wang, X.; Peng, X.; Cai, H. Spatial and temporal effects of drought on Chinese vegetation under different coverage levels. Sci. Total Environ. 2020, 716, 137166. [Google Scholar] [CrossRef] [PubMed]
  65. Ling, M.; Guo, X.; Shi, X.; Han, H. Temporal and spatial evolution of drought in Haihe River Basin from 1960 to 2020. Ecol. Indic. 2022, 138, 108809. [Google Scholar] [CrossRef]
  66. Zhang, T.; Su, X.; Zhang, G.; Wu, H.; Wang, G.; Chu, J. Evaluation of the impacts of human activities on propagation from meteorological drought to hydrological drought in the Weihe River Basin, China. Sci. Total Environ. 2022, 819, 153030. [Google Scholar] [CrossRef]
  67. Botai, J.O.; Botai, C.M.; de Wit, J.P.; Muthoni, M.; Adeola, A.M. Analysis of drought progression physiognomies in South Africa. Water 2019, 11, 299. [Google Scholar] [CrossRef]
  68. Zhang, X.; Sun, W. Spatial and temporal characterization of the urban drought in the Western Cape, South Africa, from 2015 to 2017. Adv. Earth Sci. 2023, 38, 493–504. [Google Scholar] [CrossRef]
  69. Ghomash, S.K.B.; Caviedes-Voullieme, D.; Hinz, C. Effects of erosion-induced changes to topography on runoff dynamics. J. Hydrol. 2019, 573, 811–828. [Google Scholar] [CrossRef]
  70. Huang, S.; Huang, Q.; Chang, J.; Leng, G.; Xing, L. The response of agricultural drought to meteorological drought and the influencing factors: A case study in the Wei River Basin, China. Agric. Water Manag. 2015, 159, 45–54. [Google Scholar] [CrossRef]
  71. Wan, F.; Zhang, F.; Wang, Y.; Peng, S.; Zheng, X. Study on the propagation law of meteorological drought to hydrological drought under variable time Scale: An example from the Yellow River Water Supply Area in Henan. Ecol. Indic. 2023, 154, 110873. [Google Scholar] [CrossRef]
  72. Liu, Y.; Shan, F.; Yue, H.; Wang, X. Characteristics of drought propagation and effects of water resources on vegetation in the karst area of Southwest China. Sci. Total Environ. 2023, 891, 164663. [Google Scholar] [CrossRef]
  73. Vicente-Serrano, S.M.; Peña-Gallardo, M.; Hannaford, J.; Murphy, C.; Lorenzo-Lacruz, J.; Dominguez-Castro, F.; López-Moreno, J.I.; Beguería, S.; Noguera, I.; Harrigan, S. Climate, irrigation, and land cover change explain streamflow trends in countries bordering the northeast Atlantic. Geophys. Res. Lett. 2019, 46, 10821–10833. [Google Scholar] [CrossRef]
  74. Wang, J.; Wang, W.; Cheng, H.; Wang, H.; Zhu, Y. Propagation from meteorological to hydrological drought and its influencing factors in the Huaihe River Basin. Water 2021, 13, 1985. [Google Scholar] [CrossRef]
  75. Han, Z.; Huang, S.; Peng, J.; Li, J.; Leng, G.; Huang, Q.; Zhao, J.; Yang, F.; He, P.; Meng, X.; et al. GRACE-based dynamic assessment of hydrological drought trigger thresholds induced by meteorological drought and possible driving mechanisms. Remote Sens. Environ. 2023, 298, 113831. [Google Scholar] [CrossRef]
  76. Guo, Y.; Huang, S.; Huang, Q.; Leng, G.; Fang, W.; Wang, L.; Wang, H. Propagation thresholds of meteorological drought for triggering hydrological drought at various levels. Sci. Total Environ. 2020, 712, 136502. [Google Scholar] [CrossRef]
  77. Bhardwaj, K.; Shah, D.; Aadhar, S.; Mishra, V. Propagation of Meteorological to Hydrological Droughts in India. J. Geophys. Res. Atmos. 2020, 125, e2020JD033455. [Google Scholar] [CrossRef]
  78. Barker, L.J.; Hannaford, J.; Chiverton, A.; Svensson, C. From meteorological to hydrological drought using standardised indicators. Hydrol. Earth Syst. Sci. 2016, 20, 2483–2505. [Google Scholar] [CrossRef]
  79. Meresa, H.; Zhang, Y.; Tian, J.; Abrar Faiz, M. Understanding the role of catchment and climate characteristics in the propagation of meteorological to hydrological drought. J. Hydrol. 2023, 617, 128967. [Google Scholar] [CrossRef]
  80. Meresa, H.; Murphy, C.; Donegan, S.E. Propagation and Characteristics of Hydrometeorological Drought Under Changing Climate in Irish Catchments. J. Geophys. Res. Atmos. 2023, 128, e2022JD038025. [Google Scholar] [CrossRef]
  81. Wu, J.; Chen, X.; Yu, Z.; Yao, H.; Li, W.; Zhang, D. Assessing the impact of human regulations on hydrological drought development and recovery based on a ‘simulated-observed’comparison of the SWAT model. J. Hydrol. 2019, 577, 123990. [Google Scholar] [CrossRef]
  82. Han, Z.; Huang, S.; Zhao, J.; Leng, G.; Huang, Q.; Zhang, H.; Li, Z. Long-chain propagation pathways from meteorological to hydrological, agricultural and groundwater drought and their dynamics in China. J. Hydrol. 2023, 625, 130131. [Google Scholar] [CrossRef]
  83. Zhang, Q.; Miao, C.; Gou, J.; Wu, J.; Jiao, W.; Song, Y.; Xu, D. Spatiotemporal characteristics of meteorological to hydrological drought propagation under natural conditions in China. Weather Clim. Extrem. 2022, 38, 100505. [Google Scholar] [CrossRef]
  84. Bin, L.; Xu, K.; Yang, Z.; He, L.; Xu, X.; Lian, J. Water cycle evolution in the Haihe River Basin and its relationship with landscape pattern changes. Ecol. Indic. 2024, 159, 111681. [Google Scholar] [CrossRef]
  85. He, X.; Wada, Y.; Wanders, N.; Sheffield, J. Intensification of hydrological drought in California by human water management. Geophys. Res. Lett. 2017, 44, 1777–1785. [Google Scholar] [CrossRef]
  86. Jehanzaib, M.; Shah, S.A.; Yoo, J.; Kim, T.-W. Investigating the impacts of climate change and human activities on hydrological drought using non-stationary approaches. J. Hydrol. 2020, 588, 125052. [Google Scholar] [CrossRef]
  87. Zheng, J.; Zhou, Z.; Liu, J.; Yan, Z.; Xu, C.Y.; Jiang, Y.; Jia, Y.; Wang, H. A novel framework for investigating the mechanisms of climate change and anthropogenic activities on the evolution of hydrological drought. Sci. Total Environ. 2023, 900, 165685. [Google Scholar] [CrossRef]
  88. Wang, M.; Jiang, S.; Ren, L.; Xu, C.-Y.; Menzel, L.; Yuan, F.; Xu, Q.; Liu, Y.; Yang, X. Separating the effects of climate change and human activities on drought propagation via a natural and human-impacted catchment comparison method. J. Hydrol. 2021, 603, 126913. [Google Scholar] [CrossRef]
  89. Zhao, Y.; Zhu, T.; Zhou, Z.; Cai, H.; Cao, Z. Detecting nonlinear information about drought propagation time and rate with nonlinear dynamic system and chaos theory. J. Hydrol. 2023, 623, 129810. [Google Scholar] [CrossRef]
  90. Huang, S.; Zhang, X.; Chen, N.; Li, B.; Ma, H.; Xu, L.; Li, R.; Niyogi, D. Drought propagation modification after the construction of the Three Gorges Dam in the Yangtze River Basin. J. Hydrol. 2021, 603, 127138. [Google Scholar] [CrossRef]
  91. van Langen, S.C.; Costa, A.C.; Ribeiro Neto, G.G.; van Oel, P.R. Effect of a reservoir network on drought propagation in a semi-arid catchment in Brazil. Hydrol. Sci. J. 2021, 66, 1567–1583. [Google Scholar] [CrossRef]
  92. Colombo, P.; Ribeiro Neto, G.G.; Costa, A.C.; Mamede, G.L.; Van Oel, P.R. Modeling the influence of small reservoirs on hydrological drought propagation in space and time. J. Hydrol. 2024, 629, 130640. [Google Scholar] [CrossRef]
  93. Murgatroyd, A.; Hall, J.W. The Resilience of Inter-basin Transfers to Severe Droughts With Changing Spatial Characteristics. Front. Environ. Sci. 2020, 8, 571647. [Google Scholar] [CrossRef]
  94. Van Loon, A.F.; Rangecroft, S.; Coxon, G.; Werner, M.; Wanders, N.; Di Baldassarre, G.; Tijdeman, E.; Bosman, M.; Gleeson, T.; Nauditt, A. Streamflow droughts aggravated by human activities despite management. Environ. Res. Lett. 2022, 17, 044059. [Google Scholar] [CrossRef]
  95. Han, Z.; Huang, S.; Huang, Q.; Leng, G.; Wang, H.; Bai, Q.; Zhao, J.; Ma, L.; Wang, L.; Du, M. Propagation dynamics from meteorological to groundwater drought and their possible influence factors. J. Hydrol. 2019, 578, 124102. [Google Scholar] [CrossRef]
  96. Wang, M.; Jiang, S.; Ren, L.; Xu, C.-Y.; Yuan, F.; Liu, Y.; Yang, X. An approach for identification and quantification of hydrological drought termination characteristics of natural and human-influenced series. J. Hydrol. 2020, 590, 125384. [Google Scholar] [CrossRef]
  97. Wu, J.; Miao, C.; Zheng, H.; Duan, Q.; Lei, X.; Li, H. Meteorological and hydrological drought on the Loess Plateau, China: Evolutionary characteristics, impact, and propagation. J. Geophys. Res. Atmos. 2018, 123, 11,569–11,584. [Google Scholar] [CrossRef]
  98. Yang, Y.; Tian, F. Abrupt change of runoff and its major driving factors in Haihe River Catchment, China. J. Hydrol. 2009, 374, 373–383. [Google Scholar] [CrossRef]
  99. Long, D.; Yang, W.; Scanlon, B.R.; Zhao, J.; Liu, D.; Burek, P.; Pan, Y.; You, L.; Wada, Y. South-to-North Water Diversion stabilizing Beijing’s groundwater levels. Nat. Commun. 2020, 11, 3665. [Google Scholar] [CrossRef]
  100. Jin, H.; Li, X.; Zhang, Y.; He, L.; Zhang, G.; Ma, W. Prospective Evolution of Meteorological Drought in the Haihe River Basin and Its Connection With Large-Scale Atmospheric Circulations Using CMIP6 Multimodel Ensemble. J. Geophys. Res. Atmos. 2023, 128, e2023JD038954. [Google Scholar] [CrossRef]
  101. Wu, J.; Chen, X.; Gao, L.; Yao, H.; Chen, Y.; Liu, M. Response of hydrological drought to meteorological drought under the influence of large reservoir. Adv. Meteorol. 2016, 2016, 2197142. [Google Scholar] [CrossRef]
  102. Fang, W.; Huang, S.; Huang, Q.; Huang, G.; Wang, H.; Leng, G.; Wang, L. Identifying drought propagation by simultaneously considering linear and nonlinear dependence in the Wei River basin of the Loess Plateau, China. J. Hydrol. 2020, 591, 125287. [Google Scholar] [CrossRef]
  103. Peterson, T.J.; Saft, M.; Peel, M.; John, A. Watersheds may not recover from drought. Science 2021, 372, 745–749. [Google Scholar] [CrossRef]
Figure 1. The location of the HRB and the positions of meteorological and hydrological stations.
Sustainability 17 05134 g001
Figure 2. HRB 1960–2017 change points before and after: (a,b) represents the trends in precipitation and evapotranspiration before and after 1991; (c,d) denotes the trends in SPEI and SRI before and after 1991.
Sustainability 17 05134 g002
Figure 3. Two-dimensional joint distribution probability diagram of hydrological drought characteristic variables in the HRB. (a) represents the probability distribution of duration and severity; (b) represents the probability distribution of duration and peak; (c) represents the probability distribution of severity and peak.
Sustainability 17 05134 g003
Figure 4. Multi-scale wavelet coherence of SPEI–SRI. ((a) represents the wavelet coherence of SPEI and SRI at monthly scale; (b) represents the wavelet coherence of SPEI and SRI at seasonal scale; (c) represents the wavelet coherence of SPEI and SRI at annual scale).
Sustainability 17 05134 g004
Figure 5. Spatiotemporal evolution of annual-scale SPEI and SRI in the HRB from 1960 to 2017. (a) is the evolution of SPEI and SRI from 1960 to 2017; (b) represents the evolution of SPEI and SRI from September 1965 to June 1967; (c) is the evolution of SPEI and SRI from July 1967 to August 1968; (d) is the evolution of SPEI and SRI from June 1961 to May 1972; (e) represents the evolution of SPEI and SRI from December 1980 to July 1990.
Sustainability 17 05134 g005
Figure 6. Meteorological and hydrological drought events in the HRB.
Sustainability 17 05134 g006
Figure 7. Delay times of meteorological and hydrological drought at different time scales in the HRB: (a) SPEI1 and SRI1; (b) SPEI3 and SRI3; (c) SPEI12 and SRI12.
Sustainability 17 05134 g007
Figure 8. Correlation analysis of lag time in the propagation of meteorological drought to hydrological drought.
Sustainability 17 05134 g008
Table 1. Parameter estimates and goodness-of-fit metrics for probability distributions of drought components.
ComponentDistributionParameters (Shape, Location, Scale)AICK-S Test p-Value
PeakLog-normal(0.462, 0, 1.353)47.680.786
GEV(−0.375, 1.087, 0.418)48.240.785
Gamma(4.633, 0, 0.327)49.560.639
Weibull(2.142, 0, 1.719)52.460.655
Normal(1.5132, 0.760)56.630.398
SeverityGEV(−0.909, 3.326, 1.991)133.380.807
Log-normal(0.831, 0, 5.283)137.320.658
Gamma(1.379, 0, 5.741)143.840.382
Weibull(1.088, 0, 8.228)144.860.402
Normal(7.917, 8.921)169.940.061
DurationGEV(−0.450, 3.889, 1.938)120.730.878
Log-normal(0.601, 0, 5.093)120.760.752
Gamma(2.578, 0, 2.429)125.330.380
Weibull(1.467, 0, 7.004)128.750.335
Normal(6.261, 4.989)143.20.074
Table 2. Comparison of copula function parameter estimates and AIC values.
VariableCopula FunctionParameter Estimation MethodsAICParameter (θ)
P&SClaytonMaximum Likelihood Estimate−3.625.25
Gumbel−32.2612.60
Frank−36.253.62
P&DClayton1.312.43
Gumbel−14.236.71
Frank−17.982.22
D&SClayton−1.078.38
Gumbel−37.9618.97
Frank−42.125.19
Table 3. Drought duration, severity, and peak in different periods of meteorological and hydrological conditions in the HRB.
PeriodMeteorological Drought Duration (Month)Meteorological
Severity
Meteorological PeakHydrological Drought Duration (Month)Hydrological
Severity
Hydrological
Peak
1960–19713211.12.3274.71.2
1980–19974013.92.4488.91.6
2001–20155515.82.57222.02.5
1960–201712714.02.414714.52.0
Table 5. The impact of human activities on the propagation of hydrological drought.
Human ActivitiesInfluencing Natural PathwaysThe Impact on Hydrological DroughtSource of Literature
Reservoir storage/releaseChanging the annual/interannual river flow processEnhancing hydrological drought during the flood season; weakening non-flood season[81,90,101]
Inter-basin water transferIncrease river flowReducing the impact of hydrological drought[48,82]
River water abstractionReduce river flowReducing the impact of hydrological drought[28]
Groundwater extractionCausing a decrease in groundwater levels, reduction or disappearance of groundwater recharge to river base flowEnhancing hydrological droughts[95]
Agricultural irrigationIncrease in surface water consumptionExacerbating the occurrence of hydrological drought[21,96]
Water and soil conservation projectsIncreased evaporation from surface soilExacerbating the occurrence of hydrological drought[97]
Returning farmland to forestsIncreased surface soil water evaporation consumptionExacerbates the occurrence of hydrological drought[62,102]
UrbanizationDecrease in precipitation recharge to soil and groundwaterExacerbates the occurrence of hydrological drought[63]
Disclaimer/Publisher’s Note: The statements, opinions and data contained in all publications are solely those of the individual author(s) and contributor(s) and not of MDPI and/or the editor(s). MDPI and/or the editor(s) disclaim responsibility for any injury to people or property resulting from any ideas, methods, instructions or products referred to in the content.

