1. Introduction
Water resource management is a critical aspect of sustainable development, aiming to ensure the availability, quality, and equitable distribution of water for domestic, agricultural, industrial, and environmental uses. It involves coordinated efforts to manage water sources efficiently while addressing social, economic, and environmental demands. Efficient management helps meet current water needs without compromising future availability, ensuring consistent supply for households, agriculture, and industry. Agriculture relies heavily on water. Well-managed irrigation systems increase crop yield, food security, and farmers’ resilience to droughts or erratic rainfall. Healthy water ecosystems are vital for biodiversity. Managing water flow and quality helps preserve rivers, wetlands, and aquifers. Industries and energy sectors depend on water. Effective management sustains economic growth, especially in water-intensive sectors like energy and manufacturing [
1].
Risk assessment plays a crucial role in water resource management, ensuring sustainable use, minimizing environmental impact, and improving resilience against uncertainties such as climate change and population growth [
2]. Some researchers have developed risk assessment methods when managing water resources. Finding solutions for modeling, planning, and comprehensive management of water resources under various types of risks is one of today’s major challenges. Meanwhile, the complexity analysis of these systems should be considered an essential element. The primary goal in this field is to create optimal conditions for modeling, planning, and integrated management of water resources, with a focus on sustainable development [
3]. Scenarios are a significant tool for examining uncertainties in a consistent, compatible, and acceptable manner. Furthermore, they are widely used in policy and strategic planning [
4].
Given the serious concerns surrounding the global lack of water resources, scientific evaluations of the Water Resources Carrying Capacity (WRCC) provide a foundation for executing protective measures on these resources. Song et al. [
5] presented a WRCC index system based on 20 effective factors from four aspects of water resources endowment, economy, society, and environment. By combining the weighted gray technique with an improved entropy weighting method, the authors conducted a comprehensive analysis and assessment of WRCC risks. The authors established a solid scientific foundation and provided a detailed methodological guide for both the sustainable management of water resources and the promotion of healthy socio-economic performance in CPROC [
5].
Chernysh et al. [
6] presented new perspectives on global environmental risk assessment of water resource stress. As indicated from the results, the management of water pollution’s environmental risks has been highlighted, and the concept of evaluating cumulative ecological risks has been introduced as multi-risk resulting from exposure to pollutants. Furthermore, alternative approaches were identified to include additional factors, such as climate change, into the overarching risk assessment framework, which provides new perspectives for future research in this field [
6]. Oil and gas extraction activities, including hydraulic fracturing and well stimulation, put the underground sources of drinking water in potential danger. Robust risk management frameworks are required to protect these vital water resources. Therefore, Esiri et al. [
7] assessed the existing frameworks of risk management, which are aimed at protecting USDWs (Underground Sources of Drinking Water). The results showed the important role of monitoring in the early detection of potential threats against USDWs. On the other hand, emergency response plans come with methods and protocols for addressing contamination events and minimizing the impacts on USDWs and public health. The emergency response plans include emergency containment measures, cleansing and modification, and communication strategies to notify the affected communities and cooperate with regulatory agencies, and search and rescue teams [
7].
Some studies have emphasized the role of risk indicators in water resource management and developed effective risk indexes. As managing water resources in drought conditions is critical, developing new indexes for managing water resources and creating scenarios involving water scarcity and drought can be effective innovations. Identifying possible scenarios in dealing with water scarcity and drought through the participation of experts is of great importance. Risk indexes such as reliability [
8], reversibility [
9], vulnerability [
10], flexibility [
11], supply-to-demand [
12], volume reliability [
13], sustainability [
14], drought [
15], and the modified Young stability [
16] are used to assess scenarios involving water scarcity. Although these risks have been used separately by researchers for water resource management, in this paper, all of these risks are used simultaneously for water resource management using multi-criteria decision-making methods under uncertainty, which is one of the innovations of this research. Among these risk factors, the volumetric reliability index is determined as the most important risk factor in this paper, which plays a crucial role in improving demand forecasting and water supply, managing fluctuations, optimizing consumption, preserving aquatic ecosystems, and controlling hazards such as droughts and floods. Therefore, this achievement is of particular practical significance as it serves as a pragmatic and appealing tool for water resource managers, environmental researchers, policymakers, and experts in sustainable development and emerging agricultural technologies.
Some studies employed multi criteria decision making methods to solve different ware resource management problems. This paper proposes an integrated model of fuzzy Shannon entropy and fuzzy ARAS for water resource management. In the field of water resource management, the proposed integrated model is used to assess and prioritize the scenarios in drought conditions. In the proposed model, fuzzy Shannon entropy is used to measure the importance of risk indexes under uncertainty and fuzziness. For the problem solving was selected the Additive Ratio Assessment (ARAS) method, where was created by Zavadskas & Turskis [
17]. The many modification of ARAS method was created. As an example is the ARAS-G presented Turskis et al. [
18], a novel approach for evaluation of projects using an interval–valued fuzzy ARAS method presented Dahooie et al. [
19] and etc.
Then, fuzzy ARAS is employed to assess and prioritize water resource management scenarios. The fuzzy ARAS method is a valuable tool for scenario assessment due to its ability to handle multiple criteria, incorporate expert opinions, and provide a comprehensive evaluation of water resource management scenarios based on risk factors. Its flexibility and adaptability make it suitable for various assessment scenarios, contributing to more effective decision-making. The proposed integrated model enables a more comprehensive view of the significance of various water resource management variables. Lastly, using this integrated model, the scenarios are thoroughly evaluated and prioritized based on the importance of risk indexes. This approach not only enhances the effectiveness of managing water resources but also aids in selecting the best possible scenarios given current conditions. Fuzzy Shannon entropy and fuzzy ARAS are widely used in multi-criteria decision-making, particularly in handling uncertainty and ranking alternatives. Here’s a breakdown of their advantages and limitations [
20,
21,
22]:.
Pros of fuzzy Shannon Entropy: (a) Objective weighting: Unlike subjective methods like AHP, fuzzy Shannon entropy assigns weights based on data distribution, reducing bias. (b) Effective uncertainty handling: It quantifies uncertainty in decision-making, making it ideal for complex environments. (c) Computational efficiency: Compared to more complex optimization models, it requires fewer calculations.
Cons of fuzzy Shannon Entropy: (a) requires large data sets: Accuracy depends on having sufficient data for entropy calculations. (b) Limited interpretability: While it quantifies uncertainty, it does not provide direct causal insights. (c) Sensitive to data distribution: Skewed or imbalanced data may affect entropy values.
Pros of fuzzy ARAS: (a) Simple and efficient ranking: Fuzzy ARAS ranks alternatives based on additive utility functions, making it computationally efficient. (b) Multi-criteria optimization: It evaluates multiple factors simultaneously, ensuring balanced decision-making. (c) Flexibility in application: It can be integrated with other multi-criteria decision-making methods for enhanced accuracy.
Cons of fuzzy ARAS: (a) Less effective in highly uncertain environments: Unlike fuzzy Shannon entropy, it does not explicitly quantify uncertainty. (b) Requires predefined criteria weights: Weighting must be determined beforehand, which may introduce bias. (c) Limited adaptability to dynamic systems: Works better in structured decision problems rather than rapidly changing environments.
Overall, while these two methods complement each other well in handling uncertainty and providing a robust framework for decision-making in water resource management, their effective application necessitates careful consideration of computational resources, parameter settings, and input data quality.
The rest of the paper is organized as follows.
Section 2 is devoted to the research background.
Section 3 explains the case study and obtains the risk and sustainability indexes used for water resource management scenarios. In
Section 4, the fuzzy Shannon entropy and fuzzy ARAS are explained in detail. In
Section 5, these methods are implemented to assess water management scenarios and the results are discussed. Finally,
Section 6 obtains concluding remarks.
2. Research Background
Integrated Water Resources Planning and Management (IWRPM) is a collaborative, scientific, and technical approach that considers all levels of society, from the lowest to the highest management levels in the area, river basin, and aquifer. This approach enables the community to benefit from and participate in a comprehensive water resource management model coordinated with the entire area [
23]. Many experts and scientists are now interested in the concept of integrated management of water resources, which addresses the planning and management of water resources in addition to comprehensive management [
23].
Risk assessment is crucial in water resource management to ensure sustainability, resilience, and efficiency in water allocation. Given the increasing challenges posed by climate change, population growth, and industrial expansion, defining effective risk indexes and integrating risk-based strategies helps mitigate uncertainties and optimize decision-making. In this line of research, some researchers have introduced effective risk indicators and used them for water resources management. For example, reliability [
8], reversibility [
9], vulnerability [
10], flexibility [
11], supply-to-demand [
12], volume reliability [
13], sustainability [
14], drought risk [
15], and the modified Young stability [
16] are among the most important indicators defined in this field. Wu et al. [
24] examined the spatial distribution of drought vulnerability in China. In this study, three factors representing vulnerability to drought were considered, including crop seasonal moisture reduction, soil water holding capacity, and irrigation. The findings revealed that, on a regional scale, China’s southern and eastern regions are vulnerable to drought, while the northern and western regions are the most vulnerable. The crops used in their study were wheat, corn, and rice. The study highlighted that agricultural drought risk in China has a clear southeast–northwest spatial pattern. High and very high risk mainly occur in the eastern part of Northeast Plain, the central of Inner Mongolian Plateau, the Loess Plateau, north Xinjiang, the north and south of Yangtze Plain, and Yunnan-Guizhou Plateau. Statistics revealed that 19.5% of the main crop planting area is exposed to low risk, 35.1% of the area to moderate risk, 39.8% of the area to high risk, and 5.6% of the area to very high risk. Furthermore, another investigation reported that 23% of total wheat growing areas is located in high and very high risk class; corn and rice are 16% and 14% respectively. The use of risk indexes in water resource management to assess water system exploitation policies has several advantages [
16]. Yano et al. [
25] introduced a new index of sectoral and statistical demand access. This index not only specifies the monthly volume of available and required water, but it also compares the volumes of available and demanded water based on an assessment of environmental water needs and establishes a statistical relationship between them. Abedzade et al. [
26] proposed a risk-based assessment of water resources development plans under the sustainable development framework. The authors applied Fuzzy Fault Tree Analysis (FFTA) to assess water resources development plans. FFTA is a fuzzy logic-based approach that comprehensively analyzes system failure paths and probabilities while accounting for inherent uncertainties. The study carried out by Deylami et al. [
27] examined and analyzed the resilience, flexibility, stability, and adaptation solutions in facing deep uncertainty management and their application in complex water systems. A comparative descriptive method was employed in their study, and data was gathered from library sources. The study’s findings revealed that the adaptation approach, which can take into account multiple uncertainties, has the greatest potential for use in the governance and management of water systems. Furthermore, it automatically adapts to changes while maintaining the system’s main path.
A part of the literature is devoted to MCDM methods such as Delphi, AHP (Analytic Hierarchy Process), TOPSIS (Technique for Order of Preference by Similarity to Ideal Solution), PROMETHEE (Preference Ranking Organization Method for Enrichment Evaluations), NSGA II (non-dominated sorting genetic algorithm), and GA (genetic algorithm) and so on for handling different water management problems. For instance, Shastri et al. [
28] provided a review to discuss the application of various MCDM methods, such as AHP, PROMETHEE, Grey Relational Analysis (GRA), ELECTRE (Elimination and Choice Expressing Reality), and VIKOR (VlseKriterijumska Optimizacija I Kompromisno Resenje) to water resources and climate science problems. The paper emphasizes the growing need for robust decision-making tools in water resource management. Gebre et al. [
29] conducted a systematic review of MCDM methods applied to water allocation problems. The study revealed that MCDM methods such as NSGA II, GA, and linear programming are commonly used to solve water allocation problems. Kaderi Mahdei et al. [
30] used a paradigmatic research method, a qualitative method, and an exploratory approach to determine solutions for water conservation in agriculture. They used the fuzzy Delphi method to reach an agreement among several water experts, demonstrating that water protection approaches can be classified into five categories: technical, managerial, policy, cultural, and infrastructure. Garai et al. [
31] proposed a multi-criteria water resource management technique for defining the available water resources in the agriculture field. To assess water management alternatives, the authors considered multiple criteria such as water availability, crop yield, and environmental impact.
Armas Vargas et al. [
32] applied a multi-criteria analysis to evaluate six theoretical frameworks related to the integrated management of water-environmental resources. The study analyzed the frequency of multiple criteria and used methods such as AHP, TOPSIS, and PROMETHEE. The results provided insights into the best approaches for managing water and environmental resources. Naeem et al. [
33] demonstrated how spatial technologies like remote sensing and GIS, combined with the AHP technique, provide a robust platform for studying groundwater potential zones. This helps both the public and government sectors understand potential zones for sustainable groundwater management. Abdo et al. [
34] integrated the AHP method within a GIS framework, using ten criteria such as slope, geomorphology, drainage density, land use/land cover, lineament density, lithology, rainfall, soil, curvature, and Topographic Wetness Index (TWI) for sustainable groundwater management. The findings provided objective and constructive outputs that can help decision-makers optimally manage groundwater resources.
According to the aforementioned studies, it can be seen that various MCDM methods are used to solve different water resource management problems, such as water resources and climate science issues, water resource allocation, assessing resource development plans, and so on. To the best of our knowledge, studies applying fuzzy ARAS in this field are very rare. In this line of research, only Ebrahimzadeh Azbari et al. [
35] have presented a multi-criteria group decision-making framework for selecting the best wastewater reuse allocation alternative. The authors have integrated the Stepwise Weight Assessment Ratio Analysis (SWARA) method for weighting criteria with the ARAS method for ranking wastewater reuse allocation alternatives. However, because of the advantages of the ARAS method, it is applied to solve multi-criteria decision-making problems in various fields. Application of this method can be seen in evaluating tourism centers [
36], sustainable material selection [
37], and marine risk assessment [
38]. To sum up, both the fuzzy Shannon entropy and fuzzy ARAS methods are established techniques that have been applied in various fields, including some areas within water resource management. However, the key contribution of our work lies in the novel integration of these two methods within a specific decision-making framework tailored for complex water resource management scenarios. While similar fuzzy MCDM methods have been used in related applications, to the best of our knowledge, the combined use of fuzzy Shannon entropy for objective weight determination and fuzzy ARAS for alternative evaluation has not been thoroughly explored in this context. This integration offers a systematic and transparent approach to decision-making under uncertainty, which is particularly relevant for water resource management. Moreover, in previous studies, each risk factor has typically been considered individually for water resource management. In contrast, this research incorporates all relevant risk factors simultaneously, offering a more comprehensive and integrated approach to water resource management. Water management requires balancing multiple risk factors, such as reliability, reversibility, vulnerability, flexibility, supply-to-demand, volume reliability, sustainability, drought risk, and modified Young stability. Fuzzy Shannon entropy can determine the importance of risk factors and fuzzy ARAS ranks different management strategies based on multiple risk factors, ensuring optimal decision-making.
3. Case Study
Chaharmahal and Bakhtiari Province is situated in the central-western region of Iran, nestled within the mountainous terrain of the Zagros range. The provincial capital, Shahrekord, is renowned for its high elevation, moderate yet rainy climate, and striking natural vistas. Moreover, the province is distinguished by its diverse cultural composition, notably marked by the presence of Bakhtiari tribes. Geographically, it shares borders with the provinces of Isfahan and Lorestan, and it features fertile agricultural lands alongside pristine natural landscapes that collectively contribute to its unique character.
Chaharmahal and Bakhtiari province depicted in
Figure 1 is regarded as one of the provinces with abundant water resources. This province has important rivers, like Karun and Zayandeh Rud, which contribute to drinking water, agriculture, and animal husbandry in the region. Rich water sources and beautiful natural landscapes are among the key factors driving the importance of water resource management in this region. In analyzing the unique characteristics of Chaharmahal and Bakhtiari Province, factors that distinguish the region from a geographical, climatic, and socio-economic perspective play a pivotal role in water resource management decisions. Geographically, its mountainous terrain, deep valleys, and intricate river networks result in an uneven distribution of water resources, directly impacting water accessibility and storage capacity. Climatically, irregular precipitation patterns, marked seasonal variations and the potential for drought or sudden heavy rainfall introduce significant uncertainties in water supply, thereby influencing managerial decisions. Moreover, socio-economic aspects—such as a predominantly rural population, traditional agricultural practices, and limited industrial development—shape local water consumption patterns and necessitate the adjustment of risk indices to align with regional priorities and specificities. Water resource management in Chaharmahal and Bakhtiari Province requires strategic alignment with its geographical, climatic, economic, and agricultural conditions. Based on these conditions, this paper proposed four scenarios for water resource management. These scenarios, when implemented effectively, can lead to better water resource management, improved agricultural productivity, and stronger economic resilience in this Province. Here’s how each proposed scenario can be effectively linked to local realities:
Changing Cultivation Patterns (A1): The province has diverse climatic conditions, ranging from mountainous regions to moderate plains. Adjusting cultivation patterns to match precipitation levels and temperature variations ensures sustainable water use (Climate). Switching from water-intensive crops to drought-resistant plants such as saffron or medicinal herbs can significantly reduce water consumption (Agriculture). Moreover, farmers need financial and educational support to transition to more sustainable crops, ensuring economic stability while conserving water resources (Economy).
Reducing Industrial and Drinking Water Consumption (A2): Industries dependent on water, such as food processing and steel production, should adopt water recycling technologies to minimize consumption (Economy). Water sources in the province mainly come from springs and permanent rivers, which are vulnerable to climate fluctuations. Managing consumption is essential for long-term sustainability (Geography). Implementing water-saving fixtures, public awareness campaigns, and gray water recycling for non-drinking purposes can enhance efficiency in water use (Urban Management).
Reducing Agricultural Water Demand (A3): Periodic droughts and decreasing rainfall emphasize the need for optimized water use in agriculture (Climate). Smart irrigation methods, such as soil moisture sensing and precision irrigation, can optimize water distribution (Agriculture). Lower water consumption in agriculture improves efficiency and reduces production costs, making it financially attractive for farmers (Economy).
Optimizing Irrigation Systems (A4): Transitioning to efficient irrigation systems like drip or subsurface irrigation minimizes water loss and improves irrigation effectiveness (Agriculture). Government incentives and financial support can facilitate the adoption of modern irrigation technologies by farmers (Economy). The province’s soil type and terrain influence the selection of irrigation systems, ensuring maximum effectiveness (Geography).
In our study, wheat was selected as the representative crop due to its regional prevalence and the availability of comprehensive water consumption data. It is important to note, however, that different crops possess distinct water requirements, growth cycles, and sensitivities to water stress, which can significantly influence the model’s risk indicators and decision-making outcomes. While the underlying methodology remains robust and adaptable, substituting wheat with another crop would require recalibrating the model parameters to accurately reflect the new crop’s specific water demands and risk profile.
To select the best scenario in the studied province, the introduced scenarios will be assessed based on several appropriate criteria in which risk indexes and sustainability concepts should be considered. There are several basic indicators, namely, reliability, reversibility, and vulnerability that influence the water reservoirs [
8]. The main risk indicators used in this paper are explained in detail in the next subsection. After determining the risk indicators, this study attempts to determine the importance of risk indexes by applying the fuzzy Shannon entropy method and assessing the water resource management scenarios by implementing the fuzzy ARAS method. To collect data, a questionnaire is designed to assess the possible scenarios in terms of risk indicators using experts’ opinions. Experts who work in the field of water resources management and are highly familiar with the topic under consideration can assess each scenario based on linguistic terms, including very little, little, medium, much, very much.
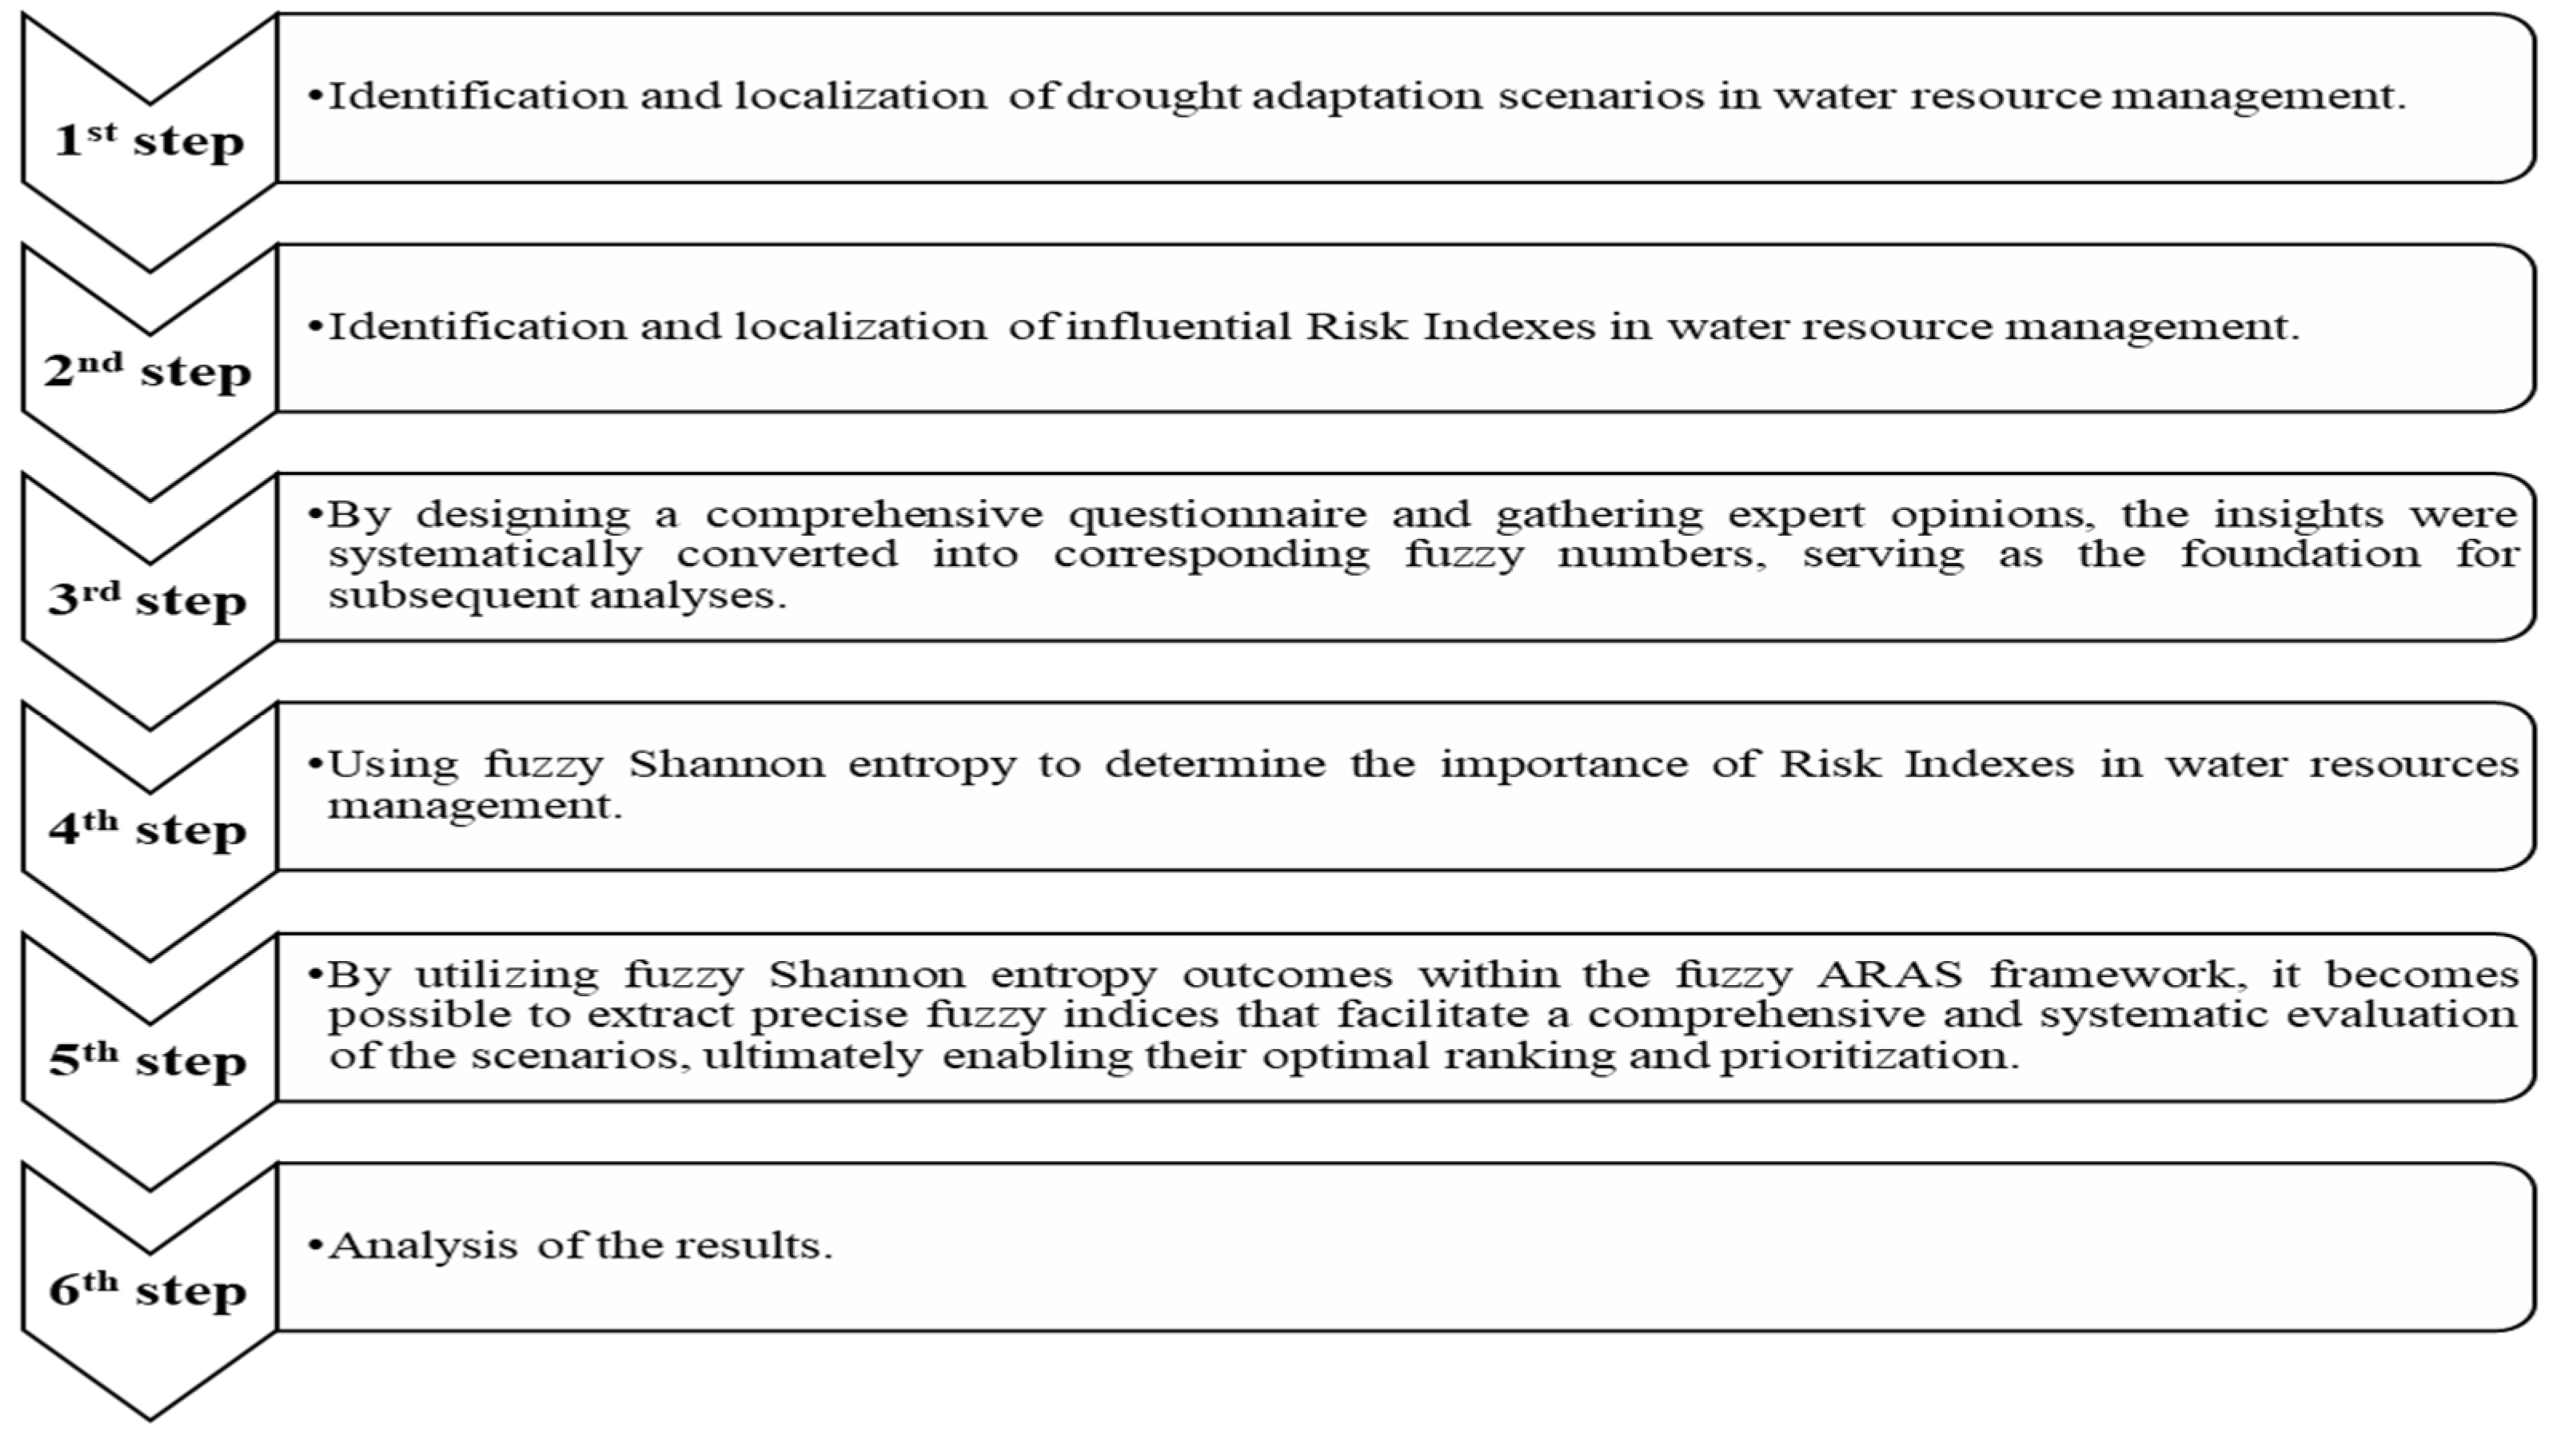
Figure 2 illustrates the steps of doing research and analyzing the results of this research.
3.1. Decision Criteria for Water Resource Management
In this subsection, the risk indexes used in this study are explained in detail. Hashimoto et al. [
8] introduced three basic indicators: reliability, reversibility, and vulnerability. These three indicators are among the most comprehensive and practical approaches for assessing the performance of water reservoirs. These indexes are crucial for determining whether a water system is likely to succeed or fail.
3.1.1. Reliability
The most important factor in the design of water supply systems is reliability. This index has been used for two types of time and volume reliability. The probability of the system being in the desired state in a given period demonstrates time reliability and is expressed as follows [
8]:
In the above equation, is the time reliability index, T is the length of the operation period, is the volume of demand in the dam at the t-th time, is the release volume from the dam tank at the t-th time, N is the number of months in which the release from the reservoir is equal to or more than the demand in the dam (ideal condition), and is the counting function (in such a way that it considers more releases than the demand in the entire exploitation period).
3.1.2. Reversibility
The reversibility index refers to the system’s ability to quickly restore an unfavorable state (failure). If the system repair is delayed, this indicates a major issue in the system’s performance. In other words, if the undesirable situation persists for an extended period, the system must be redesigned. The reversibility index is the most important metric for evaluating the crisis and the effectiveness of management policies. Moy et al. [
9] defined this index as the maximum amount of time a system spends in an unfavorable state. The reversibility index’s mathematical expression is as follows [
9]:
In the above equation, is the reversibility index (percentage), is the number of months in which the volume of release is less than the volume of demand (unfavorable state), is the system deficiency index (absolute value of the gap between release volume and demand volume), is the release volume from the dam reservoir at time ; is the count function (in such a way that it takes into account releases less than demand in the entire exploitation interval), and is the number of months in which the victory occurs immediately after the defeat.
3.1.3. Vulnerability
The vulnerability index is widely used when discussing climate change issues. Carter [
10] defined vulnerability as the following. Vulnerability refers to a system’s sensitivity to the negative effects of climate change and its inability to cope with it. This index indicates the extent and severity of damage in adverse conditions. It is critical that the accident occurs with a low probability but has significant consequences. The vulnerability index is defined as the ratio of the system deficiency (the total of deficiencies) to the total volume of water demand at the dam [
10].
In the above equation, is the vulnerability index (percentage), and is the maximum amount of demand over the entire operating period.
3.1.4. Flexibility
Given that the indexes mentioned above do not show any signs of convergence in their changes, analyzing reservoir exploitation policies and developing management scenarios will be challenging. To address this issue, Loucks [
11] has introduced a new index that combines the three previously mentioned indexes and covers all aspects of tank performance. This index is known as flexibility, and it is regarded as the most effective criterion for policymaking in the design and operation of the water supply system. The definition of the flexibility index is as follows [
11]:
where
is the flexibility index.
3.1.5. Supply to Demand
American society of civil engineers [
12] defined the index of supply to demand as a tool to evaluate the sustainability of water supply systems. The purpose of this index is to design the water supply system in such a way that it can deal with the challenges associated with current and future water resources. It is calculated using the following equation [
12]:
where
is the supply-to-demand index,
is the sum of the demand volume if the release volume is greater than or equal to the demand volume at time
t-th,
is the total demand volume at the end of the dam at time
t-th.
3.1.6. Volume Reliability
McMahon et al. [
13] studied the volumetric reliability index. This index displays the amount of water released during the whole operation time in comparison to the tank’s total capacity. The formula to calculate this index is as follows [
13]:
In the above equation, is the volume reliability index, is the volume of shortage in the water supply system in the t-th time step, is the demand volume in the dam’s reach in the t-th time step, is the release volume from the dam reservoir in the t-th time step.
3.1.7. Drought Risk
The weighted combination of reliability, reversibility, and vulnerability indexes is the drought risk index and shows the lack of water in the system due to the occurrence of drought [
15].
DRI is the drought risk index.
3.1.8. Sustainability of the Water Supply System
For the first time, the water supply system sustainability index was introduced by Ray et al. [
14], and its formula was provided by Sandoval-Solis et al. [
39]. It examines the sustainability of the system in response to hydrological and human-induced changes. The closer this index is to one, the better the system adapts to changes [
14,
39].
SUI is the sustainability index of the water supply system.
3.1.9. Modified Stability of the Water Supply System
The modified Young stability index considers the possibility of dehydration; the closer it is to one, the more critical it is [
16].
MSUI is the modified sustainability index of the water supply system. These management indexes examine the state of the system from a variety of perspectives, providing decision-makers and policymakers with a comprehensive and inclusive approach to the situation of water demand and delivery in years of higher water scarcity.
4. Proposed Fuzzy Shannon Entropy and Fuzzy ARAS for Water Resource Management
This section is devoted to our proposed model, which combines fuzzy Shannon entropy and fuzzy ARAS methods to assess and prioritize the water resources management scenarios based on the introduced risk indexes. Fuzzy Shannon entropy offers several advantages for weight derivation compared to other models, particularly in multi-criteria decision-making. Unlike subjective methods such as AHP, which rely on expert judgment, fuzzy Shannon entropy determines weights based on data distribution. This reduces bias and enhances objectivity in decision-making. Methods like AHP and Delphi rely on expert opinions, which can introduce inconsistencies. Fuzzy Shannon entropy, however, derives weights purely from data, ensuring a more reliable and unbiased weighting process [
40]. Many traditional weighting methods assume precise numerical values, which may not always be available. Fuzzy Shannon entropy effectively quantifies uncertainty, making it more suitable for complex environments where data is imprecise or fluctuating [
41]. Compared to methods like TOPSIS or VIKOR, fuzzy Shannon entropy requires fewer computational steps while maintaining accuracy. This makes it ideal for large-scale decision problems [
42]. Fuzzy Shannon entropy can be integrated with other MCDM methods, such as fuzzy ARAS, to enhance decision accuracy [
41]. The methods used in this paper are explained in detail as follows.
4.1. Fuzzy Shannon Entropy Method
The fuzzy Shannon entropy technique is a popular method for obtaining criteria weights from a decision matrix. Hosseinzadeh Lotfi and Fallahnejad [
41] introduced the fuzzy Shannon entropy technique for decision matrix data in the form of intervals or fuzzy numbers. In this study, the weights of criteria are extracted using the fuzzy Shannon entropy method. The steps for extracting the weight of risk indicators using the fuzzy Shannon entropy method are as follows [
41].
Step 1: Forming a fuzzy decision matrix
The first step is to create a fuzzy decision matrix. The fuzzy decision matrix is a row-column matrix, with rows representing research alternatives or options and columns representing indexes or criteria. Each cell in this matrix presents the evaluation of an alternative under each index, which is stated using the fuzzy spectrum. Linguistic expressions and fuzzy numbers in
Table 1 are used to assess alternatives under each index [
41].
Step 2: Converting fuzzy decision matrix to distance matrix
Suppose denotes the element of i-th row and j-th column of the decision matrix that is in the form of a triangular fuzzy number. Index i = 1, 2, …, m is used to present alternatives and index j = 1, 2, …, n is considered to present criteria. An alpha-level set of fuzzy variable includes a set of elements that belong to a fuzzy variable so that the degree of membership of these elements is greater than or equal to alpha. In other words, we have .
The conversion of the alpha set into the interval form is as follows [
41]:
where
. Based on the Equation (16), fuzzy data is converted into interval data.
Step 3: Decision matrix normalization
To normalize the decision matrix, the following equations are used. According to these equations, normalization can be achieved by dividing the lower and upper limits by the sum of the upper limits [
41].
Step 4: Determining the entropy of each index
Based on the following equations, the entropy of each index is calculated. In this regard,
is
and
is the number of research alternatives [
41].
where
and
denote the lower bound and the upper bound of interval entropy, respectively. It is worth mentioning that
or
is defined as 0 if
or
.
Step 5: Determining the degree of deviation of each index
Based on the following equations, the degree of diversification of each index is calculated [
41].
where
and
denote the lower and the upper bounds of the interval of diversification, respectively.
Step 6: Determining the weight of indexes
In this step, the weight of indexes is calculated based on the following equations [
41].
where
and
denote the lower and upper bounds of the interval weight of
j-th criterion, respectively.
4.2. Fuzzy ARAS Method
The ARAS method is one of the well-known methods for solving multi-criteria decision-making problems. It is also regarded as one of the most effective methods in this context. In this method, the sum of the weighted and normalized values of the criteria for each option is divided by the sum of the weighted and normalized values of the best option. This ratio is known as the degree of optimality. Options are ranked based on their degree of optimality. Various applications of this method can be seen in Tupenaite et al. [
43], Kersuliene et al. [
44], and Zavadskas et al. [
20]
. In this study, the fuzzy ARAS method is used to evaluate water resource management scenarios under fuzzy conditions. The steps for implementing fuzzy ARAS methods are as follows [
20,
43,
44]:
Step 1: Formation of a decision matrix
In the first step, a fuzzy decision matrix should be prepared whose elements are denoted by where i is used to show i-th option or alternative and j is used to show j-th criterion. Furthermore, shows the assessment value of i-th option under j-criterion, which is in the form of a fuzzy triangular number.
Step 2: Determining the ideal values
In this stage, an ideal alternative named
is created, which is the ideal solution. Its values are equal to the highest value for beneficial criteria and to the lowest value for non-beneficial criteria. They are obtained as follows:
where
is the optimal value of the j criterion and is in the form of a fuzzy triangular number.
Step 3: Normalization of the decision matrix
In this step, the fuzzy decision matrix is normalized based on the following equation.
where notation
is used to show the normalized decision matrix. The benefit type criteria are normalized as follows:
Furthermore, the cost type criteria are normalized as follows:
Step 4: Weighting the normalized decision matrix
In this step, it is assumed that
is the weight of the
j-th criterion, then the normalized decision matrix is multiplied by the weight of the criteria to obtain the normalized decision matrix (
). It is worth mentioning that the weight of the criteria in our proposed model was previously calculated using the fuzzy Shannon entropy method.
where
presents the weight (importance) of the
j criterion and
denotes the normalized rating of the
j criterion.
Step 5: Optimality function and the utility degree of alternatives
In this step, the optimality function for alternative
i is calculated as:
where
denotes the value of the optimality function of i-th alternative. The greatest value is the best, and the lowest one is the worst. As
is a fuzzy triangular number in the form of
, it can be defuzzified according to the following formulations.
Finally, the alternative utility
is obtained by comparing the utility degree of alternative
i with the ideally best one
. Alternatives can be prioritized based on their utility degree. The alternative utility can be written as follows:
where
denotes the alternative utility, which can take a value in the interval [0, 1]. The larger the value of
, the preferable the alternative.
6. Conclusions
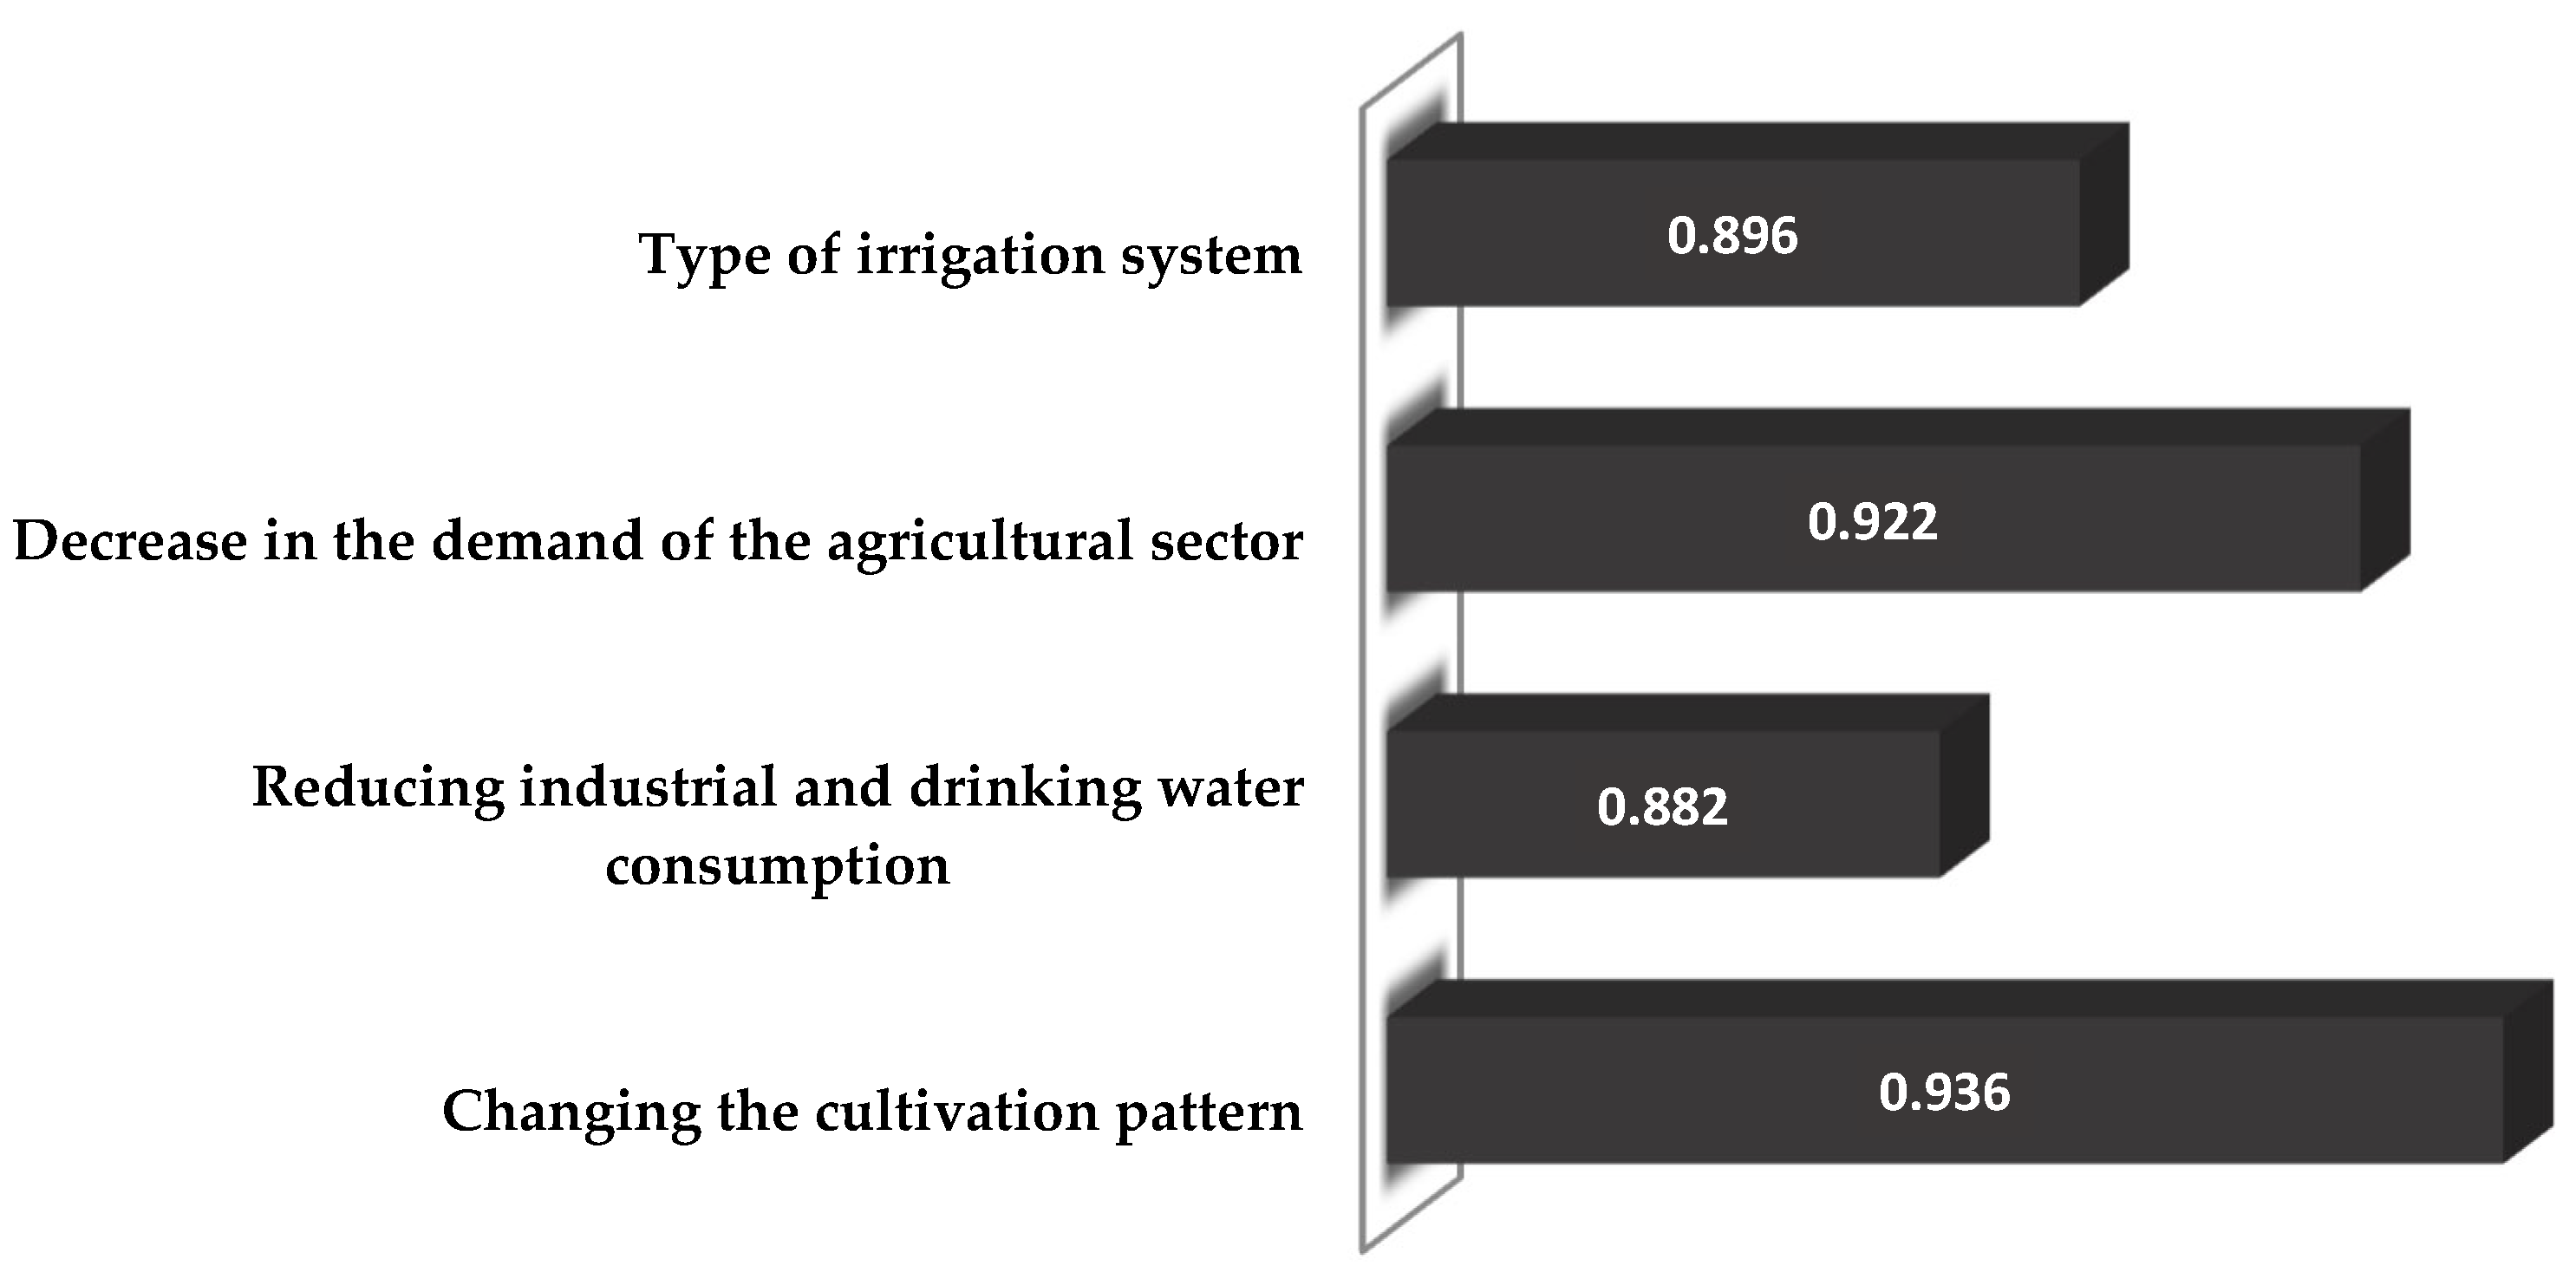
Applying a certain plan and providing all the necessary conditions for water resource planning appears to be challenging and impossible. In this paper, an integrated model of fuzzy Shannon entropy and fuzzy ARAS was proposed to assess and prioritize the water management scenarios in drought conditions. To do so, the first nine important risk indexes were introduced, including the time reliability index, the reversibility index, the vulnerability index, the flexibility index, the supply-to-demand index, the volume reliability index, the drought risk index, the sustainability index, and the modified sustainability index. These risk indexes were considered to evaluate four water management scenarios in drought, namely, changing cultivation patterns, reducing industrial and drinking water consumption, reducing agricultural demand, and the type of irrigation system. The results of applying the fuzzy Shannon entropy method revealed that the volume reliability index with a weight value of 0.124, the vulnerability index with a weight value of 0.119, and the water supply system sustainability index with a weight value of 0.118 are the most effective risk indexes in water resources management. The weights of risk indexes determined by fuzzy Shannon entropy are used in the fuzzy ARAS method. The results of applying fuzzy ARAS for water resources management to face drought showed that changing the cultivation pattern, reducing the demand of the agricultural sector, the type of irrigation system, and reducing industrial and drinking water consumption have received first to fourth priorities, respectively. The results revealed that the reliability in the volumetric assessment of the crop pattern change has achieved a higher score in Chaharmahal and Bakhtiari province. The current study focuses on the integration of fuzzy Shannon entropy and fuzzy ARAS within a multi-criteria decision-making framework. Leveraging large-scale data processing and machine learning algorithms could lead to more dynamic, data-driven, and predictive approaches. Future studies could explore how combining these advanced computational techniques with fuzzy MCDM models might further improve the reliability and efficiency of water resource management strategies, particularly in complex and data-rich environments. Finally, it can be stated that the proposed methods are applied to prioritize four water management scenarios, which are defined based on the geographical, climatic, economic, and agricultural conditions in Chaharmahal and Bakhtiari Province. Given the inherent differences in climatic, geographical, and water resource conditions, the results obtained from this study are valid exclusively for this province and cannot be directly generalized to other regions. This limitation arises because expert responses may differ across regions due to the unique characteristics of local environmental and water conditions. Accordingly, generalizing the results necessitates distributing separate questionnaires and conducting a thorough analysis of local data in each region. Therefore, to enhance the generalizability and global applicability of the research findings, it is recommended that future studies implement the model in diverse settings and conduct a rigorous analysis of local characteristics, potential challenges, and the necessary adaptations for effective model integration.


