Article

Urban Agglomeration Technology Innovation Networks, Spatial Spillover, and Agricultural Ecological Efficiency: Evidence from the Urban Agglomeration in the Middle Reaches of the Yangtze River in China

1
School of Economics, Guizhou University of Finance and Economics, Guiyang 550025, China
2
School of Applied Economics, Guizhou University of Finance and Economics, Guiyang 550025, China
*
Author to whom correspondence should be addressed.
Sustainability 2025, 17(11), 5109; https://doi.org/10.3390/su17115109
Submission received: 31 March 2025 / Revised: 7 May 2025 / Accepted: 21 May 2025 / Published: 2 June 2025
(This article belongs to the Special Issue Advanced Agricultural Economy: Challenges and Opportunities)

Abstract

:
Urban agglomerations serve as essential platforms for regional innovation, while agricultural technology innovation and diffusion play pivotal roles in enhancing agricultural eco-efficiency (AEE). Based on panel data from the Urban Agglomeration in the Middle Reaches of the Yangtze River (UAMRYR) (2001–2023), this study employs a super-efficiency slacks-based measure model incorporating undesirable outputs to evaluate agricultural eco-efficiency. A modified gravity model is utilized to construct agricultural technology innovation networks (ATINs) in urban agglomerations, and a spatial Durbin model is applied to examine the spillover effects of network structure on eco-efficiency. The results indicate that: (1) Higher-degree centrality within the innovation network significantly improves local agricultural eco-efficiency and produces positive spillover effects on neighboring cities; (2) both direct and spillover effects are significant in central cities, whereas sub-central cities exhibit only a significant direct effect, and peripheral cities display an insignificant direct effect but a significant spillover effect; and (3) enhanced urban informatization, agricultural financial development, and industrial scale substantially strengthen the spatial spillover effects of the innovation network, thereby further advancing agricultural eco-efficiency within the agglomeration. These findings offer theoretical and empirical support for optimizing agricultural technology pathways and enhancing eco-efficiency in urban agglomerations.

1. Introduction

Chinese agricultural growth has long depended on rising input intensity [1], leading to resource inefficiency and environmental degradation [2]. The widespread use of chemical fertilizers, pesticides, and fossil fuels is a major factor contributing to current agricultural pollution [3,4]. According to recent World Resources Institute data, agriculture accounted for 12.16% of global greenhouse gas (GHG) emissions in 2021; in that year, China’s agricultural emissions totaled 0.634 Gt CO2-eq, representing 10.81% of the global agricultural total. ANSP poses another major challenge. The Second National Pollution-Source Survey Communiqué reported that agriculture was responsible for 49.77% of national chemical oxygen demand (COD), 46.52% of total nitrogen, and 67.21% of total phosphorus discharges in 2017, making it the principal COD and nutrient contaminant source. Furthermore, the China Council for International Cooperation on Environment and Development estimates agriculture contributes about 17% of China’s overall GHG emissions, underscoring its significant role in national carbon output growth. Recently, emerging green production technologies have shown promise in improving productivity while protecting ecosystems [5,6]. Integrated sustainable farming systems can deliver 2.32- to 2.35-times higher economic returns and reduce ANSP by 10.21–59.01% compared to monoculture [1]. However, large-scale deployment of these approaches demands continued innovation, considerable investment, and broad societal coordination.
Amid these challenges, research attention to agricultural eco-efficiency (AEE) in China has grown. Existing literature focuses on three main areas: evaluation methodologies, national/regional evolution and distribution of AEE, and factors shaping efficiency. Methodologically, SFA—a parametric method that decomposes deviations from the frontier into inefficiency and random error—accounts well for stochastic effects, improving accuracy, but typically handles only single-output cases and may suffer from multicollinearity [7]. DEA, a nonparametric benchmark approach [8], is suitable for multi-input/output analysis; however, basic DEA often ignores undesirable outputs and redundancies [9]. The data envelopment analysis slack-based measure (DEA-SBM) model [10] overcomes these drawbacks and slack variables for a more holistic efficiency assessment. Nationally, China’s AEE has increased markedly in recent years, with greater spatial agglomeration [11,12,13]. From 1978 to 2017, national AEE rose from 0.405 to 0.713—a 76% increase. Notable regional heterogeneity exists, with the northeast, east, and south exceeding the national average [14]. While provincial disparities persist [15], they show a general decreasing trend over time [11,16]. Key determinants of spatial differences include energy and water inputs and carbon emissions [17]. Furthermore, spatial spillover effects among provinces have shifted in recent years, with diminishing negative and strengthening positive correlations [18]. At the regional and local scales, studies reveal considerable variation and offer targeted insights. Zhang and Jin [19] found significant intra-provincial differences in AEE across 44 Liaoning counties; Deng and Gibson [20] highlighted trade-offs between agricultural output and urbanization in Shandong, signaling the need for localized technological adjustments to bolster AEE. Similarly, Yang et al. [21] showed that socio-economic development, increased technology investment, emission reduction, and improved pollution controls all positively influence land-use eco-efficiency.
Cities, the fundamental units in global competition, are becoming the core of the global economy as it shifts to a space of flow, highlighting their growing significance. Additionally, they have transitioned from standalone cities to integrated urban agglomerations [22,23,24]. As a result, these urban agglomerations have become core areas driving national innovative transfer and economic development [25]. With their continuous growth in both scale and influence, urban sprawl emerges and agricultural land decreases. Consequently, farmers begin to migrate, agricultural markets expand, and consumer demand for green agricultural products increases [26]. This change necessitates higher requirements for agriculture production: Beyond improving production efficiency and resource utilization, we must also consider environmental protection to achieve sustainable agricultural development.
Agricultural technology innovation is a key factor that propels green development in agriculture. Additionally, it has a knowledge spillover effect. A higher level of informatization and openness accelerates the diffusion of agricultural technology innovation between industries and regions. Moreover, the spillover provides possibility for increasing agricultural ecological efficiency (AEE) on a larger scale [27]. Each city within a cluster establishes an intensive network of agricultural technology innovation with other cities based on cooperation and communication, promoting the sharing of agricultural technology, experience, and resources [28]. This drives faster innovation in agriculture and advances the modernization of traditional production systems in urban agglomerations, resulting in improved energy use, reduced consumption, and lower emissions [29]. Through technical communication and the demonstration effect, especially, agricultural technology innovation within urban agglomerations facilitates diffusion and sharing and reduces environmental burden. The form of the technology innovation network inspires us to cooperate, conduct innovation research, consolidate resource advantages, and accelerate the research, development, and application of agricultural ecological technology. The agricultural technology innovation network within urban agglomerations typically relies on advanced technologies to achieve refined management of the agricultural production process and provide decision support, ensuring the health of the agricultural ecosystem and improving agricultural ecological efficiency.
Previous studies examining the link between agricultural technology innovation networks (ATINs) and AEE have mainly focused on several key areas. Firstly, research emphasizes the influence of ATIN in promoting the dissemination of technology. By analyzing the social network structure and information flow paths, it investigates how inter-node connections within the network affect the spread of agricultural technologies, highlighting the critical role these networks play in improving farmers’ willingness to accept and adopt new technologies [30,31,32]. Additionally, emphasis is placed on how ATINs optimize resource allocation and improve management efficiency. By analyzing the flow of information and resources within ATINs, research explores the network’s impact on resource utilization efficiency and agricultural production management, thus highlighting how technology innovation networks contribute to enhancing agricultural ecological efficiency [33,34]. Several scholars also focus on how innovation networks promote the development of ecological agriculture. By analyzing the dissemination and application of eco-friendly technologies within the network, they examine the impact of technology innovation networks to improve soil quality and protect biodiversity [35]. However, there is a scarcity of literature studying the impact of ATINs within urban agglomerations on AEE from the dimensions of urban agglomerations and the perspective of urban–rural interaction. Urban agglomerations serve as important spatial carriers for regional innovation ecosystems, with their internal urban areas being the main sources of technological innovation. In contrast, the vast rural areas within urban agglomerations provide a broad market space for the transformation and application of innovative achievements. Additionally, it is noted that some agricultural technology innovations, such as crop breeding and soil improvement technologies, are regionally adaptable, making them difficult to disseminate across national, provincial, or different industrial boundaries. Therefore, researching the diffusion of agricultural technology innovations within the scope of urban agglomerations can effectively “capture” the diffusion effects of such technology innovation. In summary, studying the impact and mechanisms of ATINs within urban agglomerations on agricultural ecological efficiency (AEE) is of great significance.
The current scholarship on AEE appears to have three potential areas of insufficiency. First, most studies operate at the national scale [11,12], at the provincial scale [15], or within a single macro-region such as the Yangtze River Economic Belt [23], while analyses that follow the spatial–temporal evolution of AEE across urban agglomerations remain rare. Second, in calculating AEE, researchers typically define “desired outputs” as total agricultural economic value [19,36] but seldom include measures that reflect ecosystem service value or the sector’s carbon-sink capacity, which leaves the efficiency portrait incomplete. Third, although existing work documents the benefits of green technologies [6,23], detects spatial spillovers among neighboring areas [17], and probes the urban–rural dynamics that shape agricultural ecological efficiency [20], the role of technology innovation networks within urban agglomerations and their attendant spillover channels remains largely unexplored.
To address these gaps, the present study advances in three stages.
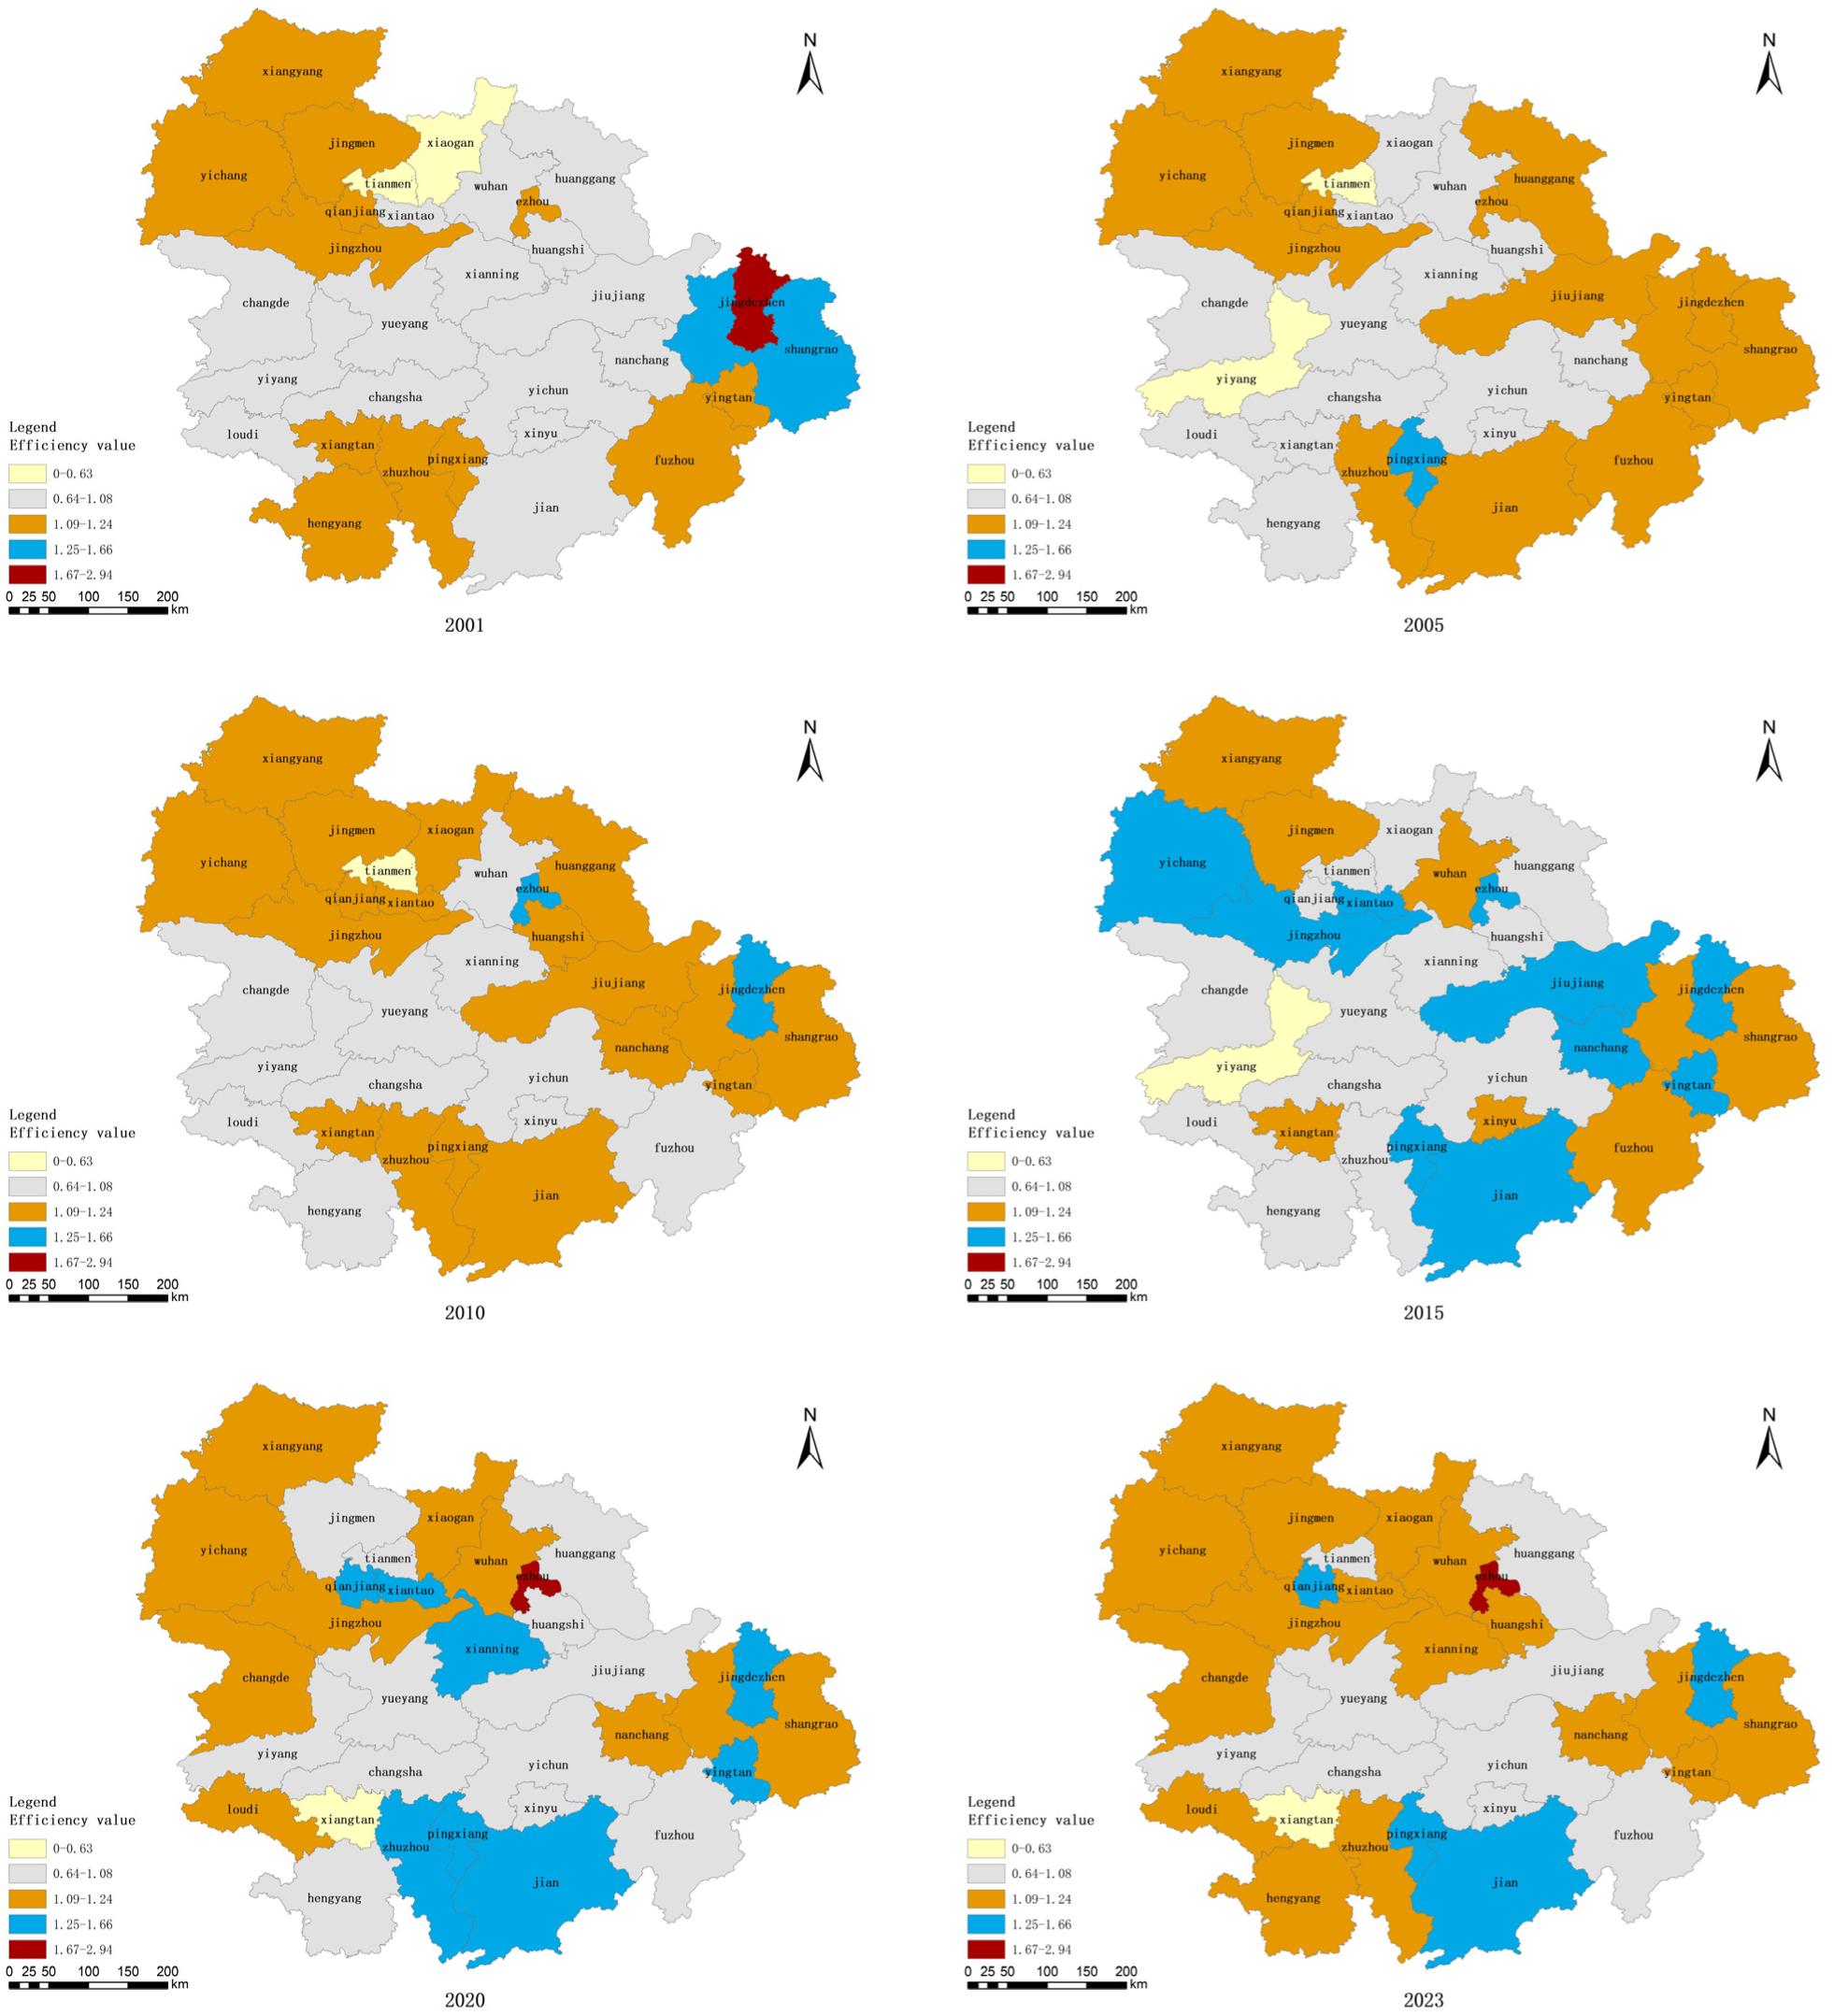
Stage 1: We build a comprehensive AEE index system that makes ecological contributions explicit. Land, labor, irrigation water, and chemical fertilizer constitute the inputs; total agricultural output, agricultural carbon sequestration, and agricultural ecosystem service value serve as desired outputs; and agricultural carbon emissions and non-point-source pollution are treated as undesirable outputs. City-level AEE is then estimated with a super-efficiency DEA model that accommodates undesirable outputs. It should be emphasized that city-level AEE encompasses both the agricultural efficiency of urban areas and the AEE of rural areas within city administrative divisions.
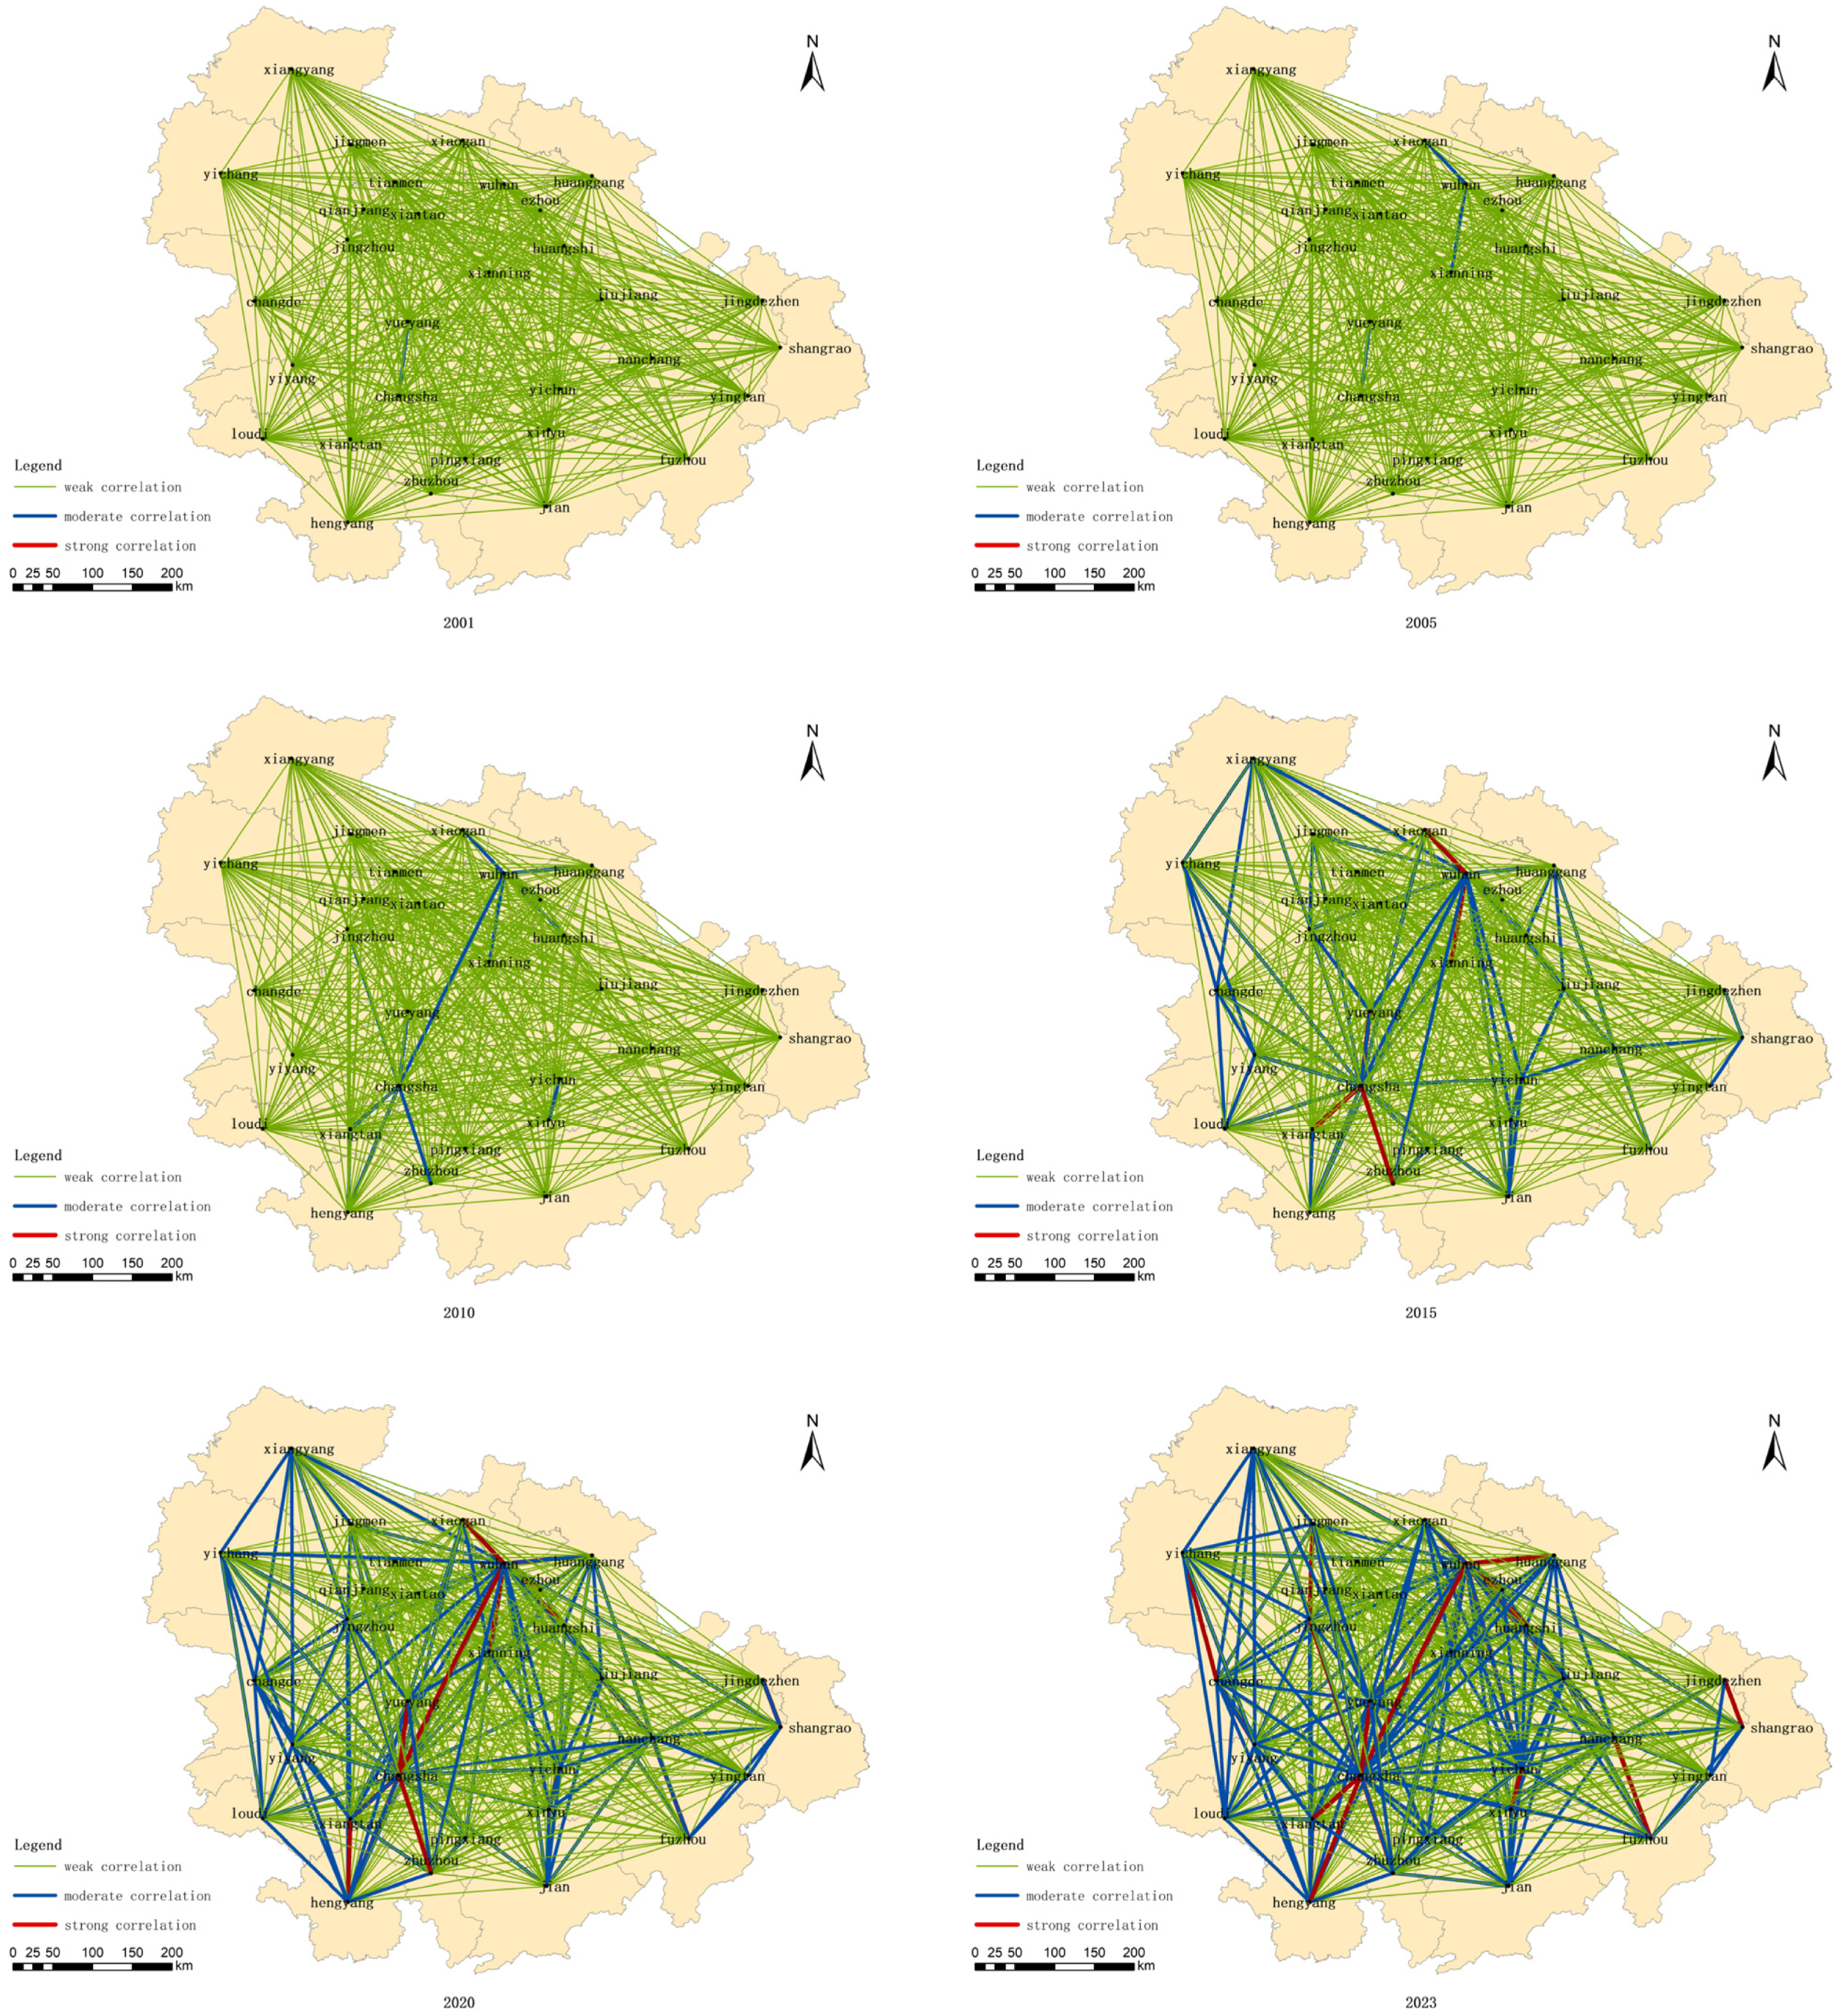
Stage 2: A modified gravity model is applied to map the spatial network of agricultural technology innovation within urban agglomeration. Visualization tools track the co-evolution of the AEE and the agricultural technology innovation networks (ATINs) in the Urban Agglomeration in the Middle Reaches of the Yangtze River, revealing key developmental patterns.
Stage 3: A spatial Durbin model is employed to quantify the impact of the ATINs on city-level AEE. The results uncover heterogeneous effects across core, sub-core, and peripheral cities, and demonstrate that digital infrastructure, agricultural finance, and industrial scale each positively moderate the efficiency gains generated by networked innovation.
This paper contributes the following three folds. First, it incorporates agricultural ecological values, such as agricultural carbon sequestration, into the expected outputs, thereby optimizing the measurement methods for AEE. Second, the analysis focuses on the dynamic development trends of AEE and ATINs in the Urban Agglomeration in the Middle Reaches of the Yangtze River (UAMRYR), summarizing patterns of evolution. Third, based on the regional innovation theory, it explores theoretical mechanisms by which ATINs within urban agglomerations affect AEE. Additionally, by constructing a spatial Durbin model, it empirically analyzes the impact of ATINs on city-level AEE. It examines the specific effects of three influencing mechanisms: informatization level, agricultural finance, and agricultural industrial scale.

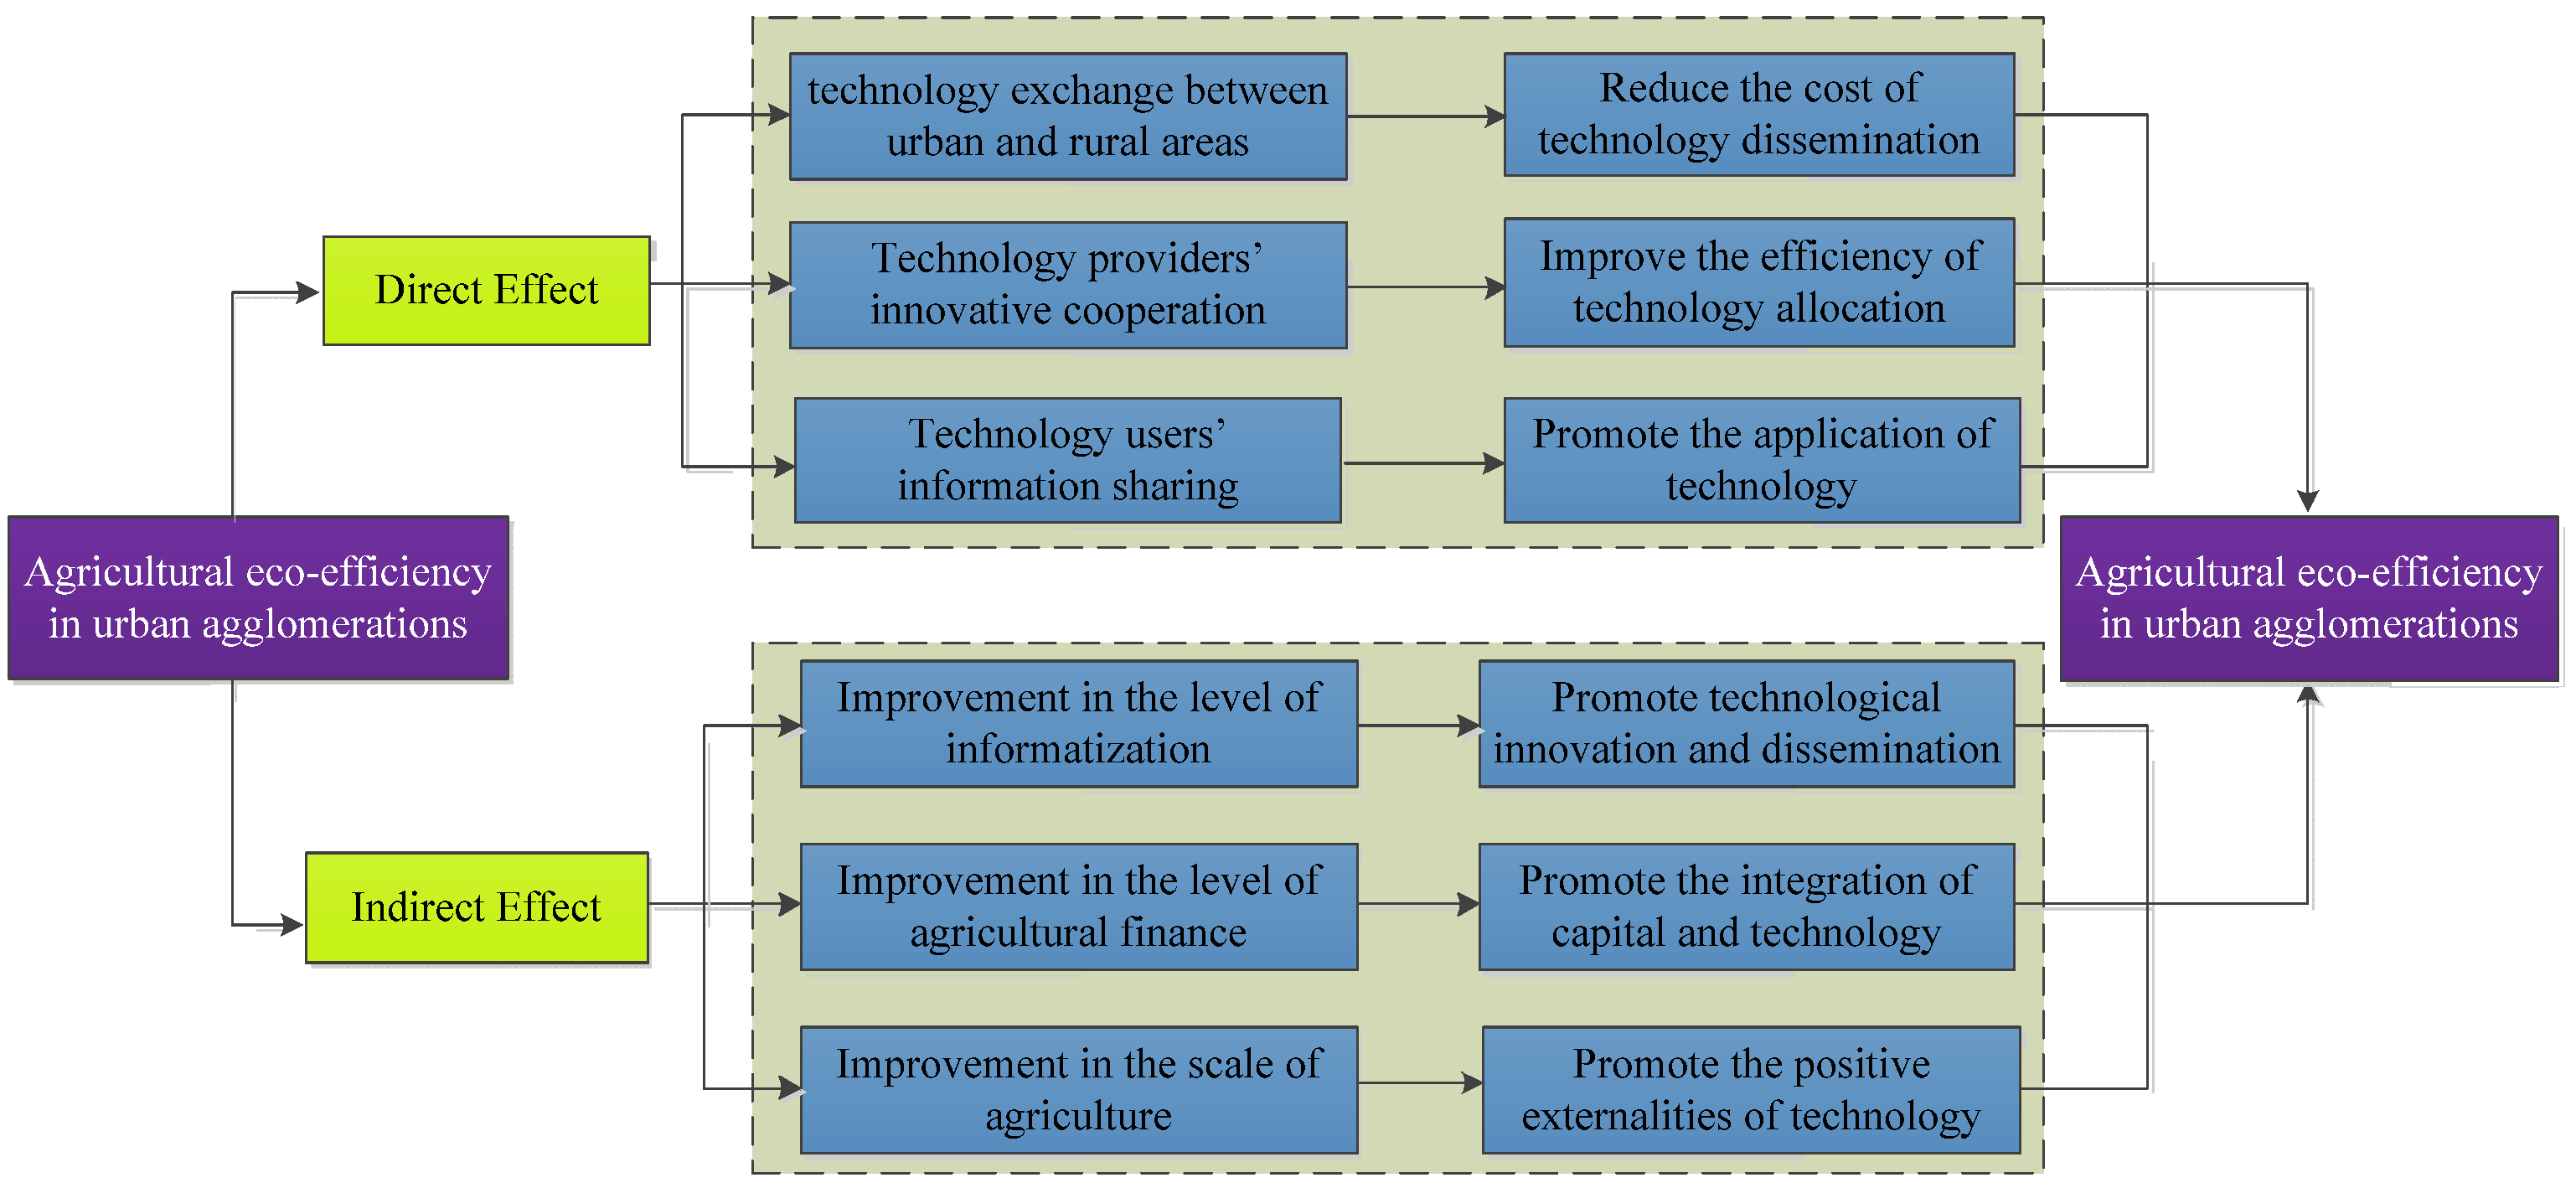
2. Theoretical Analysis

Urban agglomerations serve as important spatial carriers for regional innovation systems. Within urban agglomerations, individuals in many industries who are involved in innovation, such as knowledge and technology producers (research institutions, technology intermediaries, and educational organizations), knowledge users (enterprises, suppliers, and customers), and regional policymakers engage in competition and cooperation through technology innovation networks to promote technology innovation and diffusion [37]. ATINs can extend the impact of technological externalities and, through inter-regional technology transfer, alleviate the limitations of traditional agricultural production techniques in relatively backward areas inside the urban agglomeration, significantly enhancing local agricultural production efficiency. Moreover, agricultural innovation networks facilitate a more accurate assessment and utilization of resources by agricultural producers through information sharing and cooperative mechanisms, thus alleviating information asymmetry and market failure in agricultural production to a certain extent [38]. Cooperation and information sharing among agricultural producers within urban agglomerations cultivate a positive cycle of technology innovation and experience sharing, leading to improved AEE and better ecological environments across the agglomeration [39]. In addition, ATINs within urban agglomerations provide a broader space for innovation incentives. Through technological exchange and cooperation, agricultural producers can more easily access technological support, thereby driving agriculture towards more ecologically friendly and efficient practices and enhancing AEE [40,41]. Given these insights, the study formulates research Hypothesis 1.
Hypothesis 1: 
The urban agglomeration’s agricultural technology innovation network can significantly enhance AEE, with the network’s spatial spillover effect further strengthening this positive impact.
A regional innovation ecosystem is known as a network of relationships formed through competition and cooperation among regional innovation entities within a specific innovation environment, where the flow of innovative elements such as matter, energy, and information are the main content of network connections [42]. Improved levels of informatization can accelerate the circulation of innovative factors within a region, enhancing the efficiency of technology network innovation and diffusion. More specifically, the ability of internet information to transcend time and space makes it easier for agricultural technology to break through urban boundaries, resulting in cross-regional technological spillovers. As the level of informatization in urban agglomerations increases, the circulation of innovative elements such as information, talent, and capital among cities is accelerated, strengthening the innovative connections among cities [43,44]. The advancement of informatization in rural areas of urban agglomerations enhances the interaction of information between cities and the countryside, facilitating the diffusion and application of advanced agricultural technologies in rural areas [45]. The increasingly diversified channels of information dissemination also alleviate the information asymmetry between transaction parties to some extent, reducing the cost of technology transactions. At the same time, informatization can provide more abundant and accurate data support to boost the efficiency of innovation resource allocation [46] and enhance the level of collaborative cooperation among participants in the agricultural technology innovation network, further promoting the spillover of agricultural innovation technology. Given these insights, the study formulates research Hypothesis 2.
Hypothesis 2: 
Informatization enhances the technology innovation capabilities and technological diffusion of urban agglomerations, strengthening the spatial spillover effect of the agricultural technology innovation network.
In rural areas, financial markets are characterized by relatively strong information asymmetry and high transaction costs, leading to insufficient credit supply related to agriculture and presenting considerable financing constraints for the development of agriculture and rural areas [47]. The development of agricultural finance can promote agricultural technological advancement and strengthen the inter-regional diffusion of agricultural technology, thereby narrowing the technology gap and increasing the green total factor productivity in agriculture [48]. Agricultural financial institutions utilizing their industry resources and social influence provide necessary financial support and consulting services for new agricultural technologies to facilitate the application and promotion of agricultural innovation technologies within urban agglomerations [49]. At the same time, by integrating their own information resources and breaking down information barriers between enterprises and farmers, they can offer better cooperation opportunities and development spaces for various market entities within urban agglomerations [50]. Given these insights, the study formulates research Hypothesis 3.
Hypothesis 3: 
The development of agricultural finance has improved agricultural market entities’ ability to receive and apply new technologies, strengthened the spillover and diffusion of agricultural technology through innovation networks, and helped enhance AEE.
The scale of the agricultural industry affects the spillover of technological innovation, particularly its external effects on innovation technology [51]. A larger agricultural industry implies the participation of more farmers, enterprises, and consumers in agricultural production and consumption activities, leading to tighter connections between farmers and enterprises and smoother information flow. This will be beneficial for the research, development, and application of agricultural science and technology. Technology enterprises and research institutions can create agricultural technologies that are better tailored to market needs, thereby reducing costs and enhancing efficiency [52]. The expansion of the agricultural industry accelerates the formation of a unified technology market within urban agglomerations. To maintain their competitive advantages, agricultural technology innovation enterprises will increase investment in research and development. This will further promote the development of the agricultural technology innovation network within urban agglomerations and have a positive impact on the enhancement of AEE within the agglomerations [53]. Given these insights, the study formulates research Hypothesis 4.
Hypothesis 4: 
The expansion of the agricultural industry strengthens the technological network connections within urban agglomerations, enhances the competitiveness of technological innovation, promotes the development of innovation networks, and has a positive effect on enhancing the AEE of urban agglomerations.
Based on the above theoretical analysis, the mechanism analysis framework of the article is shown in Figure 1 as follows:

3. A Descriptive Analysis of Agricultural Technology Innovation Network

3.1. Case Study Background

This study takes the Urban Agglomeration in the Middle Reaches of the Yangtze River (UAMRYR) as its research object and examines how the agglomeration’s agricultural technology innovation network influences agricultural eco-efficiency. According to the Development Plan for the Urban Agglomeration in the Middle Reaches of the Yangtze River, approved by China’s State Council on 26 March 2015, the agglomeration comprises 31 cities in Hubei, Hunan, and Jiangxi Provinces, covering 317,000 km2 and home to more than 130 million people. The 2023 Development Report on the UAMRYR indicates that the resident urbanization rate reached 67% in 2023, yet over 39 million people still live in rural areas. Identified as both a national modern agriculture production base and an important innovation hub [54], the agglomeration recorded an agricultural output value of CNY 930.16 billion in 2023—76.61% of the combined agricultural output of Hubei, Hunan, and Jiangxi and 10.36% of the national total. On average, the primary sector accounts for roughly 10% of GDP across the 31 cities, underscoring agriculture’s pivotal role in regional development. Moreover, rural–urban integration in Hubei, Hunan, and Jiangxi ranks among the highest nationwide, and linkages between cities and their surrounding countryside are especially close [55]. These characteristics make the UAMRYR an ideal case for investigating the impact of agricultural technology innovation networks on AEE at the urban agglomeration level.

3.2. Agricultural Ecological Efficiency Measurement and Spatiotemporal Evolution

3.2.1. Method for Measuring Agricultural Ecological Efficiency

The mainstream method for measuring AEE is the evaluation model based on DEA. Traditional models do not require the prior setting of model parameters, eliminating the subjective influence of human weights. However, as they belong to radial and angular measurement methods, they may cause “congestion” or “slack” of input factors, leading to biases in efficiency value calculations. To overcome these shortcomings, Tone [56] proposed a super-efficiency SBM model, which incorporates undesired output into the objective function and differentiates between efficient decision-making units, making the model results more precise. Considering this, this study selects the super-efficiency SBM model that includes undesired outputs to measure AEE, constructed as follows:
m i n ρ = 1 1 m i = 1 m S i x x i k 1 + 1 p 1 + p 2 r = 1 p 1 s r y y r k + t = 1 p 2 s t b b t k
s . t . j = 1 , j k n x i j λ j + s i x = x i k , i = 1,2 , , m j = 1 , j k n y r j λ j s r y = y r k , r = 1,2 , , p 1 j = 1 , j k n b t j λ j + s t b = b t k , t = 1,2 , , p 2 λ j , s i x , s r y , s t b 0 , j = 1,2 , , n
In the formula, n is the number of decision-making units ( D M U s ); j is the D M U alphabetized by j ; k is the D M U alphabetized by k in the current efficiency calculation; x i k , y r k , and   b t k   represent the input indicators, desired outputs, and undesired output indicators, respectively; s i x ,   s r y , and   s t   b are the slack variables for input, desired, and undesired outputs, respectively; p 1 and   p 2   represent the quantities of desired and undesired outputs; r and t represent the desired and undesired output indicators alphabetized by r and t ; ρ is the value of AEE; and λ represents the weights.

3.2.2. Selection of Agricultural Ecological Efficiency (AEE) Indicators

AEE refers to the ratio of agricultural outputs to inputs, factoring in environmental elements—aiming to maximize output with minimal environmental and resource costs. Previous studies have mostly measured AEE using only total agricultural output, often overlooking the broader contributions of agricultural ecosystems. Ecosystem services are generally grouped into four categories: provisioning, regulating, supporting, and cultural. These are further broken down into 11 specific functions, including the production of food and raw materials, as well as gas regulation [57,58]. To provide a more comprehensive and scientifically sound measure, this study incorporates additional ecological values like agricultural carbon sinks into the expected output when constructing the evaluation index system. Specifically, land, labor, water, machinery, pesticides, fertilizers, agricultural films, energy, and draft animals are used as input variables. To fully reflect ecological contributions, expected outputs include total agricultural output, carbon sequestration, and ecosystem service value, while undesired outputs are captured by carbon emissions and pollution from agricultural activities [59,60]. Based on these criteria, a measurement index system for AEE in the UAMRYR is established, as detailed in Table 1.
Among them, the relevant input indicators and the agricultural output value in the desired output are derived from the China Rural Statistical Yearbook and the China Urban Statistical Yearbook. For the estimation of agricultural carbon sink in the expected output, according to existing studies [61], only the net primary production formed by the photosynthesis of crops is considered, that is, the biological yield. The formula is as follows:
C = i = 1 k C i = i = 1 k c i Y i 1 r H I i
where C is the total amount of carbon absorbed by crops, Ci is the amount of carbon absorbed by a certain crop (only rice, wheat, and maize are considered for crops); k is the number of crop species; ci is the amount of carbon absorbed by the crop to synthesize a unit of organic matter through photosynthesis; Yi is the economic yield of the crop; r is the water content of the economic product portion of the crop; and HIi is the economic coefficient of the crop. Specific data are from the China Urban Statistical Yearbook, Hubei Rural Statistical Yearbook, Hunan Rural Statistical Yearbook, and Jiangxi Statistical Yearbook. For the estimation of the value of ecosystem services in the expected output, according to a study by Constanza et al. [57], six service functions of cropland and forestland in the ecosystem are selected for measurement, including climate regulation, water conservation, soil formation and protection, waste treatment, biodiversity conservation, and recreation culture (gas regulation, food production, and provision of raw materials functions are not repeated for accounting). The value of agroecosystem services is calculated as:
E S V = U j i × C j
where ESV is the value of ecosystem services (CNY), Uji is the unit price of the ith ecosystem service of ecosystem j (CNY/hm2), the specific calculation method refers to the study of Xie et al. [62], and the relevant data come from China Statistical Yearbook. Cj is the area of the jth type of ecosystem (hm2), and the data of urban ecosystem area come from the corresponding provincial and municipal statistical yearbooks. In the undesired output, agricultural carbon emissions refer to Wang and Zhang [15], using corresponding indicators multiplied by coefficients for estimation, including six categories of carbon sources: fertilizers, pesticides, agricultural films, diesel, plowing, and agricultural irrigation. Among them, plowing data are based on the actual sown area of crops, and agricultural irrigation is based on the actual area irrigated in the current year. The pesticide residue, fertilizer pollution, and agricultural film pollution are synthesized into the agricultural activity pollution emission index using the entropy method to characterize the pollution status of agricultural activities, and the estimation of each pollution coefficient refers to the research results of Zhang et al. [63]. Relevant data are from the China Rural Statistical Yearbook, Hubei Rural Statistical Yearbook, Hunan Rural Statistical Yearbook, and Jiangxi Statistical Yearbook.

3.2.3. The Spatiotemporal Evolution of Agricultural Ecological Efficiency

The variable returns to scale (VRS) model, specifically the super-efficiency model with undesired outputs, was employed to calculate the AEE of 31 cities in the UAMRYR from 2001 to 2023. Based on the AEE data of each prefecture-level city in 2001, 2005, 2010, 2015, 2020, and 2023, the spatiotemporal pattern of AEE in the UAMRYR was plotted using the software. The natural breakpoint method was adopted to classify AEE into five levels: low (0–0.63), relatively low (0.64–1.08), medium (1.09–1.24), relatively high (1.25–1.66), and high (1.67–2.94), as demonstrated in Figure 2.
From the analysis of Figure 2, it is evident that the overall AEE of the UAMRYR has shown an upward trend. The number of cities categorized as “low” and “relatively low” has gradually decreased, while cities ranked as “relatively high” or above have significantly increased. These changes are more pronounced in the latter decade (2011–2023) compared to the earlier decade (2001–2010). Specifically, the number of cities at “low” and “relatively low” levels decreased from 17 in 2001 to 8 in 2023, while cities at “relatively high” levels or above increased from 2 in 2001 to 5 in 2023. Spatially, cities with relatively high levels of AEE tend to cluster around central cities, forming urban clusters around Wuhan in Hubei, Changsha in Hunan, and Nanchang in Jiangxi. Due to the regional division of labor within the urban agglomeration, the central cities are not necessarily those with the highest AEE within their clusters. Additionally, the spatial distribution of AEE within the urban agglomeration shows an “imbalance,” with large areas of “relatively low” AEE between the high-efficiency city clusters of each province. As the integration of the urban agglomeration deepens, the range of “relatively low” AEE areas gradually decreases. Moreover, compared to the other two city clusters, the Jiangxi city cluster has greater fluctuations in AEE, and its efficiency levels are gradually being surpassed by those of the Hubei and Hunan city clusters.

3.3. Study on the Measurement and Evolution of ATINs

In consideration of the differences in transportation and economic connections among cities within the urban agglomeration, this paper draws on research by Fan and Xiao [64] and employs a modified gravity model to calculate the agricultural technology innovation links between cities, thereby constructing an agricultural technology innovation network for the UAMRYR. Relevant data are from the China Urban Statistical Yearbook and the State Intellectual Property Office. Based on the agricultural technology innovation gravity coefficients of 2023, the linkages are categorized into three levels: weak linkage, medium linkage, and strong linkage. Specifically, a linkage value between 0 and 10 is defined as a weak relationship, 10 to 100 as a medium relationship, and greater than 100 as a strong relationship. The ATINs for the years 2001, 2005, 2010, 2015, 2020, and 2023 are visually analyzed using ArcGIS10.8 software, with the results shown in Figure 3.
The analysis of the evolution of the agricultural technology innovation network in the UAMRYR indicates several key trends: The network density gradually increases, the level of network collaboration continues to improve, and the spatial agglomeration effect of the network becomes increasingly prominent. Specifically, in 2001, the agricultural technology innovation network was in its nurturing stage, characterized by few network links above the medium level, low network density, weak cohesion, and limited innovation linkages between cities. By 2010, the network had entered its initial stage of development. Although the growth was slow, the cohesion within the network significantly increased. Intercity relationships within the region strengthened, leading to the formation of regional central networks centered around Changsha and Wuhan. Additionally, interprovincial linkages in agricultural technology innovation began to emerge, exemplified by medium-strength connections such as “Wuhan–Changsha” and “Changsha–Jingzhou.” By 2023, the network had entered a rapid development stage, with a significant increase in the total number of network relationships, network cohesion, and network density. The network exhibited a diffusion outward from the three cities of Wuhan, Changsha, and Nanchang, transitioning from a regional central network to a balanced complex network. The level of agricultural technology innovation linkages between cities significantly strengthened. Unlike the previous network spatial structure, in 2023, the agricultural technology innovation network within the urban agglomeration witnessed strong interprovincial linkages in city technology innovation. The boundaries of provincial technology diffusion were gradually broken, and the connections within the urban agglomeration’s technology innovation network became even closer.

4. Methodology

4.1. Sample and Data Sources

This article focuses on the UAMRYR as the research subject. The data used in this study were sourced from various statistical yearbooks such as the China Rural Statistical Yearbook, Hubei Statistical Yearbook, Hubei Rural Statistical Yearbook, Hunan Statistical Yearbook, Jiangxi Statistical Yearbook, and China Urban Statistical Yearbook, as well as the EPS data platform and RESSET macroeconomic database. The agricultural technology innovation patent data were obtained from the National Intellectual Property Administration, manually compiled, and supplemented with interpolation for missing data. Ultimately, a balanced panel dataset covering 31 cities in the middle reaches of the Yangtze River from 2001 to 2023, totaling 23 years, was obtained.

4.2. Variable Definition and Descriptive Statistics

4.2.1. Dependent Variable

The dependent variable studied in this paper is agricultural ecological efficiency (AEE). It is calculated using the super-efficiency SBM model with undesired outputs, based on the indicator system constructed earlier.

4.2.2. Core Independent Variable

The core independent variable in this paper is the urban agglomeration’s technology innovation network. It is represented by the degree centrality degree (DCD) of a city within the urban agglomeration’s agricultural technology innovation network. The degree centrality degree indicates the closeness of a city’s agricultural technology innovation relationships with other cities and is used to measure the city’s position within the urban agglomeration’s technology innovation network. A higher degree centrality degree signifies closer agricultural technology innovation relationships with other cities and greater influence within the agricultural technology innovation network, positioning the city closer to the network’s central position [32]. The degree centrality degree for each city is calculated based on a spatial association matrix constructed from the agricultural technology innovation gravity coefficients between cities, using Ucinet’s social network analysis.

4.2.3. Control Variables

To reduce errors from omitted variables, this study incorporates several control variables influencing AEE, based on Liu et al. [14] and Yang et al. [21]. These include (1) agricultural machinery density (AMD), land use intensity (LUI), and fertilizer application intensity (FAI), which reflect agricultural modernization and impact production efficiency and the ecological environment (they are calculated as the ratio of total agricultural machinery power, effective irrigation area, and fertilizer use to crop sown area, respectively); (2) agricultural economic development level (AEDL), measured by total agricultural output per permanent resident; (3) financial support for agriculture (FSFA), the proportion of local government spending on agriculture, forestry, and water affairs to the total general budget; (4) agricultural planting scale (APS), represented by cultivated land area per agricultural worker; and (5) industrialization level (IDL), measured as the share of industrial added value in regional GDP.

4.2.4. Mechanism Variables

According to the analysis in the previous sections, informatization level (IFL), agricultural finance, and agricultural industry scale play a significant role in driving AEE improvements within the urban agglomeration’s agricultural technology innovation network. Based on related scholarly research [65], informatization level, agricultural finance, and agricultural industry scale are measured by per capita telecommunications services, agricultural loans, and agricultural output, respectively. Descriptions and descriptive statistics of each variable are provided in Table 2 below.

4.3. Design of Spatial Econometric Models

Economic and social development in cities often shows spatial interdependence, with regional progress affected by both local conditions and neighboring areas. Accordingly, this paper employs a spatial econometric model to examine how agricultural technology innovation and its network influence AEE through spillover effects. The model is specified as follows:
A E E i t = α + κ j = 1 n W i j A E E i t + β D C D i t + γ C o n t r o l s + θ j = 1 n W i j D C D i t + ω j = 1 n W i j C o n t r o l s + λ i + μ t + ε i t
In the formula, AEEit and DCDit represent the AEE and degree centrality of the i city in t year, respectively. Controls represent a series of control variables, where α is the constant term, β is the coefficient of degree centrality, and γ is the coefficient of control variables. Additionally, κ , θ , and ω represent the spatial lag coefficients of the dependent variable, independent variable, and control variables, respectively; W i j is an element of the spatial weight matrix W ; λ i and μ t represent individual and time fixed effects, respectively; ε i t is the error term; and n denotes the number of cities.

4.3.1. Selection of Spatial Weight Matrix

For the spatial weight matrix selection, this paper constructs a geographical distance matrix based on the reciprocal of the geographical distance between two regions. The weight assigned is greater for regions with closer geographical proximity. Given the utilization of panel data, the spatial weight matrix needs to be expanded to a spatiotemporal weight matrix [66]:
W N = I t W n = W n × n 0 n × n 0 n × n W n × n 0 n × n 0 n × n 0 n × n 0 n × n W n × n
In the formula: N = t n , and W N represents the K r o n e c k e r product between I t and W n .

4.3.2. Testing and Selection of Spatial Econometric Models

The Moran and Geary indices, shown in Table 3, are both significantly above zero, confirming positive spatial autocorrelation in AEE and supporting the need for spatial econometric modeling. Model selection tests (LM, Wald, LR) show that both standard LM-Err and LM-Lag statistics are significant, and robust LR tests perform well, leading to the choice of the spatial Durbin model (SDM). Additionally, Wald and LR tests at the 1% level support the SDM over SAR and SEM models. The Hausman test suggests that a fixed-effects specification is more appropriate for the SDM.

5. Results

5.1. Spatial Durbin Model

As shown in Table 4, this paper presents the estimation results of the spatial Durbin model (SDM) spatial fixed effects, time fixed effects, and spatial–temporal double fixed effects. Based on the R-squared values, Log-likelihood values, and the results from the LR test estimation command, it can be observed that the results incorporating spatiotemporal double fixed effects are significantly better than those with single fixed effects. Therefore, the following analysis will specifically focus on the SDM estimation results that include spatiotemporal fixed effects.
The main effect coefficient of degree centrality degree (DCD) in an urban agglomeration’s ATIN is positive and significant at the 1% level. This indicates that an increase in degree centrality degree within the ATIN can significantly enhance local AEE. It enhances a city’s position within the innovation network, strengthens local connections within the network, and thereby improves the overall network connectivity, increasing the channels for agricultural innovation technology spillover. It also boosts local AEE essentially because the city’s agricultural technological innovation significantly enhances AEE, consistent with the theoretical analysis previously discussed. The spillover effect coefficient of degree centrality degree in the agricultural technology innovation network (W*DCD) is positive and significant at the 1% level. This suggests that, on one hand, an increase in a city’s degree centrality degree, coupled with a robust agricultural technology innovation system, helps enhance local agricultural research and development and innovation levels, thereby promoting AEE. On the other hand, as cities with weaker independent technological innovation capabilities deepen their integration into an urban agglomeration’s agricultural technology innovation network and increasingly connect with the central cities in technology innovation, they can leverage their nodal advantages through the technology innovation network to enhance their innovation capabilities and thereby boost AEE. The enhancement of a city’s position within the agricultural technology innovation network has a positive effect on local agricultural ecological efficiency and achieves positive spillovers to surrounding cities through the agricultural technology innovation network, driving improvements in AEE in neighboring cities, thus validating research Hypothesis 1.

5.2. Decomposition of Spatial Effects

When the spatial autoregressive coefficient ρ is statistically significant, the spatial Durbin model incorporates lagged terms of both independent and dependent variables. This may introduce bias into the estimation of spillover effects if not properly addressed. To mitigate this, Lesage and Pace [67] recommended the partial differential method, which separates the influence of each independent variable into intra-regional (direct effects) and inter-regional (indirect or spillover effects) components. This distinction improves interpretation and prevents bias from relying solely on point estimates.
According to Table 5, from a quantitative analysis perspective, the SDM with spatiotemporal fixed effects, using direct and partial differential estimation, shows little difference in the intra-regional spillover effect coefficients of degree centrality degree (DCD). However, direct estimation tends to overestimate the impact of neighboring regions’ degree centrality degree on the region’s agricultural ecological efficiency, i.e., the spatial spillover effect. From a qualitative analysis perspective, both estimation results suggest that the enhancement of a city’s degree centrality in the agricultural technology innovation network significantly promotes its agricultural ecological efficiency. The development of an urban agglomeration’s agricultural technology innovation network is a significant driver of AEE improvement. Additionally, an increase in neighboring cities’ degree centrality degree, through the agricultural technology innovation network, facilitates spatial interaction with the local city, promoting the local city’s agricultural ecological efficiency. This technological spillover effect is substantial and influential. Therefore, strengthening the agricultural technology innovation connections among cities within an urban agglomeration is crucial for enhancing the overall AEE of the city and the urban agglomeration.

5.3. Endogeneity Tests

ATIN can enhance agricultural ecological efficiency (AEE), while the protection and sustainable use of the ecological environment also promote the continuous improvement and development of these networks. Considering the possibility of reverse causality between the core independent variable, degree centrality degree, and the possibility that it could lead to endogeneity issues, this paper adopts the approach proposed by Du and Peiser [68]. The level of intellectual property protection in cities (IV) and its spatial lag ( W × I V ) are used as instrumental variables for 2SLS. The level of a city’s intellectual property protection is related to its level of agricultural technology innovation and its position in the agricultural technology innovation network [69], but it is not related to the dependent variable, agricultural ecological efficiency, thus meeting the conditions for instrument selection. The level of a city’s intellectual property protection is measured using the logarithm of the number of intellectual property judicial cases. The first-stage regression results are significantly different from 0, with the minimum F-statistic value being 166.58, far exceeding the empirical benchmark of 10, and the F-statistic value is highly significant at the 1% level. The results pass the overidentification test and weak instrument test, indicating that the selection of instrumental variables is scientific and reasonable. Column (1) of Table 6 reports the second-stage regression results, which show that, after mitigating potential endogeneity issues, the main and spillover effect coefficients of the city’s degree centrality degree on agricultural ecological efficiency remain significantly positive, and their absolute values are not much different from those in the baseline regression results. This further proves that the research conclusions are robust.

5.4. Robustness Tests

To enhance the credibility of this paper’s findings, robust checks are conducted in three key aspects. Firstly, the method for measuring the dependent variable is modified. Since agricultural technological advancement typically favors output, especially green output, technologies that boost agricultural total factor productivity (TFP) are expected to positively influence agricultural ecological efficiency [70]. Therefore, for robust analysis, AEE is substituted with agricultural TFP, following established measurement approaches from prior studies [71]. The corresponding results are reported in Column (2) of Table 6.
Secondly, alternative forms of spatial weight matrices are employed in the regression analysis. Beyond the geographic distance matrix applied in the baseline regression, both an economic-geographic nested matrix and a geographic proximity matrix are introduced. The regression is re-estimated under these different spatial matrices, with findings presented in Columns (3) and (4) of Table 6.
Thirdly, potential biases arising from atypical years are addressed by omitting certain years from the analysis. Given the unusual effects of the 2008 ice disaster and the impact of the COVID-19 pandemic (2020–2023) on agricultural production in China’s Urban Agglomeration in the Middle Reaches of the Yangtze River, data from these periods are excluded, and the regression is performed again. The relevant results appear in Column (5) of Table 6.
The results in Columns (2) through (5) consistently show significant coefficients for both the main explanatory variable (DCD) and its spatial spillover effect ( W × D C D ), thereby confirming the robustness and reliability of the baseline regression approach, namely the spatiotemporal fixed-effects spatial Durbin model.

5.5. Heterogeneity Analysis

5.5.1. Regional Heterogeneity Analysis

Regional heterogeneity is a fundamental characteristic of economic systems. Within the UAMRYR, cities differ in terms of agricultural resource endowments, development levels, ecological environments, and capacities for technological innovation and diffusion. These disparities can influence how ATINs affect AEE in each location. To examine these regional variations, separate regression analyses were performed for Hubei, Hunan, and Jiangxi Provinces, with the results summarized in Table 7. According to Table 7, both Hubei and Hunan Provinces show a significantly positive association between cities’ degree centrality and agricultural ecological efficiency, for both main and spillover effects, with spillover effects outweighing the main effects—aligning with prior findings. Conversely, in Jiangxi Province, while the spillover effect remains significantly positive, the main effect is not significant. An analysis of the 2023 agricultural technology innovation network for the middle Yangtze River region (see Figure 3) reveals that most Jiangxi cities occupy peripheral positions within the network, reflecting weaker innovation capacity and, thus, limited impact on local ecological efficiency improvements. Additionally, the analyses suggest that in all three regions, spillover effects from agricultural technology innovation surpass the main effects, highlighting intra-regional technology diffusion as the primary driver of enhanced AEE.

5.5.2. Positional Heterogeneity Analysis

Positional heterogeneity analysis of the ATIN reveals that cities in different positions within the network have varying technological innovation capabilities, technology diffusion capabilities, and technology absorption capabilities. These differences influence the effectiveness of the ATIN in enhancing agricultural ecological efficiency (AEE). Specifically, based on the core independent variable, degree centrality degree, this study conducted three-quartile regressions to assess the influence of the ATIN on AEE in core cities, secondary cities, and peripheral cities. Table 8 summarizes the regression findings.
The regression results indicate an inverted “U” pattern in the main effect of the city’s technological innovation network on agricultural ecological efficiency. The main effect is not significant in peripheral cities; it is significant and highest, with an estimated coefficient of 1.168, in secondary center cities, while in core cities, the main effect remains significant but with a reduced estimated coefficient (0.296). A possible reason is that the application of innovative technologies often involves “integration”, requiring the integration of various new technologies [72]. Cities on the periphery of the technology innovation network, due to fewer technological innovations, struggle to achieve integrated applications of innovative technologies, leading to low marginal efficiency of technology. Cities at the network’s secondary level have improved agricultural technological innovation capabilities and can achieve “integrated” applications of agricultural technology, enhancing the marginal efficiency of technology. Core cities, with strong innovation capabilities and numerous innovations, exhibit the law of diminishing marginal returns to technology substitution, leading to a decrease in the estimated coefficient of the main effect in core cities.
The spillover effect of the city’s technology innovation network on agricultural ecological efficiency displays a “polarized” characteristic, evident in the significant positive spillover effects in core and peripheral cities, and the insignificant spillover effect in secondary center cities. In peripheral cities, the technological spillover is typically “passive”, where agricultural innovation technologies are less applied locally (insignificant main effect) and instead are diffused to surrounding cities (spillover effect). This phenomenon aligns with the “growth pole theory”. Specifically for the urban agglomeration agricultural technology innovation network, core cities exhibit both a “polarization effect”, leveraging their advantages in capital, market, and business environments to provide more scenarios for innovative technology applications and attracting agricultural innovation technologies from surrounding cities [73], and a “diffusion effect”, using their technological advantages to create a positive spillover effect on surrounding cities. Peripheral cities, due to a lack of local scenarios for new technology applications, show insufficient technological cohesion, resulting in significant spillover of innovative technologies to surrounding cities. Secondary center cities, constrained by their development stage, can provide local scenarios for innovative technology applications but lack the capability to affect surrounding cities. The reason peripheral cities manifest as spillovers of innovative technologies rather than as “losses” of innovative elements is largely that the main bodies of agricultural technology innovation, including universities, research institutions, and state-owned agricultural enterprises, typically have “rootedness” and are difficult to move across regions, which leads to the continuation of innovation activities aimed at “spillover” despite the lack of local innovative technology application scenarios [74].

5.6. Mechanism Analysis Based on Urban Informatization Level, Agricultural Financial Development, and Agricultural Industry Scale

Based on the theoretical analysis presented earlier, it is evident that the informatization level, the agricultural financial development, and the agricultural industry scale significantly influence the spillover effects of the ATIN. The mediation effect relies on specific model assumptions. If the model is incorrect or does not account for all potential variables, estimation bias may occur. In contrast, the moderation effect can more accurately reflect the relationships between variables [75]. Therefore, incorporating the interaction terms of informatization level, agricultural finance, and agricultural industry scale with degree centrality degree and their spatial lag terms into the econometric model will allow us to explore their moderating role in improving agricultural ecological efficiency through the ATIN and verify the theoretical hypothesis. The model is set up as follows:
A E E i t = α + κ j = 1 n W i j A E E i t + β D C D i t + τ M i t + ρ D C D i t × M i t + γ C o n t r o l s + θ j = 1 n W i j D C D i t + δ j = 1 n W i j M i t + ϕ j = 1 n W i j D C D i t × M i t + ω j = 1 n W i j C o n t r o l s + λ i + μ t + ε i t
In the formula, Mit represents mechanism variables, the informatization level (IFL), agricultural finance (AGF), or agricultural industry scale (AMS) of an i city in t year. D C D i t × M i t refers to the interaction terms of degree centrality degree and mechanism variables, including spatial lag terms   W i j . This will be used to analyze the spillover effects of the three influencing mechanisms on agricultural technology innovation in cities and their impact on agricultural ecological efficiency. Other variables are explained similarly to the baseline model. λ and μ t represent individual and time-fixed effects, respectively. ε i t is the error term, and n indicates the number of cities. The regression results are as follows (where informatization level corresponds to Mechanism 1, agricultural finance corresponds to Mechanism 2, and agricultural industry scale corresponds to Mechanism 3).
Table 9 analyzes how the informatization level (IFL), agricultural finance (AGF) development, and the scale of the agricultural industry (AMS) moderate the spillover effects of the ATIN within urban agglomerations on agricultural ecological efficiency. The regression results show that the interaction terms D C D × I F L are significantly positive, suggesting that higher informatization levels amplify the spatial spillover benefits of increased degree centrality, thereby improving the agricultural ecological efficiency of neighboring cities more markedly. Enhanced informatization facilitates the diffusion of agricultural technologies and reinforces network-driven spillovers, lending support to research Hypothesis 2.
Similarly, both the direct and spillover effects of D C D × A G F are found to be significantly positive. This indicates that the development of agricultural finance not only strengthens the positive effects of degree centrality on local agricultural ecological efficiency but also promotes beneficial spillovers to adjacent cities. Enhanced agricultural finance increases the capacity of agricultural market participants to adopt innovations, bolsters technology diffusion through networks, and improves regional agricultural ecological efficiency, thus corroborating research Hypothesis 3.
Moreover, a significant positive relationship is observed for both the main and spillover effects of D C D × A M S . This finding demonstrates that scaling up the agricultural industry boosts both local and neighboring cities’ agricultural ecological efficiency, suggesting that AMS plays a positive moderating role in enhancing spatial spillover effects through innovation networks, thereby validating research Hypothesis 4.

6. Discussion

6.1. Heterogeneity of Technological Innovation Network Spillover Effects on Urban Agglomerations

The impact of ATINs in urban agglomerations on agricultural ecological efficiency is multifaceted. Firstly, by promoting the dissemination of technology and sharing of experiences, technologically interconnected innovation networks in urban agglomerations facilitate the diffusion of technology from central cities to peripheral regions. This enables technologically lagging regions within the urban agglomeration to quickly access advanced agricultural technologies and management models. The introduction and application of new technologies can enhance agricultural production efficiency, mitigate environmental pollution, and thereby promote agricultural ecological efficiency. This phenomenon is commonly referred to as the “trickle-down effect” of technological diffusion [76].
Simultaneously, technological innovation and the commercialization of research findings exhibit significant economies of scale. Central cities within the technological network attract factors of technological innovation and research findings from peripheral cities due to their advantages in terms of innovative environment, talent pool, and application scenarios. This phenomenon is known as the “siphoning effect” exerted by central cities on peripheral cities’ technological innovation [77]. The scenario in which the “trickle-down effect” and “siphoning effect” of network node cities come into play is primarily influenced by innovation. Central cities with the highest level of innovation exhibit both the “trickle-down effect” and the “siphoning effect”. The “trickle-down effect” manifests as spillover effects of technological innovation to sub-central and peripheral cities. The “siphoning effect”, on the other hand, manifests as attracting research findings from peripheral cities, resulting in a significant spillover impact on these areas. Sub-central cities within the network also experience this siphoning effect by attracting research findings from peripheral cities. Peripheral cities are passive recipients affected by both the network’s siphoning and trickle-down effects.

6.2. Moderating Effect of Urban Agglomeration Informatization Construction

The level of informatization plays a positive moderating role in promoting agricultural ecological efficiency through urban agglomeration ATINs. The enhancement of informatization facilitates the circulation of innovation factors, expedites the diffusion and exchange of new technologies within the urban agglomeration, and enables the rapid dissemination and application of advanced agricultural technologies across diverse regions, thereby fostering agricultural ecological efficiency [42]. Information technology development broadens the channels for information dissemination, reduces information acquisition costs, mitigates information asymmetry issues among trading parties, and enhances the frequency and depth of technology transactions and cooperation, thus strengthening collaborative partnerships among agricultural producers within the urban agglomeration. Additionally, information technology provides more precise and timely data support that aids agricultural producers, improving both efficiency and quality in agricultural production.

6.3. Moderating Effect of Urban Agglomeration Financial Development

The enhancement of agricultural financial capacity contributes to the reinforcement of technology innovation networks in urban agglomerations, facilitating the advancement and dissemination of agricultural technologies and bolstering agricultural ecological efficiency, thereby injecting fresh impetus into the sustainable development of urban agglomerations. However, information asymmetry and high transaction costs prevalent in rural financial markets hinder agricultural credit availability and impede agricultural and rural development. Developing agricultural finance can provide essential financial support and advisory services for promoting technological progress in agriculture while fostering the diffusion and application of agricultural technologies within urban agglomerations. This will help bridge technological gaps and ultimately enhance agricultural ecological efficiency [49]. Additionally, leveraging their industry resources and social influence, agricultural financial institutions can integrate information resources to overcome barriers between enterprises and farmers. By doing so, they can facilitate better cooperation opportunities among various market entities within urban agglomerations while creating a conducive environment for overall improvement in agricultural ecological efficiency.

6.4. Moderating Effect of Urban Agglomeration on the Industrial Scale

The expansion of agricultural industrial scale can enhance technological linkages among cities within the urban agglomeration, foster the development of ATINs, and positively impact the enhancement of agricultural ecological efficiency. As the scale of the agricultural industry expands, an increasing number of farmers, enterprises, and consumers engage in agricultural production and consumption activities. In response to broader market demand, agricultural technology enterprises and research institutions will be more proactive in conducting research and development endeavors, offering market-oriented innovative technologies to achieve cost reduction and efficiency improvement in agricultural production [78]. Concurrently, the expansion of the agricultural industrial scale expedites the establishment of a unified technology market within the urban agglomeration by stimulating competitive potential among agricultural technology innovation enterprises while further advancing improvements in agricultural technological innovation. This positive cycle propels the development of urban agglomerations’ ATINs and plays a constructive role in enhancing their ecological efficiency. The theoretical and practical significance of examining ATINs from the perspective of urban agglomerations for enhancing agricultural ecological efficiency is outlined based on the above conclusions.

7. Conclusions

This paper focuses on the UAMRYR as the research object, applying a modified gravity model and social network analysis methods to analyze the spatial pattern evolution of the agricultural technology innovation network in these agglomerations. It also constructs an agricultural ecological efficiency evaluation indicator system and employs a super-efficiency SBM model with undesirable outputs to measure the AEE of the cities in the agglomeration from 2001 to 2023. On this basis, a spatial Durbin model is built to explore the impact of the agricultural technology innovation network on agricultural ecological efficiency in the UAMRYR. The following conclusions are drawn: (1) Increasing a city’s degree centrality in the agricultural technology innovation network can significantly boost local agroecological efficiency and positively spill over to surrounding cities, enhancing their agroecological efficiency, as well. (2) Within the network, substantial heterogeneity is observed in both direct (influence on a city’s own agroecological efficiency) and spillover (influence on neighboring cities’ agroecological efficiency) effects across various city tiers. Central cities display significant direct and spillover effects, while sub-central cities exhibit significant direct effects but do not show notable spillover effects. In contrast, peripheral cities present insignificant direct effects, yet demonstrate pronounced spillover effects. (3) The level of urban informatization, agricultural finance, and the scale of the agricultural industry effectively enhance the spatial spillover effect of the agricultural technology innovation network, which further promotes the improvement of agroecological efficiency.
This paper draws the following policy insights: (1) One of the key factors to improve agroecological efficiency is the technological innovation of cities, and we should solve the problem of improving agroecological efficiency from the perspective of urban–rural interaction and pay attention to the agroecological innovation of cities. Increase the investment in innovation, pay attention to science and technology innovation talents, and improve the quantity and quality of urban agricultural technology innovation. (2) Strengthen the linkage of agricultural technology innovation among cities within the city cluster, promote the flow of innovation factors, and promote the optimal allocation of innovation results within the city cluster. At the same time, the main effect and spillover effect of cities at all levels in the agricultural technology innovation network are heterogeneous. Therefore, the spillover effect of the network’s central city should be strengthened, and the network’s edge cities should be encouraged to enrich the application scenarios of agricultural technology innovation and improve their ability to localize and apply technological innovation achievements. (3) Strengthen the application of information technology in the field of agriculture and promote the dissemination and diffusion of agricultural technological innovation among cities and between urban and rural areas. Establish and improve the transformation and application systems of agricultural technological innovation achievements at the level of city clusters and utilize the advantages of agricultural scale to provide a broad market for the application of new technologies. Strengthen support and guidance for the development of agricultural finance, encourage financial institutions to invest funds in agricultural innovation projects, and promote the in-depth integration of agricultural innovation technology and finance.
This paper may have two shortcomings: First, agricultural ecological efficiency is influenced by multiple factors, and there may be complex interactions between different factors that were not fully considered in the paper. Second, the research is limited to the UAMRYR, so the influence of factors from other regions might be overlooked. In the future, the researchers plan to proceed by focusing on three aspects: First, analyze in-depth the role and impact of farmers living in the agricultural technology innovation network within urban agglomeration to examine the correlation between farmers’ participation and the improvement of agricultural ecological efficiency. The researchers will study farmers’ attitudes towards and preferences for different types of technology, and how to enhance farmers’ participation in and acceptance of technology, aiming to encourage active involvement in the technology innovation network and improve agricultural ecological efficiency. Second, study the characteristics of ATINs within different urban agglomerations, including participant and information flow paths. By comparing the characteristics and agricultural ecological efficiency of different urban agglomerations, the researchers will discuss the reasons for these differences. This is expected to provide references for better promoting agricultural ecological efficiency. Third, analyze government policy support and promotion measures in the agricultural technology innovation network within urban agglomeration and the impact of these policies on agricultural ecological efficiency, with a specific focus on how government policies affect agricultural technology transfer, knowledge sharing, and innovation input.

Author Contributions

Conceptualization, W.P. and C.L.; data curation, Z.H. and J.L.; validation, Z.H. and J.L.; funding acquisition, W.P.; writing—original draft preparation, Z.H., J.L. and W.P.; investigation, J.L., Z.H., C.L. and W.P.; writing—review and editing, W.P., J.L., C.L. and Z.H.; methodology, C.L.; formal analysis, J.L. and Z.H.; supervision, C.L., W.P. and Z.H. All authors have read and agreed to the published version of the manuscript.

Funding

This research was funded by the General Project of National Social Science Foundation of China, grant number 21BJL078.

Data Availability Statement

Data will be made available on request.

Conflicts of Interest

The authors declare no conflicts of interest.

References

  1. Su, Y.; He, S.; Wang, K.; Shahtahmassebi, A.R.; Zhang, L.; Zhang, J.; Zhang, M.; Gan, M. Quantifying the sustainability of three types of agricultural production in China: An emergy analysis with the integration of environmental pollution. J. Clean. Prod. 2020, 252, 119650. [Google Scholar] [CrossRef]
  2. Khanal, U.; Wilson, C.; Rahman, S.; Lee, B.L.; Hoang, V.N. Smallholder farmers’ adaptation to climate change and its potential contribution to UN’s sustainable development goals of zero hunger and no poverty. J. Clean. Prod. 2021, 281, 124999. [Google Scholar] [CrossRef]
  3. Chen, Y.; Miao, J.; Zhu, Z. Measuring green total factor productivity of China’s agricultural sector: A three-stage SBM-DEA model with non-point source pollution and CO2 emissions. J. Clean. Prod. 2021, 318, 128543. [Google Scholar] [CrossRef]
  4. Liu, D.; Zhu, X.; Wang, Y. China’s agricultural green total factor productivity based on carbon emission: An analysis of evolution trend and influencing factors. J. Clean. Prod. 2021, 278, 123692. [Google Scholar] [CrossRef]
  5. Velten, S.; Leventon, J.; Jager, N.; Newig, J. What is sustainable agriculture? A systematic review. Sustainability 2015, 7, 7833–7865. [Google Scholar] [CrossRef]
  6. Muhie, S.H. Novel approaches and practices to sustainable agriculture. J. Agric. Food Res. 2022, 10, 100446. [Google Scholar] [CrossRef]
  7. Rudinskaya, T.; Náglová, Z. Analysis of consumption of nitrogen fertilisers and environmental efficiency in crop production of EU countries. Sustainability 2021, 13, 8720. [Google Scholar] [CrossRef]
  8. Charnes, A.; Cooper, W.W.; Rhodes, E. Measuring the efficiency of decision-making units. Eur. J. Oper. Res. 1978, 2, 429–444. [Google Scholar] [CrossRef]
  9. Angulo-Meza, L.; Gonzalez-Araya, M.; Iriarte, A.; Rebolledo-Leiva, R.; Soares de Mello, J.C. A multiobjective DEA model to assess the eco-efficiency of agricultural practices within the CF+ DEA method. Comput. Electron. Agric. 2019, 161, 151–161. [Google Scholar] [CrossRef]
  10. Tone, K.; Tsutsui, M. Network DEA: A slacks-based measure approach. Eur. J. Oper. Res. 2009, 197, 243–252. [Google Scholar] [CrossRef]
  11. Chi, M.; Guo, Q.; Mi, L.; Wang, G.; Song, W. Spatial distribution of agricultural eco-efficiency and agriculture high-quality development in China. Land 2022, 11, 722. [Google Scholar] [CrossRef]
  12. Liu, S.; Jia, J.; Huang, H.; Chen, D.; Zhong, Y.; Zhou, Y. China’s CO2 emissions: A thorough analysis of spatiotemporal characteristics and sustainable policy from the agricultural land-use perspective during 1995–2020. Land 2023, 12, 1220. [Google Scholar] [CrossRef]
  13. Wang, X.; Liu, Y. Enhancing Agricultural Ecological Efficiency in China: An Evolution and Pathways under the Carbon Neutrality Vision. Land 2024, 13, 187. [Google Scholar] [CrossRef]
  14. Liu, Y.; Zou, L.; Wang, Y. Spatial-temporal characteristics and influencing factors of agricultural eco-efficiency in China in recent 40 years. Land Use Policy 2020, 97, 104794. [Google Scholar] [CrossRef]
  15. Wang, B.; Zhang, W. Cross-provincial Differences in Determinants of Agricultural Eco-efficiency in China: An Analysis Based on Panel Data from 31 Provinces in 1996–2015. Chin. Rural Econ. 2018, 10, 46–62. [Google Scholar]
  16. Ren, Y.; Ding, Z.; Liu, J. How green finance boosts carbon efficiency in agriculture: A quasi-experiment from China. China Agric. Econ. Rev. 2024, 16, 267–289. [Google Scholar] [CrossRef]
  17. Liao, J.; Yu, C.; Feng, Z.; Zhao, H.; Wu, K.; Ma, X. Spatial differentiation characteristics and driving factors of agricultural eco-efficiency in Chinese provinces from the perspective of ecosystem services. J. Clean. Prod. 2021, 288, 125466. [Google Scholar] [CrossRef]
  18. Wu, G.; Riaz, N.; Dong, R. China’s agricultural ecological efficiency and spatial spillover effect. Environ. Dev. Sustain. 2023, 25, 3073–3098. [Google Scholar] [CrossRef]
  19. Zhang, Z.; Jin, G. Measurement of Agricultural Eco-Efficiency and Analysis of Its Influencing Factors: Insights from 44 Agricultural Counties in Liaoning Province. Land 2024, 13, 300. [Google Scholar] [CrossRef]
  20. Deng, X.; Gibson, J. Improving eco-efficiency for the sustainable agricultural production: A case study in Shandong, China. Technol. Forecast. Soc. Chang. 2019, 144, 394–400. [Google Scholar] [CrossRef]
  21. Yang, H.; Wang, X.; Bin, P. Agriculture carbon-emission reduction and changing factors behind agricultural eco-efficiency growth in China. J. Clean. Prod. 2022, 334, 130193. [Google Scholar] [CrossRef]
  22. Cohen, B. Urban growth in Developing countries: A review of current trends and a caution regarding existing forecasts. World Dev. 2004, 32, 23–51. [Google Scholar] [CrossRef]
  23. Yang, Y.; Yang, H.; Cheng, Y. Why is it crucial to evaluate the fairness of natural capital consumption in urban agglomerations in terms of ecosystem services and economic contribution? Sustain. Cities Soc. 2021, 65, 102644. [Google Scholar] [CrossRef]
  24. Qiao, W.; Huang, X. Assessment the urbanization sustainability and its driving factors in Chinese urban agglomerations: An urban land expansion-Urban population dynamics perspective. J. Clean. Prod. 2024, 449, 141562. [Google Scholar] [CrossRef]
  25. Zhou, J.; Xu, N.; Zhang, W.; Ning, X. Can agricultural low-carbon development benefit from urbanization? -Empirical evidence from China’s new-type urbanization pilot policy. J. Clean. Prod. 2024, 435, 140388. [Google Scholar] [CrossRef]
  26. Lin, Y.; Chen, Y.; Nie, H.; Peng, L. Sustainable development of urban agglomeration based on material metabolism: A case study on Fujian Delta, China. Environ. Dev. Sustain. 2024, 26, 10533–10555. [Google Scholar] [CrossRef]
  27. Wang, H.; Liu, C.; Xiong, L.; Wang, F. The spatial spillover effect and impact paths of agricultural industry agglomeration on agricultural non-point source pollution: A case study in Yangtze River Delta, China. J. Clean. Prod. 2023, 401, 136600. [Google Scholar] [CrossRef]
  28. Zhu, W.; Yue, Z.; He, N.; Luan, K.; Ye, L.; Qian, C. Analysis of China’s urban innovation connection network evolution: A case study of Henan Province. Sustainability 2022, 14, 1089. [Google Scholar] [CrossRef]
  29. Ramirez, A. The Influence of Social Networks on Agricultural Technology Adoption. Procedia-Soc. Behav. Sci. 2013, 79, 101–116. [Google Scholar] [CrossRef]
  30. Huggins, R.; Prokop, D. Network structure and regional innovation: A study of university–industry ties. Urban Stud. 2017, 54, 931–952. [Google Scholar] [CrossRef]
  31. Feng, Z.; Cai, H.; Chen, Z.; Zhou, W. Influence of an interurban innovation network on the innovation capacity of China: A multiplex network perspective. Technol. Forecast. Soc. Chang. 2022, 180, 121651. [Google Scholar] [CrossRef]
  32. Zhou, B.; Holme, P.; Gong, Z.; Zhan, C.; Huang, Y.; Lu, X.; Meng, X. The nature and nurture of network evolution. Nat. Commun. 2023, 14, 7031. [Google Scholar] [CrossRef] [PubMed]
  33. Pereira, R.M.; MacLennan, M.L.F.; Tiago, E.F. Interorganizational cooperation and eco-innovation: A literature review. Int. J. Innov. Sci. 2020, 12, 477–493. [Google Scholar] [CrossRef]
  34. Ma, H.; Wei, Y.D.; Huang, X.; Zhang, W. The innovation networks shaped by large innovative enterprises in urban China. J. Geogr. Sci. 2023, 33, 599–617. [Google Scholar] [CrossRef]
  35. Fusillo, F.; Quatraro, F.; Usai, S. Going green: The dynamics of green technological alliances. Econ. Innov. New Technol. 2022, 31, 362–386. [Google Scholar] [CrossRef]
  36. Hu, Y.; Yu, H.; Yang, X. Can Rural Human Capital Improve Agricultural Ecological Efficiency? Empirical Evidence from China. Sustainability 2023, 15, 12317. [Google Scholar] [CrossRef]
  37. Fang, C.; Yu, D. Urban agglomeration: An evolving concept of an emerging phenomenon. Landsc. Urban Plan. 2017, 162, 126–136. [Google Scholar] [CrossRef]
  38. Su, D.; Cao, Y.; Fang, X.; Wang, J.; Cao, Y. Regional integration, agricultural production, and their heterogeneous interaction in the classic urban agglomeration of China. J. Clean. Prod. 2024, 464, 142806. [Google Scholar] [CrossRef]
  39. Pan, X.; Ming, Y.; Li, M.; Guo, S.; Han, C. Inter-regional innovation correlation effects and influencing factors in China. Bus. Process Manag. J. 2020, 26, 925–941. [Google Scholar] [CrossRef]
  40. Vidmar, M.; Rosiello, A.; Vermeulen, N.; Williams, R.; Dineset, J. New Space and Agile Innovation: Understanding transition to open innovation by examining innovation networks and moments. Acta Astronaut. 2020, 167, 122–134. [Google Scholar] [CrossRef]
  41. Avelino, F.; Dumitru, A.; Cipolla, C.; Kunze, I.; Wittmayer, J. Translocal empowerment in transformative social innovation networks. In The Economics of Social Innovation; Routledge: Abingdon-on-Thames, UK, 2022; pp. 103–125. [Google Scholar]
  42. Wang, C.; Rodan, S.; Fruin, M.; Xu, X. Knowledge Networks, Collaboration Networks, and Exploratory Innovation. Acad. Manag. J. 2014, 57, 484–514. [Google Scholar] [CrossRef]
  43. Min, S.; Liu, M.; Huang, J. Does the application of ICTs facilitate rural economic transformation in China? Empirical evidence from the use of smartphones among farmers. J. Asian Econ. 2020, 70, 101219. [Google Scholar] [CrossRef]
  44. Wang, S.; Wang, J.; Wei, C.; Wang, X.; Fan, F. Collaborative innovation efficiency: From within cities to between cities—Empirical analysis based on innovative cities in China. Growth Chang. 2021, 52, 1330–1360. [Google Scholar] [CrossRef]
  45. Salemink, K.; Strijker, D.; Bosworth, G. Rural development in the digital age: A systematic literature review on unequal ICT availability, adoption, and use in rural areas. J. Rural Stud. 2017, 54, 360–371. [Google Scholar] [CrossRef]
  46. Wu, L.; Sun, L.; Chang, Q.; Zhang, D.; Qi, P. How do digitalization capabilities enable open innovation in manufacturing enterprises? A multiple case study based on resource integration perspective. Technol. Forecast. Soc. Chang. 2022, 184, 122019. [Google Scholar] [CrossRef]
  47. Khan, F.U.; Nouman, M.; Negrut, L.; Abbanb, J.; Cismas, L.M.; Siddiqi, M.F. Constraints to agricultural finance in underdeveloped and developing countries: A systematic literature review. Int. J. Agric. Sustain. 2024, 22, 2329388. [Google Scholar] [CrossRef]
  48. Yuan, X.; Zhang, J.; Shi, J.; Wang, J. What can green finance do for high-quality agricultural development? Fresh insights from China. Socio-Econ. Plan. Sci. 2024, 94, 101920. [Google Scholar] [CrossRef]
  49. Adamopoulos, T.; Brandt, L.; Leight, J.; Restuccia, D. Misallocation, Selection, and Productivity: A Quantitative Analysis with Panel Data from China. Econometrica 2022, 90, 1261–1282. [Google Scholar] [CrossRef]
  50. Hu, C.; Bo, N.; Zhao, Q. A study on the impact of rural finance on high-quality agricultural development in China—A test based on intermediation, threshold and spillover effects. Front. Environ. Sci. 2023, 11, 1217422. [Google Scholar] [CrossRef]
  51. Aldieri, L.; Brahmi, M.; Chen, X.; Vinci, C.P. Knowledge spillovers and technical efficiency for cleaner production: An economic analysis from agriculture innovation. J. Clean. Prod. 2021, 320, 128830. [Google Scholar] [CrossRef]
  52. Javaid, M.; Haleem, A.; Singh, R.P.; Suman, R. Enhancing smart farming through the applications of Agriculture 4.0 technologies. Int. J. Netw. 2022, 3, 150–164. [Google Scholar] [CrossRef]
  53. Trusova, N.V.; Hryvkivska, O.V.; Kotvytska, N.M.; Nesterenko, S.A.; Yavorska, T.I.; Kotyk, O.V. Determinants of the innovative and investment development of agriculture. Int. J. Agric. Ext. 2021, 9, 81–100. [Google Scholar] [CrossRef]
  54. Liu, L.; Luo, J.; Xiao, X.; Hu, B.; Qi, S.; Lin, H.; Zu, X. Spatio-Temporal Evolution of Urban Innovation Networks: A Case Study of the Urban Agglomeration in the Middle Reaches of the Yangtze River, China. Land 2022, 11, 597. [Google Scholar] [CrossRef]
  55. Zheng, Z.; Qingyun, H. Spatio-temporal evaluation of the urban agglomeration expansion in the middle reaches of the Yangtze River and its impact on ecological lands. Sci. Total Environ. 2021, 790, 148150. [Google Scholar] [CrossRef]
  56. Tone, K. A slacks-based measure of efficiency in data envelopment analysis. Eur. J. Oper. Res. 2001, 130, 498–509. [Google Scholar] [CrossRef]
  57. Costanza, R.; d’Arge, R.; De Groot, R.; Farber, S.; Grasso, M.; Hannon, B.; Limburg, K.; Naeem, S.; O’Neill, R.V.; Paruelo, J. The value of the world’s ecosystem services and natural capital. Nature 1997, 387, 253–260. [Google Scholar] [CrossRef]
  58. Xie, G.; Zhang, C.; Zhang, L.; Chen, W.; Li, S. Improvement of the Evaluation Method for Ecosystem Service Value Based on Per Unit Area. J. Nat. Resour. 2015, 30, 1243–1254. [Google Scholar]
  59. Wang, B.; Zhang, W. A research of agricultural eco-efficiency measure in China and space-time differences. China Popul. Resour. Env. 2016, 26, 11–19. [Google Scholar]
  60. Chen, F.; Qiao, G.; Wang, N.; Zhang, D. Study on the influence of population urbanization on agricultural eco-efficiency and on agricultural eco-efficiency remeasuring in China. Sustainability 2022, 14, 12996. [Google Scholar] [CrossRef]
  61. Wang, Z.; Deng, X.; Bai, Y.; Chen, J.; Zheng, W. Land use structure and emission intensity at regional scale: A case study at the middle reach of the Heihe River basin. Apply Energy 2016, 183, 1581–1593. [Google Scholar] [CrossRef]
  62. Xie, W.; Lewis, P.O.; Fan, Y.; Kuo, L.; Chen, M. Improving marginal likelihood estimation for Bayesian phylogenetic model selection. Syst. Biol. 2011, 60, 150–160. [Google Scholar] [CrossRef] [PubMed]
  63. Zhang, Y.; Zhang, L.; Han, L. Study on the evaluation and promotion path of agricultural ecological efficiency: An empirical analysis of 17 prefecture level cities in Shandong province. Ecol. Econ. 2021, 37, 118–131. [Google Scholar]
  64. Fan, J.; Xiao, Z. Analysis of spatial correlation network of China’s green innovation. J. Clean. Prod. 2021, 299, 126815. [Google Scholar] [CrossRef]
  65. Okunlola, F.A.; Osuma, G.O.; Omankhanlen, E.A. Agricultural finance and economic growth: Evidence from Nigeria. Bus. Theory Pract. 2019, 20, 467–475. [Google Scholar] [CrossRef]
  66. Li, J.; Li, S. Energy investment, economic growth and carbon emissions in China—Empirical analysis based on spatial Durbin model. Energy Policy 2020, 140, 111425. [Google Scholar] [CrossRef]
  67. LeSage, J.; Pace, R.K. Introduction to Spatial Econometrics; Chapman Hall/CRC: Boca Raton, FL, USA, 2009. [Google Scholar]
  68. Du, J.; Peiser, R.B. Land supply, pricing and local governments’ land hoarding in China. Reg. Sci. Urban Econ. 2014, 48, 180–189. [Google Scholar] [CrossRef]
  69. Glaeser, E.L.; Kominers, S.D.; Luca, M.; Naik, N. Big data and big cities: The promises and limitations of improved measures of urban life. Econ. Inq. 2018, 56, 114–137. [Google Scholar] [CrossRef]
  70. Kawagoe, T.; Otsuka, K.; Hayami, Y. Induced Bias of Technical Change in Agriculture: The United States and Japan, 1880-1980. J. Political Econ. 1986, 94, 523–544. [Google Scholar] [CrossRef]
  71. Chari, A.; Liu, E.M.; Wang, S.Y.; Wang, Y. Property Rights, Land Misallocation, and Agricultural Efficiency in China. Rev. Econ. Stud. 2021, 88, 1831–1862. [Google Scholar] [CrossRef]
  72. Chyi, Y.L.; Lai, Y.M.; Liu, W.H. Knowledge spillovers and firm performance in the high-technology industrial cluster. Res. Policy 2012, 41, 556–564. [Google Scholar] [CrossRef]
  73. Schwartz, D.; Bar-El, R. The Role of a Local Industry Association as a Catalyst for Building an Innovation Ecosystem: An Experiment in the State of Ceara in Brazil. Innovation 2015, 17, 383–399. [Google Scholar] [CrossRef]
  74. Miguelez, E.; Noumedem Temgoua, C. Inventor migration and knowledge flows: A two-way communication channel? Res. Policy 2020, 49, 103914. [Google Scholar] [CrossRef]
  75. Hayes, A.F. Introduction to Mediation, Moderation, and Conditional Process Analysis: A Regression-Based Approach; Guilford Press: New York, NY, USA, 2013. [Google Scholar]
  76. Wo, D.X.; Schminke, M.; Ambrose, M.L. Trickle-down, trickle-out, trickle-up, trickle-in, and trickle-around effects: An integrative perspective on indirect social influence phenomena. J. Manag. 2019, 45, 2263–2292. [Google Scholar] [CrossRef]
  77. Burger, M.J.; Meijers, E.J. Agglomerations and the rise of urban network externalities. Pap. Reg. Sci. 2016, 95, 5–16. [Google Scholar] [CrossRef]
  78. Aragón, F.M.; Restuccia, D.; Rud, J.P. Are Small Farms Really More Productive than Large Farms? Food Policy 2022, 106, 102168. [Google Scholar] [CrossRef]
Figure 1. Mechanism analysis framework.
Sustainability 17 05109 g001
Figure 2. Evolution of the spatial pattern of agricultural ecological efficiency in the UAMRYR.
Sustainability 17 05109 g002
Figure 3. Evolution trend of ATINs in the UAMRYR.
Sustainability 17 05109 g003
Table 1. A measurement index system for AEE.
Primary IndexSecondary IndexVariable DescriptionUnit
Input IndexLand InputTotal sown area of cropsThousand hectares
Labor InputEmployees in agriculture, forestry, animal husbandry, and fisheryTen thousand
Water InputEffective irrigated areaThousand hectares
Machinery InputTotal power of agricultural machineryTen thousand kilowatts
Pesticide InputAmount of pesticide usedTons
Fertilizer InputAmount of agricultural fertilizer usedTen thousand tons
Agricultural Film InputAmount of agricultural film usedTons
Energy InputAmount of agricultural diesel usedTen thousand tons
Draft Animal InputNumber of large livestock at year-endTen thousand
Expected OutputExpected OutputTotal agricultural output valueBillion CNY
Agricultural Carbon SinkAgricultural carbon absorptionTen thousand tons
Agricultural Ecosystem Service ValueValue of ecosystem services from cropland and forestlandBillion CNY
Undesired OutputAgricultural Carbon EmissionsAgricultural carbon emissionsTen thousand tons
Pollution Emissions from Agricultural ActivitiesPesticide residueTen thousand tons
Fertilizer pollutionTen thousand tons
Agricultural film pollutionTen thousand tons
Table 2. Variable description and descriptive statistics.
CategoryVariable NameVariable CodeMeasurement MethodMeanStandard Deviation
Dependent VariableAgricultural Ecological Efficiency A E E Through super-efficiency S B M model1.1090.220
Independent VariableDegree Centrality Degree D C D Calculated by social network analysis methods0.2370.184
Control VariablesAgricultural Machinery Density A M D Total agricultural machinery power/Crop sowing area0.6900.452
Land Use Intensity L U I Effective irrigation area/Crop sowing area0.4320.178
Fertilizer Application Intensity F A I Fertilizer application/Crop sowing area0.0370.023
Agricultural Economic Development Level A E D L Total agricultural output/Permanent population0.3240.228
Financial Support for Agriculture F A S A Local government expenditure on agriculture and forestry affairs/General budget expenditure0.0850.045
Agricultural Planting Scale A P S Cultivated land area/Number of agricultural workers4.1422.682
Industrialization Level I D L Industrial added value/Regional GDP0.4240.172
Mechanism VariablesInformatization Level I F L Per capita telecommunications services5.8856.376
Agricultural Finance A G F Agricultural loans42.09719.867
Agricultural Manufacture Scale A M S Agricultural output1.2630.975
Table 3. Selection and testing of spatial econometric models.
V a r i a b l e s S t a t i s t i c p-Value
M o r a n s   I 0.0480.000
G e a r y s   c 0.9040.000
L M   t e s t : S p a t i a l   e r r o r
M o r a n s   I 2.4500.014
L a g r a n g e   m u l t i p l i e r 4.5220.033
R o b u s t   L a g r a n g e   m u l t i p l i e r 5.5110.019
S p a t i a l   l a g
L a g r a n g e   m u l t i p l i e r 7.6550.006
R o b u s t   L a g r a n g e   m u l t i p l i e r 8.6440.003
W a l d   t e s t :
W a l d   t e s t   f o r   S A R ( c h i 2 ) 88.790.000
W a l d   t e s t   f o r   S E M ( c h i 2 ) 85.130.000
L R   t e s t :
S A R   n e s t e d   i n   S D M ( c h i 2 ) 115.120.000
S E M   n e s t e d   i n   S D M ( c h i 2 ) 114.200.000
H a u s m a n   t e s t : ( c h i 2 ) 87.970.000
Table 4. Estimation results of the SDM.
Variable S D M Variable S D M
Spatial FixedTemporal FixedSpatiotemporal FixedSpatial FixedTemporal FixedSpatiotemporal Fixed
D C D 0.640 ***−0.0200.738 *** W × D C D 1.920 ***−0.0373.540 ***
(0.147)(0.042)(0.142) (0.501)(0.263)(0.800)
A M D −0.147 ***−0.049 *−0.129 *** W × A M D −0.144−0.243 *−1.082 ***
(0.035)(0.026)(0.034) (0.093)(0.144)(0.179)
A E D L 0.2500.2290.321 * W × A E D L 0.2700.1580.009
(0.200)(0.192)(0.190) (0.601)(1.007)(1.007)
F A S A 0.491 ***0.275 ***0.506 *** W × F A S A −0.177−1.165 ***−0.891 ***
(0.059)(0.063)(0.056) (0.167)(0.353)(0.296)
L U I −0.242 ***0.196 ***−0.202 *** W × L U I 0.656 ***1.532 ***0.668
(0.059)(0.048)(0.057) (0.140)(0.398)(0.493)
I D L −0.4882.437 ***−0.144 W × I D L −0.419−9.751 ***−1.500
(0.418)(0.428)(0.409) (0.922)(1.873)(1.557)
F A I 0.0060.0010.010 *** W × F A I 0.056 ***−0.0070.078 ***
(0.004)(0.003)(0.003) (0.017)(0.024)(0.023)
A P S 0.640 ***−0.0200.738 *** W × A P S 1.920 ***−0.0373.540 ***
(0.147)(0.042)(0.142) (0.501)(0.263)(0.800)
R20.0010.0340.006 ρ −0.096−0.531 ***−0.729 ***
l o g L 397.743186.877456.264(0.128)(0.161)(0.162)
Note: * and *** denote significance levels of 10% and 1%, respectively. Standard errors are given in parentheses.
Table 5. Spatial effects decomposition.
VariableDirect EffectIndirect EffectTotal Effect
D C D 0.652 ***1.834 ***2.486 ***
(0.146)(0.517)(0.501)
A M D −0.104 ***−0.606 ***−0.709 ***
(0.030)(0.128)(0.120)
A E D L −0.290 ***0.636 ***0.346 **
(0.074)(0.207)(0.173)
F A S A 0.345−0.1490.196
(0.219)(0.682)(0.635)
L U I 0.532 ***−0.772 ***−0.240
(0.067)(0.177)(0.159)
I D L −0.227 ***0.522 *0.295
(0.053)(0.286)(0.283)
F A I −0.080−0.882−0.962
(0.460)(1.116)(0.867)
A P S 0.008 ***0.044 ***0.052 ***
(0.003)(0.016)(0.016)
Note: *, **, and *** denote significance levels of 10%, 5%, and 1%, respectively. Standard errors are given in parentheses.
Table 6. Endogeneity test and robustness test results.
(1)(2)(3)(4)(5)
Variables A E E A E E A E E A E E A E E
D C D 0.460 ***0.427 ***0.540 ***0.554 ***0.434 ***
(0.172)(0.140)(0.137)(0.149)(0.166)
W × D C D 1.995 ***1.385 *0.512 ***0.586 **2.789 ***
(0.657)(0.782)(0.152)(0.257)(0.827)
R20.0210.0070.0010.0010.035
L o g L i k e l i h o o d 442.855463.771455.304415.829473.665
Observations713713713713558
Control VariablesYESYESYESYESYES
Individual Fixed EffectsYESYESYESYESYES
Year Fixed EffectsYESYESYESYESYES
Note: *, **, and *** denote significance levels of 10%, 5%, and 1%, respectively. Standard errors are given in parentheses.
Table 7. Regional heterogeneity analysis.
Hubei ProvinceHunan ProvinceJiangxi Province
Variables A E E A E E A E E
D C D 0.892 ***0.799 ***0.260
(0.216)(0.267)(0.210)
W × D C D 2.888 ***2.853 ***2.452 ***
(0.912)(0.962)(0.826)
R20.0490.0060.016
Observations299184230
Control VariablesYESYESYES
Individual Fixed EffectsYESYESYES
Year Fixed EffectsYESYESYES
Note: *** denote significance levels of 1%. Standard errors are given in parentheses.
Table 8. Positional heterogeneity analysis of the ATIN.
Network Peripheral CitiesNetwork Sub-Center CitiesNetwork Hub Cities
Variables A E E A E E A E E
D C D 0.2041.168 ***0.296 **
(0.159)(0.453)(0.141)
W × D C D 1.316 *1.0461.843 ***
(0.674)(1.440)(0.581)
R20.0620.1190.151
Observations253230230
Control VariablesYESYESYES
Individual Fixed EffectsYESYESYES
Year Fixed EffectsYESYESYES
Note: *, **, and *** denote significance levels of 10%, 5%, and 1%, respectively. Standard errors are given in parentheses.
Table 9. Testing of mechanisms.
Mechanism 1Mechanism 2Mechanism 3
Variables A E E A E E A E E
D C D 0.698 ***0.407 **0.564 ***
(0.151)(0.202)(0.161)
W × D C D 3.031 ***6.003 ***2.150 **
(0.870)(1.116)(0.909)
D C D × I F L 0.002
(0.007)
W × ( D C D × I F L ) 0.152 ***
(0.047)
D C D × A G F 0.271 **
(0.106)
W × ( D C D × A G F ) 3.214 ***
(0.722)
D C D × A M S 0.067 *
(0.036)
W × ( D C D × A M S ) 1.088 ***
(0.266)
R20.0020.0320.009
Control VariablesYESYESYES
Individual Fixed EffectsYESYESYES
Year Fixed EffectsYESYESYES
Note: *, **, and *** denote significance levels of 10%, 5%, and 1%, respectively. Standard errors are given in parentheses.
Disclaimer/Publisher’s Note: The statements, opinions and data contained in all publications are solely those of the individual author(s) and contributor(s) and not of MDPI and/or the editor(s). MDPI and/or the editor(s) disclaim responsibility for any injury to people or property resulting from any ideas, methods, instructions or products referred to in the content.

