1. Introduction
Nowadays, the greatest threat to the development of civilisation is climate change. In response to this challenge, it is necessary to adapt to changing climatic conditions and take decisive action to reduce greenhouse gas emissions. One solution is sustainable agriculture, an approach to agricultural production that harmoniously combines economic and social goals with environmental requirements. Its main objective is the effective use of natural resources such as soil, water, and energy in a way that minimises negative environmental impacts while ensuring production profitability and social acceptance [
1]. The intensification of agriculture over recent decades—driven by the increasing demand for food production—has led to significant changes in the natural environment. Intensive land use, focused mainly on maximising the yield of plant and animal production through the use of chemicals, cultivation of new crop varieties and mechanisation, has brought economic benefits but has also negatively impacted the environment. The consequences of these practices include soil degradation, reduced biodiversity, increased greenhouse gas emissions, and intensified erosion and landscape deprivation due to the introduction of so-called monocultures. This model of industrial agriculture is now heavily criticised, primarily because of its negative externalities [
2].
Regenerative agriculture offers solutions aimed at reversing the negative trends associated with production intensification. Its core practices include maintaining plant cover throughout the year (e.g., by incorporationg cover crops), using natural fertilisers, implementing crop rotation, and reducing tillage. Promoting such sustainable farming practices and developing policies that support farmers in adopting them is essential—not only for ensuring food security but also for protecting our planet for future generations [
3]. In the report “Climate Change and Land”, this model of agriculture is defined as a “sustainable land management practice” that “can be effective in building resilience of agro-ecosystems” [
4]. According to the Food and Land Use Coalition (FOLU), regenerative agriculture is one of the ten critical transitions needed to transform food and land use systems. Their definition includes practices that regenerate soil, reduce (though not necessarily eliminate) synthetic pesticides and fertilisers, and go beyond minimising negative impacts by ensuring that agriculture has a positive effect on the environment—while also maintaining high productivity levels [
5]. Rhodos [
6] defines regenerative agriculture as an alternative method of food production that may have a lower—or even net positive—impact on the environment and/or society. It is described as a holistic design that aims to grow as much food as possible using the least amount of resources in a way that revitalises rather than depletes soil, while offering a solution to the problem of carbon sequestration. Rodale [
7], on the other hand, defines it as agriculture that “increases productivity levels, enhances the biological base of our land and soil and has high built-in economic and biological stability”. By applying regenerative agricultural practices, not only can positive environmental outcomes be achieved, but the resulting soil conditions also allow farmers to attain satisfying production and economic results [
3,
8]. This type of farming creates opportunities to reduce input costs, especially for energy, labour, fertilisers, and crop protection products [
9].
An integral part of regenerative agriculture is carbon farming. Through restoring and maintaining the yield potential of soil—which is a natural CO
2 sink—farmers can counteract adverse climate changes by maximising organic matter content in the soil. Actions taken in this regard are referred to as carbon farming. Some use the terms regenerative agriculture and carbon farming interchangeably (although the authors argue that carbon farming would not exist without regenerative practices). Undoubtedly, carbon farming is based on regenerative agriculture principles, with its key goal being to increase CO
2 sequestration in soil. In practice, this means that the use of regenerative methods not only helps mitigate climate change but also improves soil structure and productivity (via increased organic matter), enhances agroecosystem resilience to extreme weather conditions, and improves the quality of produced food. The development of carbon farming is a result of the EU policy direction, which has adopted regulations aimed at achieving climate neutrality. According to the European Climate Law, greenhouse gas emissions and absorption in the European Union (EU) must be balanced no later than 2050 [
10]. Farmers will play a significant role in achieving these goals, as they are now included in the system for “managing” carbon dioxide and other greenhouse gases. In light of the additional benefits that farmers may receive for applying carbon farming practices, the demand for knowledge in this area is expected to grow in the coming years.
In Poland, carbon farming activities align with the EU’s Common Agricultural Policy (CAP) for 2023–2027. The key institutional tool of this policy is eco-schemes, voluntary financial mechanisms encouraging farmers to adopt environmentally and climate-friendly practices. The total budget for eco-schemes amounts to EUR 44.7 billion, compared to EUR 190 billion allocated to the entire CAP Pillar I for 2023–2027 [
11]. According to the European Commission’s recommendations, EU member states are required to allocate at least 25% of Pillar I funds for the years 2023–2027 to payments under eco-schemes. However, member states may reduce this share, provided that they increase financial allocations for environmental actions under Pillar II, which focuses on environmental protection, supporting structural changes in agriculture and rural development [
12].
In Poland, as per the Strategic Plan for the CAP 2023–2027, financial resources amounting to EUR 25.2 billion are allocated for activities under both pillars. Of this, EUR 17.3 billion from the EU budget is designated for direct payments (Pillar I), while EUR 4.7 billion is allocated to rural development (Pillar II), supplemented with additional national contributions [
13].
The so-called area-based eco-schemes are annual environmental interventions implemented under the direct payment system. In 2023, Poland introduced five area-based eco-schemes:
Carbon farming and nutrient management;
Areas with melliferous plants;
Water retention on permanent grasslands;
Plant production under the Integrated Plant Production scheme;
Organic crop protection.
Additionally, from 2024, farmers could apply for payments under the new eco-scheme “Decoupled land” and from 2025 under the eco-scheme “Seed material: elite and certified categories” [
14]. Practices that directly support carbon farming have been included in the Strategic Plan of the CAP 2023–2027 under the eco-scheme “Carbon farming and nutrient management”. It is one of the most comprehensive eco-schemes in Poland. This intervention supports nine practices that increase carbon storage in soil, capture atmospheric CO
2 in plants, and reduce its emissions.
Eco-schemes represent an innovative agricultural policy tool aimed at achieving the EU’s climate and environmental goals, and their implementation started in 2023. Consequently, both in Poland and other European countries, a significant gap in research focused on identifying the determinants of the successful implementation of this initiative is observed. Understanding the various patterns and factors influencing the implementation of specific public interventions, such as carbon farming eco-schemes, across different levels of the CAP governance, is a topic that has not been extensively explored. This issue is particularly critical due to the highly spatially differentiated nature of agriculture, which varies significantly in terms of climate and environmental conditions, as well as the socio-economic structures in Poland and other EU member states. The empirical analyses presented here fit into a reflection on the dilemma between the rationale of achieving common environmental and climate objectives (fiscal vs. environmental federalism) and the need for solutions better targeted to local and regional needs (place-based policy). In addition to advancing theoretical knowledge, conducting such analyses serves to provide robust scientific arguments for more effectively aligning agricultural policy tools with the real needs of beneficiaries, increasing the efficiency of resource use, and supporting the sustainable development of rural regions. Moreover, insights presented here may contribute to the ongoing debate on the CAP post-2027 reform, particularly in efforts to enhance its decentralisation and regionalisation [
15,
16]. Providing robust spatial and socio-economic data supports the decision-making process, including the implementation of new programs aimed at achieving climate goals and advancing carbon farming in Poland and other EU countries.
The aim of this study is to identify selected determinants of the spatial distribution of participation in the carbon farming eco-scheme in Poland, taking into account differences resulting from the farm size structure. The analytical context also includes variations in agricultural structures, diverse farming conditions, and other socio-economic factors that may influence the spatial differentiation of farm participation in carbon farming practices. The conducted empirical research seeks to answer the following research questions:
Does farm size influence the occurrence of spatial clusters in terms of participation and payment levels within the carbon farming eco-scheme?
What are the spatial patterns of participation in the eco-scheme across different farm size groups, and how do these patterns change over time?
Is there a spatial correlation between farm size and payment levels? What does this imply about the direction and effectiveness of agricultural policy?
How do counties with the highest and lowest levels of agricultural support, number of beneficiaries, and farm size differ in terms of agricultural structure, socio-economic characteristics, and rural area typologies?
2. The Role of Carbon Farming in Sustainable Agriculture
Sustainable agriculture is a comprehensive concept based on three fundamental pillars: economic, social, and environmental [
17,
18,
19]. This concept aims to strike a balance between agricultural production efficiency, concern for societal well-being, and the protection of the natural environment. Modern forms of sustainable agriculture began to take shape in Europe only in 1992 when the reform of the CAP placed emphasis on ecological aspects by integrating agri-environmental policy with farming practices. The CAP reform marked a breakthrough by linking rural development issues, ensuring appropriate economic conditions for farmers and integrating environmental protection principles into agricultural practices. These actions aimed to improve the quality of life in rural areas and ensure the long-term profitability of the agricultural economy while also working toward environmental protection. The CAP is one of main EU policy, managed and funded at the European level from the Union’s budget. Its goals include supporting farmers and improving agricultural efficiency by ensuring a stable supply of food at affordable prices while also raising farmers’ living standards—contributing to the development of rural areas. A key component of the CAP is the promotion of the sustainable management of natural resources, combating climate change, and protecting rural areas and landscapes across the Union, all of which support biodiversity conservation.
Sustainable agriculture is a term with various definitions in the literature, but a common denominator among most of them is the aim to organise agricultural production in a way that does not cause negative environmental changes—or seeks to minimise them—while eliminating resource degradation. The difficulty in defining this term stems from diverse methods of describing and measuring agricultural phenomena, as well as the considerable organisational and functional complexity of agriculture, production diversity, regional differences in management conditions, and the complexity of economic, demographic, and social processes—unparalleled in other types of economic activity [
20].
In 1987, the Food and Agriculture Organization (FAO) of the United Nations adopted the following definition of sustainable agricultural development: “Sustainable development involves the utilisation and conservation of natural resources and the shaping of technologies and institutions in such a way as to meet the needs of present and future generations. Such development in agriculture, forestry and fisheries, through the conservation of soil, water resources, plants, and animal genetic resources, does not degrade the environment, uses appropriate technologies, is economically viable, and is socially acceptable” [
21].
According to Stinner and Blair [
22], sustainable agriculture differs from conventional high-input agriculture because it focuses on long-term yield stability with minimal environmental impact rather than short-term goals like yield maximisation. Kutkowska [
23] emphasises that sustainable agriculture is a farming system that combines economic, social, and ethical priorities with ecological security. This is achieved through appropriate management, rational use of ecosystem self-regulation mechanisms, and scientific and technological progress. In practice, this primarily means reducing intensive production characterised by heavy chemical inputs and excessive mechanisation. At its core lies the principle of ensuring the longevity of agricultural systems by minimising negative environmental impacts, optimising resource utilisation, and enhancing resilience to external shocks [
24].
Sustainable agricultural development has become a key component of the European Green Deal, a comprehensive policy agenda aimed at transitioning toward a climate-neutral, circular economy [
25]. A crucial element of this strategy is the “Farm to Fork” initiative, which sets ambitious goals for reducing greenhouse gas emissions, promoting organic farming, and protecting biodiversity within the agricultural sector [
26,
27].
Carbon farming plays a key role in sustainable agricultural development, primarily through the sequestration of carbon dioxide (CO2) in the soil, which contributes to mitigating climate change.
Contemporary global changes—such as advancing globalisation, technological development, and economic growth—are leading to significant transformations in the natural environment. One of the most significant consequences is the sharp increase in carbon dioxide emissions, which drives global warming. Data analysis shows that CO
2 emissions rose from about 5 billion tons per year in the mid-20th century to over 35 billion tons per year at the turn of the 21st century [
28]. As a result, many institutions recognise the growing CO
2 emissions as the most urgent issue that must be addressed.
Carbon farming is an approach aimed at both reducing carbon dioxide emissions and storing this gas from the atmosphere in plants and soils using various agronomic techniques. Definitions of carbon farming vary slightly depending on the author, but they all focus on integrating agricultural methods that support carbon sequestration. Foley et al. [
29] view carbon farming as part of a more complex agricultural strategy, which seeks to balance food production, environmental protection, and climate change by applying practices that reduce greenhouse gas emissions and actively contribute to the absorption of carbon dioxide from the atmosphere.
Lal [
30], one of the pioneers of research on carbon farming, sees it as a set of practices that contribute to long-term carbon storage in the soil. He lists practices such as the use of compost, organic fertilisers, and minimal soil tillage, and the introduction of agroecosystems that enhance the efficiency of carbon sequestration. Similarly, according to Jarosz et al. [
31], carbon farming consists of practices that minimise greenhouse gas emissions while maximising carbon uptake in the soil. These include techniques such as appropriate crop cultivation, implementation of strip farming, soil quality improvement, and crop rotation. The FAO defines carbon farming in a similar way. It understands carbon farming as a set of activities aimed at increasing carbon sequestration in the soil, improving its health, and enhancing the productivity of agricultural production [
32].
Carbon-absorbing cultivation can also be defined as an ecological business model in which land managers are rewarded for adopting improved land management practices that lead to increased carbon sequestration in biomass, dead organic matter, and soil by enhancing CO
2 capture or limiting the release of carbon dioxide into the atmosphere. This is performed in accordance with ecological principles that support biodiversity and benefit overall natural capital [
33].
In light of the expected outcomes of carbon farming—namely, carbon dioxide sequestration and the reduction of existing emissions, as well as the avoidance of future greenhouse gas emissions—specific agronomic and technological practices have been identified for support and promotion under the framework of carbon farming. Examples of supported practices include restoring wetlands and peatlands, establishing agroforestry systems, maintaining and increasing organic carbon content in soil and effective livestock and manure management, as well as nutrient management on arable land and grasslands. Through these practices, carbon farming becomes a foundation for achieving carbon neutrality goals, contributing both to climate change mitigation and the protection of natural resources [
33].
3. Eco-Scheme—A Support Policy for Carbon Farming in Poland
The EU’s climate goals are extremely ambitious and achieving climate neutrality by 2050 requires member states to adapt their strategies and implement effective methods for reducing greenhouse gas emissions across all sectors of the economy. The reduction in greenhouse gas emissions through the implementation of carbon farming practices in the EU has been estimated at 101–444 Mt CO
2-eq per year [
34]. According to data from the Intergovernmental Panel on Climate Change (IPCC), one hectare of agricultural land where regenerative farming practices are applied can sequester between 0.4 and even 3 tons of CO
2 annually, whereas, in the case of peatlands and forests, sequestration may reach up to 8.6 Gt CO
2-eq per year [
35].
Carbon farming plays a significant role in reducing greenhouse gas emissions in the agricultural sector. Therefore, governments and international organisations are introducing financial support programs for farmers who decide to adopt sustainable agricultural practices.
Eco-schemes are a new tool under Pillar I of the CAP, and there have been and continue to be great expectations that they will support the implementation of the goals of the European Green Deal as they pertain to agricultural management. These policy goals include, among others, supporting fair farmer incomes, increasing the competitiveness of farms, improving farmers’ position in the value chain, combating climate change, and protecting the environment and biodiversity [
36]. EU countries have developed national CAP Strategic Plans to help achieve these objectives, taking into account local needs and conditions [
14].
Although eco-schemes are a new instrument in agricultural policy, their significance goes beyond the political sphere and has become a subject of interest to the scientific community. Researchers are analysing the effectiveness of these practices in terms of environmental protection and economic efficiency, and evaluating their impact on biodiversity, soil quality, and the adaptation of agriculture to climate change [
37,
38,
39,
40,
41,
42,
43,
44,
45].
Eco-schemes are mandatory for all member states but voluntary for farmers [
46,
47]. They are annual, additionally paid practices tailored to national conditions and needs but evaluated by the European Commission in terms of achieving the environmental and climate objectives of the new CAP [
48]. In Poland, eco-schemes have been designed to promote practices that translate into farm incomes by increasing soil fertility and rational fertilisation, and improving crop quality. The main mechanism for this is the carbon farming eco-scheme, under which farmers can choose from eight available practices that best suit their needs.
The practices covered by the eco-scheme include the following [
49]:
Extensive use of permanent grasslands with livestock grazing—maintaining meadows and pastures through grazing, which supports the increase in organic matter content in the soil.
Winter catch crops or undersown crops—sowing cover crops during the autumn–winter period to protect the soil against erosion and increase its fertility.
Development and compliance with a fertilisation plan:
Diverse crop structure—cultivating various crops to increase biodiversity and improve soil structure.
Incorporation of manure into arable land within 12 h of application—quick mixing of manure with soil limits ammonia emissions and improves fertilisation efficiency.
Application of natural liquid fertilisers using methods other than splashing—applying liquid fertilisers in ways that reduce nutrient loss.
Simplified tillage systems—using methods that minimise soil disturbance, such as no-till farming, which supports increased soil organic carbon content.
Incorporation of straw into the soil—leaving and mixing straw after harvest to enrich soil with organic matter.
Each of the above practices is assessed using a point system, where 1 point corresponds to a specified payment amount. To qualify for the eco-scheme, the farmer must obtain a minimum number of points, which equals the number of points awarded for implementing the highest-rated practice on at least 25% of the agricultural land on the farm. To benefit from the eco-schemes, a farmer must meet specific criteria (e.g., maintain appropriate documentation, such as an agrotechnical log, and submit statements or geotagged photos confirming the implementation of the practice) and submit an application for payment to the The Agency for Restructuring and Modernisation of Agriculture (ARMA), which is a public body implementing the instruments co-financed from the EU’s budget as well as providing of aid from national funds.
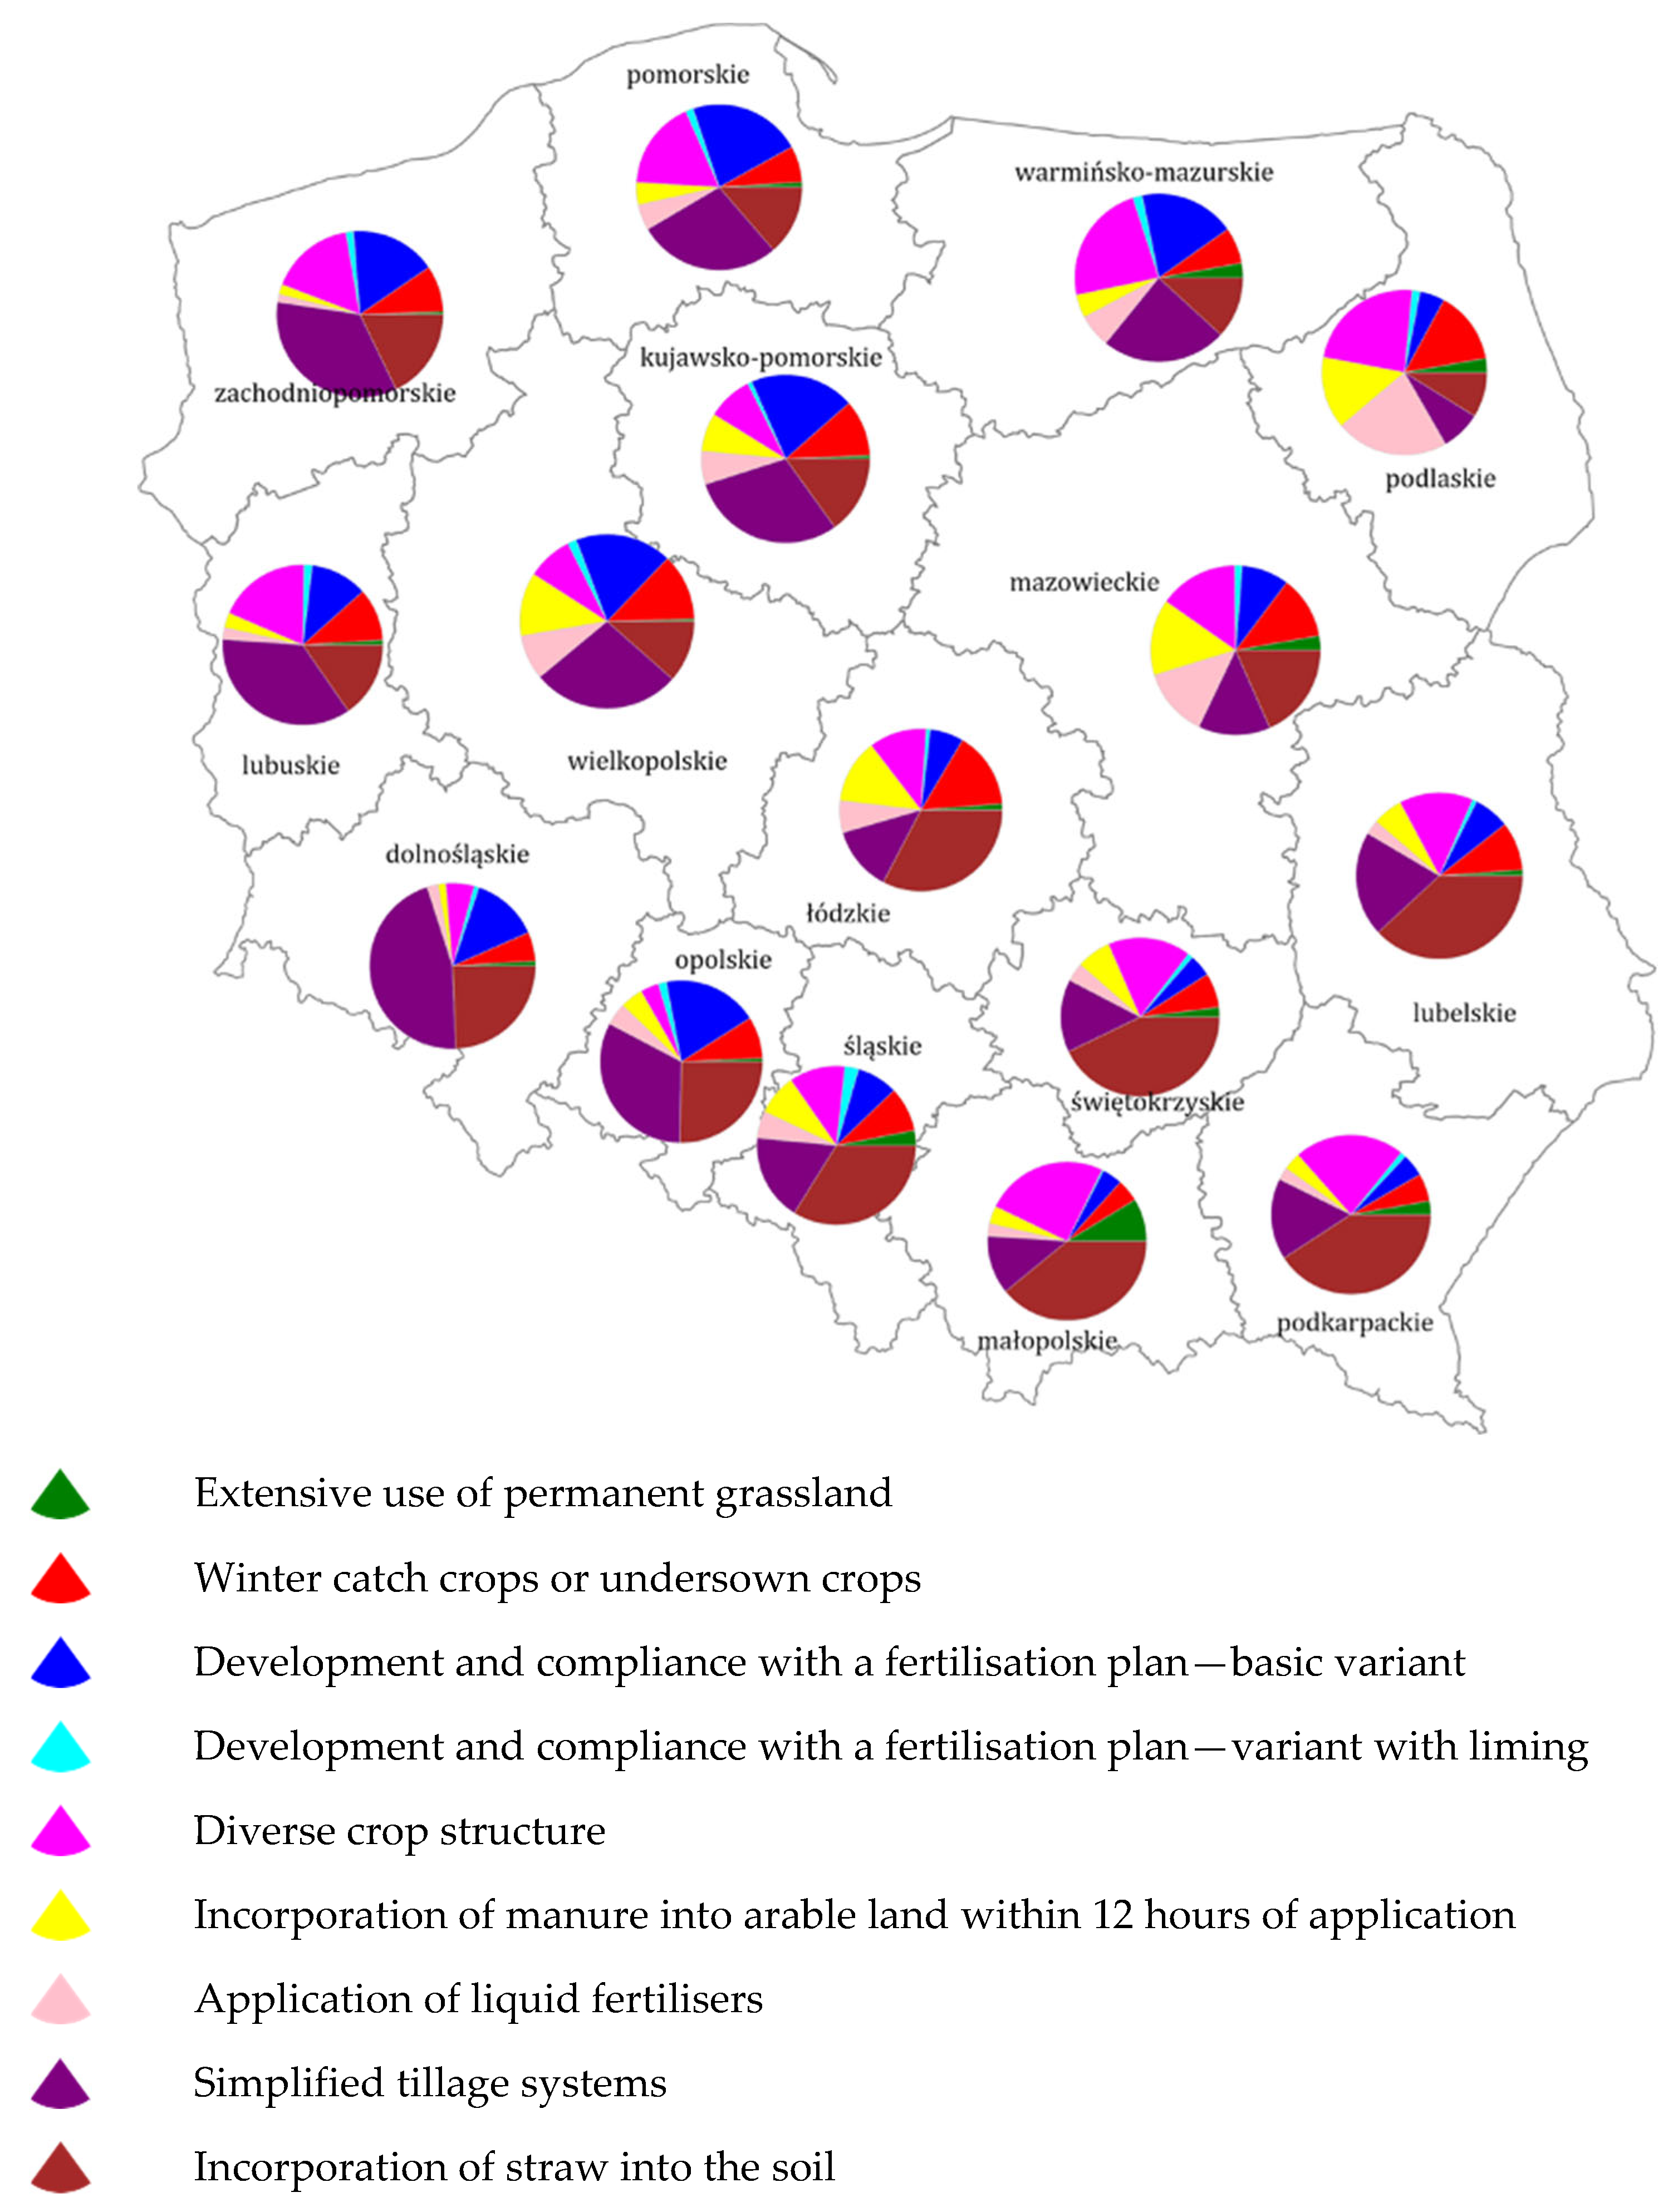
Subsidies for implementing individual practices are calculated based on the number of points assigned to them. In 2023, the value of 1 point was PLN 104.89. It is noteworthy that the greatest interest was not directed towards the practices with the highest point values, but rather towards those that were the most straightforward for farmers to implement. At the start of the scheme “Carbon farming and nutrient management”, 393,651 farmers in Poland submitted applications, covering nearly 8 million ha (7,648,652.39 ha) (ARMA, as of 11.2023) [
50]. This represented as much as 79.6% of all eco-schemes submitted nationwide.
Based on the number of applications submitted, the three most popular practices nationwide were “incorporation of straw into the soil” (229,050), “winter catch crops/undersown crops” (153,814), and “incorporation of manure into arable land within 12 h of application” (106,869). It should be emphasised that the selected practices had already been widely used by farmers and the introduction of payments aimed to reward their earlier efforts in preserving soil structure, specifically through maintaining or increasing the levels of organic matter and nutrients in the soil. However, the results of the analysis of the area declared for individual practices present a different picture. Nearly 5 million ha were declared under two carbon farming practices: “simplified tillage systems” (2,683,495.40 ha) and “incorporation of straw into the soil” (2,180,127.04 ha). In third place was “diverse crop structure”, with an area of 1,529,942.07 ha reported under this practice. The least interest among farmers was shown for the practice “development and compliance with a fertilisation plan”, particularly its liming variant, for which only 5356 applications were submitted (covering 147,692.20 ha) (see
Figure 1).
An analysis of the data reveals clear regional variations, both in terms of the number of applications and the size of the declared area. The wielkopolskie and mazowieckie voivodeships stand out compared to other regions in terms of the area covered by eco-schemes (1,023,044.96 ha and 790,496.09 ha, respectively). In the case of the most popular practice, “simplified tillage systems”, the leader was the wielkopolskie voivodeship (407,379.33 ha), which is linked to its specific agrarian structure. Notably, the Polish CAP Strategic Plan allocated 800,000 ha for this practice using the simplified system, whereas farmers submitted applications for a total of 2,683,495.40 ha. This situation was related to a change in the payment rate. However, it should be noted that, according to the rules, farmers were allowed to combine several eco-schemes within a single application, which makes it difficult to assess the true scale of interest in this form of support.
4. Materials and Methods
4.1. Materials
An empirical analysis was conducted for Poland, one of the largest recipients of financial support from the European Union budget. This study focuses on regional disparities in agricultural support, using data aggregated at the county (powiat, NUTS 4) level. The county (powiat) is a second-level administrative unit in Poland, situated between the municipality (gmina, NUTS 5) and the voivodeship (województwo, NUTS 2). It plays a key role in the Poland’s administrative structure, managing responsibilities that exceed the scope of individual municipalities but do not require intervention at the regional (voivodeship) level.
To achieve the stated research objective, a review of the relevant literature was conducted, supplemented by the use of data from several official national sources, covering both administrative and statistical domains. Information on the farm area, number of beneficiaries, and the amount of payments for the carbon farming eco-scheme for the years 2023 and 2024 was obtained from the ARMA, which manages the distribution of EU and national agricultural subsidies in Poland. Data on the total number of farms, dominant types of farming specialisation, and farm economic class sizes were sourced from the Central Statistical Office in Poland (Statistics Poland), based on the agricultural census conducted in 2020. These data provided a structural overview of Polish agriculture (see
Appendix A). In addition, the typological classification of rural areas was derived from the Monitoring of Rural Areas Development based on data available for the year 2023 [
51], which categorises municipalities according to functional, economic, and demographic characteristics.
4.2. Methods
In order to investigate the spatial dependence of farm area and payment amounts by farm size, we applied the global and local Moran’s I statistics. These methods enable the detection of spatial autocorrelation, providing insight into whether the value of a variable in a given location is influenced by values in neighbouring areas [
52,
53]. Additionally, to explore the spatial relationship between these two variables, we used the global spatial cross-correlation index (GSCI), which allows for assessing the degree of co-dependence between spatial patterns of distinct variables.
4.2.1. Global and Local Autocorrelation
Global Moran’s I is among the most commonly used measures of spatial autocorrelation. It is especially valuable for assessing whether the observed spatial distribution of a phenomenon is random, clustered, or dispersed. This measure was originally introduced by [
54] and later formalised and expanded in the fields of spatial econometrics and geographic information science [
55,
56]. The statistic is defined as follows:
and
where
is the observed value in spatial unit
I,
is the mean of all observed values,
is the spatial weight between units
I and
j, and
is the number of spatial units. The spatial weights matrix
reflects the spatial structure and was row-standardised so that each row sums to 1.
Positive spatial autocorrelation (
I > 0) means that similar values (either high or low) tend to cluster together. Negative spatial autocorrelation (
I < 0) indicates that dissimilar values are neighbours, suggesting spatial dispersion (hot spots). As noted by [
53], when the spatial weights matrix is appropriately defined, the Moran’s I statistic can be interpreted as a form of a weighted correlation coefficient. It serves to identify spatial patterns in the distribution of variable
x, specifically by testing whether adjacent regions exhibit greater similarity in their values than would be expected under a random, purely stochastic process. The significance of the Moran’s I statistic can be assessed either through theoretical moments or a permutation-based approach. If the theoretical mean (expected value) of Moran’s I approximates zero, it is interpreted as an indication of spatial randomness. To estimate the theoretical variance in the statistic, the randomisation method was employed [
56,
57].
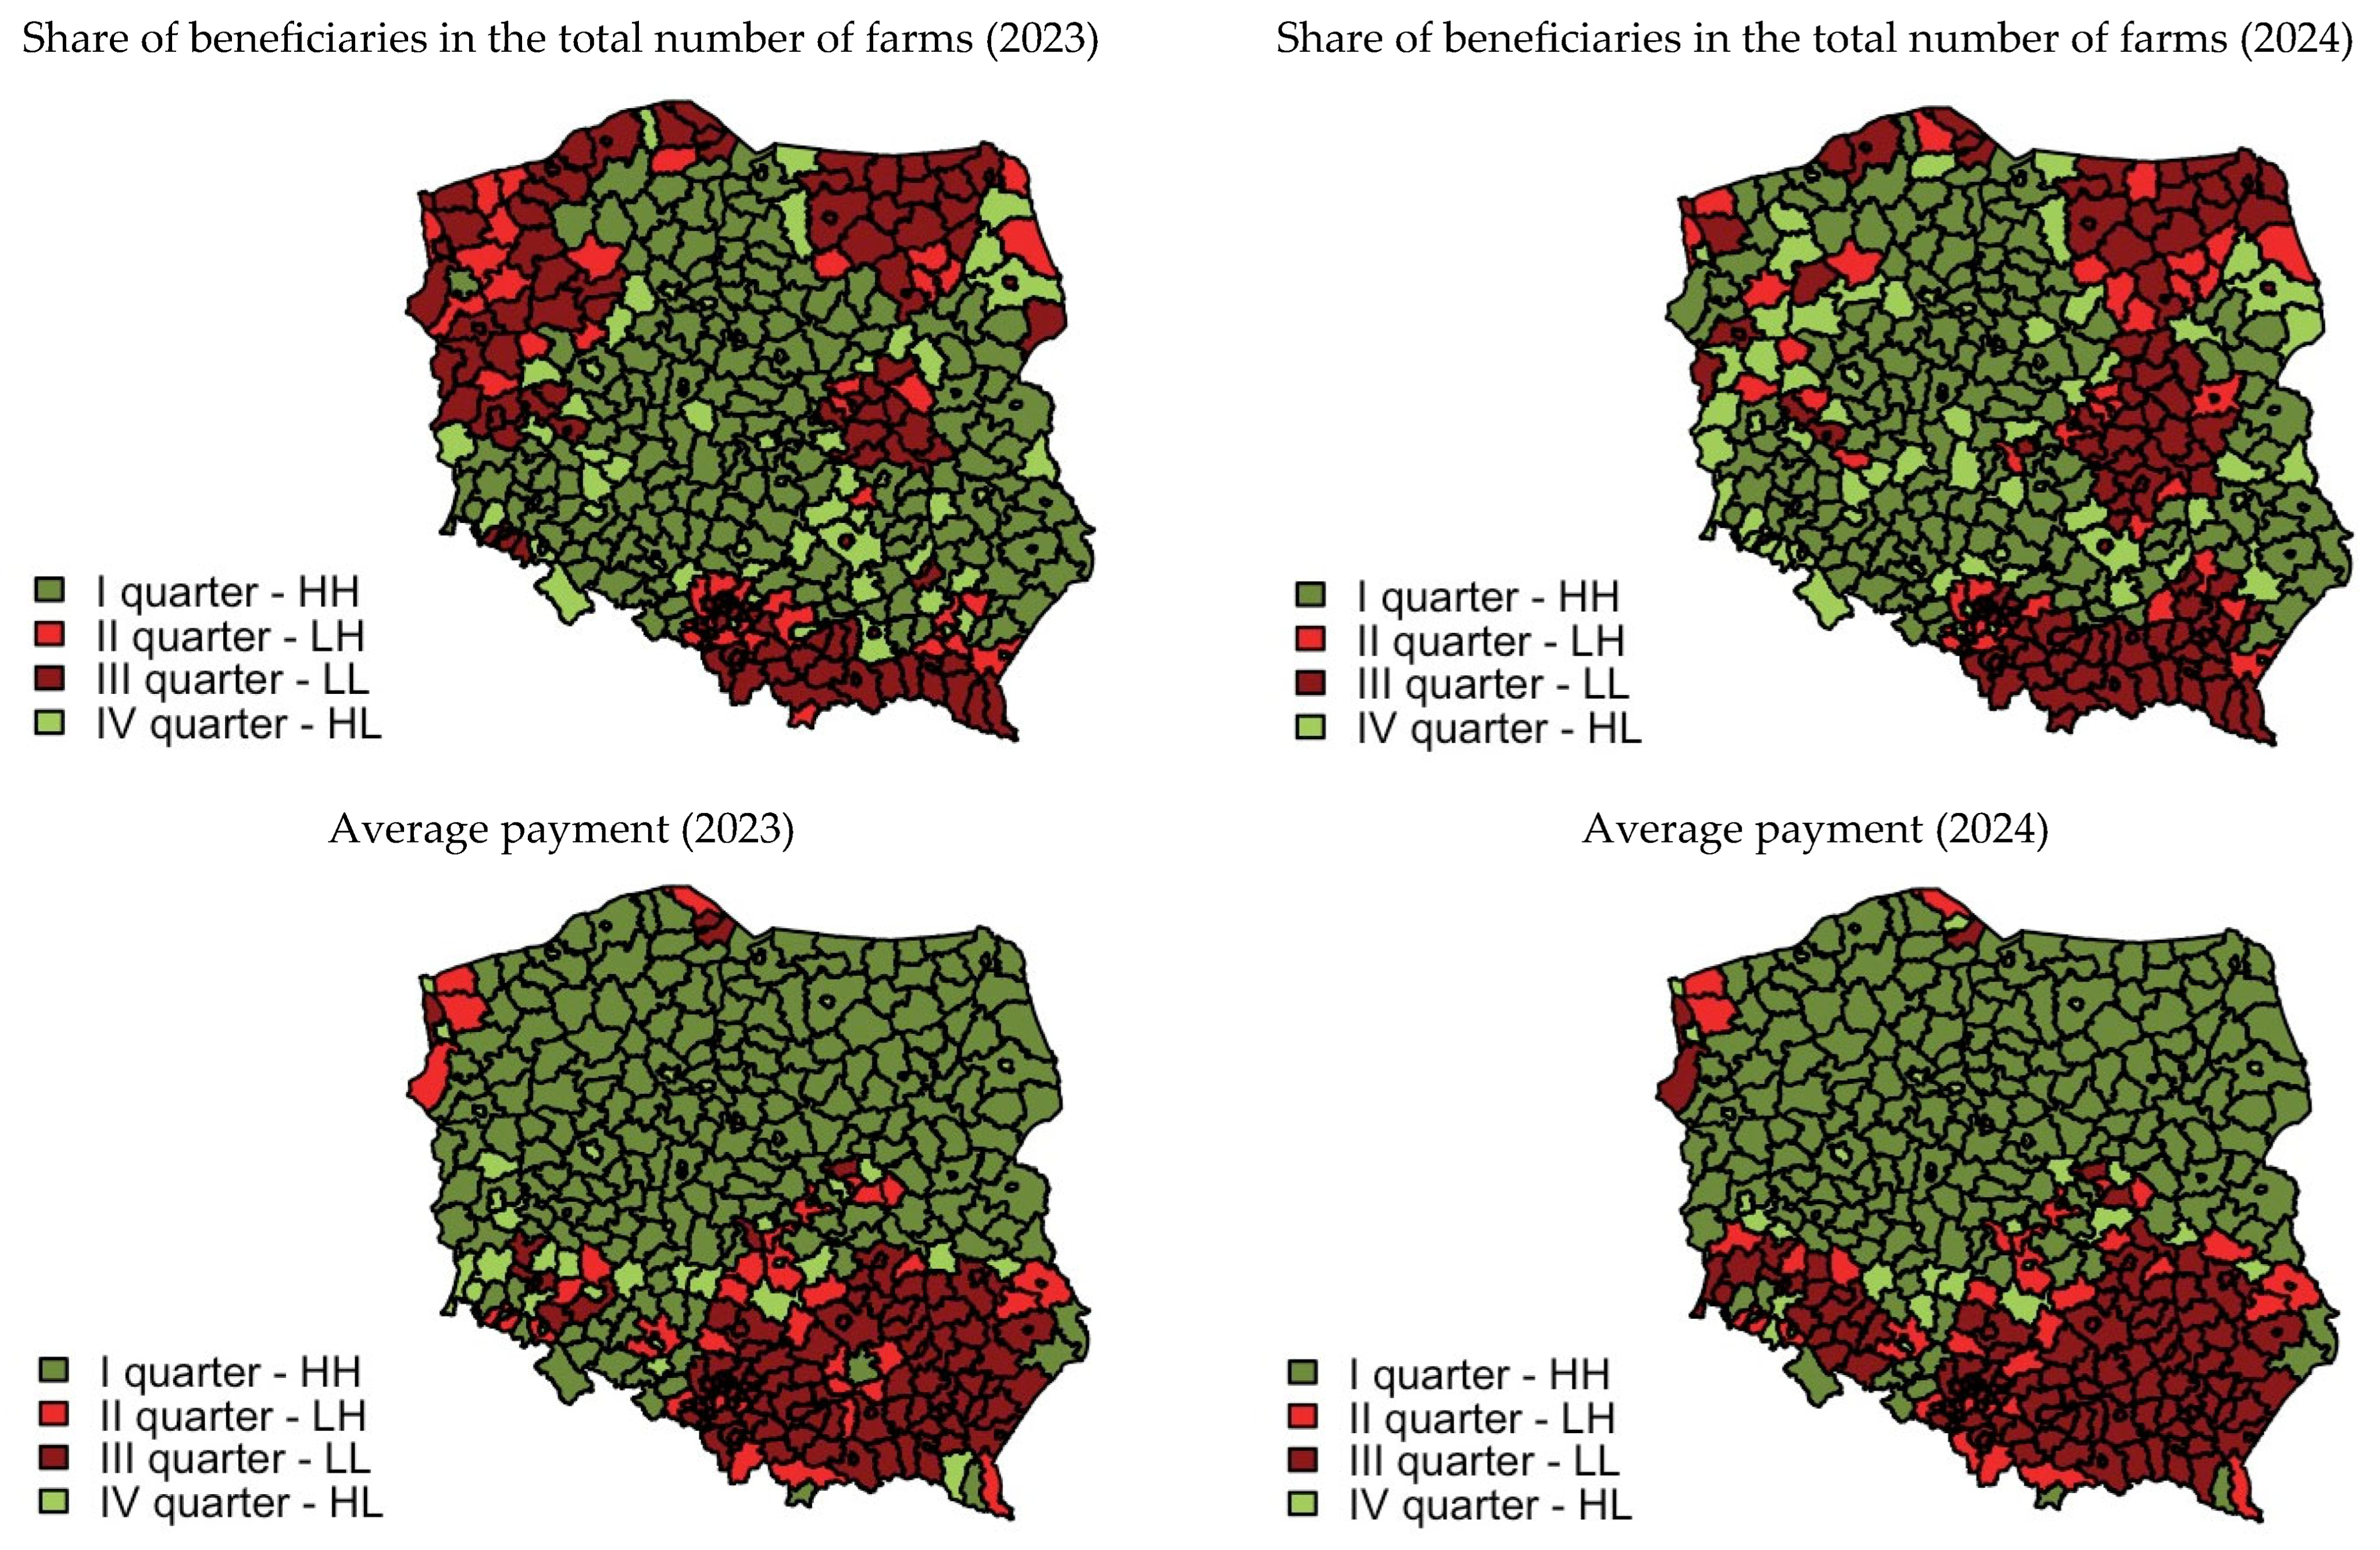
To visualise spatial autocorrelation in each county, we employed a Moran scatterplot, displayed as a map based on the local Moran’s I
i statistic. This map categorises data into four quarters (see
Table 1), each indicating distinct spatial relationships:
This interpretation helps identify local clusters (HH—high value in the region with high values in neighbours, LL—low value in the region with low values in neighbours) and spatial outliers (HL—high value in the region with low values in neighbours, LH—low value in the region with high values in neighbours), providing a diagnostic tool for detecting spatial heterogeneity and potential spatial regimes.
The global Moran’s I provides a synthetic measure indicating whether clustering exists across the entire study area, making it useful for general assessments. However, it does not identify where such clusters occur or their nature. In contrast, local Moran’s I highlights specific areas of high or low spatial association, offering detailed insights into spatial patterns. It enables the detection of regions that strongly influence the formation of local clusters, the investigation of non-random local clusters, so-called hot spots, local instability, significant outlier observations, and spatial regimes [
58]. Despite this advantage, local statistics are more sensitive to multiple testing issues and spatial outliers. Both methods depend heavily on the definition of spatial weights and assume stationarity, which can limit their interpretability in heterogeneous landscapes.
4.2.2. Global Spatial Cross-correlation Index
The GSCI is a measure designed to capture the spatial dependence between two variables across a given geographic area. Proposed by [
59], the index extends the traditional concept of spatial autocorrelation by quantifying the cross-correlation between two different variables rather than a single variable’s spatial distribution. The GSCI can be expressed as the sum of two components:
Chen [
59] shows that the following relationship exists between Pearson’s linear correlation coefficient and the GSCI:
where
is the overall spatial cross-correlation (Pearson linear correlation coefficient),
is the indirect component, capturing the influence of spatial effects, and
is the direct component, reflecting the correlation between variables that is not explained by the spatial structure. This index provides a global perspective on how strongly and in what manner two variables co-vary in space, offering insight into their spatial co-distribution patterns.
5. Results
5.1. Farm Size and Spatial Clustering in the Carbon Farming Eco-Scheme over Time
In order to examine the spatial patterns pertaining to the uptake and distribution of carbon farming payments (eco-scheme) in Poland, a spatial statistical analysis employing the Global Moran’s I statistic was performed (see
Table 2). This analysis was categorised by farm size to evaluate spatial dependencies across two dimensions: the total number of beneficiaries and the average payment amount (in EUR) received per beneficiary at the county (powiat) level for the years 2023 and 2024.
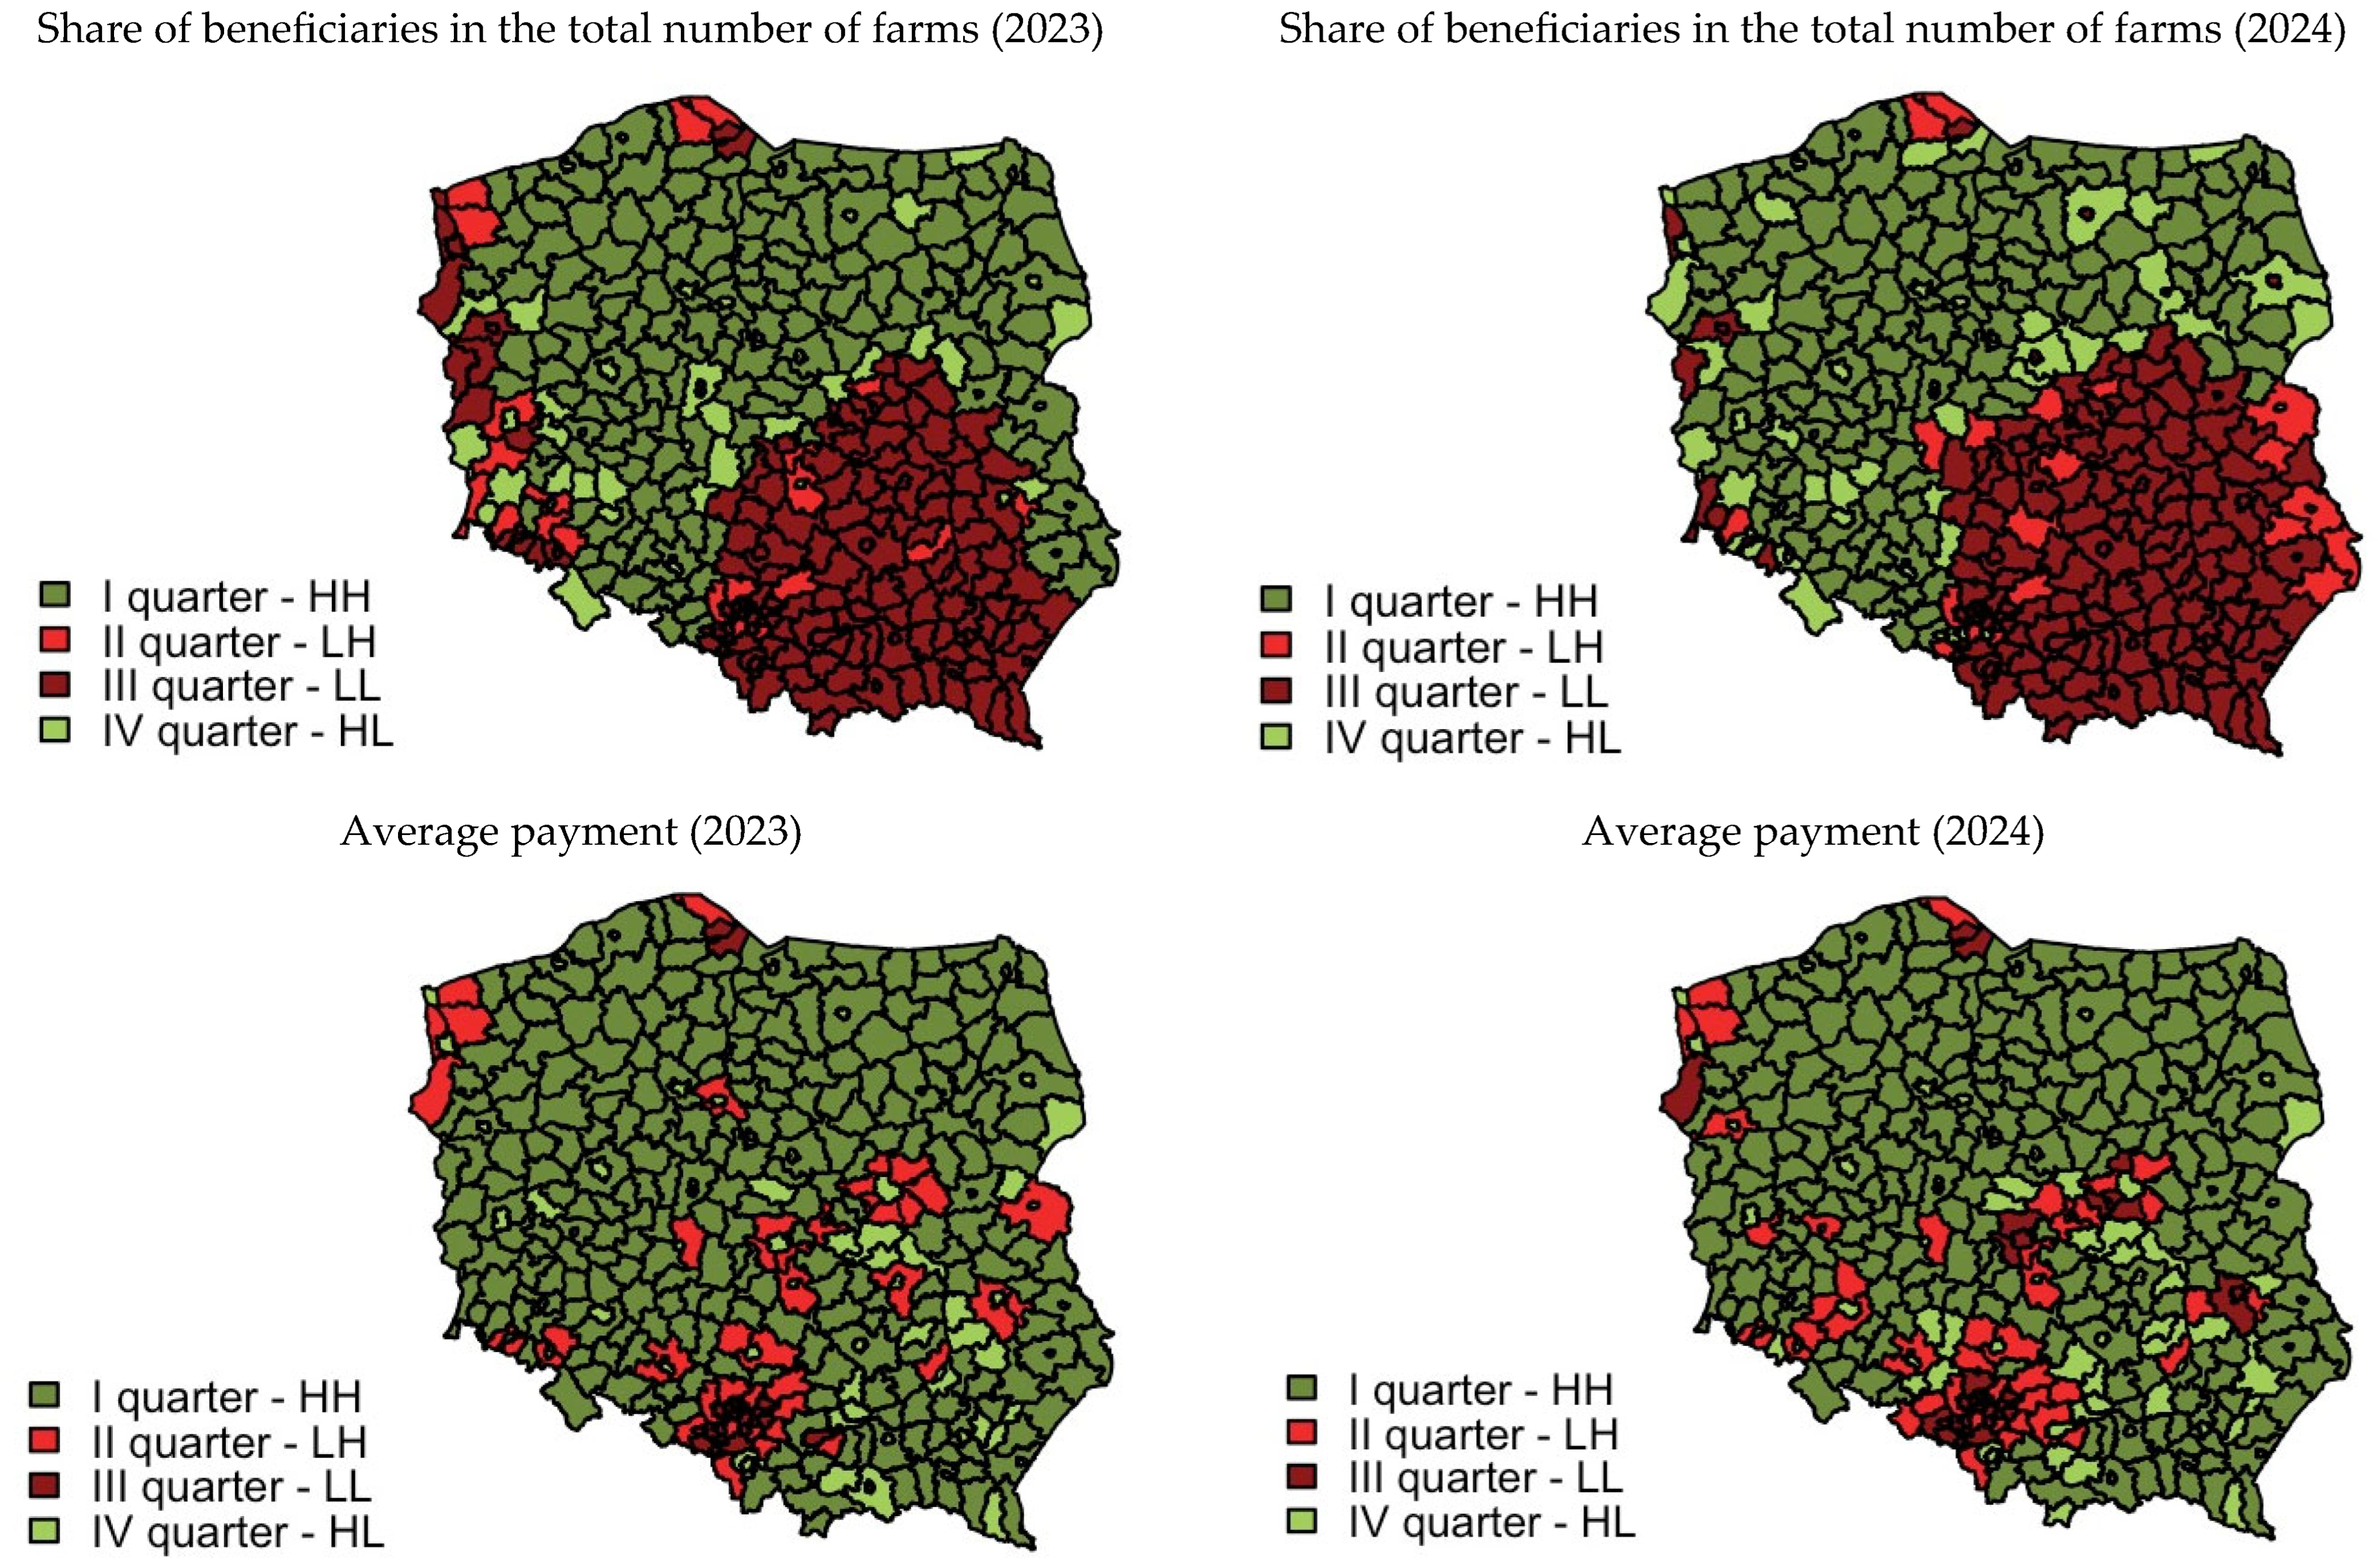
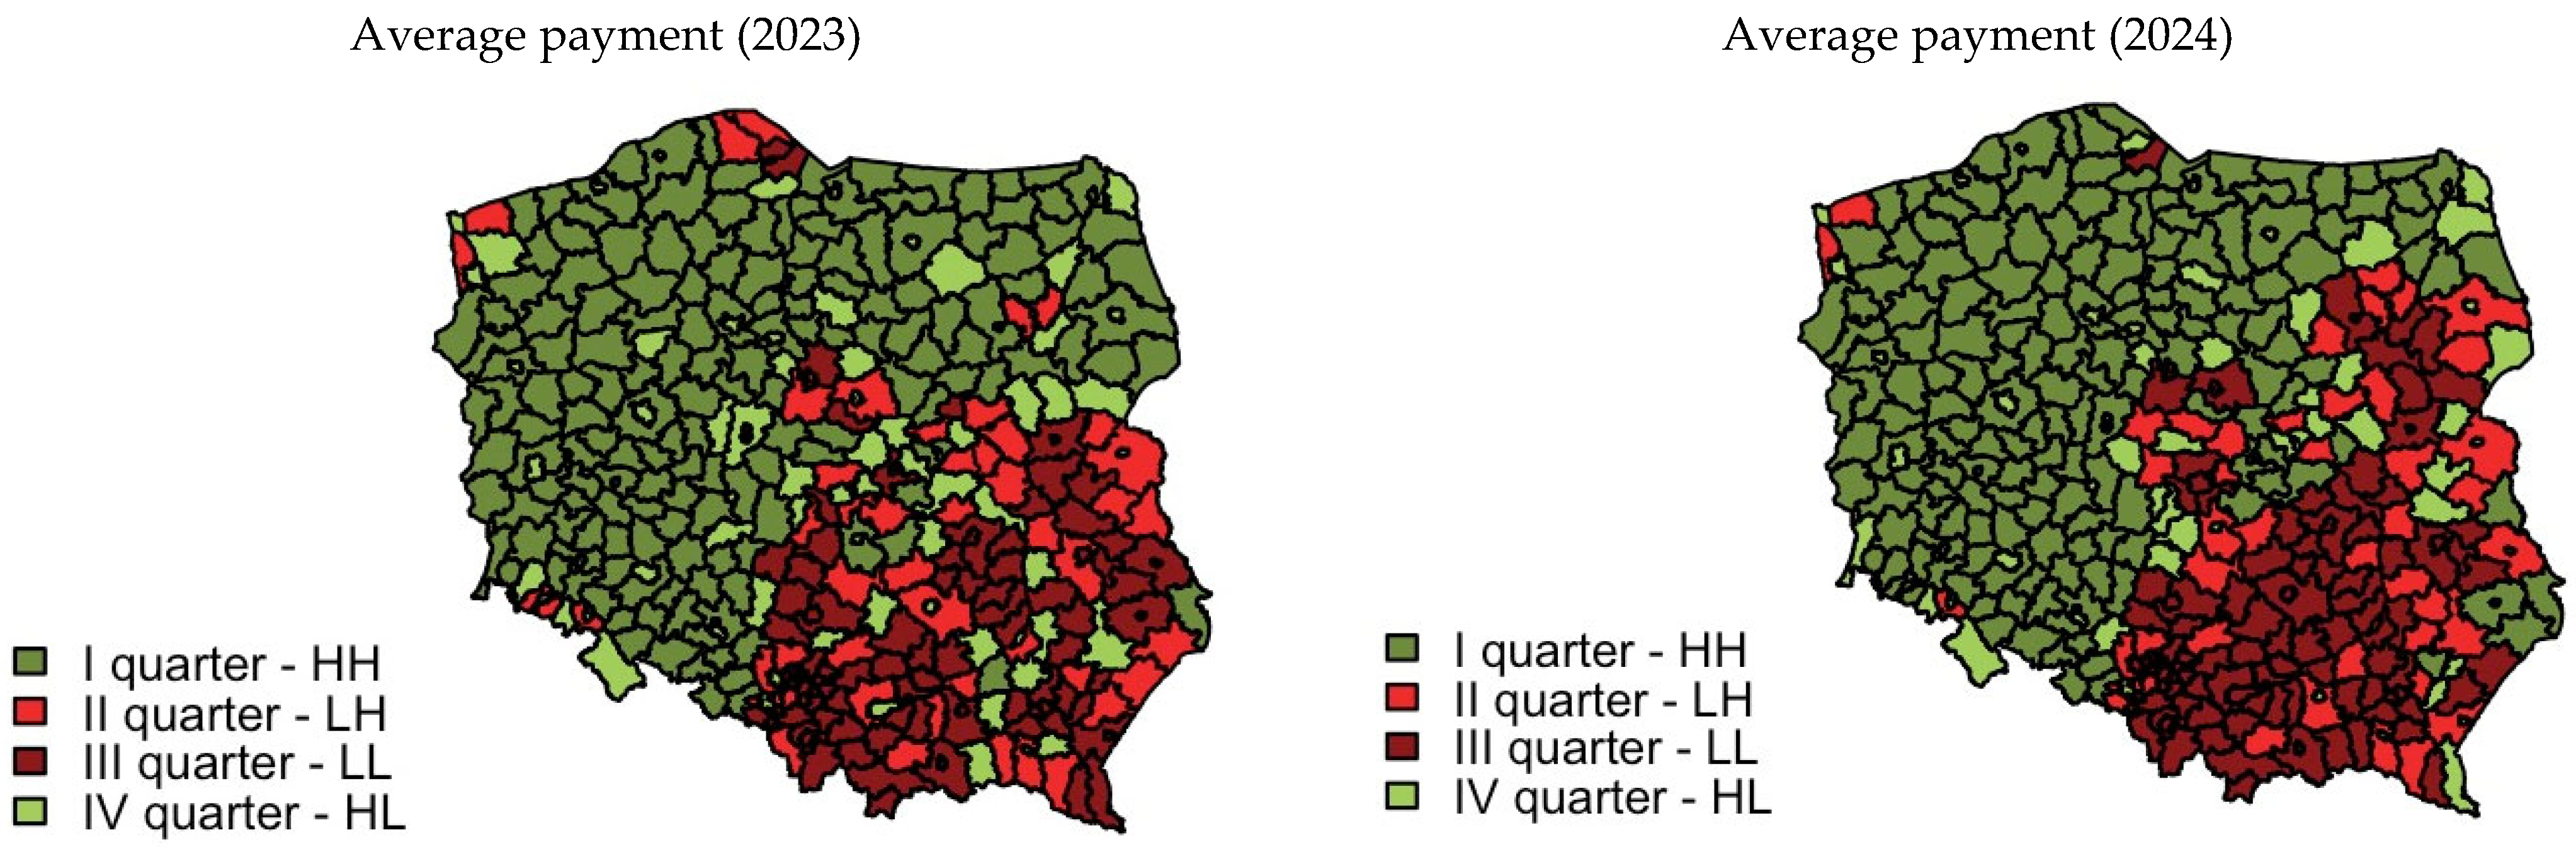
For farms with an area smaller than 15 ha (see
Figure 2), the spatial autocorrelation of the number of beneficiaries demonstrated a positive and statistically significant correlation, registering at 0.28 in the year 2023, and experiencing a marginal increase to 0.31 in 2024. Notable low-value clusters were predominantly identified in the southern, north-western, and north-eastern regions of Poland in 2023; however, in 2024, these clusters extended into the central–eastern areas. The mean payment amount exhibited a heightened level of spatial autocorrelation, rising from 0.34 in 2023 to 0.39 in 2024, thereby distinctly highlighting high-value clusters in the northern regions and low-value clusters in the southern regions.
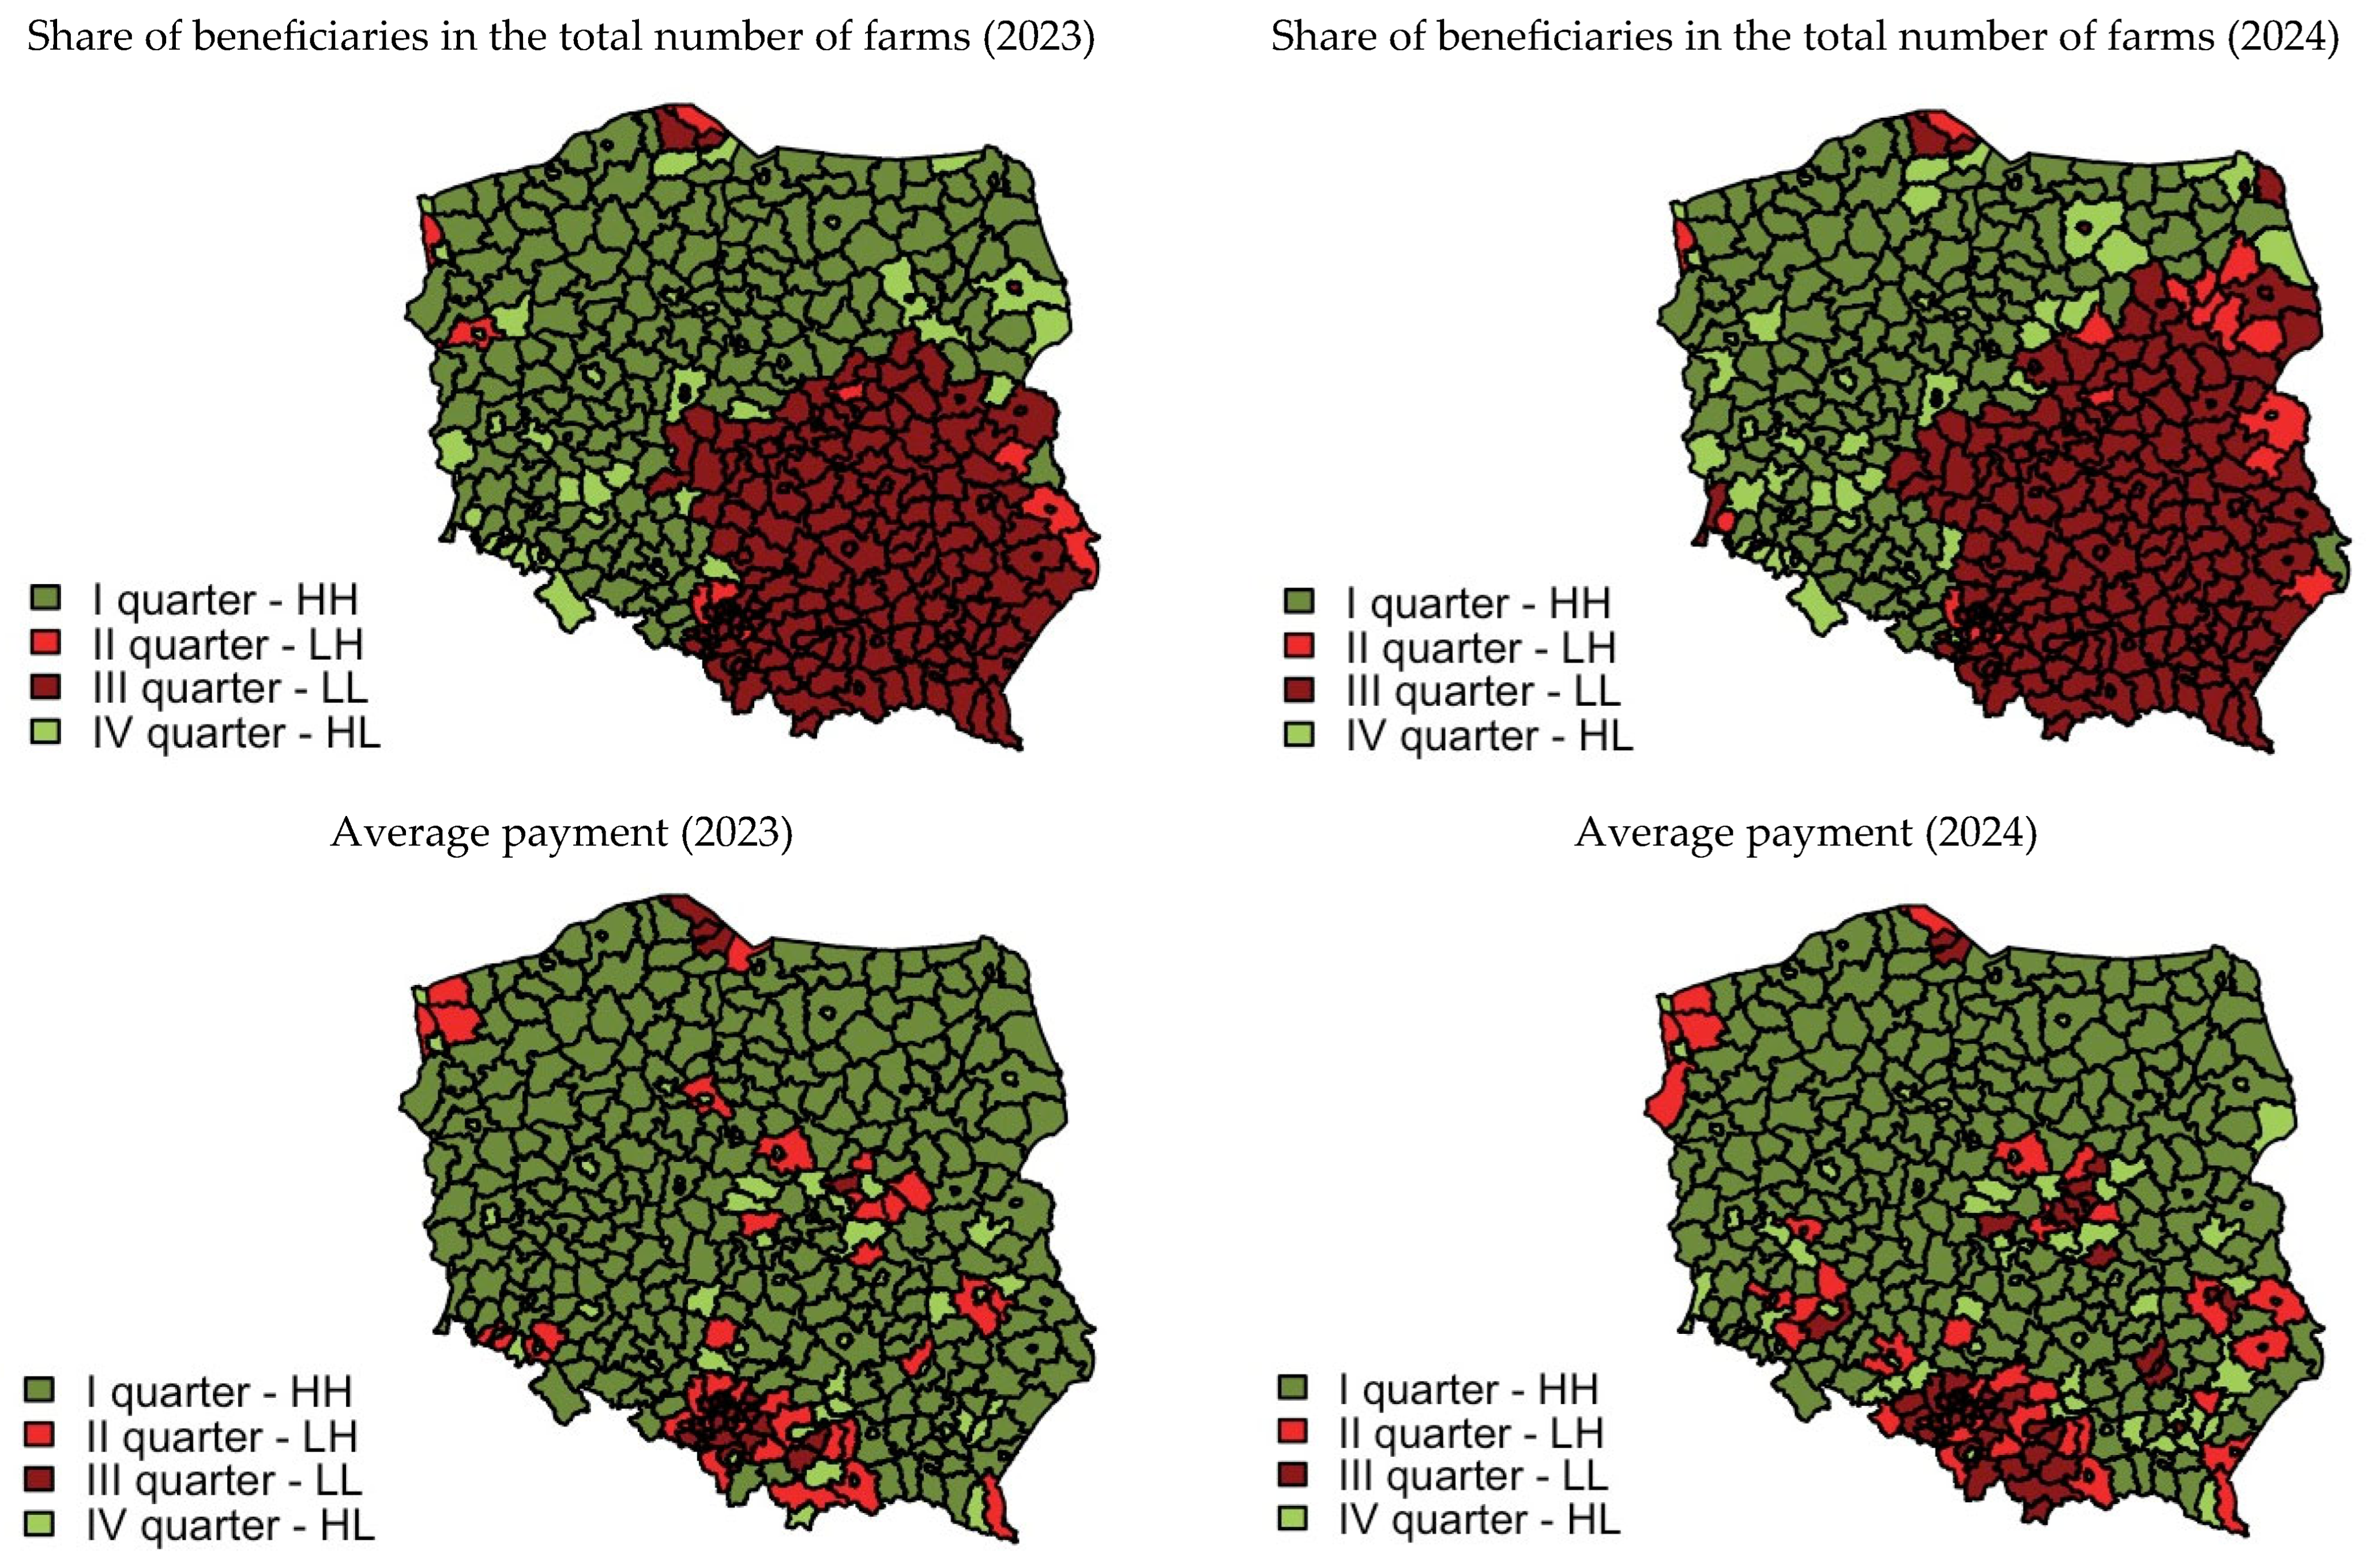
Farms with an area of 15 to 30 ha (see
Figure 3) exhibited a considerably higher spatial autocorrelation in the number of beneficiaries, recorded at 0.58 in both 2023 and 2024. Notably, prominent low-value clusters were detected in the south-eastern and central–eastern regions, while high-value clusters emerged distinctly in western Poland. In contrast, the spatial autocorrelation pertaining to average payments was significantly weaker, measured at 0.16 in 2023 and 0.18 in 2024, lacking a clear cluster formation.
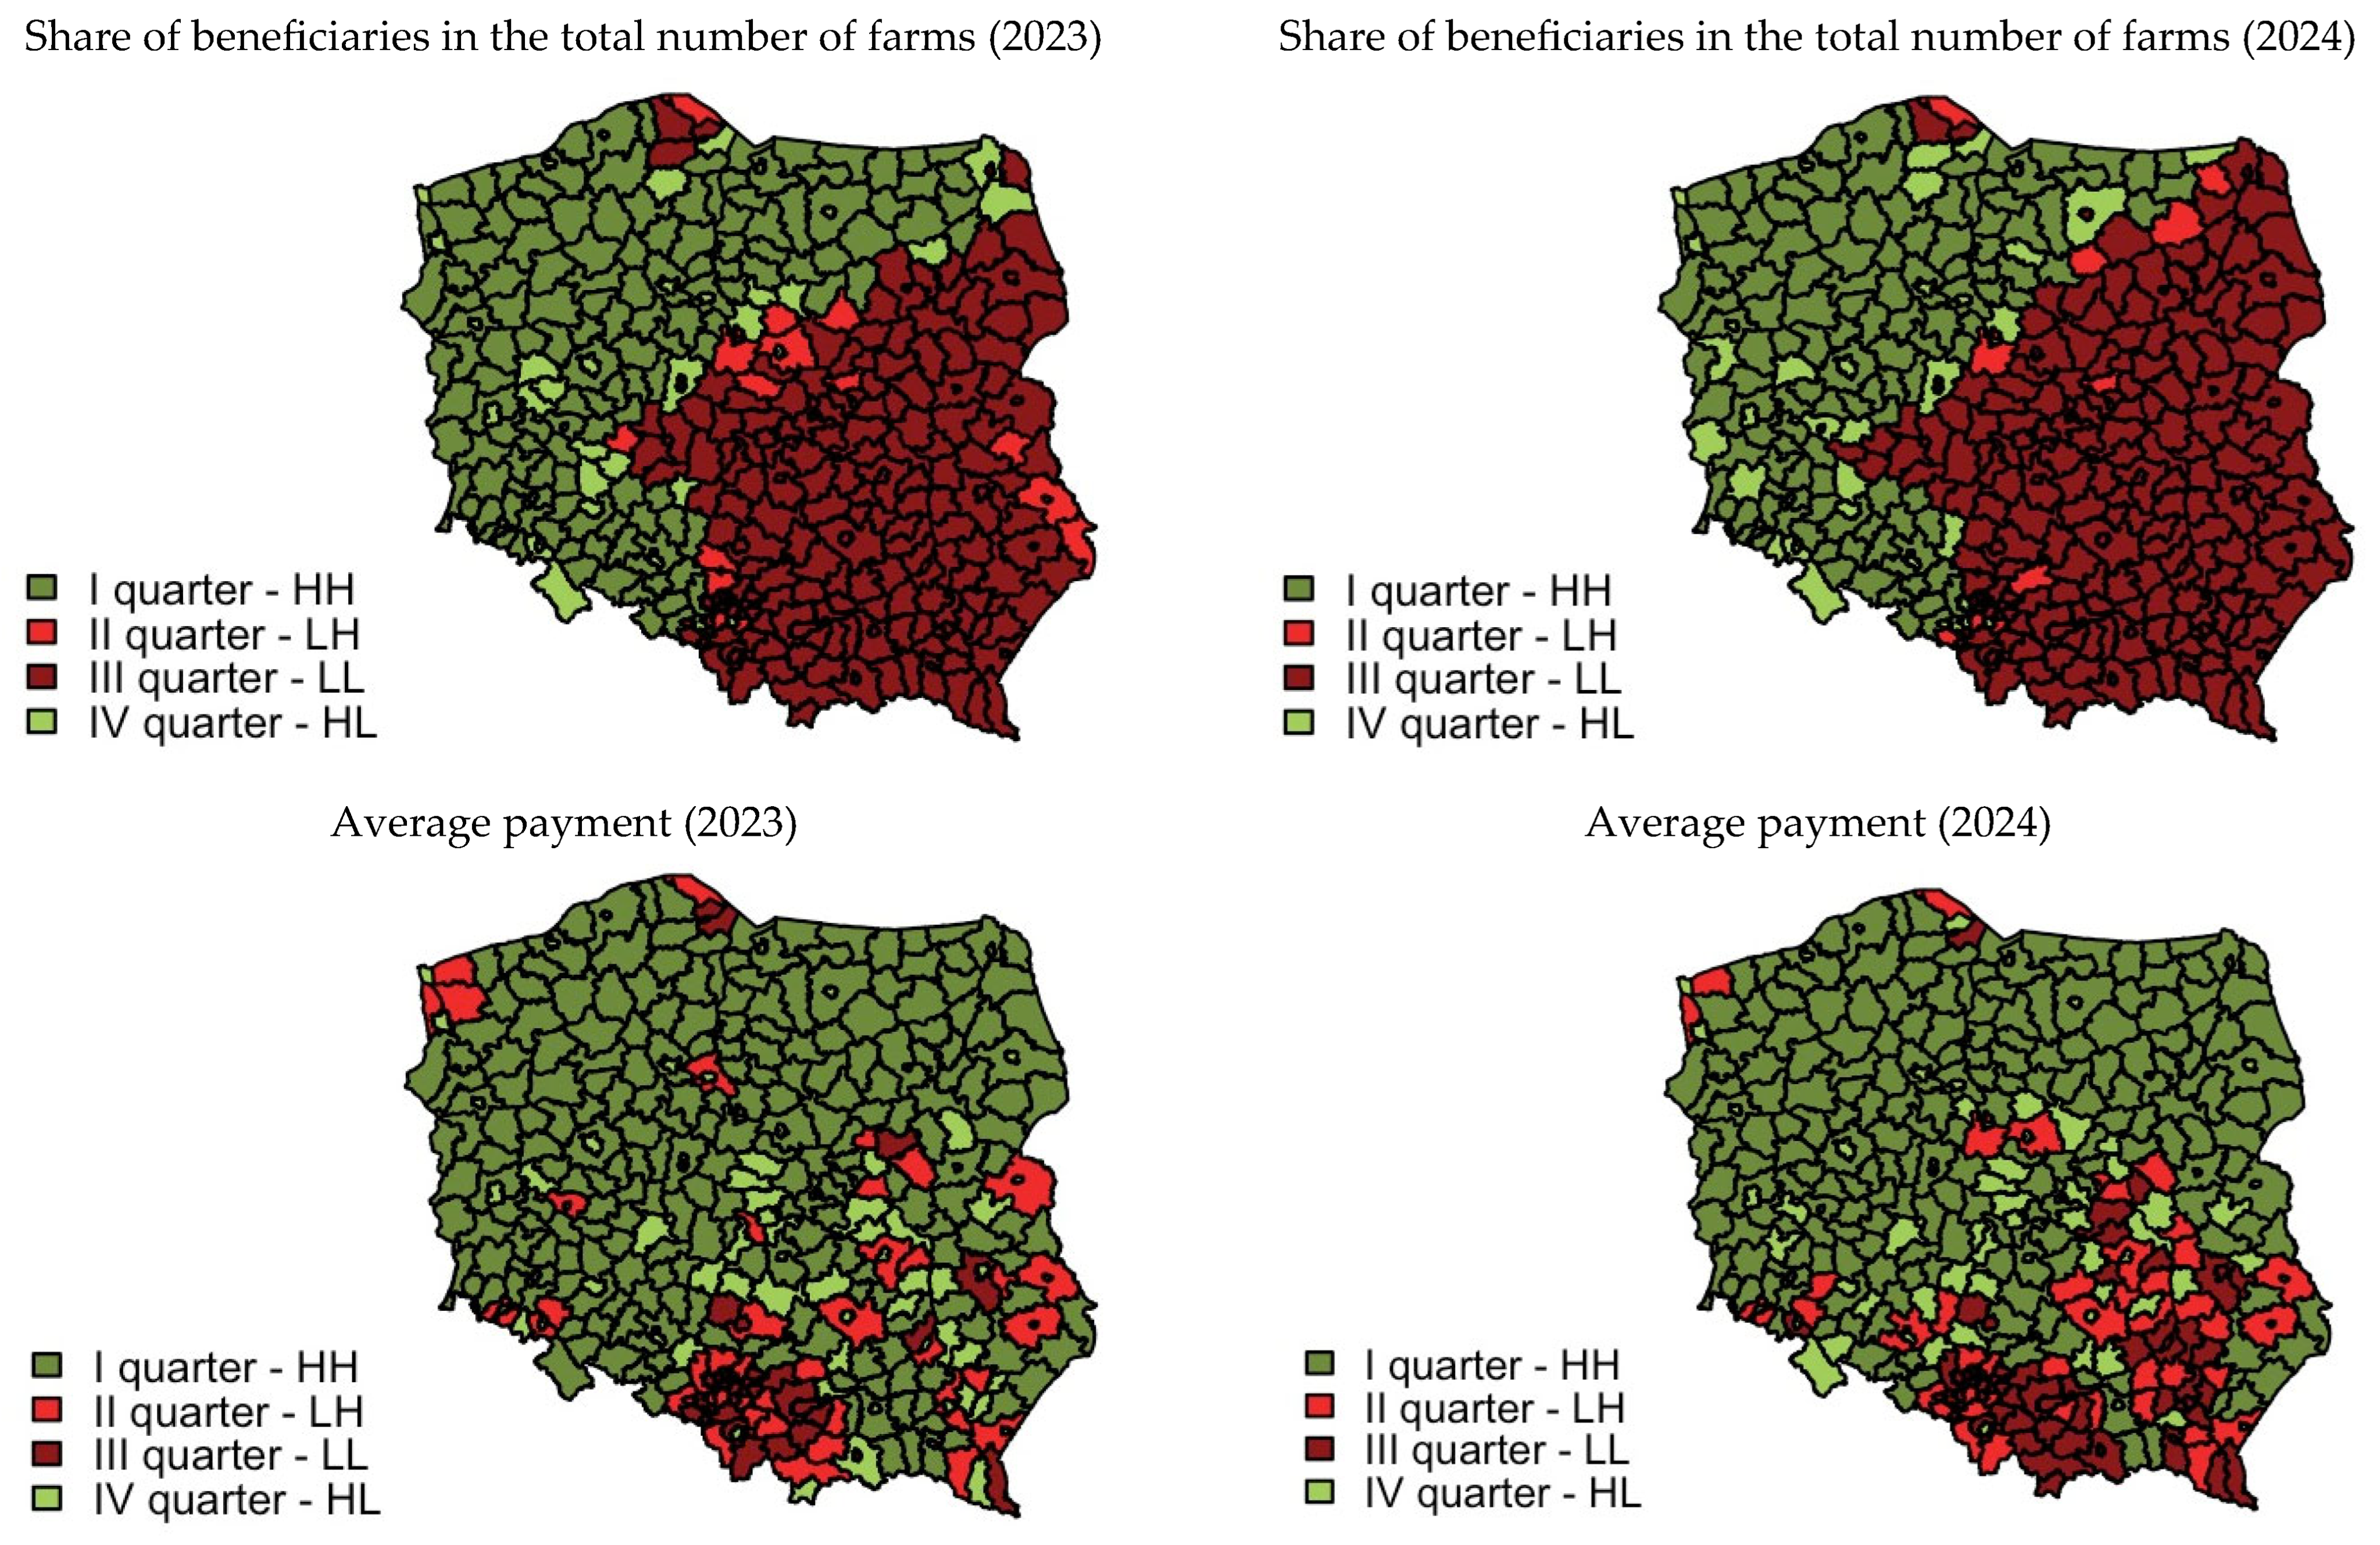
For farms ranging from 30 to 50 ha (see
Figure 4), spatial autocorrelation among beneficiaries exhibited a pronounced strength, as evidenced by Moran’s I values of 0.63 and 0.61 for the years 2023 and 2024, respectively. This phenomenon was typified by clear low-value clusters predominantly located in south-eastern Poland, while high-value clusters displayed a notable shift towards north-western regions in 2024. In contrast, the autocorrelation of average payments was markedly weaker, recording values of 0.15 in 2023 and 0.20 in 2024, and it exhibited no recognisable clustering patterns.
Within the category of farms ranging from 50 to 100 ha (see
Figure 5), the Moran’s I statistic for the number of beneficiaries peaked at 0.64 in 2023, subsequently experiencing a slight decline to 0.61 in 2024. These data reveal prominent low-value clusters situated in eastern Poland, alongside high-value clusters apparent in the western regions. Conversely, the spatial autocorrelation of average payments exhibited a modest value of 0.14 in 2023, with a slight increase to 0.19 in 2024, indicating the formation of low-value clusters in southern Poland.
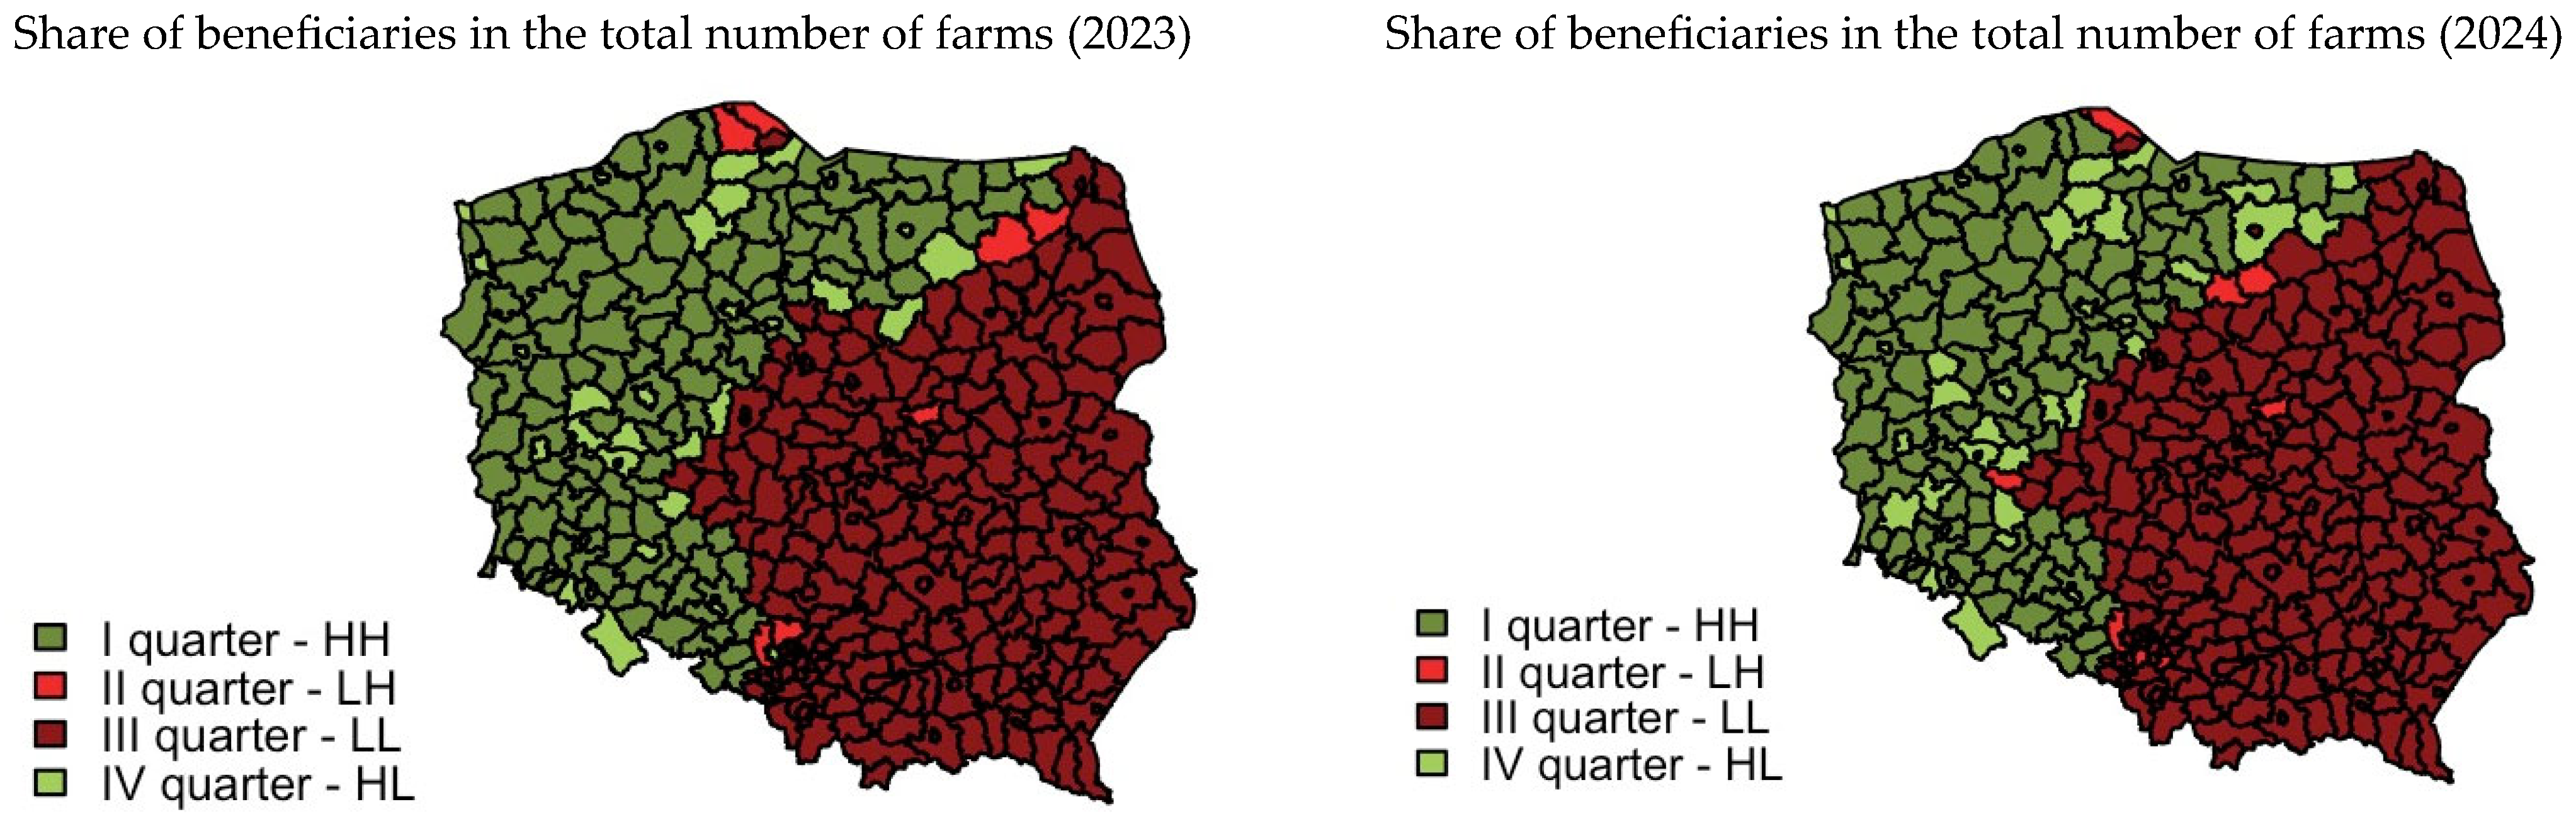
In the case of the largest farms, exceeding 100 ha (see
Figure 6), the spatial autocorrelation of beneficiary distribution demonstrated a notably strong correlation (0.63 in 2023, 0.54 in 2024). This observation highlights a distinct spatial regime characterised by high-value clusters situated in western Poland, in contrast to low-value clusters located in the eastern regions. Furthermore, the spatial autocorrelation of average payments, while relatively low, remained statistically significant (0.21 in 2023 and 0.26 in 2024), thereby indicating the existence of low-value clusters in the south-eastern region of Poland.
The analysis reveals that uptake clustering tends to increase with the size of the farm, indicating that larger farms demonstrate a greater regional concentration with respect to the adoption of eco-schemes in carbon farming, potentially reflecting the spatial distribution characteristic of farms in Poland. In contrast, payment clustering exhibits an inverse trend, diminishing as farm size increases. It is noteworthy that the strongest spatial dependency with regard to payment amounts is observed among the smallest farms, signifying a more localised spatial regime. Furthermore, an inverse relationship exists between uptake and payment spatial regimes: smaller farms exhibit more spatial structures in payments relative to uptake, whereas larger farms display the opposite pattern. These findings imply that diverse policy drivers and spatial mechanisms are influencing the adoption of eco-schemes in a manner distinct from the magnitude of financial benefits across different farm scales.
5.2. Spatial Correlation Between Farm Size and Payment Levels
Considering the emerging spatial patterns, we delved deeper into the connection between farm size and payment amounts by utilising the GSCI for 2023 and 2024 (see
Table 3). This approach enabled us to assess the extent of spatial co-dependence between these two factors throughout all Polish counties, offering a further understanding of how the spatial arrangement of farm sizes may influence or relate to the spatial distribution of support under carbon farming.
The spatial cross-correlation results in
Table 3 reveal that for both 2023 and 2024, the global spatial cross-correlation index is statistically significant (
p-value = 0.00). This indicates a correlation between total farm area and payments under the eco-scheme on carbon farming, as well as spatial clustering. In 2023, the GSCI value stands at 0.096, with a Pearson correlation of 0.983, suggesting that approximately 9.8% of the total correlation between these variables is due to spatial relationships. Likewise, in 2024, this spatial contribution slightly rises to 11.5% (GSCI = 0.102, Pearson correlation = 0.884). This suggests that while the overall linear correlation declines slightly over time, spatial dependence increasingly influences this relationship. The cross-correlation effect, representing the portion of Pearson correlation not explained by spatial dependence, remains dominant in both years—at 88.5% in 2023 and 87% in 2024. This highlights that temporal or non-spatial factors are more significant in the observed correlation between farm area and payments. These findings support the idea that while spatial effects are meaningful, broader systemic or policy-driven influences are more critical. However, the rise in the spatial share from 2023 to 2024 may indicate emerging localised patterns or more spatially targeted policy adjustments.
5.3. Differences in Agricultural Structure and Rural Characteristics Across Counties with Varying Support Levels
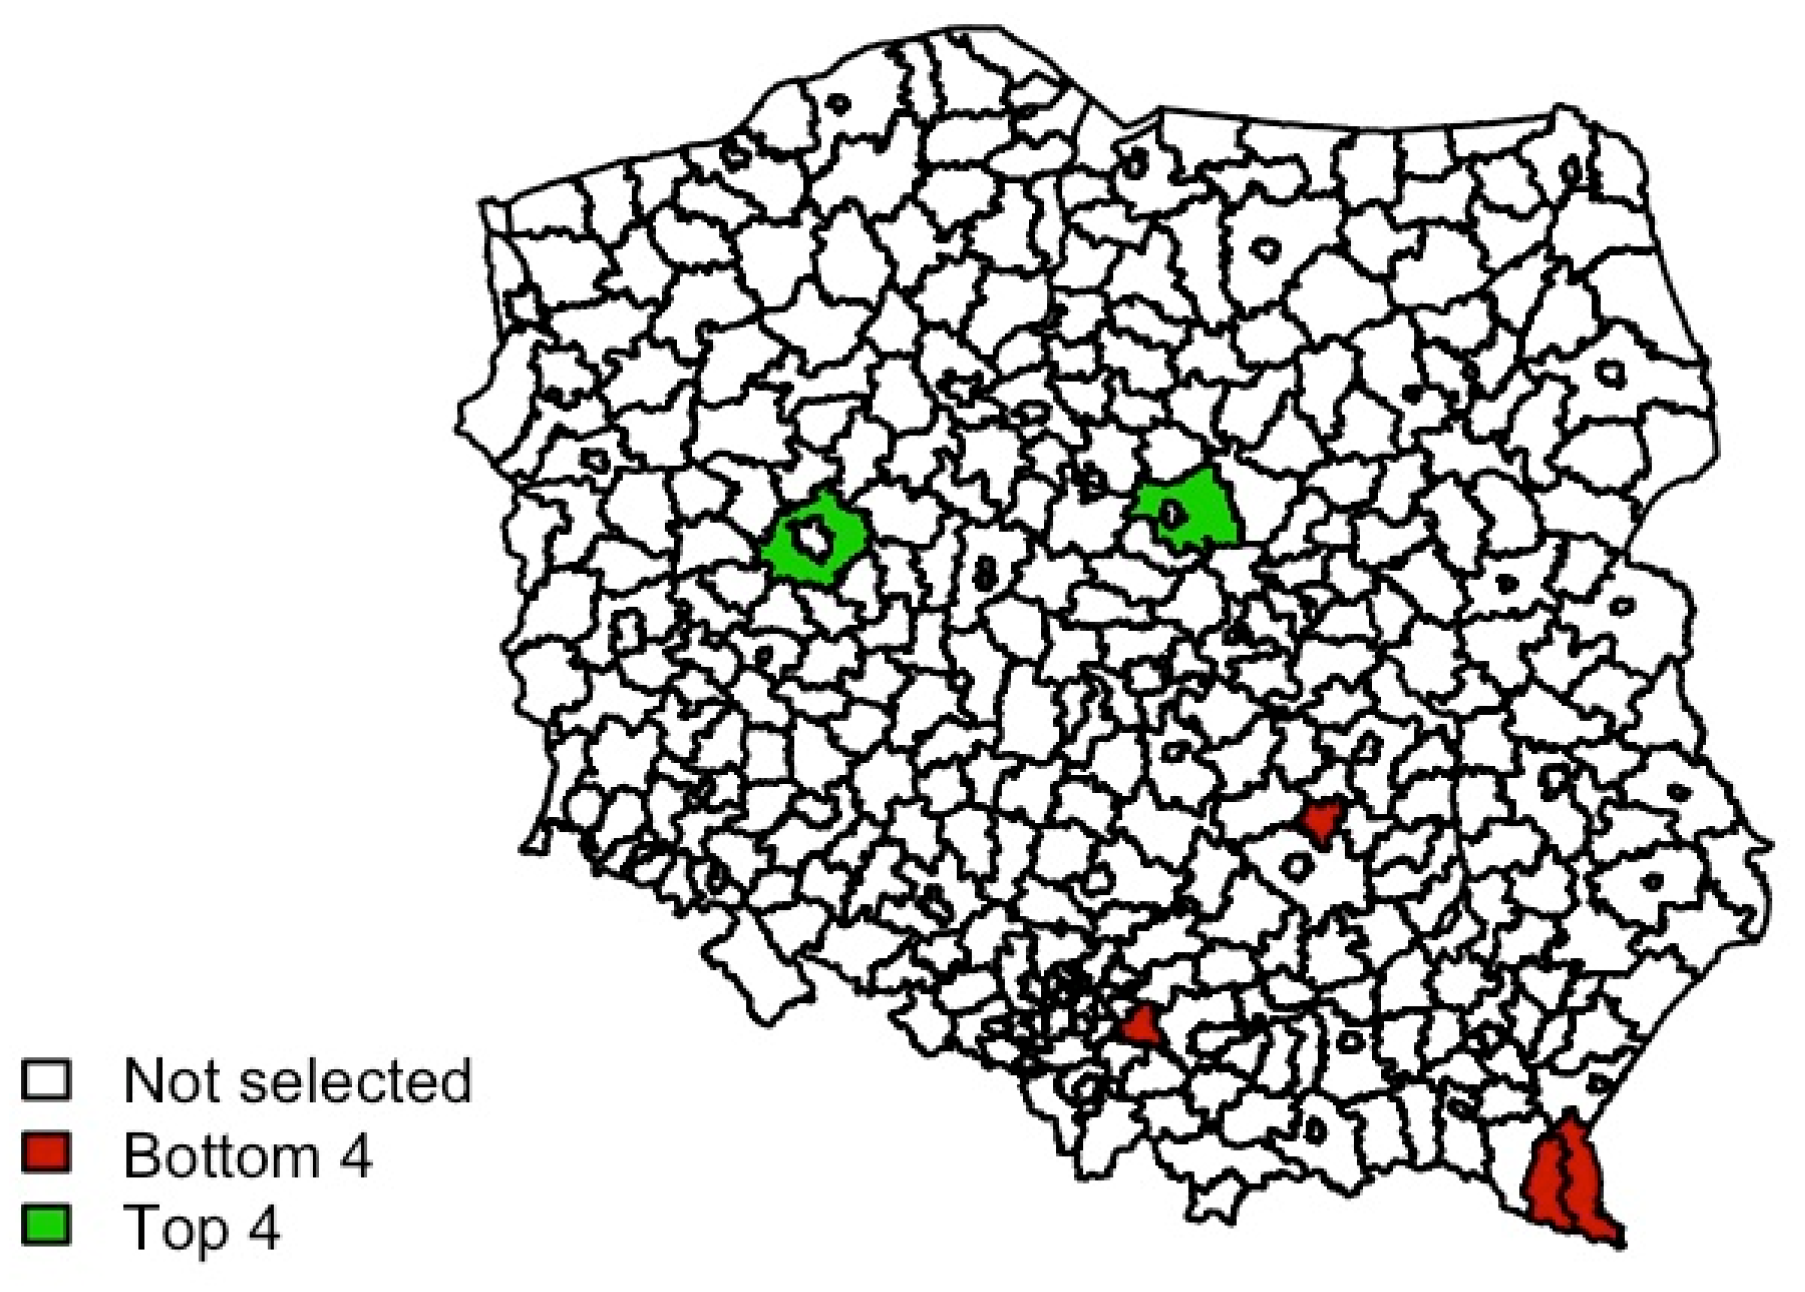
In the final stage of the analysis, we examined the best- and worst-performing counties in terms of the number of beneficiaries, total farm area, and total payment amounts (see
Figure 7 and
Table 4 and
Table 5). This case-based approach enabled a deeper interpretation of spatial patterns and helped identify outliers in the dataset.
A detailed comparison between the best- and worst-performing counties in terms of agricultural payments, farm area, and number of beneficiaries reveals a clear divide shaped by both structural and socio-economic factors. The worst-performing counties (skarżyski, chrzanowski, leski, and bieszczadzki) are all located in the less agriculturally developed voivodeships of south-eastern and central Poland. These areas exhibit low numbers of producers (ranging from 51 to 70 in both years), small total farm areas (between ~374 and 675 ha in 2024), and very modest total payments on carbon farming, with some counties showing a sharp decline in support—most notably skarżyski and chrzanowski, where payments in 2024 dropped by over 60% compared to 2023.
These counties are characterised by dominant low-value farming systems, primarily field crops, grazing livestock, and a significant share of unclassified agricultural activity. The economic potential of farms is extremely limited—over 60% of producers in these counties belong to the lowest economic class (less than EUR 2000 SO). This reflects a highly fragmented agrarian structure and low market orientation. Additionally, these counties fall within rural typologies, such as rural areas with dispersed agriculture and multiple sources of income or urbanised rural areas with reduced agriculture, suggesting marginalisation in terms of agricultural function and a dependence on non-farm income sources.
In contrast, the best-performing counties (poznański, płocki, bialski and lubelski) are spread across agriculturally strong regions, primarily in central and eastern Poland. These counties report vastly higher numbers of producers (over 2000 and up to 6300), significantly larger agricultural areas (between 69,000 and 101,000 ha in total in 2024), and the highest payment on carbon farming, although some also experienced a drop in total payments (e.g., poznański). Farming systems in these counties are specialised and market-oriented, with a dominance of field crops and a more balanced inclusion of mixed and livestock farming. Economic class structures are significantly more varied, lacking a dominant class. From the perspective of a socio-economic development typology, the aforementioned leading counties are situated within more functionally dynamic rural regions, which include multifunctional rural areas characterised by a balance of sectors, highly urbanised rural areas, or regions predominantly dedicated to traditional agriculture.
6. Discussion
Eco-schemes designed to achieve climate and environmental objectives are a vital part of the EU’s new and improved green agricultural policy. This policy aims to promote agriculture in the EU that is sustainable economically, socially, and environmentally. Eco-schemes account for one-quarter of the total allocation for direct payments, highlighting their importance in fostering sustainable agricultural practices in Europe [
60]. Carbon farming and other proposed eco-schemes form a key element of the new reform of the EU CAP 2023–2027 and the implementation of EU strategies under the European Green Deal (the Farm to Fork and Biodiversity strategies) [
48]. Our study showed that carbon farming turned out to be the relatively most popular instrument among all the eco-schemes implemented under the CAP in Poland during the analysed period. This eco-scheme involved the implementation of eight environmentally and climate-friendly farming practices, which provide compensation for incurred costs and rewards for generating public goods like carbon sequestration [
29]. This mechanism was originally designed as a response to growing consumer expectations for agricultural policy to promote healthier and more environmentally, climate-friendly, and sustainable agriculture [
1,
6].
However, from the beginning of the implementation process of this instrument—intended to encourage voluntary but above-standard actions on farms—a number of controversies and practical difficulties have been faced. In the first two years of their perpetration (2023 and 2024), only a third of the total number of farms in Poland (around 390 thousand) used them. The new CAP proposal, which includes eco-schemes, has faced criticism from farmers not only in Poland but also across other EU countries [
61]. Regardless of the various reasons for protest, the limited adoption of these instruments could be attributed to political factors, including farmers’ resistance to new tighter solutions with greater environmental ambitions and errors in their creation and implementation at both the EU and member state levels [
62]. The eco-schemes, along with other new components of the revised agricultural policy, were often perceived not as voluntary environmental solutions intended to improve farming conditions and the natural environment but as measures leading to income reductions and the next set of complex and burdensome administrative obligations, often described as an ‘iron cage’ of bureaucracy imposed on beneficiaries [
63].
Comparative insights from other EU countries reinforce the need to revise the approach to eco-shemes. As highlighted in a recent cross-country analysis by BirdLife and NABU [
64], the uptake and effectiveness of eco-schemes vary significantly across EU member states. In countries such as Spain or the Netherlands, nutrient management and carbon farming schemes recorded high levels of adoption—often surpassing 100% of planned areas. However, many of these schemes supported practices that were already widespread, resulting in limited additional environmental value. Similarly, in the Netherlands, the popularity of simple measures with a low environmental impact reflects a menu-based approach geared toward maximizing farmer participation. Conversely, biodiversity-oriented measures, like flower strips or landscape elements, although ecologically ambitious, faced low uptake due to their complexity and insufficient financial incentives. Poland demonstrates a similar pattern, where more demanding practices—despite their ecological potential—attracted fewer applicants. This evidence supports the argument that one-size-fits-all support mechanisms are suboptimal. Regionally differentiated eco-schemes, including tiered payments or region-specific practice menus, are increasingly recommended to better reflect agricultural realities.
Nevertheless, it is essential to interpret the effectiveness and reception of eco-schemes and the entire new CAP framework (including new conditionality standards, which tied the payment of direct subsidies to the fulfilment of specific requirements) not only in light of their design and implementation features, but also within the broader macroeconomic and geopolitical context. The scepticism toward eco-schemes and the broader CAP reform package, particularly the new conditionality rules linking direct payments to environmental compliance, was significantly reinforced by concurrent external shocks. These included the economic and political repercussions of Russia’s aggression against Ukraine, as well as the deterioration of global agri-food markets, both of which substantially undermined farm income and production profitability. In such conditions, farmers’ willingness to engage in new, often complex environmental schemes diminished further, regardless of their potential long-term benefits [
65,
66].
Although it is important to consider the general effects of political, administrative, and market conditions on the implementation of carbon farming eco-schemes, our analysis shows that in Poland, persistent spatial and structural factors at the local and regional level had an impact on this process as well. Among these structural determinants, the differentiated agrarian structure and the varying farm sizes, reflecting their economic potential, were of importance. Firstly, our analysis showed that uptake clustering tends to increase with the size of the farm, indicating that larger farms demonstrated a greater regional concentration with respect to the adoption of eco-schemes in carbon farming, potentially reflecting the spatial distribution characteristic of farms in Poland. The use of carbon farming eco-schemes was greater in the counties of western, northern, and south-western Poland—regions characterized by developed commodity agriculture and more concentrated agricultural structures [
67]. In both years analysed (2023 and 2024), the observed spatial pattern showing greater participation in eco-schemes of group of larger farms did not change over time.
Secondly, in the analysis, an inverse relationship between uptake and payment spatial regimes was noted. In other words, the smaller farms exhibit more spatial structure in payments relative to uptake, whereas larger farms display the opposite pattern. Larger eco-scheme payments were generally received by small farms located in northern Poland compared to those in the south, which may indicate differences in the number of eco-schemes per farm. This trend is associated with the relatively lower significance of commodity agricultural production and farming activities for farm users in southern Poland [
68].
Using the spatial cross-correlation, a strong, positive, and statistically significant relationship between farm size and the amount of support under carbon farming eco-schemes was confirmed. This observation was in line with other studies [
69]. Nonetheless, the spatial effect for the correlation considered was relatively low, increasing from 9.8% to 11.5% in 2023–2024, indicating the importance of other determinants. In general, larger farms benefited more from carbon farming eco-schemes due to implementing more practices. However, the limited scale of use suggests that eco-schemes should be designed to be straightforward and tailored to the requirements of both larger and smaller farms. The case-based approach implemented in this paper enabled a deeper interpretation of spatial patterns and helped identify outliers in the dataset. A detailed comparison between the best- and worst-performing counties in terms of agricultural payments, farm area, and number of beneficiaries of carbon farming eco-schemes revealed a clear spatial divide shaped by both structural and socio-economic factors. In the case of small farms located in the eastern and particularly in south-eastern regions of Poland, the design, availability, and scale of support for carbon farming eco-schemes should consider the unique characteristics of agriculture in these areas. Often, this farming is not-marked oriented and constrained by natural conditions. While it is essential to meet EU climate and environmental objectives, the proposed support should also reflect a demand for the greater regionalisation of these payments (while not making it more complex) as well as offer more training and information activities for their users [
37,
70]. Better regionalised and tailored carbon farming eco-schemes to address different productions systems, agrarian structures, and natural constrains based on collaboration at different levels (farmers, advisors, central and regional authorities) could increase farmer and societal acceptance for this CAP support [
71,
72].
7. Conclusions
Eco-schemes, introduced under the CAP 2023–2027, constitute a modern tool supporting farmers in the adoption of environmentally and climate-friendly practices. It is estimated that only one-third of all farms in Poland benefited from eco-schemes, and the level of participation varied regionally. The relatively low and spatially varied interest in eco-schemes (including carbon farming practices) among Polish farmers during the initial phase of their implementation was due to complex factors. These were primarily related to the fragmented agrarian structure and diverse natural conditions for conducting agricultural activity.
It should be emphasised that the implementation of eco-schemes, including their components, such as carbon farming, posed a challenge for public institutions responsible for managing and executing the CAP in Poland (e.g., the Ministry of Agriculture and the paying agency), as these were new policy instruments. The process of designing and promoting eco-schemes (developing and disseminating the assumptions), followed by their implementation (creating an appropriate organisational system, including regulations and procedures) at the national level, progressed at a fast pace, dictated by legislative delays at the EU institutional level. Consequently, implementing eco-schemes required numerous actions and adjustments on the part of public administration bodies.
Our study of spatial patterns of uptake and payment distribution under the eco-scheme “Carbon farming and nutrient management” in Poland in 2023 and 2024 revealed significant regional differences in both the structure of beneficiaries and the distribution of payments, with the size of farms having a clear influence on these patterns. An analysis conducted at the county level using the Moran’s I statistic showed that the larger the farm, the more pronounced the spatial concentration of both the number of beneficiaries and the amount of payments. The largest farms (over 100 ha) demonstrated strong concentration in the western regions of Poland, while the smallest farms (under 15 ha) showed more localised clustering, particularly in northern Poland.
An added value of the analysis was the consideration of differences in the spatial structure of payments. The results showed that small farms exhibited a higher spatial correlation regarding payment amounts, whereas larger farms had a less distinct concentration of payments. This phenomenon may result from different agricultural policy mechanisms that affect small and large farms in various ways.
This study also revealed differences between the best- and worst-performing counties. The best results were recorded in regions with high agricultural potential, such as poznański county or płocki county, characterised by large agricultural areas and diverse farming systems. In contrast, the worst results were observed in counties with less developed agriculture, such as skarżyski county or chrzanowski county, where smaller, less diversified farms with low agricultural income predominated.
This research highlighted the significant role of spatial and economic factors, particularly farm size, in the implementation of eco-schemes in Poland. Our study was preliminary, and further in-depth analyses are needed to better understand how these factors interact, using varied data and research methods.
The relevance of this research is further underscored by the specific nature of eco-schemes—while participation is voluntary for farmers and implementation is mandatory for member states. As such, the design and scope of eco-schemes reflect each country’s adopted “green strategy”. Member states are obliged to evaluate the effectiveness of their environmental and climate-related measures, making analytical studies like this particularly valuable. They offer critical insights into the actual uptake and perceived relevance of interventions such as carbon farming eco-schemes, thereby supporting evidence-based assessments of policy rationale.
Collaboration between public administration and the scientific community is crucial for the effective implementation of eco-schemes. Thanks to scientific research, it is possible to monitor the effects of these practices, identify the best solutions, and adapt agricultural policies to evolving environmental and social challenges.
Author Contributions
Conceptualization, A.R. and A.P.; methodology, A.R. and A.P.; software, A.P.; validation, A.R. and A.P.; formal analysis, A.R. and A.P.; investigation, A.R., A.P., and M.D.; resources, A.R., A.P., and M.D.; data curation, A.R. and A.P.; writing—original draft preparation, A.R., A.P., and M.D.; writing—review and editing, A.R., A.P., and M.D.; visualisation, A.R., A.P. and M.D.; supervision, A.R., A.P., and M.D.; project administration, A.R.; funding acquisition, A.R. All authors have read and agreed to the published version of the manuscript.
Funding
This research received no external funding.
Institutional Review Board Statement
Not applicable.
Informed Consent Statement
Not applicable.
Data Availability Statement
The data presented in this study are available on request from the corresponding author due to restrictions imposed by the Agency for Restructuring and Modernisation of Agriculture, as the data are not publicly available.
Conflicts of Interest
The authors declare no conflicts of interest.
Appendix A
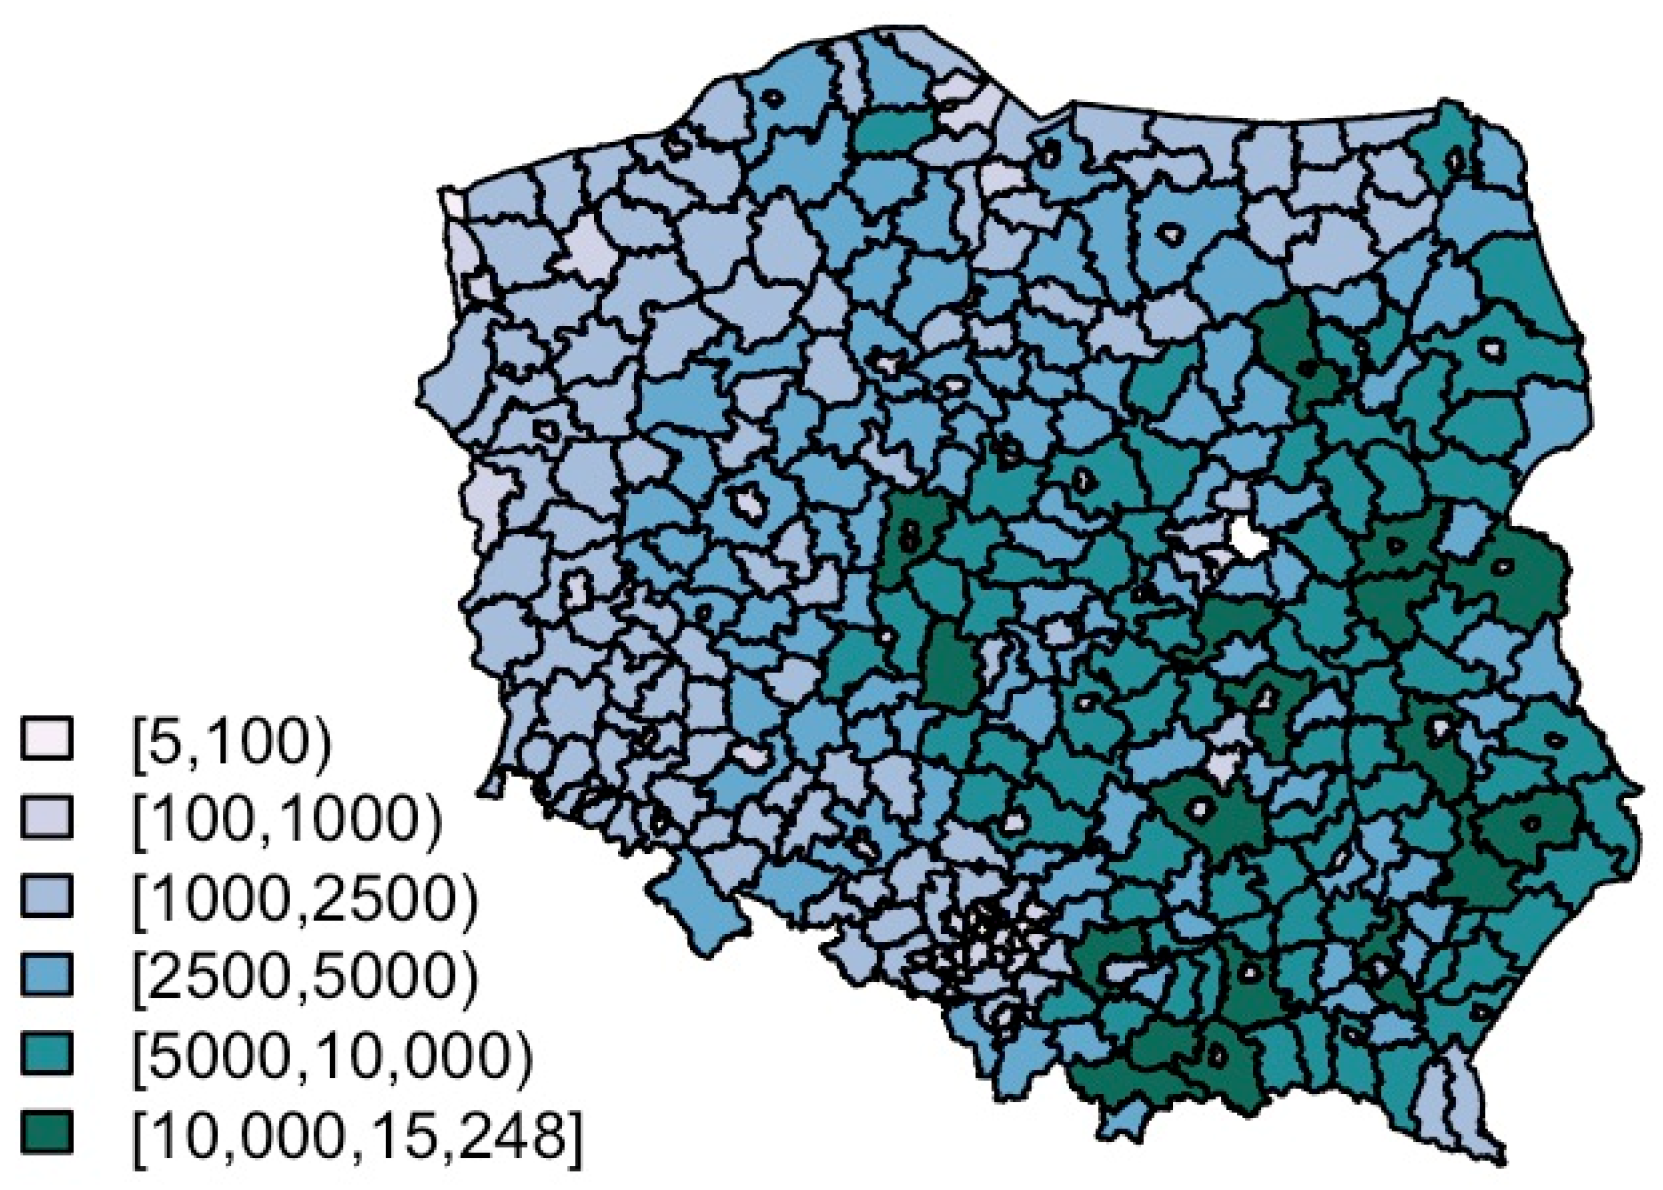
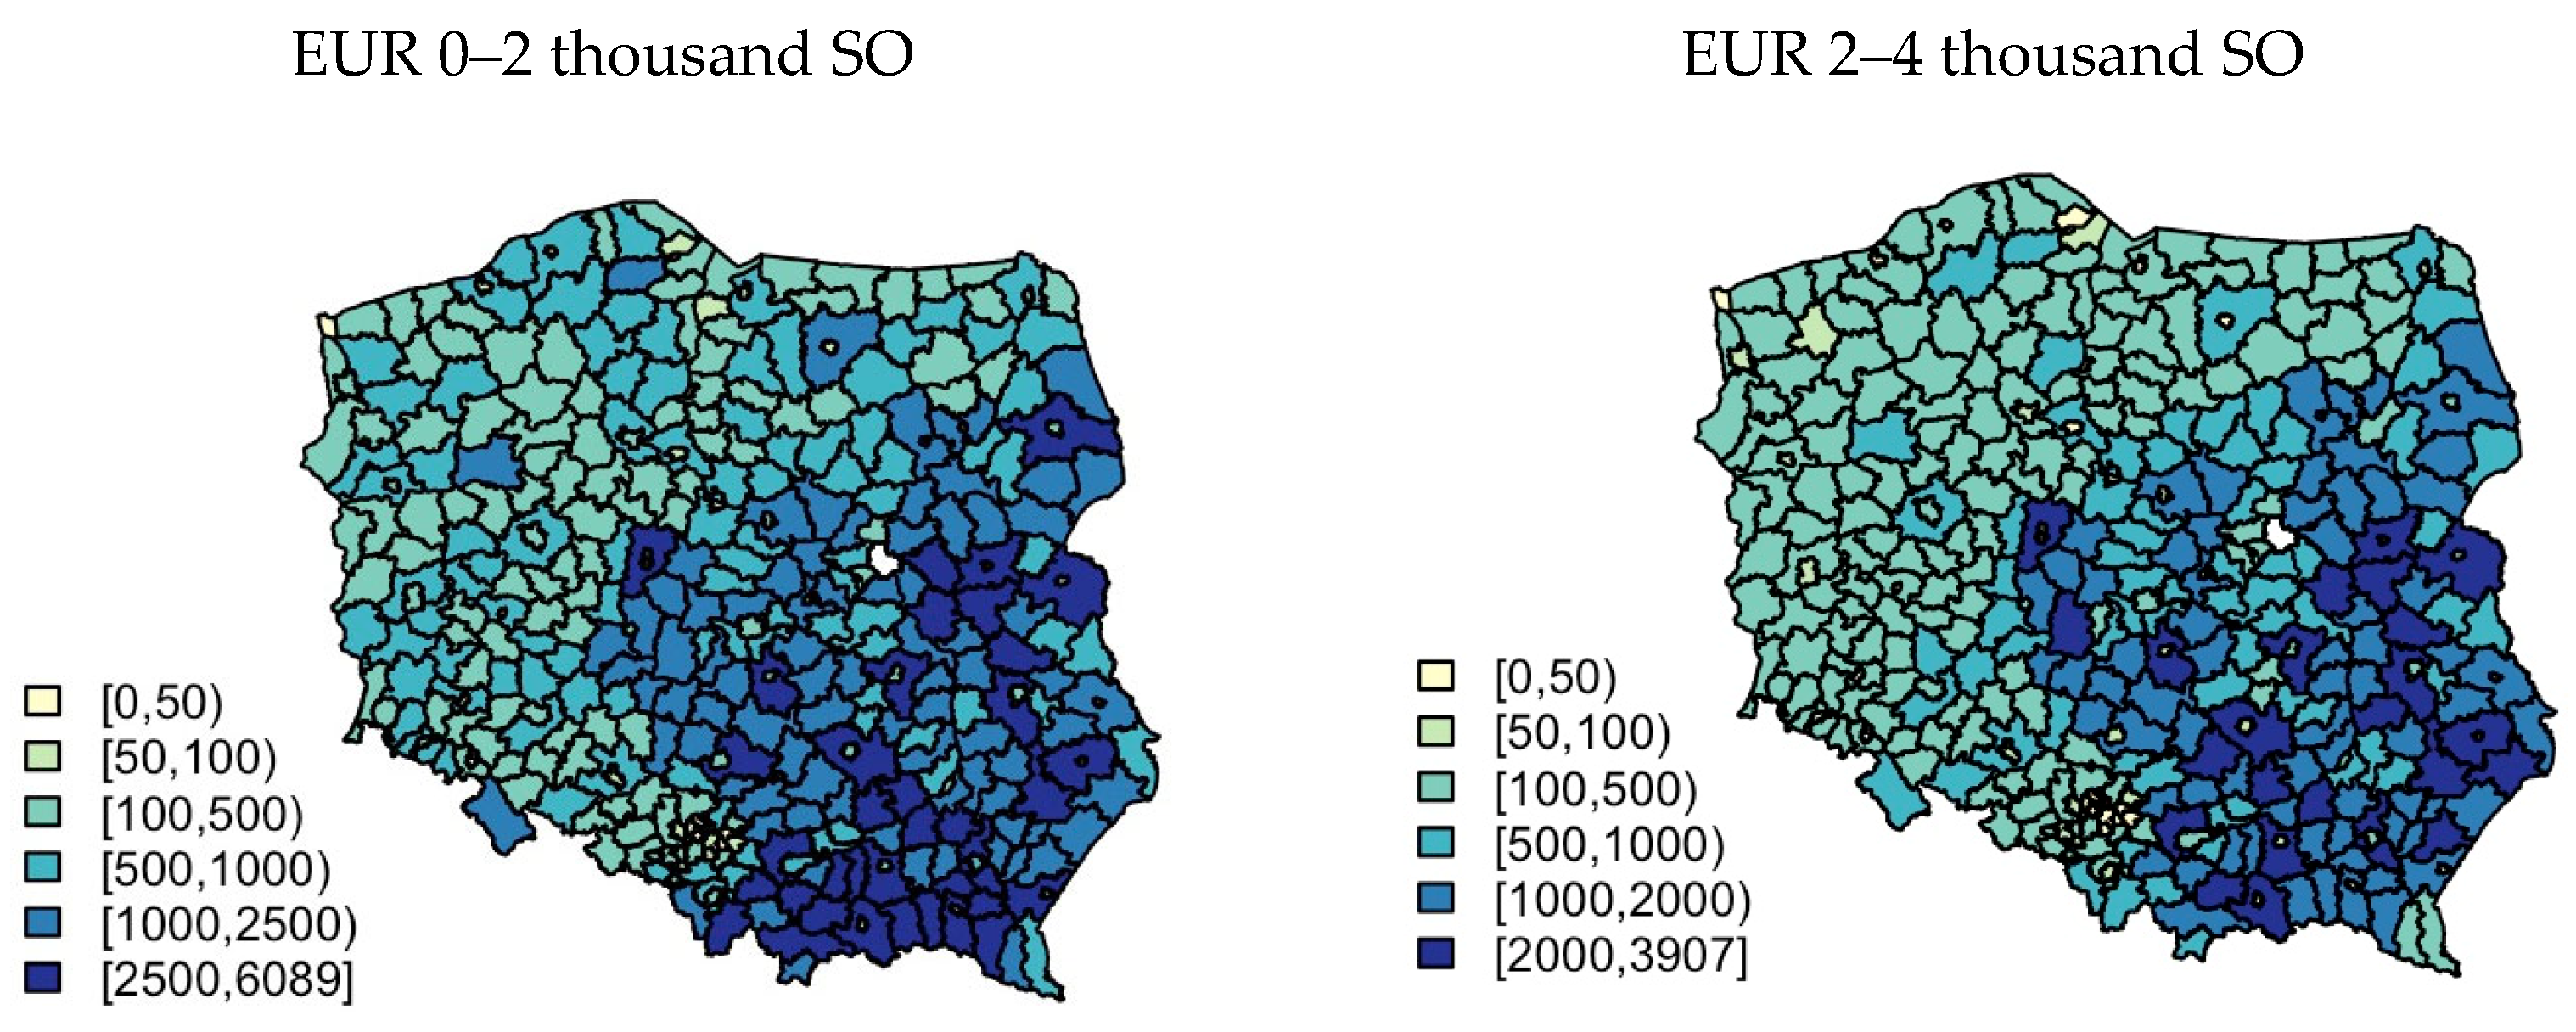
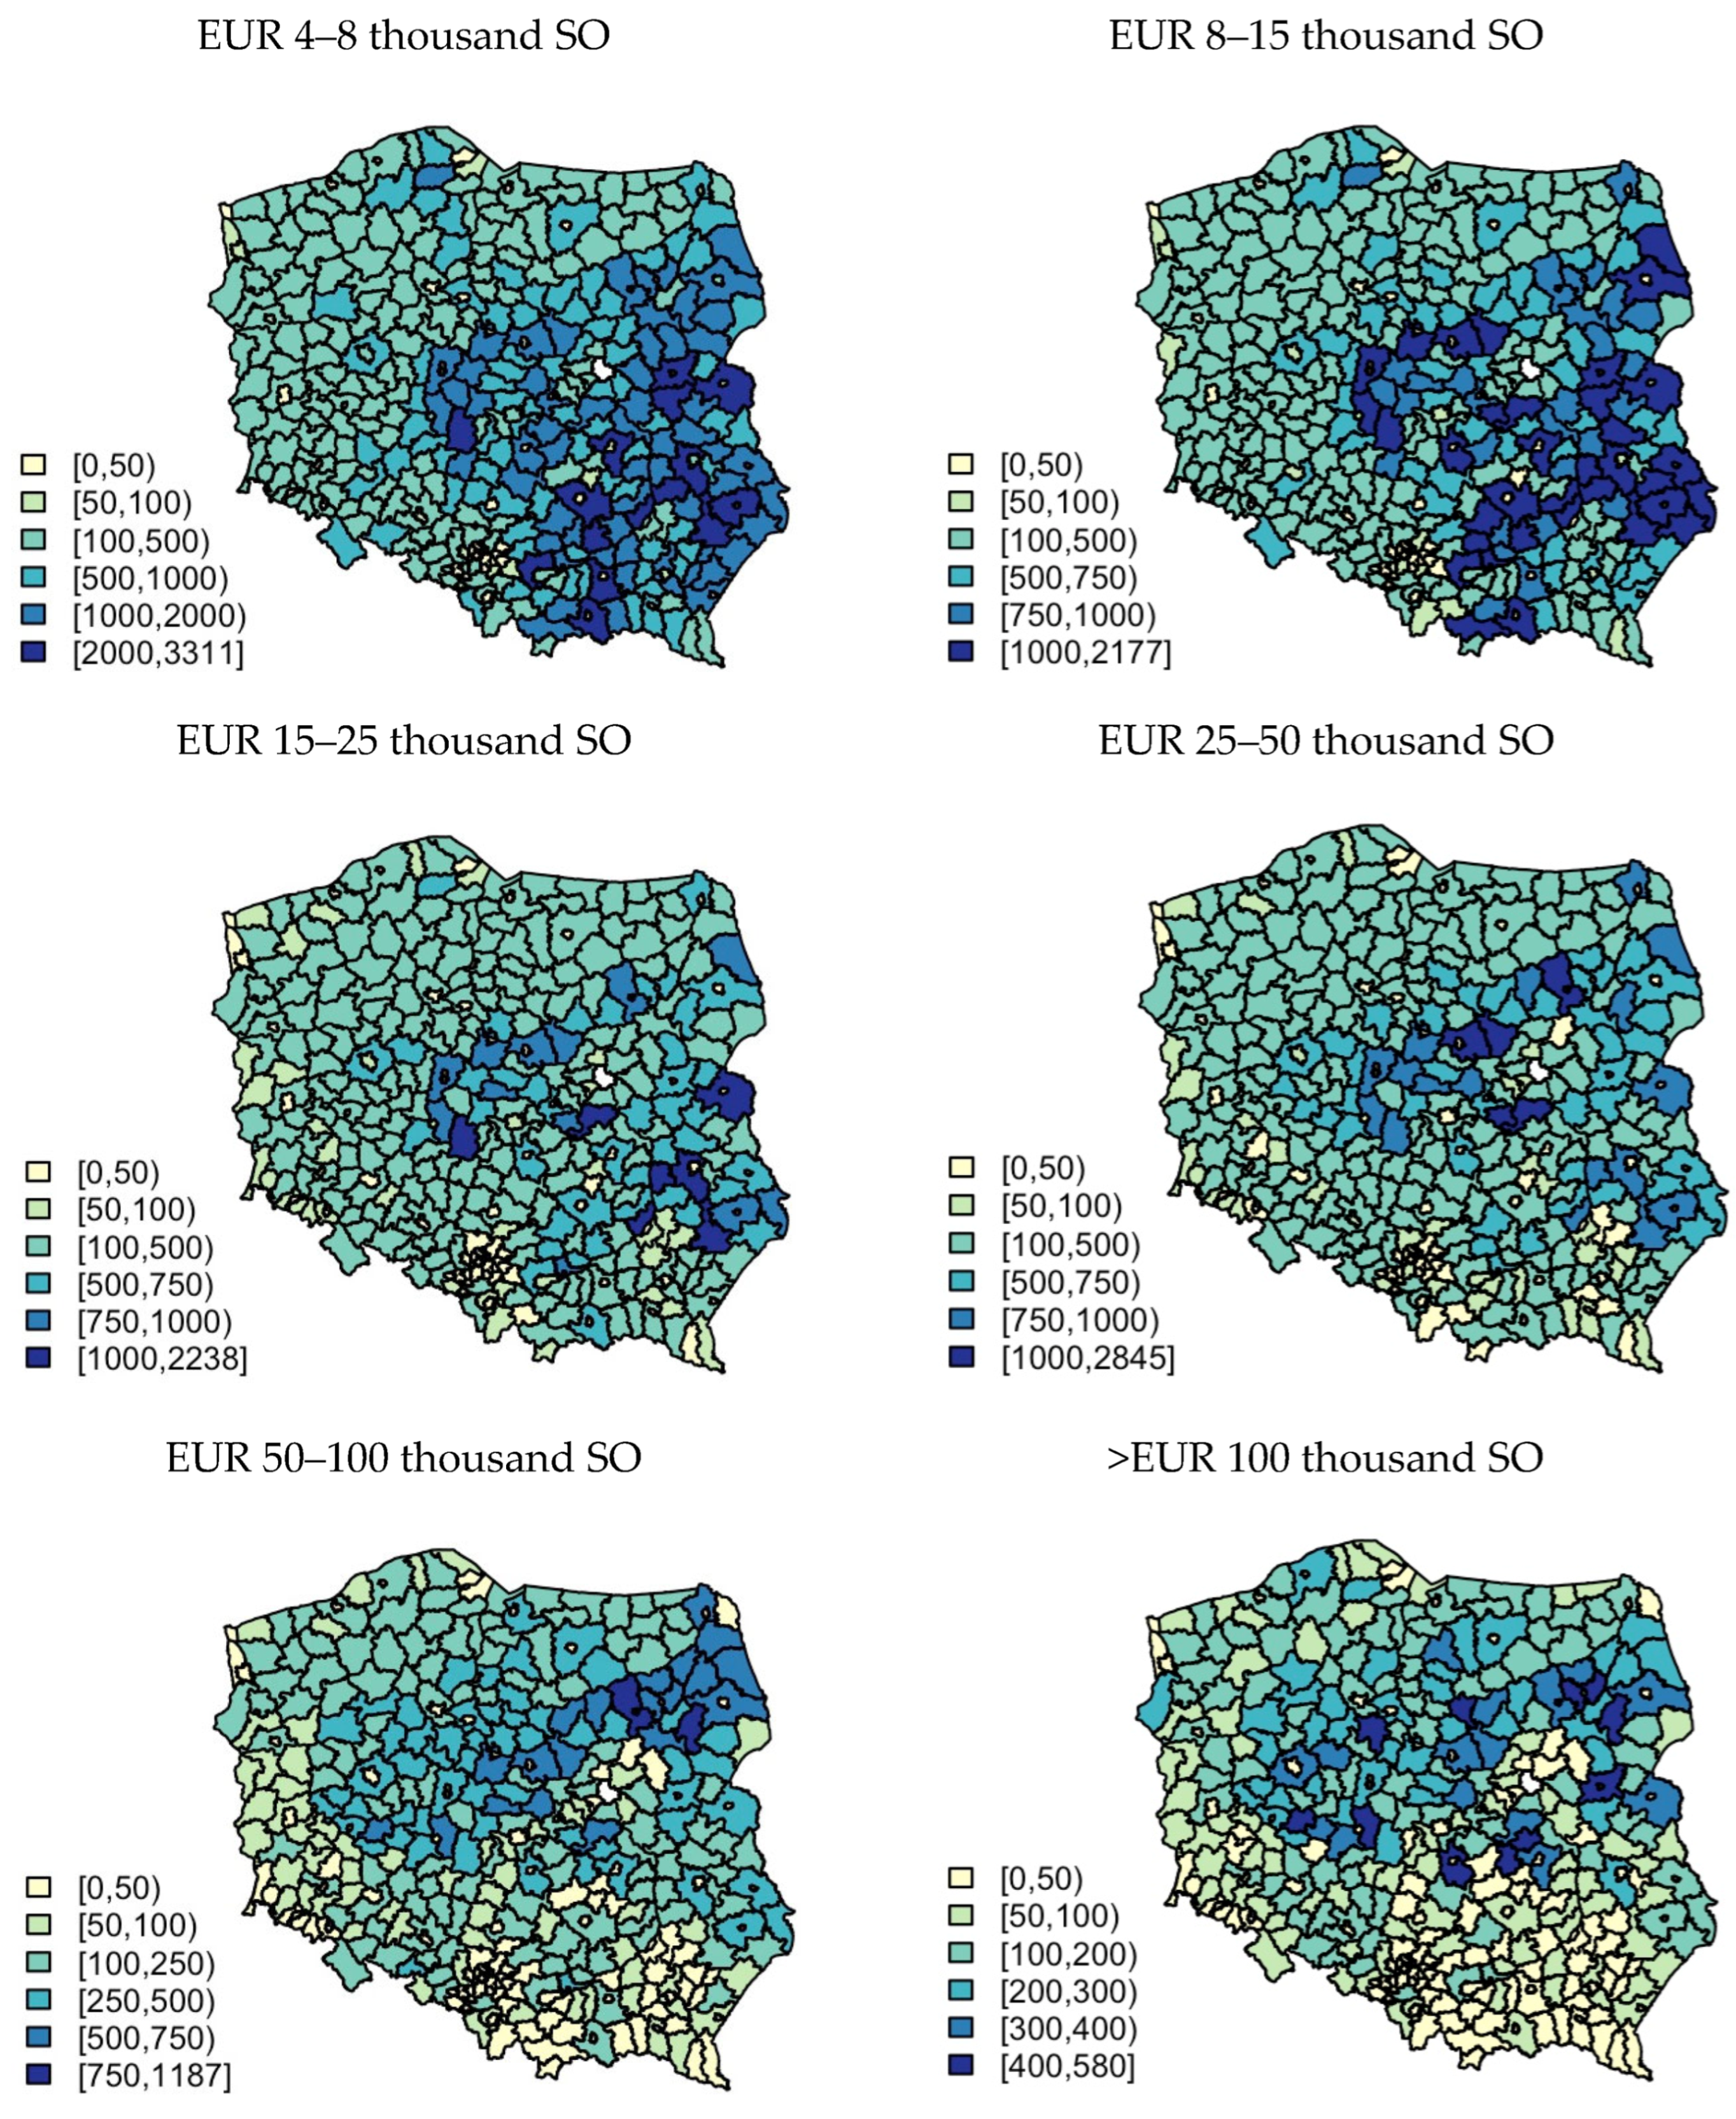
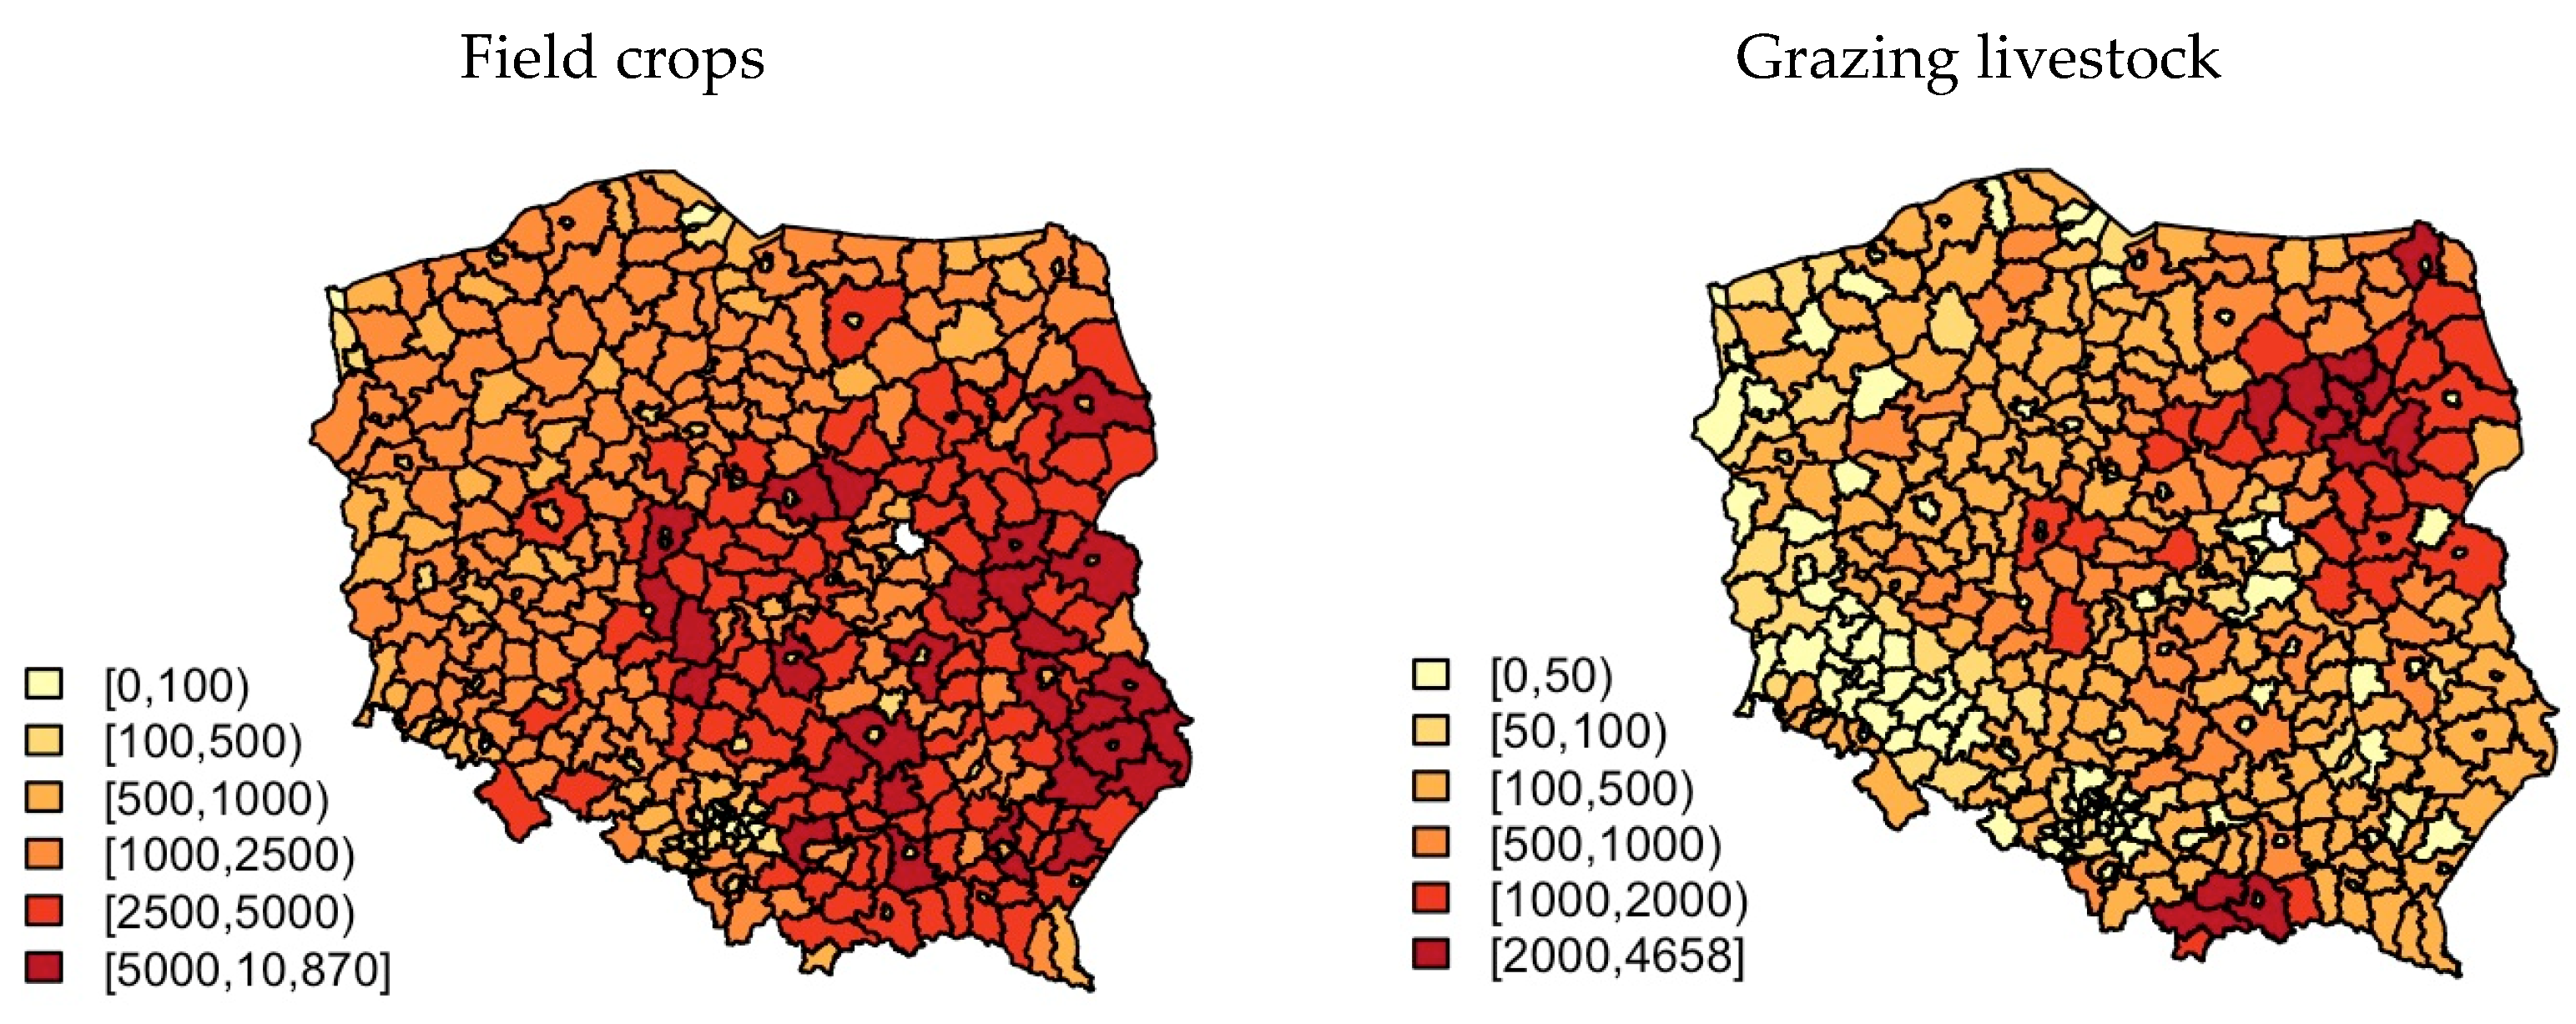
To provide a more comprehensive context for the interpretation of spatial patterns observed in the results, the following figures present additional structural characteristics of agriculture at the county level. Specifically, they illustrate the total number of farms (
Figure A1), the number of farms by economic size class (
Figure A2), the number of farms by type of farming (
Figure A3), the number of beneficiaries of the carbon farming eco-scheme (
Figure A4), the total area covered by the carbon farming eco-scheme (
Figure A5), and the total payment for the carbon farming eco-scheme (
Figure A6). These indicators help to better contextualise the variability in the uptake of the eco-scheme by reflecting the diversity of farming structures and production profiles across regions.
Figure A1.
Number of farms in 2020.
Figure A1.
Number of farms in 2020.
Figure A2.
Number of farms by economic class size in 2020.
Figure A2.
Number of farms by economic class size in 2020.
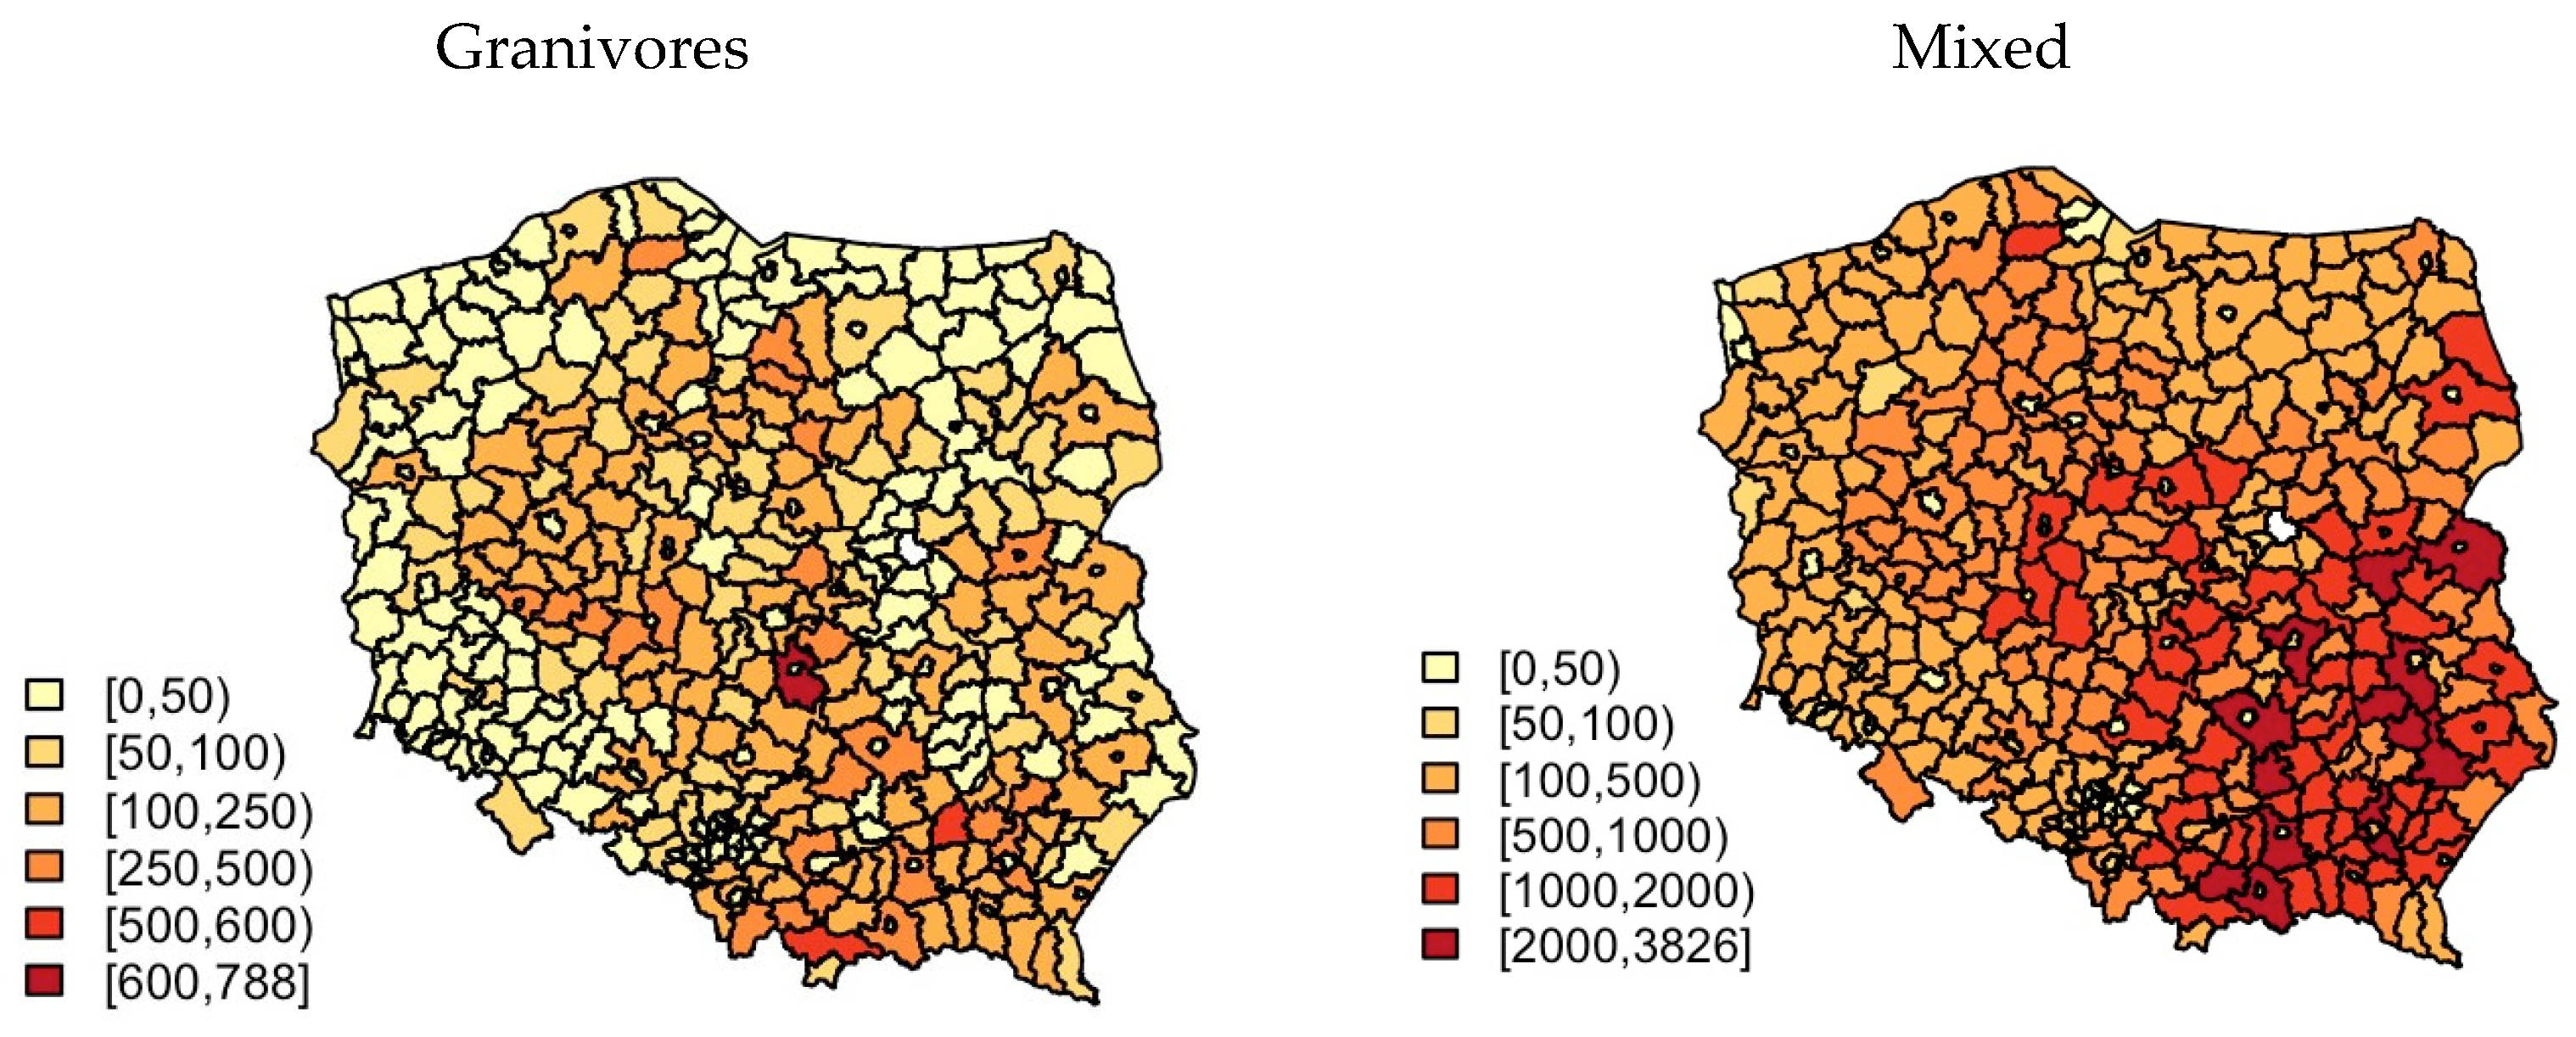
Figure A3.
Number of farms by type of farming in 2020.
Figure A3.
Number of farms by type of farming in 2020.
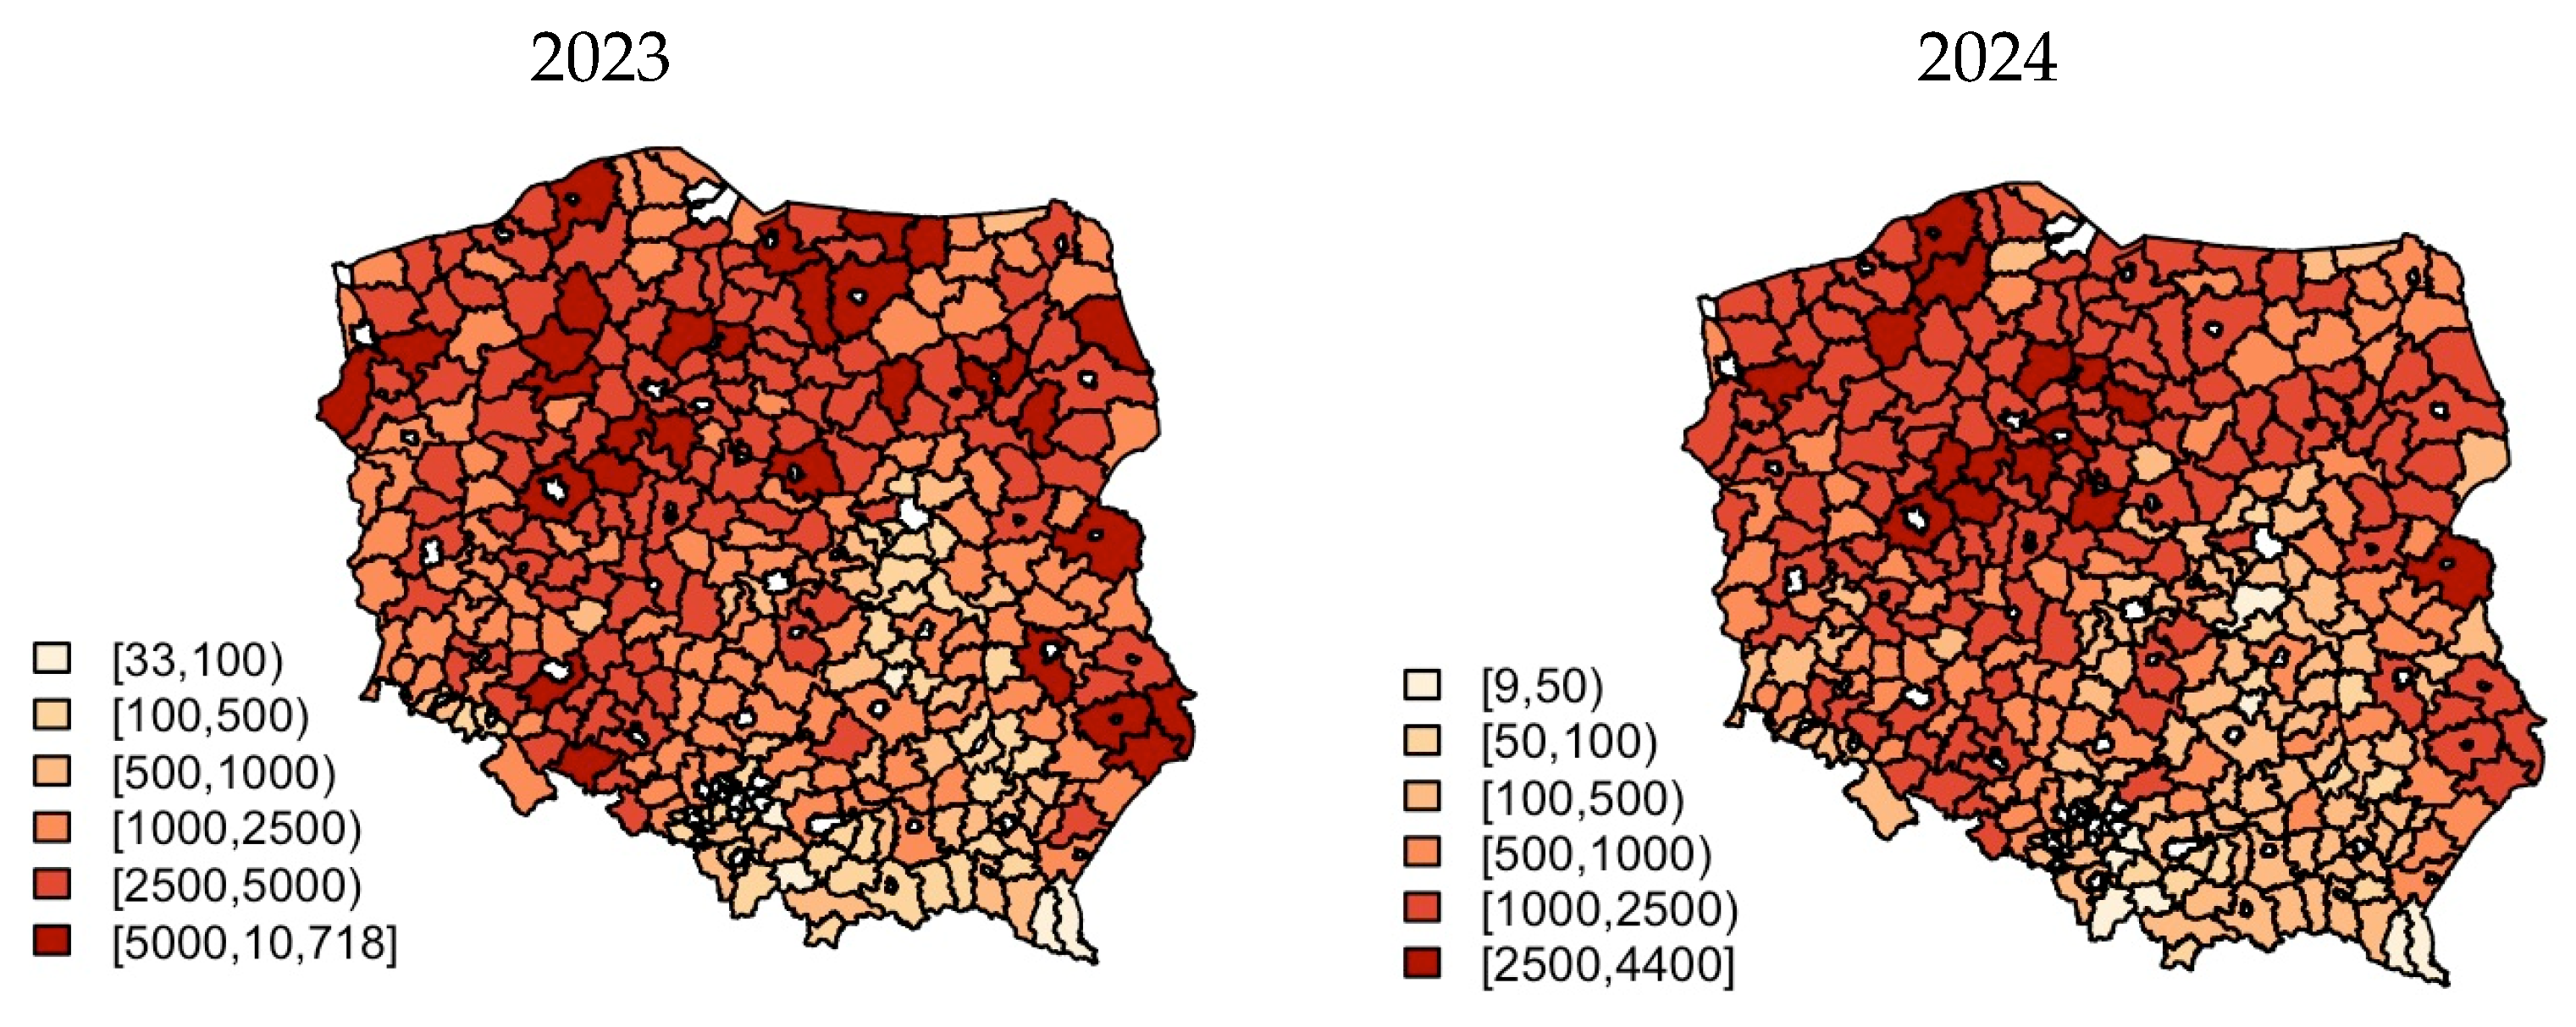
Figure A4.
Number of beneficiaries of the carbon farming eco-scheme.
Figure A4.
Number of beneficiaries of the carbon farming eco-scheme.
Figure A5.
Total area covered by the carbon farming eco-scheme [in ha].
Figure A5.
Total area covered by the carbon farming eco-scheme [in ha].
Figure A6.
Total payment for the carbon farming eco-scheme [in EUR thousands].
Figure A6.
Total payment for the carbon farming eco-scheme [in EUR thousands].
References
- Zegar, J.S.; Wrzaszcz, W. The holism principle in agriculture sustainable development. Econ. Environ. Stud. 2017, 17, 1051–1069. [Google Scholar] [CrossRef]
- Zegar, J.S. Premises of the New Agricultural Economics; Zagadnienia Ekonomiki Rolnej: Warsaw, Poland, 2010. [Google Scholar]
- Dudek, M.; Rosa, A. Regenerative Agriculture as a Sustainable System of Food Production: Concepts, Conditions, Perceptions and Initial Implementations in Poland, Czechia, and Slovakia. Sustainability 2023, 15, 15721. [Google Scholar] [CrossRef]
- IPCC. Land degradation. In Climate Change and Land: An IPCC Special Report on Climate Change, Desertification, Land Degradation, Sustainable Land Management, Food Security, and Greenhouse Gas Fluxes in Terrestrial Ecosystems; Shukla, P.R., Skea, J., Calvo Buendia, E., Masson-Delmotte, V., Pörtner, H.-O., Roberts, D.C., Zhai, P., Slade, R., Connors, S., van Diemen, R., et al., Eds.; IPCC: Geneva, Switzerland, 2019; pp. 345–436. Available online: https://www.ipcc.ch/srccl/cite-report (accessed on 9 March 2025).
- Food and Land Use Coalition (FOLU). Growing Better: Ten Critical Transitions to Transform Food and Land Use. The Global Consultation Report of the Food and Land Use Coalition, FOLU. 2019. Available online: https://www.foodandlandusecoalition.org/wp-content/uploads/2019/09/FOLU-GrowingBetterGlobalReport.pdf (accessed on 11 March 2025).
- Rhodes, C.J. The imperative for regenerative agriculture. Sci. Prog. 2017, 100, 80–129. [Google Scholar] [CrossRef]
- Giller, K.E.; Hijbeek, R.; Andersson, J.A.; Sumberg, J. Regenerative Agriculture: An Agronomic Perspective. Outlook Agric. 2021, 50, 13–25. [Google Scholar] [CrossRef] [PubMed]
- Rosa, A.; Dudek, M.; Siemiński, P.; Sadowski, A.; Bartosik, S.; Kaczmarek, P.; Łata, K.; Markowicz, M.; Petrovic, J.; Dykes, I. Biologization: The Key to Sustainable Agriculture. Catalogue of Good Practices; Institute of Rural and Agricultural Development, Polish Academy of Sciences: Warsaw, Poland, 2022; p. 31. [Google Scholar]
- Stanek, R. Dobre Praktyki Rolnicze W Produkcji Integrowanej Z Zastosowaniem Pożytecznych Mikroorganizmów W Uprawie Buraka; FDPA, MRiRW: Warsaw, Poland, 2012. [Google Scholar]
- European Parliament and Council. Regulation (EU) 2021/2115 of the European Parliament and of the Council of 2 December 2021 Establishing Rules on Support for Strategic Plans to be Drawn up by Member States Under the Common Agricultural Policy (CAP Strategic Plans) and Financed by the European Agricultural Guarantee Fund (EAGF) and by the European Agricultural Fund for Rural Development (EAFRD) and Repealing Regulations (EU) No 1305/2013 and (EU) No 1307/2013. Off. J. Eur. Union 2021. Available online: https://eur-lex.europa.eu/legal-content/EN/TXT/PDF/?uri=CELEX:32021R2115 (accessed on 11 March 2025).
- Komisja Europejska. Zatwierdzono 28 planów strategicznych WPR (2023–2027). Available online: https://agriculture.ec.europa.eu/document/download/7b3a0485-c335-4e1b-a53a-9fe3733ca48f_en?filename=approved-28-cap-strategic-plans-2023-27.pdf (accessed on 11 January 2025).
- European CAP Network. Eco-Schemes: Background Paper; European Union: Brussels, Belgium, 2023; Available online: https://eu-cap-network.ec.europa.eu/sites/default/files/2023-10/eco-schemes-background-paper.pdf (accessed on 3 April 2025).
- Available online: https://www.gov.pl/web/rolnictwo/programowanie-ps-wpr (accessed on 9 March 2025).
- MRiRW (Ministry of Agriculture and Rural Development). Plan Strategiczny dla Wspólnej Polityki Rolnej na lata 2023–2027 (PS WPR 2023–2027), Warsaw, Poland. 2023. Available online: https://www.gov.pl/web/rolnictwo/plan-strategiczny-dla-wspolnej-polityki-rolnej-na-lata--2023-2027 (accessed on 2 February 2025).
- Wieliczko, B. Challenges of European integration–to what extent should the Common Agricultural Policy stay common? Argum. Oeconom. Cracov. 2019, 2, 97–109. [Google Scholar] [CrossRef]
- Strategic Dialogue on the Future of EU Agriculture. A Shared Prospect for Farming and Food in Europe; European Commission: Brussels, Belgium, 2024; Available online: https://agriculture.ec.europa.eu/document/download/171329ff-0f50-4fa5-946f-aea11032172e_en?file-name=strategic-dialogue-report-2024_en.pdf (accessed on 11 March 2025).
- Nistoroiu, B.F.; Privitera, D.; Prahoveanu, Ș.L.; Emek, M.L.; Condeianu, O. Enhancing Agricultural Progress via Sustainable Production and Consumption. Ekon. Poljopriv. 2024, 71, 973–985. [Google Scholar] [CrossRef]
- Oleszko-Kurzyna, B. Rozwój zrównoważony rolnictwa wobec wymogów Unii Europejskiej w zakresie ochrony środowiska. Zesz. Nauk. SGGW Probl. Rol. Świat. 2008, 4, 326–336. [Google Scholar] [CrossRef]
- Turner, S. Koncepcja Zrównoważonego Rozwoju Rolnictwa; ADAS Consulting: Warsaw, Poland, 2000. [Google Scholar]
- Matuszczak, A. Wskaźniki wyników rozwoju: Przesłanki teoretyczne i wnioski o pomiar w regionach UE. Wieś Rol. Rol. Wiej. 2013, 1, 101–119. [Google Scholar] [CrossRef]
- Wilkin, J. Podstawy Strategii Zintegrowanego Rozwoju Rolnictwa I Obszarów Wiejskich W Polsce; Warsaw University Press: Warsaw, Poland, 2003; p. 14. [Google Scholar]
- Stinner, B.R.; Blair, J.M.; Edwards, C.; Lal, R.; Madden, P.; Miller, R.; House, G. Ecological and Agronomic Characteristics of Innovative Cropping Systems. In Sustainable Agricultural Systems, 1st ed.; Stinner, B.R., Blair, J.M., Eds.; CRC Press: Boca Raton, FL, USA, 1990. [Google Scholar] [CrossRef]
- Kutkowska, B. Wdrażanie Koncepcji Zrównoważonego Rozwoju Rolnictwa I Obszarów Wiejskich W Sudetach; Self-Published: Warsaw, Poland, 2007; p. 90. [Google Scholar]
- Leoveanu-Soare, B.E.; Petre, L.I.; Micu, M.M. Social and economic aspects regarding the development of agriculture in Romania. Sci. Pap. Ser. Manag. Econ. Eng. Agric. Rural. Dev. 2020, 20, 281–288. [Google Scholar]
- European Commission. Komunikat Komisji do Parlamentu Europejskiego, Rady, Europejskiego Komitetu Ekonomiczno-Społecznego i Komitetu Regionów. Europejski Zielony Ład. Available online: https://eur-lex.europa.eu/legal-content/EN/TXT/?uri=CELEX%3A52019DC0640&qid=1726910790338 (accessed on 11 March 2025).
- European Commission. Komunikat Komisji do Parlamentu Europejskiego, Rady, Europejskiego Komitetu Ekonomiczno-Społecznego i Komitetu Regionów. Strategia “Od Pola Do Stołu” na Rzecz Sprawiedliwego, Zdrowego i Przyjaznego dla Środowiska Systemu Żywnościowego. Available online: https://eur-lex.europa.eu/legal-content/EN/TXT/?uri=CELEX:52020DC0381 (accessed on 11 March 2025).
- European Commission. Komunikat Komisji do Parlamentu Europejskiego, Rady, Europejskiego Komitetu Ekonomiczno-Społecznego i Komitetu Regionów. Unijna Strategia na Rzecz Bioróżnorodności 2030. Przywracamy Naturę do Naszego Życia. Available online: https://eur-lex.europa.eu/legal-content/EN/TXT/?uri=celex%3A52020DC0380 (accessed on 11 March 2025).
- NOAA; ETH Zurich. Our World in Data. Available online: https://ourworldindata.org (accessed on 10 March 2025).
- Foley, J.A.; Ramankutty, N.; Brauman, K.A.; Cassidy, E.S.; Gerber, J.S.; Johnston, M.; Mueller, N.D.; O’Connel, C.; Ray, D.K.; West, P.C.; et al. Solutions for a cultivated planet. Nature 2011, 478, 337–342. [Google Scholar] [CrossRef] [PubMed]
- Lal, R. Soil carbon sequestration impacts on global climate change and food security. Science 2004, 304, 1623–1627. [Google Scholar] [CrossRef]
- Jarosz, Z.; Faber, A. Praktyki rolnictwa węglowego. Praca przeglądowa. Agron. Sci. 2024, 79, 123–135. [Google Scholar] [CrossRef]
- FAO. The State of Food and Agriculture 2015: Social Protection and Agriculture: Breaking the Cycle of Rural Poverty; Food and Agriculture Organization of the United Nations: Rome, Italy, 2015. [Google Scholar]
- European Commission. Communication from the Commission to the European Parliament and the Council Sustainable Carbon Cycles; COM(2021) 800 final; European Commission: Brussels, Belgium, 2021. [Google Scholar]
- McDonald, H.; Frelih-Larsen, A.; Lóránt, A.; Duin, L.; Pyndt Andersen, S.; Costa, G.; Bradley, H. Study for the Committee on Environment, Public Health and Food Safety (ENVI), Policy Department for Economic, Scientific and Quality of Life Policies. In Carbon Farming–Making Agriculture Fit for 2030; European Parliament: Luxembourg, 2021. [Google Scholar]
- IPCC. Summary for Policymakers. In Global Warming of 1.5 °C. An IPCC Special Report on the Impacts of Global Warming of 1.5 °C Above Pre-Industrial Levels and Related Global Greenhouse Gas Emission Pathways, in the Context of Strengthening the Global Response to the Threat of Climate Change, Sustainable Development, and Efforts to Eradicate Poverty; Cambridge University Press: Cambridge, UK; New York, NY, USA, 2022; pp. 3–24. [Google Scholar] [CrossRef]
- European Commission. Common Agricultural Policy Overview, CAP 2023–2027. Available online: https://agriculture.ec.europa.eu/common-agricultural-policy/cap-overview/cap-2023-27_pl?utm_source=chatgpt.com (accessed on 11 March 2025).
- Zieliński, M.; Józwiak, W.; Żak, A.; Rokicki, T. Development of Eco-Schemes as an Important Environmental Measure in Areas Facing Natural or Other Specific Constraints Under the Common Agriculture Policy 2023–2027: Evidence from Poland. Sustainability 2025, 17, 2781. [Google Scholar] [CrossRef]
- Cagliero, R.; Vassallo, M.; Pierangeli, F.; Pupo D’Andrea, M.R.; Monteleone, A.; Camaioni, B.; Tarangioli, S. The Common Agricultural Policy 2023–2027: How Member States Implement the New Delivery Model? Ital. Rev. Agric. Econ. 2023, 78, 49–66. [Google Scholar] [CrossRef]
- Szymańska, M. Ekoschematy–nowa płatność bezpośrednia (Ecoschema–new direct payment). Tyg. Porad. Rol. 2020, 23, 14. [Google Scholar]
- European Parliament. European Parliamentary Research Service. Guide to EU Funding 2023 Edition; European Parliament: Brussels, Belgium, 2023; Available online: https://www.europarl.europa.eu/thinktank/en/document/EPRS_STU(2023)747110 (accessed on 20 March 2025).
- Latacz-Lohmann, U.; Termansen, M.; Nguyen, C. The New Eco-Schemes: Navigating a Narrow Fairway. EuroChoices 2022, 21, 4–10. [Google Scholar] [CrossRef]
- Styburski, W.; Kozera-Kowalska, M.; Uglis, J. Ecoschemes As A New Tool To Support Agriculture–The State Of Implementation In Poland. Ann. PAAAE 2023, 25, 287–302. [Google Scholar] [CrossRef]
- Włodarczyk, B. Prawne instrumenty ochrony środowiska i przeciwdziałania zmianom klimatu we Wspólnej Polityce Rolnej na lata 2023–2027. Przegląd Prawa Rolnego 2023, 2, 11–26. [Google Scholar] [CrossRef]
- Niewiadomska, A. Krajowy Plan Strategiczny jako instrument prawny rozwoju rolnictwa. Stud. Iurid. 2022, 91, 242–255. [Google Scholar] [CrossRef]
- Petsakos, A.; Ciaian, P.; Espinosa, M.; Perni, A.; Kremmydas, D. Farm-level impacts of the CAP post-2020 reform: A scenario-based analysis. Appl. Econ. Perspect. Policy 2023, 45, 1168–1188. [Google Scholar] [CrossRef]
- Feindt, P.; Grohmann, P.; Hager, A. The CAP post-2020 reform and the EU budget process. In EU Policymaking at a Crossroads. Negotiating the 2021–2027 Budget; Munch, S., Heinelt, H., Eds.; Edward Elgar Publishing: Cheltenham, UK, 2022. [Google Scholar]
- Castillo-Diaz, F.J.; Belmonte-Urena, L.J.; Alvarez-Rodriguez, J.F.; Cachao-Ferre, F. The Role of Sustainability and Circular Economy in Europe’s Common Agricultural Policy. In Environmentally Sustainable Production. Research for Sustainable Development; Valls Martinez, M.A., Santos-Jaen, J.M., Eds.; Springer: Cham, Switzerland, 2024. [Google Scholar]
- European Commission. List of Potential Agricultural Practices That Eco-Schemes Could Support; European Commission: Brussels, Belgium, 2021. [Google Scholar]
- Ekoschematy. Available online: https://www.gov.pl/web/rolnictwo/ekoschematy3 (accessed on 11 March 2025).
- Agencja Restrukturyzacji i Modernizacji Rolnictwa. Ekoschemat Rolnictwo węglowe i zarządzanie składnikami odżywczymi; Departament Płatności Bezpośrednich, November 2023. Available online: https://www.gov.pl/web/arimr (accessed on 11 March 2025).
- Stanny, M.; Rosner, A.; Komorowski, Ł. Monitoring Rozwoju Obszarów Wiejskich. Etap IV: Dekada Przemian Społeczno-Gospodarczych; Fundacja Europejski Fundusz Rozwoju Wsi Polskiej; Instytut Rozwoju Wsi i Rolnictwa PAN: Warszawa, Poland, 2024. [Google Scholar] [CrossRef]
- Kopczewska, K. Przestrzenne Metody Ilościowe W R: Statystyka, Ekonometira, Uczenie Maszynowe, Analiza Danych; CeDeWu: Warsaw, Poland, 2021. [Google Scholar]
- Suchecki, B. Ekonometria Przestrzenna. Metody I Modele Analizy Danych Przestrzennych; C.H. Beck: Warsaw, Poland, 2010. [Google Scholar]
- Moran, P.A.P. Notes on Continuous Stochastic Phenomena. Biometrika 1950, 37, 17–23. [Google Scholar] [CrossRef] [PubMed]
- Cliff, A.C.; Ord, J.K. Spatial Autocorrelation; Pion Limited: London, UK, 1973. [Google Scholar]
- Cliff, A.D.; Ord, J.K. Spatial Processes: Models and Applications; Pion Limited: London, UK, 1981. [Google Scholar]
- Goodchild, M.F. Spatial Autocorrelation; Geo Books: Norwich, UK, 1986. [Google Scholar]
- Ministeri, A. Evolution of Spatial Distribution of Innovative Activity; Working Paper; Università Ca’ Foscari di Venezia: Venice, Italy, 2003. [Google Scholar]
- Chen, Y. A New Methodology of Spatial Cross-Correlation Analysis. PLoS ONE 2015, 10, e0126158. [Google Scholar] [CrossRef]
- European Commission; Joint Research Centre; Isbasoiu, A.; Fellmann, T. CAP Strategic Plans of the EU Member States: CSPs Master File and Key Data; Publications Office of the European Union: Luxembourg, 2024; Available online: https://data.europa.eu/doi/10.2760/3104919 (accessed on 2 April 2025).
- Matthews, A. Farmer protests and the 2024 European Parliament elections. Intereconomics 2024, 59, 83–87. [Google Scholar] [CrossRef]
- Finger, R.; Fabry, A.; Kammer, M.; Candel, J.; Dalhaus, T.; Meemken, E.M. Farmer Protests in Europe 2023–2024. EuroChoices 2024, 23, 59–63. [Google Scholar] [CrossRef]
- Mc Loughlin, E. Protesting the future: The evolution of the European farmer. Anthropol. Today 2024, 40, 3–6. [Google Scholar] [CrossRef]
- BirdLife Europe; NABU. The Untapped Potential of Eco-Schemes: An Analysis of the Use of Eco-Schemes Across 12 Countries and Their Impact on Biodiversity; BirdLife Europe and Central Asia & NABU: Bruxelles, Belgium, 2024. [Google Scholar]
- Bułkowska, M.; Bazhenova, H. Direct and Indirect Consequences of the War in Ukraine for Polish Trade in Agri-Food Products. Probl. Agric. Econ. 2023, 376, 66–90. [Google Scholar] [CrossRef]
- Czubak, W.; Kalinowski, S.; Pelpliński, B. Ziarno Niezgody: Analiza Protestów Rolniczych; Instytut Finansów Publicznych: Warsaw, Poland, 2024. [Google Scholar]
- Wiśniewski, Ł.; Perdał, R.; Rudnicki, R. Proposed method for delimiting spatial structure on the example of agriculture types in Poland. Bull. Geogr. Socio-Econ. Ser. 2020, 49, 7–18. [Google Scholar] [CrossRef]
- Czekaj, M.; Szafrańska, M.; Żmija, K.; Satoła, Ł.; Płonka, A.; Żmija, D.; Tyran, E.; Puchała, J. Rola Małych Gospodarstw Rolnych. Diagnoza I Perspektywy Na Przyszłość Na Przykładzie Podregionu Rzeszowskiego; Difin SA: Warsaw, Poland, 2020.
- Zieliński, M.; Gołebiewska, B.; Adamski, M.; Sobierajewska, J.; Tyburski, J. Adaptation of eco-schemes to Polish agriculture in the first year of the EU CAP 2023–2027. Econ. Environ. 2024, 89, 817. [Google Scholar] [CrossRef]
- Zieliński, M.; Józwiak, W.; Adamski, M.; Wrzaszcz, W.; Sobierajewska, J.; Mirkowska, Z. Dochody Gospodarstw Rolniczych Versus Ekoschematy; Fundacja Europejski Fundusz Rozwoju Wsi Polskiej: Warsaw, Poland, 2024. [Google Scholar]
- EU CAP Network. Factsheet: Improving the Design and Implementation of Eco-Schemes in the New CAP Strategic Plans (CSPs)–Experiences from the First Year of Implementation. Available online: https://ruralnirazvoj.hr/files/eu-cap-network-factsheet-eco-schemes.pdf (accessed on 9 March 2025).
- Drygas, M.; Nurzyńska, I. Pożądana Struktura Wsparcia W Ramach Wspólnej Polityki Rolnej Unii Europejskiej Po 2020 Roku Oraz Cele Polityki Krajowej W Świetle Globalnych Wyzwań Modernizacyjnych Wobec Polskiego Rolnictwa; Fundacja Europejski Fundusz Rozwoju Wsi Polskiej, IRWiR PAN: Warsaw, Poland, 2021. [Google Scholar]
| Disclaimer/Publisher’s Note: The statements, opinions and data contained in all publications are solely those of the individual author(s) and contributor(s) and not of MDPI and/or the editor(s). MDPI and/or the editor(s) disclaim responsibility for any injury to people or property resulting from any ideas, methods, instructions or products referred to in the content. |
© 2025 by the authors. Licensee MDPI, Basel, Switzerland. This article is an open access article distributed under the terms and conditions of the Creative Commons Attribution (CC BY) license (https://creativecommons.org/licenses/by/4.0/).


