Article

Climate Change Effects on Dates Productivity in Saudi Arabia: Implications for Food Security

Department of Agribusiness and Consumer Sciences, College of Agricultural Science and Food, King Faisal University, Al-Ahsa 31982, Saudi Arabia
Sustainability 2025, 17(10), 4574; https://doi.org/10.3390/su17104574
Submission received: 28 March 2025 / Revised: 28 April 2025 / Accepted: 29 April 2025 / Published: 16 May 2025
(This article belongs to the Special Issue Sustainability of Agriculture: The Impact of Climate Change on Crops)

Abstract

:
This study aimed to assess the impact of climatic alteration on food security in Saudi Arabia. Date productivity, temperature, and precipitation represent the data which were collected from various sources linked to the study subject and cover the period from 1980 to 2023. The Engle–Granger two-step procedure, the VECM, and forecast analysis were applied to test the long-term relationship, short-term integration, and forecasting, respectively. Moreover, qualitative analysis was used to reveal the influence of climatic change on food security. The results discovered long-term co-integration between date productivity and temperature. Additionally, the results revealed that there has been long-running co-integration between date productivity and the precipitation series. Temperature and precipitation negatively and significantly impacted date productivity during the study period. With reference to forecast results, the graph was validated using various forecast indicators: the Alpha, Gamma, Beta, and Mean Square Error equivalents were 1.0, 0.0, 0.0, and 5.47, respectively. Moreover, the growth rates of date productivity were equal to 0.82 and 0.08 for the periods from 1980 to 2022 and 2023 to 2034 (forecast), respectively, indicating that there is a decrease in the growth rate of date productivity (0.08) during the forecast period. From these results, the conclusion is that climatic change (temperature and precipitation) negatively impacts date productivity. In addition, the growth rate during the forecast period decreased, indicating that climatic change is affecting food security currently and will continue to do so in the future. This study recommended specific policy interventions and innovations in agricultural practices, including developing and implementing a national framework focused on climate-smart agriculture, balancing productivity, adaptation, and mitigation. This could be aligned with Vision 2030 and the Saudi Green Initiative. Additionally, this could include investing in research and development by increasing public–private partnerships to support agricultural R&D in arid regions, with a focus on heat- and drought-resistant crop varieties and water-efficient farming systems. Regarding agricultural innovations, these could include the use of renewable energy, particularly solar energy, the expansion of rainwater harvesting infrastructure, recycling treated wastewater for agriculture, and reducing reliance on groundwater sources.

1. Introduction

Climate change is a chief environmental topic at the global level [1]. International warming primarily arises from carbon dioxide (CO2) emission levels [2]. Agricultural sectors and ecosystems are presently affected by climate change at national and global levels [3,4]. Climate change is demarcated as any change in the state of the climate which continues over a period of time and is accounted as one of the chief ecological problems troubling humankind in the twenty-first century [5,6,7]. Climatic factors are altering quickly owing to the rise in greenhouse gas emissions [3]. The rise in the intensity of greenhouse gases has resulted in a rise in average temperatures and altered the size and spread of precipitation universally. The universal temperature is increasing owing to human behaviors such as burning fossil fuels and clearing forests to build buildings [8]. High temperatures disrupt crop growth and development, which causally affects their economic yield [5,6,8,9], and, hence, economic sustainability [5,10,11], and, finally, the food security situation [12].
Food security is demarcated as “existing when all people, at all times, have physical and economic access to sufficient, safe, and nutritious food that meets their dietary needs and food preferences for an active and healthy life” [13,14]. This definition includes the broad concept of food security, which is classified according to four pillars, related to availability, access, utilization, and stability [14,15,16,17]. The pillars are connected by agricultural novelty [16,18], social capital [16,19], kitchen appliances [16,20], and global tremors [16,21]. One of the pillars of food security is the availability of food [22]. The availability of food is linked directly to agriculture [12]. The agricultural sector acts in a strategic role to cultivate food readiness and attain food security. In other words to realize food security, the agricultural sector should acts in a strategic role to enhance food availability [23,24,25,26].
Many authors have documented the impact of climate change on agricultural production. Agricultural production is threatened by climate change in food-insecure counties. Many extreme climate events, such as droughts, heat waves, erratic and intense rainfall patterns, storms, floods, and emerging insect pests, have negatively impacted farmers’ livelihoods [27]. Future climate projections show substantial rises in temperatures and uneven rainfall with greater amounts.
The studies [28,29] examined the potential risks posed by climate change on agriculture—an essential sector of the economy—particularly focusing on its effects on agricultural productivity and farm incomes across nations. The studies emphasize the possible hazards of climate change in relation to agriculture, including its effects on crop harvests, agricultural infrastructure, and water resources, and propose adaptation and extenuation strategies.
The studies [30,31] confirm the significant threat climate change poses to crop yields, water assets, soil health, developing agricultural production, and country-level food security. To meet this challenge, solid global inventive and collaborative actions are immediately necessary.
The study [32] deliberated on the influence of rising temperatures on the productivity of the main cereal crops worldwide and the prominence of the temperature–moisture link in adaptable crop reactions to heat from an international viewpoint. The researchers found that in some areas, lower precipitation and evaporation, combined with greater temperatures, led to extra noticeable production declines in crops, including corn and soybeans, suggesting a combined effect of heat and drought on yields. The study outcomes indicate that climate change and moisture stress factors affected crop production.
State-of-the-art climate and crop models have been used to forecast alterations in harvests of maize, soybean, and rice [28,33]. Some studies have examined the different drivers of climate change, comprising rising temperatures, changes in rainfall forms, drought patterns, and significant carbon dioxide uptake. The outcomes suggest that the influence of climate change on agricultural productivity may be greater than earlier estimated and that relatively high-latitude areas may encounter high-yield harvests whereas low-latitude tropical areas may see lower yields.
The most common crops have been analyzed using different models, taking into account the impact of climate change on their productivity [28,34]. The results specify that climate change considerably disturbs yields, and prospective climate variation predictions suggest that there will be a shrinkage in average crop production worldwide, particularly in hotter areas. Consequently, modifications and alterations in agricultural structures will be necessary in response to future climate change.
Another study aimed to assess the relationship between date production and CO2 in Saudi Arabia, using econometric analysis tools [35]. The study appeared to show that there has been a long-running relationship between these variables.
Climatic change significantly and profoundly impacts soil, which, in turn, adversely affects food security [36]. In addition, hazardous weather caused by climate change threatens crops around the world, making it difficult to sustain stable food systems [37,38].
The date palm (Phoenix dactylifera) is one of the main crops produced in the Kingdom of Saudi Arabia [39]. Among other crops, dates are considered a good food source with high nutritional value [40]. Globally, dates are cultured on 1 396.727 ha of land, with an annual production of 9 248.033 tonnes [41]. In Saudi Arabia alone, they are grown on 157,444 ha of land, with a production of 1,642,992.53 tonnes in 2023 [42]. Also, date palms accounted for 56% of total (primary) fruit production in 2022 [42] in Saudi Arabia. Local date consumption amounted, on average, to about 985.94 thousand dates in 2020/2021 [43]. The National Agricultural Strategy 2030 includes date production in its plans to achieve food security in the Kingdom of Saudi Arabia [40]. As a result of the position of date palms and their product in Saudi Arabia, they were selected as variables in this study.
Building on prior studies, the importance of this study emerged from its intended aim, which is mainly to examine the influence of climatic change on food security in Saudi Arabia at present and in the future. Accordingly, the study was divided into three parts: part one related to testing the dynamic relationship between the variables under study, part two considered forecast analysis, and part three determined the effect of climatic change on food security.

2. Materials and Methods

2.1. Description of Data

The aim of this study was to determine the relationships between date productivity (kg/ha), temperature (°C), and precipitation (millimeter) and their impacts on food security. The data on such variables were gathered, covering the period from 1980 to 2023, and were examined using the EVIEWS 12 program. Information about the variables is summarized in Table 1.

2.2. Methods of Analysis

2.2.1. The Graphical Analysis Method

General index curves were drawn for the study’s time series to initially shed light on the possibility of a stability link among the variables in the long run. An elementary analytical technique was used to establish this relationship, which also allowed us to proceed with performing a co-integration test.

2.2.2. Co-Integration Tests: Testing the Long-Term Relationship

1. Unit root test: The order of integration of the series was specified using an ADF test [35,44]. Equations (1) and (2) were used:
Δ X t = C t 1 + b 1 X t 1 + E t 1
Δ X t = C t 2 + B t + b 2 X t 1 + E t 2
where b1 and b2 are the ADF parameters to be evaluated, B is the trend, C is the constant, E is the error term, and t is the period of time. In testing the null hypothesis (H0), X has a unit root, while in the alternative hypothesis (H1), X has a constant root (stationary). Variables are stationary if the t-statistics of the ADF coefficient are bigger than the critical t-values. The choice of method for examining the long-term association depends on the order of the series. The Engle–Granger test is applied when the two series’ orders are equal to 1 (1) [45,46].
2. Engle–Granger test: This test is used to determine long-term associations.
To perform the co-integration test using the Engle–Granger method, the order of integration of the series should be determined first (this can be achieved using a similar order of integration as above (1)). Next, the Engle–Granger test [45] can be run. This comprises the following steps, and the regression equations are as follows:
X t = a 1   + B 3   Y t + z t 1
Y t = a 2   + B 4 X t + z t 2
where B3 and B4 are the slopes from Equations (3) and (4), respectively.
The ADF test is practiced on the residues (zt1 and zt2) to examine whether the series are linked or not. If the ADF statistic is negative and larger than the critical t-value (order 1), then the coefficients B3 and B4 are expected to exist. Therefore, the series is coupled in the order 1, 1.

2.2.3. Error Correction Model (VECM)

The VECM test is implemented after the co-integration test has captured the long-term connection between the series. It is utilized to measure the speediness factor of the short-term link between the chains [47]. The VECM equations are as follows:
Δ LY = Δ   B 5 L Y 1 + Δ B 6 L X 1 + B 7   V 1 t 1 + U 1
Δ L X = Δ   B 8 L X 1 + Δ B 9 L Y 1 + B 10 V 2 t 1 + U 2
where B5 and B8 are coefficients of the difference in the lag-dependent variable; B6 and B9 are coefficients of the difference in the lag-independent variable; B7 and B10 are used to modulate the speediness (must be negative and significant to prevent model unsteadiness); V1 and V2 are error correction terms; U1 and U2 are error terms; and L is the logarithm. In addition, VECM feasibility was confirmed by conducting residual diagnostics tests.

2.2.4. Forecast Analysis (Date Productivity)

The VECM was subjected to forecast analysis (using date productivity as the dependent variable). To test the forecast, the ETS (Error, Trend, Seasonal) model was used. Alpha (α), Beta (β), Gamma (γ), and Mean Square Error (MSE) were used as the parameters of the model. The graphical feasibility of the forecast results was evaluated using Alpha (α), Beta (β), and Gamma (γ); these are smoothing parameters that regulate how the model responds to new data. Alpha (α) is responsible for level smoothing and determines how fast the model updates the overall average. Beta (β) is responsible for trend smoothing and controls how quickly the model adjusts to changing trends. Gamma (γ) is responsible for seasonality smoothing and measures how quickly seasonal patterns are updated. These factors range between 0 and 1: a greater value means extra load on new observations, resulting in the construction of a model that is more responsive to changes. Mean Square Error (MSE) is an average of the squared differences between forecasted and actual values. It is used to evaluate model precision and to optimize the smoothing factors. The smaller the RMSE, the better the forecast result. The growth rate of date productivity was also calculated for the period from 1980 to 2022 and for the period from 2023 to 2034 (the projection period) using the following equation [12]:
G t = Y t Y t 1 ÷ Y t 1
where Gt represent the growth rate between two subsequent years, Y designates date productivity, and t is a year. Finally, the growth rate of date productivity was measured for the periods from 1980 to 2022 and 2023 to 2034 (forecast) as follows:
G t n = ( G t   + G t + 1 + G n ) ) / N
where G t n and N signify the growth rate for a specific period and the number of years, respectively.

2.2.5. The Impact of Climatic Change on Saudi Arabia’s Food Security

Based on the study outcomes of integration and forecast analysis, qualitative analysis was performed to shed light on the impact of climate change on food security.

3. Results and Discussion

3.1. Descriptive Statistics Results

The outcomes of the descriptive tests are listed in Table 2. The Jarque–Bera probabilities were lower than the 0.05 levels for date productivity (DP) and precipitation (P), meaning that the variables had a non-normal distribution. Therefore, the data ought to be transformed (into logarithm form) to correct this non-normality condition.

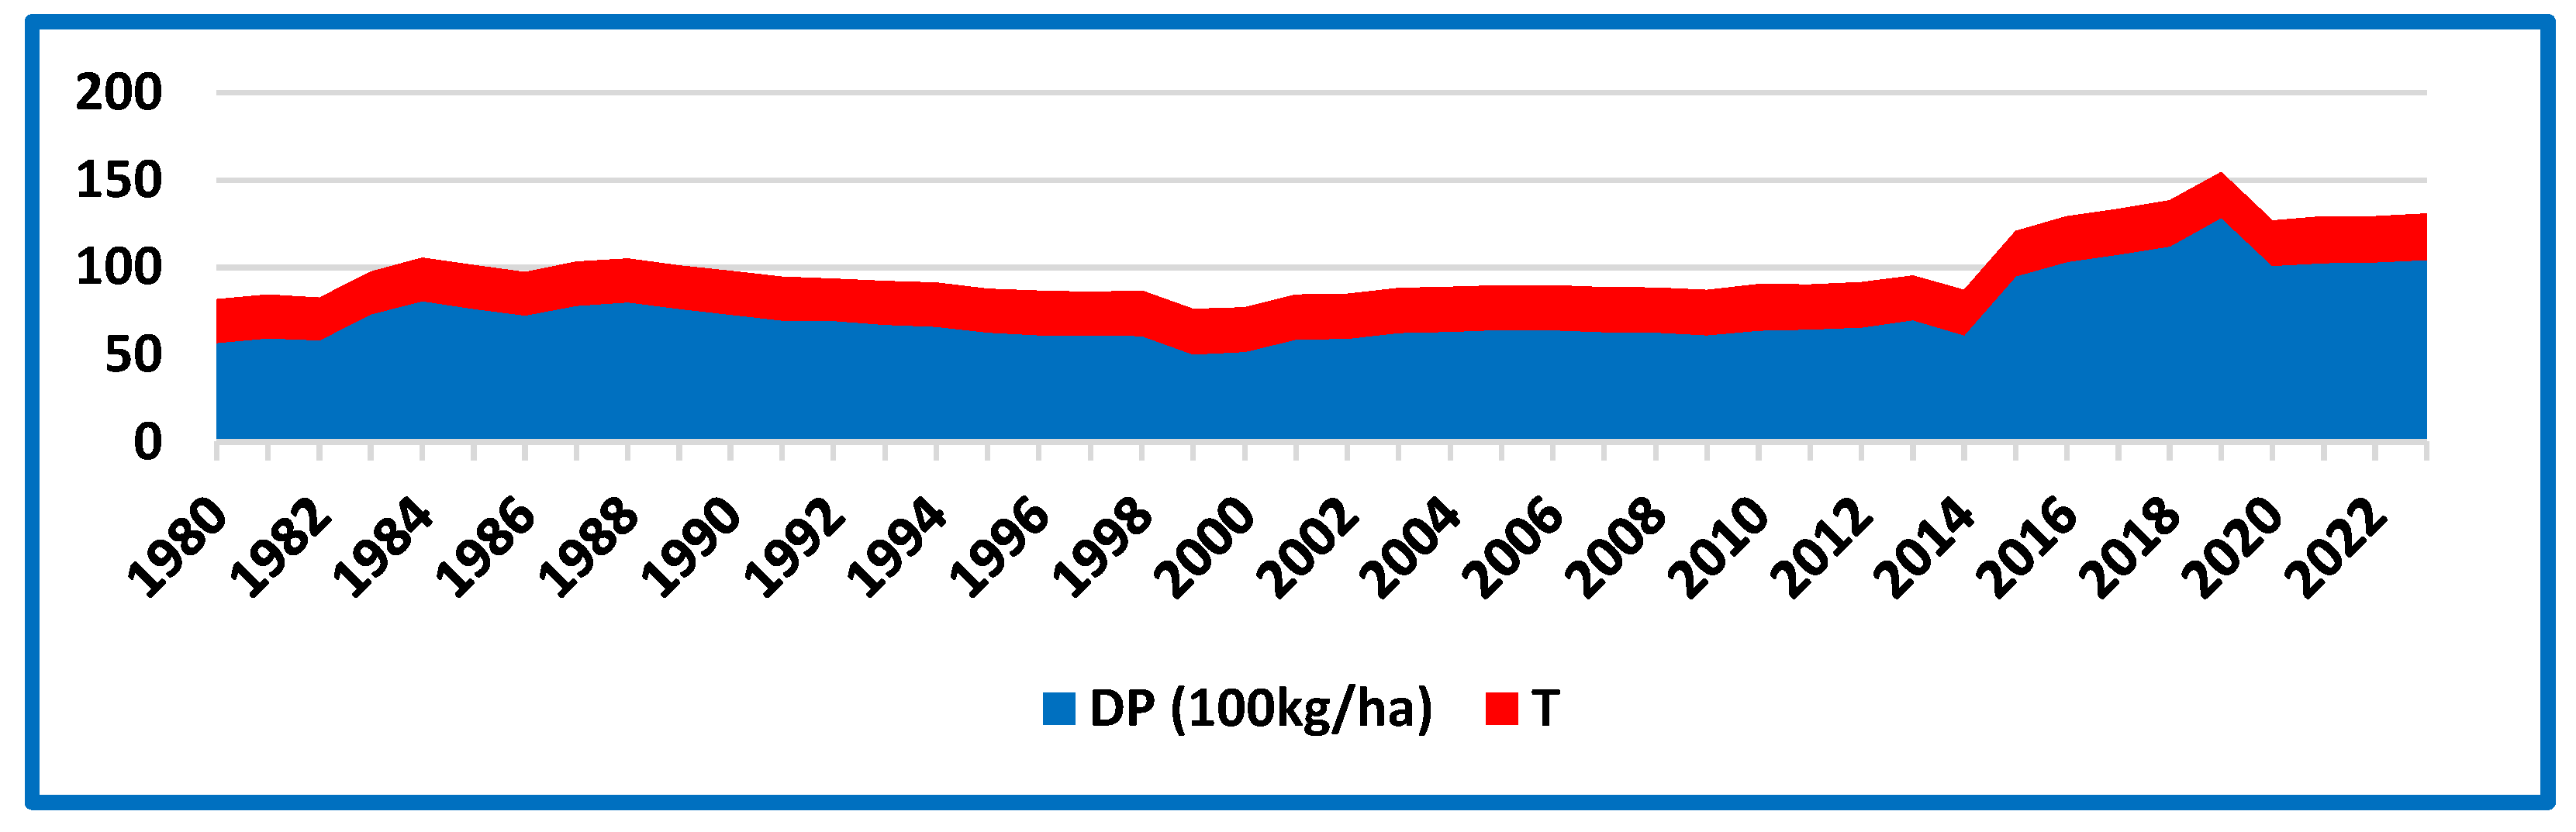
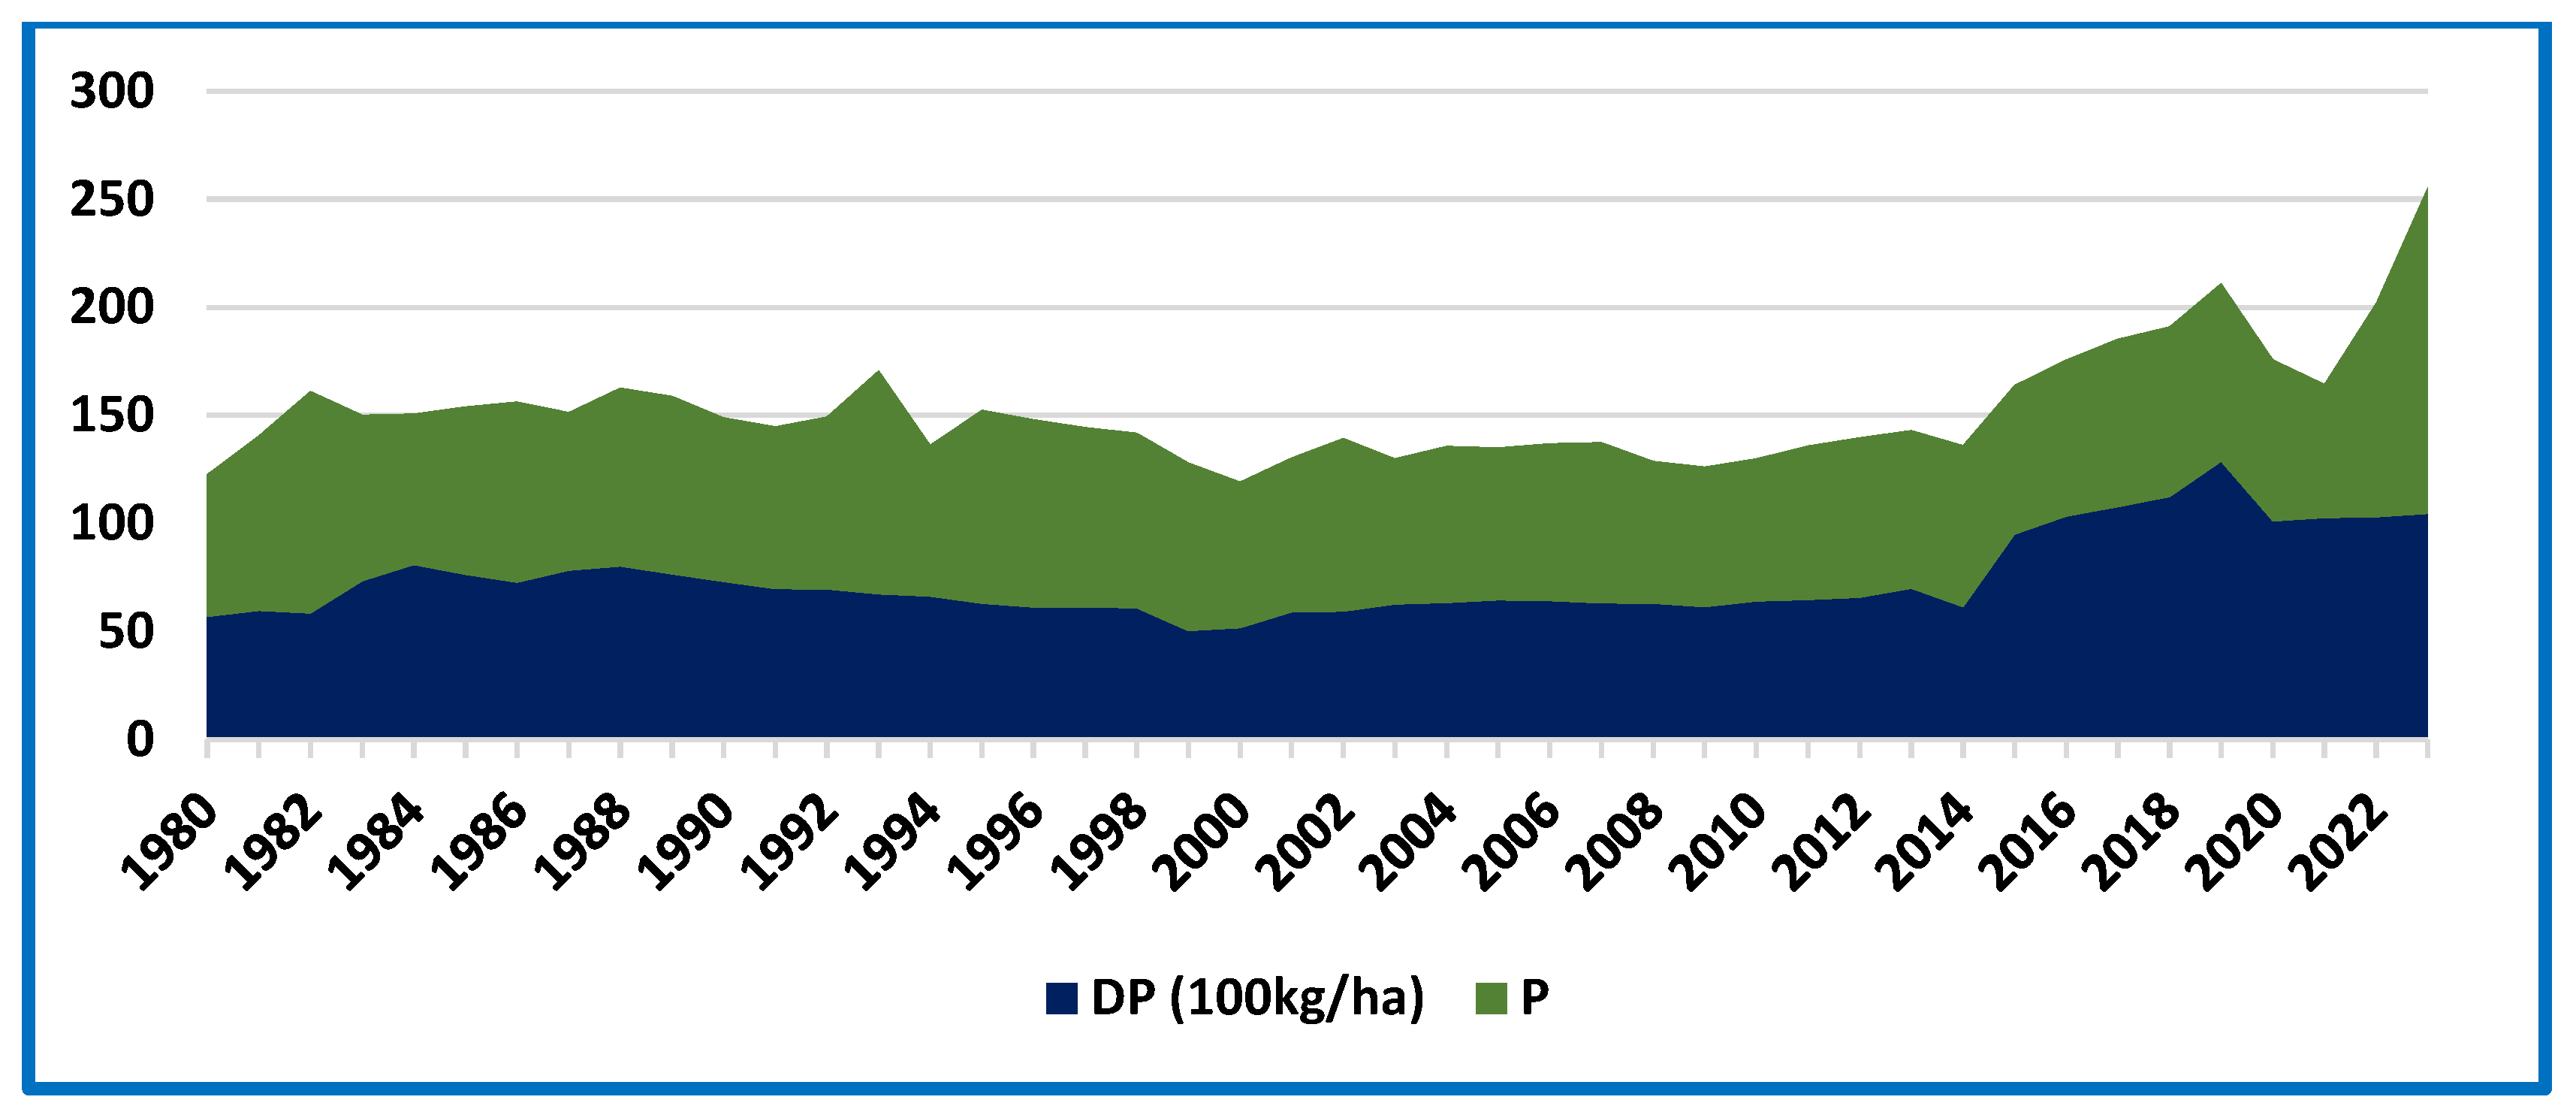
3.2. Graphical Analysis

As a pre-test for co-integration, Figure 1 shows that there may have been a long-running relationship between date productivity and annual average temperature during the period from 1980 to 2023 in Saudi Arabia. This result led us to conduct further co-integration analyses.

3.3. Co-Integration Analysis Test (Date Productivity and Temperature)

3.3.1. Unit Root Test Results

The stationarity of the series of date productivity and temperature was estimated using the unit root (ADF) test. Table 3 shows that the series remained stable after achieving an initial difference of 1 (1); accordingly, the ADF test statistics were significant at the 1% level. Therefore, the Engle–Granger test was used to estimate the associations between the series.

3.3.2. Engle–Granger Test Results (Date Productivity and Temperature)

Table 4 shows the results of the ADF test on the residuals (zt1 and zt2 in Equations (3) and (4), respectively). The ADF statistics are negative (−6.81 and −6.81) and statistically significant at the 1% level, leading us to accept the alternative hypothesis of integration which proposes that date productivity and temperature are co-integrated. This result matched with that of an earlier study [12] which assessed date production and CO2. It found that there was a long-running relationship between climate change (CO2) and date productivity.

3.4. Results of VECM

To strengthen the finding of the Engle–Granger test (a long-term link between date productivity and temperature), the VECM was applied. To use the VECM, lag must be selected. Lag 1 was chosen, as shown in Table 5. Table 6 shows the results of the VECM. The estimated adjustment coefficient for date productivity (DP), defined as the dependent variable, was negative (−0.08) and statistically insignificant (t-value = −1.22). This means that the model does not demonstrate a significant ability to correct imbalances in previous periods. From the table, the long-term results suggested that temperature influenced the performance of date productivity negatively (coefficient = −9.44 with t-value = −1.76), resulting in lower date productivity. These results (showing a long-term relation between climate and date production) matched with those of previous studies [13,14,15,19]. Also, the results show that temperature has no effect on date productivity in the short term.
To verify the adequacy of the VECM, residual diagnostic indicators were used, including the Brosch–Pagan–Godfrey heteroscedasticity test, the LM serial correlation test, and the Jarque–Bera test: Chi-sq. equals 14.99 with Prob. = 0.66, M-statistics (lag 1) equal 7.20 with Prob. = 0.13, and Jarque–Bera test result statistics equal 0.58 with Prob. = 0.75, respectively. Hence, the results for model suitability indicate acceptance of the null hypothesis, a lack of heteroscedasticity, and a lack of serial correlation for the residual distribution and residual normal distribution, respectively.

3.5. The Results of the Engle–Granger Test (Date Productivity and Precipitation)

As a pre-test for co-integration, Figure 2 shows that there might be a long-running relationship between date productivity and precipitation. This result led us to conduct further co-integration analyses.

3.5.1. The Results of Unit Root Tests

The unit root test outcomes (ADF) documented that date productivity and precipitation were stationary after achieving an initial difference of 1 (1) (Table 7). Consequently, date productivity and precipitation showed a stationarity order of 1 (1); therefore, the Engle–Granger test was selected to assess the associations between the series.

3.5.2. Engle–Granger Test Results

The results of the ADF test on the residuals (zt1 and zt2 in Equations (3) and (4), respectively) are presented in Table 8. The ADF statistics are negative (−7.52 and −7.23) and statistically significant at the 1% level. These results led us to accept the alternative hypothesis of integration, suggesting that the series are co-integrated. This result suggests that there is indication of a long-running association between date productivity and precipitation during the study period.

3.6. Results of the VECM

To strengthen the finding of the Engle–Granger test (a long-term link between date productivity and precipitation), the VECM was used. To apply the VECM, lag must be selected. Lag 1 was chosen (Table 9). Table 10 shows the results of the VECM. The adjustment coefficient for date productivity (the dependent variable) and precipitation (the independent variable) was negative (−0.01) and insignificant (critical t-value = −0.25), concluding that the model was unable to improve its earlier time imbalance. From the table, the long-term results show that precipitation affected the performance of date productivity negatively and significantly (coefficient = −5.10 with t-value = −3.05). These results (showing the long-term relationship between climate and date production) corroborate the findings of previous studies [28,29,30,34]. In addition, precipitation has no effect on date productivity in the short term (insignificant). To confirm the adequacy of the VECM, residual diagnostic indicators were used, including the Brosch–Pagan–Godfrey heteroscedasticity test, the LM serial correlation test, and the Jarque–Bera test: Chi-sq. equals 40.96 with Prob. = 0.51, M-statistics (lag 1) equal 8.46 with Prob. = 0.08, and Jarque–Bera test result statistics equal 0.58 with Prob. = 0.75, respectively. The results of model suitability indicated acceptance of the null hypothesis, a lack of heteroscedasticity, and a lack of serial correlation for the residual distribution and residual normal distribution, respectively.

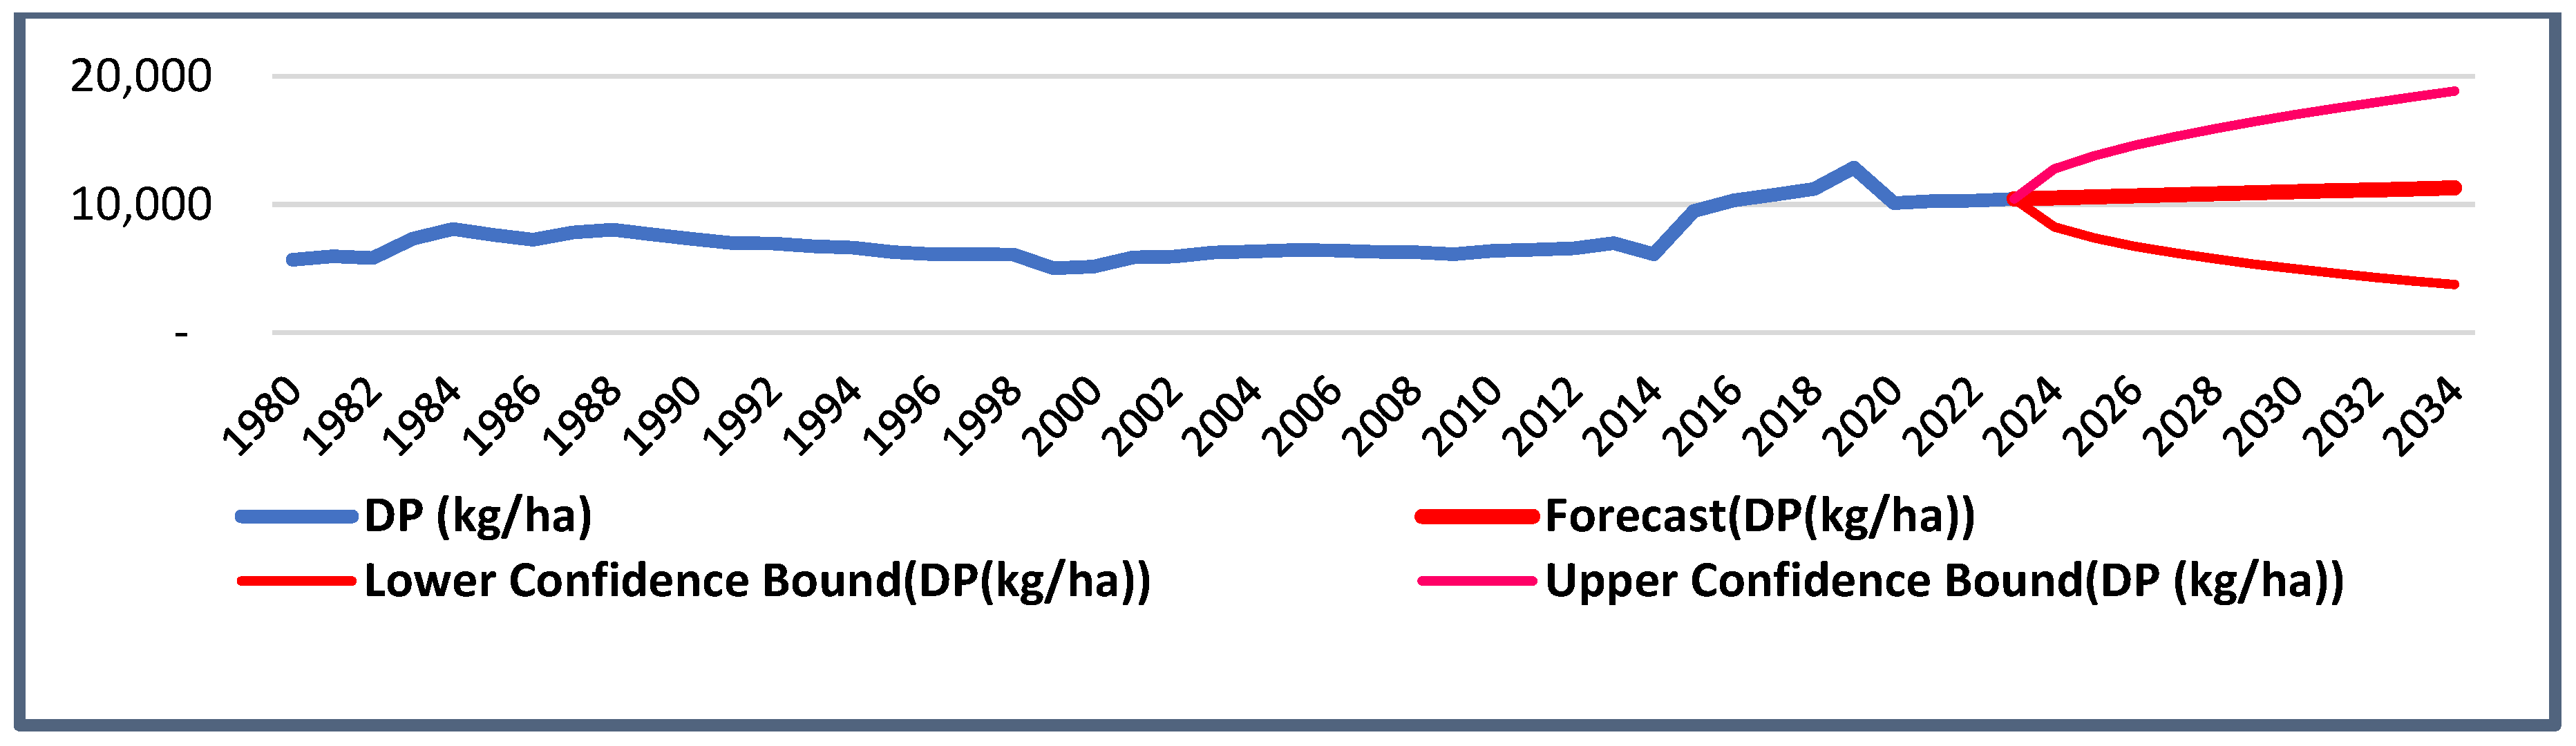
3.7. Forecast Results (Date Productivity)

Figure 3 displays the forecast graph of date productivity: the blue and red parts indicate date productivity for the periods from 1980 to 2022 and 2023 to 2034 (forecast), respectively. The graph was proven to be valid using various forecast indicators, with Mean Square Error, Alpha, Gamma, and Beta values equal to 5.47, 1.0, 0.0, and 0.0, respectively. Likewise, the growth rates of date productivity are equal to 0.82 and 0.08 for the periods from 1980 to 2023 and 2023 to 2034 (forecast), respectively, concluding that there is an increase in date productivity but at a decreasing rate (0.08) during the forecast period.

3.8. The Impact of Climate Change on Saudi Arabia’s Food Security

One of the pillars of food security is the availability of food [22]. The availability of food is determined directly by the agriculture sector [12]. The agricultural sector plays a strategic role in improving the availability of food and realizing food security [23,24,25,26]. This study aimed to evaluate the impact of climatic change on Saudi Arabia’s food security. From Table 5, the long-term results show that temperature negatively influenced (coefficient = −9.44 with t-value = −1.76) date productivity. In addition, the long-term results show that precipitation affected date productivity negatively and significantly (coefficient = −5.10 with t-value = −3.05) (Table 10). Also, these results (showing a long-term relationship between the climate and date production) align with the results of previous studies [28,29,30,34]. Referencing the forecast results, the graph was shown to be valid using various forecast indicators: Beta, Alpha, Mean Square Error, and Gamma values were equal to 0.0, 1.0, 5.47, and 0.0, respectively. In addition, date productivity growth rates reached 0.82 and 0.08 for the periods from 1980 to 2022 and from 2023 to 2034 (forecasts), respectively, showing that there was a decrease in the growth rate of date productivity (0.08) during the forecast period. From these results, the conclusion is that climatic change (temperature and precipitation) impacts negatively on date productivity, hindering food security, since food security can be improved through increasing date productivity. This result aligns with that of a previous study [12].

4. Conclusions

This study aimed to evaluate the impact of climatic change on Saudi Arabia’s food security (identifying the connection between date productivity and climate (temperature and precipitation) and its impact on food security). The data were collected from various resources linked to study subjects in the period from 1980 to 2023. The Engle–Granger two-step procedure and forecast analysis were applied to test the long-term relationship and enable forecasting, respectively. Also, qualitative analysis was used to determine the effect of climatic change on food security. The results uncovered long-term co-integration between date productivity and temperature. Also, the long-term results demonstrated that temperature negatively influenced date productivity (coefficient = −9.44 with t-value = −1.76). In addition, the coefficient of adjustment for date productivity was shown to be negative (−0.08) and insignificant (critical t-value = −1.22), concluding that the model was powerless to improve its previous time instability. Also, the results uncovered long-term co-integration between date productivity and precipitation series. In addition, the long-term results showed that precipitation negatively and significantly impacted date productivity (coefficient = −5.10 with t-value = −3.05). With reference to the forecast results, the graph was validated using various forecast indices: the Mean Square Error, Alpha, Beta, and Gamma values were equal to 5.47, 1.0, 0.0, and 0.0, respectively. In addition, the growth rates of date productivity were found to be 0.82 and 0.08 for the periods from 1980 to 2022 and from 2023 to 2034 (forecast), respectively, concluding that there was a decrease in the growth rate of date productivity (0.08) during the forecast period. From these results, the conclusion is that both temperature and precipitation negatively affect date productivity in the long run, with a statistically significant impact, resulting in a decline in date productivity directly and an indirect impact on food security. To combat this, this study recommends specific policy interventions and innovations in agricultural date palm practices. With regard to policy interventions, a national framework focused on climate-smart agriculture, balancing date productivity, adaptation, and mitigation, should be developed and implemented. This could be aligned with Vision 2030 and the Saudi Green Initiative. Also, there should be greater investment in research and development with a focus on heat- and drought-resistant varieties and water-efficient farming systems. Regarding agricultural innovations, there should be an increase in the use of renewable energy, particularly solar energy, an expansion of rainwater harvesting infrastructure, the introduction of recycling treatment for wastewater for agriculture, and a reduction in the reliance on groundwater sources.

Funding

This work was supported by the Deanship of Scientific Research, Vice Presidency for Graduate Studies and Scientific Research, King Faisal University, Saudi Arabia [GRANT No. KFU251674].

Institutional Review Board Statement

Not applicable.

Informed Consent Statement

Not applicable.

Data Availability Statement

There are many data that were used in this study to support the reported results: Date productivity in tonnes/ha (https://www.fao.org/faostat/ar/#data/QCL (accessed on 10 February 2025)); annual average temperature in °C and average precipitation in millimeters (https://climateknowledgeportal.worldbank.org/country/saudi-arabia (accessed on 10 February 2025)).

Conflicts of Interest

The author declares no conflicts of interest.

References

  1. Tiba, S.; Anis, O. Literature survey on the relationships between energy, environment and economic growth. Renew. Sustain. Energy Rev. 2007, 69, 1129–1146. [Google Scholar] [CrossRef]
  2. Talbi, B. CO2 emissions reduction in road transport sector in Tunisia. Renew. Sustain. Energy Rev. 2017, 69, 232–238. [Google Scholar] [CrossRef]
  3. Aroyehun, A.R.; Ugwuja, V.C.; Onoja, A.O. Determinants of melon farmers’ adaptation strategies to climate change hazards in south‒south Nigeria. Sci. Rep. 2024, 14, 17395. [Google Scholar] [CrossRef] [PubMed]
  4. Ogunnaike, M.G.; Oyawole, F.P.; Afolabi, O.I.; Olabode, J.O. Determinants of smallholder farmers adaptation strategy to climate change in Nigeria. NIU J. Soc. Sci. 2021, 7, 243–251. [Google Scholar]
  5. Droulia, F.; Charalampopoulos, I. Future climate change impacts on European viticulture: A review on recent scientific advances. Atmosphere 2021, 12, 495. [Google Scholar] [CrossRef]
  6. Pachauri, R.K.; Reisinger, A. Climate Change 2007: Synthesis Report. Contribution of Working Groups I, II and III to the Fourth Assessment Report of the Intergovernmental Panel on Climate Change 2007, IPCC. Available online: https://www.ipcc.ch/site/assets/uploads/2018/02/ar4_syr_full_report.pdf (accessed on 20 February 2025).
  7. IPCC. Climate Change. Synthesis Report. Contribution of Working Groups I, II and III to the Fifth Assessment Report of the Intergovernmental Panel on Climate Change; Core Writing Team, Pachauri, R.K., Meyer, L., Eds.; IPCC: Geneva, Switzerland, 2014; p. 151. ISBN 978-92-9169-143-2. Available online: https://www.ipcc.ch/report/sr15/summary-for-policymakers/ (accessed on 20 February 2025).
  8. Fatima, Z.; Ahmed, M.; Hussain, M.; Abbas, G.; Ul-Allah, S.; Ahmad, S.; Ahmed, N.; Ali, M.A.; Sarwar, G.; Haque, E.U.; et al. The fingerprints of climate warming on cereal crops phenology and adaptation options. Sci. Rep. 2020, 10, 18013. [Google Scholar] [CrossRef]
  9. Rosenzweig, C.; Parry, M.L. Potential impact of climate change on world food supply. Nature 1994, 367, 133–138. [Google Scholar] [CrossRef]
  10. Lavalle, C.; Micale, F.; Houston, T.D.; Camia, A.; Hiederer, R.; Lazar, C.; Conte, C.; Amatulli, G.; Genovese, G. Climate change in Europe. 3. Impact on agriculture and forestry. A review. Agron. Sustain. Dev. 2009, 29, 433–446. [Google Scholar] [CrossRef]
  11. Jones, G.V. Climate, grapes, and wine: Structure and suitability in a changing climate . In Proceedings of the XXVIII International Horticultural Congress on Science and Horticulture for People (IHC2010): International Symposium on the Citrus, Bananas and other Tropical Fruits Under Subtropical Conditions, Lisborn, Portugal, 22–27 August 2010; Volume 931, pp. 19–28. Available online: https://www.actahort.org/books/931/931_1.htm (accessed on 20 February 2025).
  12. Emam, A.A. Saudi fertilizers and their impact on global food security: Present and future. Sustainability 2023, 15, 7614. [Google Scholar] [CrossRef]
  13. World Food Summit. Declaration on World Food Security; World Food Summit: Rome, Italy, 1996. [Google Scholar]
  14. van Meijl, H.; Shutes, L.; Valin, H.; Stehfest, E.; van Dijk, M.; Kuiper, M.; Tabeau, A.; van Zeist, W.J.; Hasegawa, T.; Havlik, P. Modelling alternative futures of global food security: Insights from FOODSECURE. Glob. Food Secur. 2020, 25, 100358. [Google Scholar] [CrossRef]
  15. FAO. The State of Food and Agriculture 1996. Available online: http://www.fao.org/3/w1358e/w1358e00.htm (accessed on 14 January 2025).
  16. Guiné, R.D.P.F.; Pato, M.L.D.J.; Costa, C.A.D.; Costa, D.D.V.T.A.D.; Silva, P.B.C.D.; Martinho, V.J.P.D. Food Security and Sustainability: Discussing the Four Pillars to Encompass Other Dimensions. Foods 2021, 10, 2732. [Google Scholar] [CrossRef]
  17. Béné, C. Resilience of local food systems and links to food security–A review of some important concepts in the context of COVID-19 and other shocks. Food Secur. 2020, 12, 805–822. [Google Scholar] [CrossRef] [PubMed]
  18. Magrini, E.; Vigani, M. Technology adoption and the multiple dimensions of food security: The case of maize in Tanzania. Food Secur. 2016, 8, 707–726. [Google Scholar] [CrossRef]
  19. Nosratabadi, S.; Khazami, N.; Abdallah, M.B.; Lackner, Z.; Band, S.S.; Mosavi, A.; Mako, C. Social capital contributions to food security: A comprehensive literature review. Foods 2020, 9, 1650. [Google Scholar] [CrossRef] [PubMed]
  20. Oakley, A.R.; Nikolaus, C.J.; Ellison, B.; Nickols-Richardson, S.M. Food insecurity and food preparation equipment in US households: Exploratory results from a cross-sectional questionnaire. J. Hum. Nutr. Diet. 2019, 32, 143–151. [Google Scholar] [CrossRef] [PubMed]
  21. Houessou, M.D.; Cassee, A.; Sonneveld, B.G. The effects of the covid-19 pandemic on food security in rural and urban settlements in benin: Do allotment gardens soften the blow? Sustainability 2021, 13, 7313. [Google Scholar] [CrossRef]
  22. Ahmad, N.; Du, L.; Lu, J.; Wang, J.; Li, H.-Z.; Hashmi, M.Z. Modelling the CO2 emissions and economic growth in Croatia: Is there any environmental Kuznets curve? Energy 2017, 123, 164–172. [Google Scholar] [CrossRef]
  23. Smutka, L.; Steininger, M.; Miffek, O. World agricultural production and consumption. Agris Line Pap. Econ. Inform. 2009, 1, 3–12. [Google Scholar] [CrossRef]
  24. Smutka, L.; Steininger, M.; Maitah, M.; Škubna, O. The Czech Agrarian Foreign Trade—Ten Years after the EU Accession. In Agrarian Perspectives XXIV, Proceedings of the 24th International Scientific Conference, Czech University of Life Sciences Prague, Faculty of Economics and Management, Prague, Czech Republic, 16–18 September 2015; Smutka, L., Rezbová, H., Eds.; CAB Direct: Glasgow, UK, 2015; pp. 385–392. [Google Scholar]
  25. Otsuka, K. Food insecurity, income inequality, and the changing comparative advantage in world agriculture. Agric. Econ. 2013, 44, 7–18. [Google Scholar] [CrossRef]
  26. Wegren, S.K.; Elvestad, C. Russia’s food self-sufficiency and food security: An assessment. Post-Communist Econ. 2018, 30, 565–587. [Google Scholar] [CrossRef]
  27. Habib-ur-Rahman, M.; Ahmad, A.; Raza, A.; Hasnain, M.U.; Alharby, H.F.; Alzahrani, Y.M.; Bamagoos, A.A.; Hakeem, K.R.; Ahmad, S.; Nasim, W.; et al. Impact of climate change on agricultural production; Issues, challenges, and opportunities in Asia. Front. Plant Sci. 2022, 13, 925548. [Google Scholar] [CrossRef] [PubMed]
  28. Yuan, X.; Li, S.; Chen, J.; Yu, H.; Yang, T.; Wang, C.; Huang, S.; Chen, H.; Ao, X. Impacts of global climate change on agricultural production: A comprehensive review. Agronomy 2024, 14, 1360. [Google Scholar] [CrossRef]
  29. Alam, A. Rukhsana. Climate change impact, agriculture, and society: An overview. In Climate Change, Agriculture and Society: Approaches Toward Sustainability; Springer: Berlin/Heidelberg, Germany, 2023; pp. 3–13. Available online: https://link.springer.com/chapter/10.1007/978-3-031-28251-5_1 (accessed on 20 February 2025).
  30. Prajapati, H.A.; Yadav, K.; Hanamasagar, Y.; Kumar, M.B.; Khan, T.; Belagalla, N.; Thomas, V.; Jabeen, A.; Gomadhi, G.; Malathi, G. Impact of climate change on global agriculture: Challenges and adaptation. Int. J. Environ. Clim. Chang. 2024, 14, 372–379. [Google Scholar] [CrossRef]
  31. Eekhout, J.P.; de Vente, J. Global impact of climate change on soil erosion and potential for adaptation through soil conservation. Earth-Sci. Rev. 2022, 226, 103921. [Google Scholar] [CrossRef]
  32. Lesk, C.; Coffel, E.; Winter, J.; Ray, D.; Zscheischler, J.; Seneviratne, S.I.; Horton, R. Stronger temperature–moisture couplings exacerbate the impact of climate warming on global crop yields. Nat. Food 2021, 2, 683–691. [Google Scholar] [CrossRef]
  33. Jägermeyr, J.; Müller, C.; Ruane, A.C.; Elliott, J.; Balkovic, J.; Castillo, O.; Faye, B.; Foster, I.; Folberth, C.; Franke, J.A.; et al. Climate impacts on global agriculture emerge earlier in new generation of climate and crop models. Nat. Food 2021, 2, 873–885. [Google Scholar] [CrossRef] [PubMed]
  34. Zhu, P.; Burney, J.; Chang, J.; Jin, Z.; Mueller, N.D.; Xin, Q.; Xu, J.; Yu, L.; Makowski, D.; Ciais, P. Warming reduces global agricultural production by decreasing cropping frequency and yields. Nat. Clim. Chang. 2022, 12, 1016–1023. [Google Scholar] [CrossRef]
  35. Emam, A. Present and Future: Does agriculture affect economic growth and environment in the Kingdom of Saudi Arabia? J. Agric. Econ. Czech Acad. Agric. Sci 2022, 68, 361–370. [Google Scholar] [CrossRef]
  36. Wijerathna-Yapa, A.; Pathirana, R. Sustainable agro-food systems for addressing climate change and food security. Agriculture 2022, 12, 1554. [Google Scholar] [CrossRef]
  37. Soffiantini, G. Food Insecurity and Political Instability during the Arab Spring. Glob. Food Secur. 2020, 26, 100400. [Google Scholar] [CrossRef]
  38. Mbow, C.; Rosenzweig, C.; Tubiello, F.; Benton, T.; Herrero, M.; Pradhan, P.; Barioni, L.; Krishnapillai, M.; Liwenga, E.; RiveraFerre, M.; et al. Chapter 5: Food Security. In IPCC Special Report on Land and Climate Change; IPCC: Geneva, Switzerland, 2019. [Google Scholar]
  39. Aleid, S.M.; Al-Khayri, J.M.; Al-Bahrany, A.M. Date palm status and perspective in Saudi Arabia. In Date Palm Genetic Resources and Utilization; Al-Khayri, J.M., Jain, S.M., Johnson, D.V., Eds.; Springer: Dordrecht, The Netherlands, 2015; pp. 49–95. [Google Scholar]
  40. National Center for Palms and Dates, Report. 2022. Available online: https://ncpd.gov.sa/en/reports (accessed on 28 February 2025).
  41. Mohammed, M.; Sallam, A.; Munir, M.; Ali-Dinar, H. Effects of deficit irrigation scheduling on water use, gas exchange, yield, and fruit quality of date palm. Agronomy 2021, 11, 2256. [Google Scholar] [CrossRef]
  42. FAO. Crops and Livestock Products. [Dataset]. Food and Agriculture Organization of the Nations (FAO). 2023. Available online: https://www.fao.org/faostat/en/#data/QCL (accessed on 14 March 2025).
  43. Alhamdan, A.; Alamri, Y.; Aljuhaim, F.; Kotb, A.; Aljohani, E.; Alaagib, S.; Elamshity, M. Economic Analysis of the Impact of Waste on the Production and Consumption of Dates in Saudi Arabia. Sustainability 2024, 16, 9588. [Google Scholar] [CrossRef]
  44. Dickey, D.A.; Fuller, W.A. Distribution of the estimators for autoregressive time series with a unit root. J. Am. Stat. Assoc. 1979, 74, 427–431. [Google Scholar] [CrossRef]
  45. Chen, L.; Chang, J.; Wang, Y.; Guo, A.; Liu, Y.; Wang, Q.; Xie, Z. Disclosing the future food security risk of China based on crop production and water scarcity under diverse socioeconomic and climate scenarios. Sci. Total Environ. 2021, 790, 148110. [Google Scholar] [CrossRef]
  46. Peseran, M.H.; Peseran, B. Working with Microfit 4.0: Interactive Econometric Analysis; Oxford University Press: Oxford, UK, 1997. [Google Scholar]
  47. Venujayakanth, B.; Swaminathan Dudhat, A.; Swaminathan, B.; Ardeshana, N.J. Price integration analysis of major groundnut domestic markets in India. Econ. Aff. 2017, 62, 233–241. [Google Scholar] [CrossRef]
Figure 1. Graph of the performance of the series. DP: date productivity (100 kg/ha). T: temperature in °C. ha: hectare. Source: Drawn by author.
Sustainability 17 04574 g001
Figure 2. Graphical presentation of the variables under study. DP: date productivity (100 kg/ha). P: precipitation (millimeter). Source: Drawn by author.
Sustainability 17 04574 g002
Figure 3. Forecast graph (date productivity (100 kg/ha)). Source: Drawn by author.
Sustainability 17 04574 g003
Table 1. Variables’ descriptions.
VariableUnitSources
Date productivity (DP)(kg/ha)https://www.fao.org/faostat/ar/#data/QCL
(accessed on 10 February 2025)
Annual average temperature°Chttps://climateknowledgeportal.worldbank.org/country/saudi-arabia (accessed on 10 February 2025)
Average precipitationMillimeter
Table 2. Descriptive statistics results.
DPTP
Mean7380.8725.3778.52
Median6595.9025.4474.99
Skewness1.23−0.063.12
Kurtosis3.582.6015.61
Jarque–Bera11.780.32362.49
Probability0.0030.850.000
Observations444444
Source: Data collected and analyzed by the author.
Table 3. Results of unit root test.
Time SeriesIntercept Intercept
and Trend
StationarityIntercept Intercept
and Trend
Stationarity
at Level at First Difference
LDP−1.22−1.59Non-stationary−6.96 *−6.9 *Stationary
LT−0.65−5.95 *Stationary−5.651 *−5.96 *Stationary
Source: Data collected and analyzed by the author. * At 1% level of significance.
Table 4. Co-integration test. Engle–Granger test results with ADF residuals.
LTLDP
LDP−6.81 *
LT −6.81 *
Source: Data collected and analyzed by the author. * Indicates 1% level of significance.
Table 5. Lag selection.
LagLogLLRFPEAICSCHQ
0105.38NA 2.80 × 10⁻⁵−4.81−4.73−4.78
1156.2594.66 *3.16 × 10−6 *−6.99 *−6.74 *−6.90 *
Source: Data collected and analyzed by the author. * LR—sequential modified likelihood ratio (LR) test statistic (each test at 5% level); logL—log lag variable (lag order selected by the criterion); AIC—Akaike information criterion; HQ—Hannan–Quinn information criterion; FPE—final prediction error; SC—Schwarz information criterion; NA—not available.
Table 6. Results of the VECM.
Long-Term Results: LDP (Dependent Variable)Short-Term Results: LDP (Dependent Variable)
Error CorrectionCoefficientt-Value Statistic Coefficientt-Value Statistic
CointEq1−0.08 −1.22
LT(−1)−9.44−1.76
D(LDP(−1)) −0.04−0.27
D(LT(−1)) −0.98−0.97
C21.63 0.020.94
- VECM residual serial correlation LM tests:Lags LM-StatProb
17.200.13
- VEC residual heteroskedasticity tests: Chi-sq 14.99Prob. 0.66
- VEC residual normality tests:Chi-sq 0.58Prob. 0.75
Source: Data collected and analyzed by the author.
Table 7. Results of the unit root test.
Time SeriesInterceptIntercept
and Trend
StationarityInterceptIntercept
and Trend
Stationarity
at Level at First Difference
LDP−1.22−1.59Non-stationary−6.96 *−6.91 *Stationary
LP−2.90−2.77Non-stationary−6.70 *−6.78 *Stationary
Source: Data collected and analyzed by the author. * At 1% level of significance.
Table 8. Co-integration test. Engle–Granger test results for the ADF residuals.
LPLDP
LDP−7.52 *
LP −7.23 *
Source: Data collected and analyzed by the author. * Indicates 1% level of significance.
Table 9. Lag selection.
LogLLRFPEAICSCHQ
024.47NA 0.0012−1.05−0.96−1.02
162.4770.70 *0.00025 *−2.63 *−2.38 *−2.54 *
Source: Data collected and analyzed by the author. * logL—log lag variable; LR—sequential modified likelihood ratio (LR) test statistic (each test at 5% level) (lag order selected by the criterion); AIC—Akaike information criterion; HQ—Hannan–Quinn information criterion; FPE—final prediction error; SC—Schwarz information criterion; NA—not available.
Table 10. Results of the VECM.
Long-Term Results: LDP (Dependent Variable)Short-Term Results: LDP (Dependent Variable)
Error CorrectionCoefficientt-Value Statistic Coefficientt-Value Statistic
CointEq1−0.01 −0.25
LP(−1)−5.10−3.05
D(LDP(−1)) −0.08−0.47
D(LP(−1)) −0.003−0.02
C13.25 0.020.87
- VECM residual serial correlation LM tests:LagsLM-StatProb.
18.460.08
- VEC residual heteroskedasticity tests: Chi-sq 40.96Prob. 0.51
- VEC residual normality tests:Chi-sq 0.58Prob. 0.75
Source: Data collected and analyzed by the author.
Disclaimer/Publisher’s Note: The statements, opinions and data contained in all publications are solely those of the individual author(s) and contributor(s) and not of MDPI and/or the editor(s). MDPI and/or the editor(s) disclaim responsibility for any injury to people or property resulting from any ideas, methods, instructions or products referred to in the content.

