Article

Coupling Coordination of Carbon Cutting, Pollution Reduction, and Economic Growth in China: Spatiotemporal Evolution, Regional Differences, and Influence Factors

School of Economics and Management, Beijing University of Technology, Beijing 100124, China
*
Author to whom correspondence should be addressed.
Sustainability 2025, 17(11), 5052; https://doi.org/10.3390/su17115052
Submission received: 5 March 2025 / Revised: 17 May 2025 / Accepted: 26 May 2025 / Published: 30 May 2025

Abstract

:
Under China’s “dual-carbon” goal, it is necessary to coordinate the relationship between economic growth and emission reduction. Based on the panel data of 30 provinces in China from 2011 to 2021, this paper explores the coordination level among carbon cutting (CC), pollution reduction (PR), and economic growth (EG) by using the coupling coordination degree (CCD) model, a cold and hot spot analysis, and the Dagum Gini coefficient. Furthermore, we analyze the influencing factors of CCD from a spatial perspective using the geographically weighted regression (GWR) model. The results show that the coordination level of CC, PR, and EG in China has continued to improve and entered a moderately coordinated stage. Meanwhile, regional differences are also evident. The eastern region is a high-CCD concentration area, while the northwest and northeast regions are low-CCD concentration areas. However, inter-regional differences in CCD are decreasing. Urbanization, foreign direct investment, and new quality productive forces contribute significantly to achieving synergies among CC, PR, and EG. However, the effect of industry digitization on CCD fails the significance test in most provinces. The effects of the factors on CCD exhibit obvious spatial heterogeneity characteristics. These findings can provide an important basis for the formulation of regionally differentiated green and low-carbon development policies.

1. Introduction

Over the past few decades, China has emerged as the world’s second largest economy, with strong economic development. However, this rapid economic development has been accompanied by a continuous increase in energy demand. With the continuous advancement of industrialization and urbanization, China’s total energy consumption has shown rapid growth, which has resulted in a surge in carbon emissions and environmental pollution problems that have become increasingly prominent [1]. At present, China has become the world’s largest carbon emitter, and its carbon emissions account for about one-third of the global total. To respond to the challenges of global climate change, China has deeply participated in global climate governance and solemnly proposed the strategic goal of a carbon peak by 2030 and carbon neutrality by 2060. This goal signifies that China will face unprecedented pressure to reduce carbon emissions and challenges of transformation.
For domestic environmental governance, although China has achieved remarkable results in the areas of ecological environmental protection and pollution prevention, ecological environmental protection is still facing the dual pressures of structural and root causes. The problems of unbalanced and inadequate development in China still exist. As resource and environmental constraints tighten and the space for emission reduction narrows, the difficulty of sustained improvement in ecological and environmental quality increases. Hence, the task of achieving a green and low-carbon transformation remains arduous.
China’s stable economic growth is an important cornerstone for maintaining social stability and also a key support for enhancing international discourse [2]. However, the increase in energy demand accompanying sustained economic development poses a serious challenge to the realization of the “double carbon” goal. In the face of the dual pressure of ecological environmental protection and carbon neutralization, how to integrate high-quality economic development with high-level protection of the ecological environment has become an important issue for China’s sustainable development. Therefore, there is a necessity to evaluate the coordination level of carbon cutting (CC), pollution reduction (PR), and economic growth (EG); analyze its influencing factors in depth; and thereafter determine the shortcomings in the synergy effort to promote CC, PR, and EG. This aspect will be significant in achieving regional sustainable development.
In this context, based on the panel data of 30 provinces in China from 2011 to 2021, this study systematically examines the spatial and temporal evolution characteristics, regional differences, and impact factors of the coordination levels of CC, PR, and EG by applying the coupling coordination degree (CCD) model, a hot spot analysis, the Dagum Gini coefficient, and the geographically weighted regression (GWR) model. The research results provide a scientific basis and decision-making support for the formulation of differentiated green and low-carbon development policies.
The remainder of this paper is structured as follows: Section 2 provides a literature review; Section 3 describes the theoretical foundations and the research method; Section 4 describes the results and provides a discussion; and Section 5 summarizes the full paper and makes recommendations based on the findings.

2. Literature Review

Research on the interaction between CC, PR, and EG is scarce. Instead, scholars have conducted rich research on the relationship between two subsystems.

2.1. Relationship Between Economic Growth and Environmental Pollution

Scholars generally use the classical theoretical model of the Environmental Kuznets Curve (EKC) to explain the nonlinear dynamic relationship between economic development and environmental pollution [3,4]. Note that EKC theory can only provide a macro description of the environmental–economic relationship but cannot deeply reveal the interaction mechanism between the two systems [5]. For this reason, scholars have introduced the coupling coordination degree (CCD) model to quantitatively assess the coupling coordination level between economic growth and environmental systems [6,7,8]. Relevant studies have shown that the coordinated degree of the environment and economy in China’s Yangtze River Delta region is at an intermediate level [9]. The degree of coordination is affected by multiple factors, such as population size, industrial structure, and degree of openness to the outside world [10]. Other scholars have also explored the issue in depth from the perspectives of specific industries, such as industry, tourism, and fishery [11,12,13].

2.2. Relationship Between Economic Growth and Carbon Cutting

Studies of the relationship between EG and CC can be divided into the following two categories:
First, the long-term dynamic relationship between economic growth and carbon emissions has been deeply explored on the basis of EKC theory. Numerous empirical studies have shown that the relationship between the two aspects is generally an inverted “U”-shaped [14,15]. However, scholars have found a markedly complex correlation pattern with the deepening of research. Some studies have found that economic growth and carbon emissions may exhibit an “N” curve [16,17], while studies on China’s economy zone have revealed a unique inverted “N” shape. Furthermore, empirical data show that China has already crossed the upward inflection point in the curve [18].
The second focuses on the coupling coordination relationship between EG and CC. To explore this topic, researchers usually perform an empirical analysis by constructing a comprehensive evaluation indicator system. For indicator system design, the CC evaluation dimension mainly covers carbon intensity indicators and energy indicators [19,20], while the EG evaluation dimension includes core indicators, such as total economic scale, industrial structure characteristics, and technological innovation [20,21]. The results show that China’s CCD of EG and CC presents significant spatial clustering characteristics [22]. The degree of coordination between EG and CC is relatively high in eastern China [23].

2.3. Synergy Between Carbon Cutting and Pollution Reduction

Systematically examining the completion of pollution and carbon reduction targets in each region can accurately identify the shortcomings of governance and provide a scientific basis for policy optimization. In this context, the synergistic level of CC and PR has received increasing attention from academics [24,25]. Nie and Lee [26] conducted an empirical study and found that China has achieved good synergistic development of CC and PR. A thematic study of the Yellow River Basin has also confirmed that the region has entered a stage of high-quality coordinated development [27]. In-depth studies have shown that socioeconomic factors, such as upgrading of industrial structure, economic development, and transformation of energy structure, have a decisive impact on enhancing the synergistic effectiveness of CC and PR [28,29].

2.4. Relationship Among CC, PR, and EG

Current research on the coupling coordination relationship among CC, PR, and EG still has some limitations. Wang et al. [30] analyzed the time-series evolution of provincial CCD in China but lacked an in-depth exploration of its spatial distribution pattern and regional heterogeneity. Chen et al. [31] constructed an integrated CC-PR system and conducted a systematic study on the coordination of environmental governance and economic development of three major urban agglomerations in China. Lu et al. [32] provided a markedly comprehensive assessment of the coordination degree of China’s economic development, environmental protection, and carbon emissions from an efficiency perspective and conducted a result analysis from the spatial and temporal dimensions.
Existing studies have produced relatively extensive results on the coordination level of CC, PR, and EG, but the following shortcomings remain. (1) Some studies have revealed the spatial differentiation characteristics of coordination levels [32,33], but quantitative characterization of the degree of differences is lacking. Moreover, the reasons for the formation of regional differences are also not revealed. (2) Although existing results identify several key factors [33,34], they fail to deeply analyze their spatial heterogeneity effects. (3) Most of the established studies on the CCD adopt equal parameter settings [7,9,21,22], disregarding the impact of parameter sensitivity on the assessment results.

3. Theoretical Analysis and Research Design

3.1. Theoretical Analysis

(1) The coordination of CC and PR
China’s fossil energy-dominated energy structure determines the homologous characteristics of greenhouse gases and air pollutant emissions, thereby providing a potential basis for synergistic promotion of CC and PR. However, there are significant differences in the synergistic effects generated by different control measures. Current air pollution management mainly relies on end-of-pipe control technologies, while end-of-pipe management technologies, such as CCUS, in the field of carbon emission reduction are not yet mature [35]. This asymmetry in technology pathways leads to the fact that traditional pollution abatement measures can effectively reduce pollutant emissions but have limited contributions to carbon emission reduction. Meanwhile, energy consumption during the operation of pollution control facilities generates additional carbon dioxide emissions, resulting in a negative synergistic effect [36]. By contrast, structural emission reduction measures can achieve markedly significant synergistic benefits through energy structure optimization [37]. This finding highlights the key role of source management. Therefore, to achieve the synergistic effects of CC and PR, the key lies in promoting a shift in the governance paradigm from end-to-end governance to source prevention and control. Deeply adjusting the energy structure and accelerating the development of non-fossil energy development can fundamentally change the dependence of development on fossil energy, thereby achieving green and low-carbon development.
(2) The coordination of CC, PR, and EG
The impact of EG on the synergistic effect of CC and PR presents a nonlinear characteristic, thereby reflecting a dynamic evolution process of inhibition followed by promotion [38]. The early stage of industrialization was dominated by the crude growth model characterized by high energy consumption and high emissions [39]. The large-scale industrial production led to a surge in energy consumption, and pollutant and carbon emissions continued to increase, resulting in a serious imbalance between development and emission reduction. This situation has shifted with the advanced stage of economic development. Improvements in economic level have prompted additional capital investments in energy conservation and environmental protection and green technology innovation, which can provide a solid material foundation and technical support for CC and PR.
The setting of targets for CC and PR will likewise have an impact on economic development. In the short term, the implementation of emission reduction policies may have a certain negative impact on economic growth [40,41]. However, from the perspective of long-term development, a significant synergistic effect exists among CC, PR, and EG. On the one hand, the rigid constraints of CC and PR targets promote the green transformation of traditional industries and force the optimization and upgrading of industrial structures. On the other hand, this process gives rise to new industries characterized by high technology and low emissions, cultivates green economic growth points, and injects new kinetic energy into high-quality economic development. This dynamic equilibrium relationship reveals the internal mechanism by which environmental governance and economic development move from conflict to a win–win situation.

3.2. Research Area

Based on the data from 30 provinces in China, excluding Hong Kong, Macao, Taiwan, and Tibet, we investigated the coordination level of CC, PR, and EG. To discuss the regional differences in CCD, the 30 provinces are grouped into the three regions, as shown in Figure 1.

3.3. Evaluation Indicators and Data Sources

3.3.1. Evaluation Indicators

Carbon emissions are inextricably linked to energy consumption. Reducing energy intensity has been proven to be one of the effective ways to control carbon emissions [42]. Meanwhile, forest resources and urban green spaces in the ecosystem also play an important carbon sink function [43]. Therefore, this study integrates carbon sources and carbon sinks into a unified assessment framework and constructs a carbon reduction evaluation indicator system. This indicator system includes core indicators, such as carbon emissions, carbon intensity, energy intensity, energy structure, forest coverage, and urban green space area.
The evaluation indicators for pollution reduction mainly include two categories: pollutant emission and environmental governance indicators. Pollutant emission indicators cover the emissions of major air pollutants (e.g., SO₂, NOx, and PM) and water pollutants (e.g., COD and NH3-N) [44]. Environmental governance indicators can be characterized by specific indicators, such as the comprehensive utilization rate of solid waste, rate of harmless treatment of municipal garbage, and proportion of environmental governance investment in gross domestic product (GDP) [45]. Increasing environmental governance investment can effectively promote the construction of pollution control facilities, thereby significantly reducing pollutant emissions [46].
Economic growth encompasses the expansion of economic aggregates and improvements to the quality of development. In measuring economic aggregates, GDP is the most commonly used core indicator [47]. Economic development level is usually reflected through such indicators as per capita GDP and per capita disposable income [48]. The quality of development is reflected in industrial structure optimization and innovation-driven capacity. The ratio of value added of secondary and tertiary industries is an important indicator to characterize the industrial structure [49]. Technological innovation, as a key factor driving economic growth, is usually measured by the proportion of research and development (R&D) expenditure to GDP [50].
Specific indicators are detailed in Table 1. The indicators are categorized into two, namely, positive and negative indicators, according to whether the indicator growth is beneficial to CC, PR, or EG. Indicators favorable to CC, PR, and EG are positive indicators; the higher the value, the better. Conversely, those unfavorable are negative indicators; the lower the value, the better. Indicators in existing studies, such as the proportion of secondary industry, carbon emissions, energy consumption, and pollutant emissions, are usually used as negative indicators; meanwhile, such indicators as GDP, investment in environmental management, technological innovation, and forest cover rate are usually used as positive indicators [27,31,48,49,51].

3.3.2. Data Sources

Energy data were acquired from the China Energy Statistics Yearbook. Environment data were obtained from the China Environment Statistics Yearbook. The data related to macroeconomic and technological innovation indicators were obtained from the China Statistics Yearbook. The carbon emissions were from the Carbon Emission Accounts and Database (CEAD). The database is currently updated until 2021. China has started to publish NOx emission data since 2011. To ensure the completeness of the study data, the sample period was determined as 2011–2021 in this study. Individual missing data were filled in using linear interpolation.

3.4. Research Method

3.4.1. Data Treating

Some outliers may exist in this study, given that the current research covers cross-regional data from 2011 to 2021 (total of 11 years). However, these outliers are real data reflecting the local environmental and economic development trajectory or special event shocks, which are of analytical value. Therefore, outliers are retained in this study. To eliminate the influence of the unit and order of magnitude on the evaluation results, this research adopts the extreme value method to standardize the indicators. The extreme value method is as follows:
For positive indicators:
y i j t = [ x i j t min x i ] / [ max x i min x i ]
For negative indicators:
y i j t = [ max x i x i j t ] / [ max x i min x i ]
where xijt and yijt represent the raw value and normalized value of the indicator i of province j in t year, respectively.

3.4.2. Entropy Weight Method

This paper used the entropy weighting method to determine the weights of the indicators and measured the carbon cutting index (CCI), pollution reduction index (PCI), and economic growth index (EGI).
The weight of indicator i can be determined as follows:
e i = j = 1 n t = 1 m p i j t ln p i j t / ln n m
p i j t = y i j t / j = 1 n t = 1 m y i j t
w i = 1 e i / s i e i
If p i j t = 0 , it follows that p i j t ln p i j t = 0 .
Based on yi and wi, CCI, PRI, and EGI can be measured by Equation (6). Ui represents CCI, PRI, and EGI, respectively.
U i = i = 1 k y i × w i

3.4.3. Coupling Coordination Degree Model

The coupling coordination degree (CCD) model is a widely used analytical tool for evaluating coordination relationships among multiple systems [45]. For a ternary system, the model is constructed as follows:
C = CCI × PRI × EGI CCI + PRI + EGI / 3 3 1 / 3
T = α CCI + β PRI + δ EGI
D = C × T
The coordination degree D is an important indicator for measuring the coordination level of system, the value of which ranges from 0 to 1. The larger the value of D, the higher the coordination degree of the system. C is the coupling degree, and T is the comprehensive index. The calculation of T involves certain coefficients to be determined, α , β , and δ (which need to satisfy the requirement that α + β + δ = 1 ). In existing studies, the coefficients of α , β , and δ are treated as equal values [33,51].
Referring to Nie and Lee [26], the coordination level can be classified into ten main categories, which are detailed in Figure 2.

3.4.4. Cold and Hot Spot Analysis

The Getis-Ord G* index is a local spatial statistic used to identify spatial hot spots (high value clusters) and cold spots (low value clusters). Getis-Ord G* can be expressed as follows:
G i ( d ) = j = 1 n w i j ( d ) x j j = 1 n x j
where wij is the spatial adjacency matrix; xj is the CCD of the jth province; and n is the number of observed provinces.
The statistical significance can be tested by the Z-value [52].
Z ( G i ) = G i E ( G i ) V a r ( G i )
E ( G i ) is the mathematical expectation. V a r ( G i ) is the variance.
According to the Z-value, the study area can be classified into hot or cold spots. When the Z-value is significantly positive, the area is recognized as a hot spot; on the contrary, it is a cold spot. Depending on the significance level of the Z-value, hot spots (cold spots) can be categorized into high-significance hot spots (cold spots) (99%), medium-significance hot spots (cold spots) (95%), and low-significance hot spots (cold spots) (90%) [22].

3.4.5. Dagum Gini Coefficient

The Dagum Gini coefficient is an effective tool for measuring regional disparities. This method, compared with the traditional Gini coefficient, is effective in identifying the sources of overall disparities and overcoming the sample overlap problem [53]. Assuming that the n provinces are divided into k regions, the total Gini coefficient can be expressed as follows:
G = j = 1 k h = 1 k i = 1 n j r = 1 n h y j i y h r / 2 n 2 y ¯
where G is the total Gini coefficient, reflecting the overall differences in CCD. y ¯ is the average CCD for all provinces. j and h refer to a certain region, which contains nj and nh provinces, respectively. yji and yhr refer to the CCD of province i and province r in the j and h regions, respectively.
Dagum [54] decomposed the total Gini ratio as follows:
G = G w + G n b + G t
where Gnb is the inter-group difference, expressing the gaps between regions. Gw is the intra-group difference, reflecting the gaps within a region. Gt presents the intensity of transvariation caused by the cross terms between regions. In this study, the cross term is the fact that the CCD of some high-level coordination provinces in a region with low CCD is greater than that of some low-level coordination provinces in the region with high CCD.
The following are the decomposition steps of the Dagum Gini ratio:
G w = j = 1 k G j j p j s j
G j j = i = 1 n j r = 1 n j y j i y h r / 2 n j 2 y j ¯
G n b = j = 2 k h = 1 j 1 G j h p j s h + p h s j D j h
G j h = i = 1 n j r = 1 n h y j i y h r / n j n h y j ¯ + y h ¯
G t = j = 2 k h = 1 j 1 G j h p j s h + p h s j 1 D j h
D j h = d j h p j h / d j h + p j h
d j h = 0 d F j y 0 y y x d F h x
p j h = 0 d F h y 0 y y x d F j x
pj and sh can be represented as p j = n j / n and s h = n h y h ¯ / n y ¯ , respectively.

3.4.6. Geographically Weighted Regression Model

The geographically weighted regression (GWR) model is a local regression analysis method based on the assumption of spatial non-stationarity. The method breaks through the global consistency limitation of the traditional ordinary least squares (OLS) regression model by introducing a spatial weighting function that allows the regression coefficients to vary with spatial location. The basic mathematical expression of the GWR model is as follows:
y i = β 0 u i , v i + k = 1 p β k u i , v i x i k + ε i
where yi is the CCD of i province; u i , v i is the spatial coordinate of i province; β k u i , v i is the regression coefficient; xik is the kth explanatory variable for i province; and ε i is the error term.
The spatial weight matrix is the core component of the GWR model. In this study, a Gaussian weight function with good smoothing properties was used to construct the spatial weight matrix. In terms of the bandwidth parameter, the corrected Akaike information criterion (AICc) is used to adaptively determine the optimal bandwidth to avoid the overfitting problem.
This paper examines the influencing factors of the coupling coordination of CC, PR, and EG from six aspects—urbanization process (URB), government intervention (GOV), population size (POP), foreign direct investment (FDI), industrial digitalization (DIG), and new quality productive forces development—to reveal the differentiation formation mechanism of CCD. The description and measurement indexes of each variable are listed in detail in Table 2.

4. Results and Discussion

4.1. Spatial–Temporal Evolution Characteristics of CCD

4.1.1. Temporal Characteristic Analysis of CCD

The CCD in China and the three regions from 2011 to 2021 is shown in Table 3. In the sample period, China’s CCD shows a continuous growth trend, increasing from 0.590 to 0.742, indicating that China’s coordination level of CC, PR, and EG has achieved a transition from primary to intermediate coordination. At the regional level, the CCD of the three regions maintains a steady upward trend. The CCD of the eastern region, as a leading development region, increases from 0.653 to 0.791, taking the lead in reaching the intermediate coordination level. The performance of the central and western regions is also outstanding, with CCD increasing from 0.553 and 0.553 to 0.722 and 0.708, respectively. The central and western regions successfully achieve a leap from basic to intermediate coordination.

4.1.2. Spatial Distribution Analysis of CCD

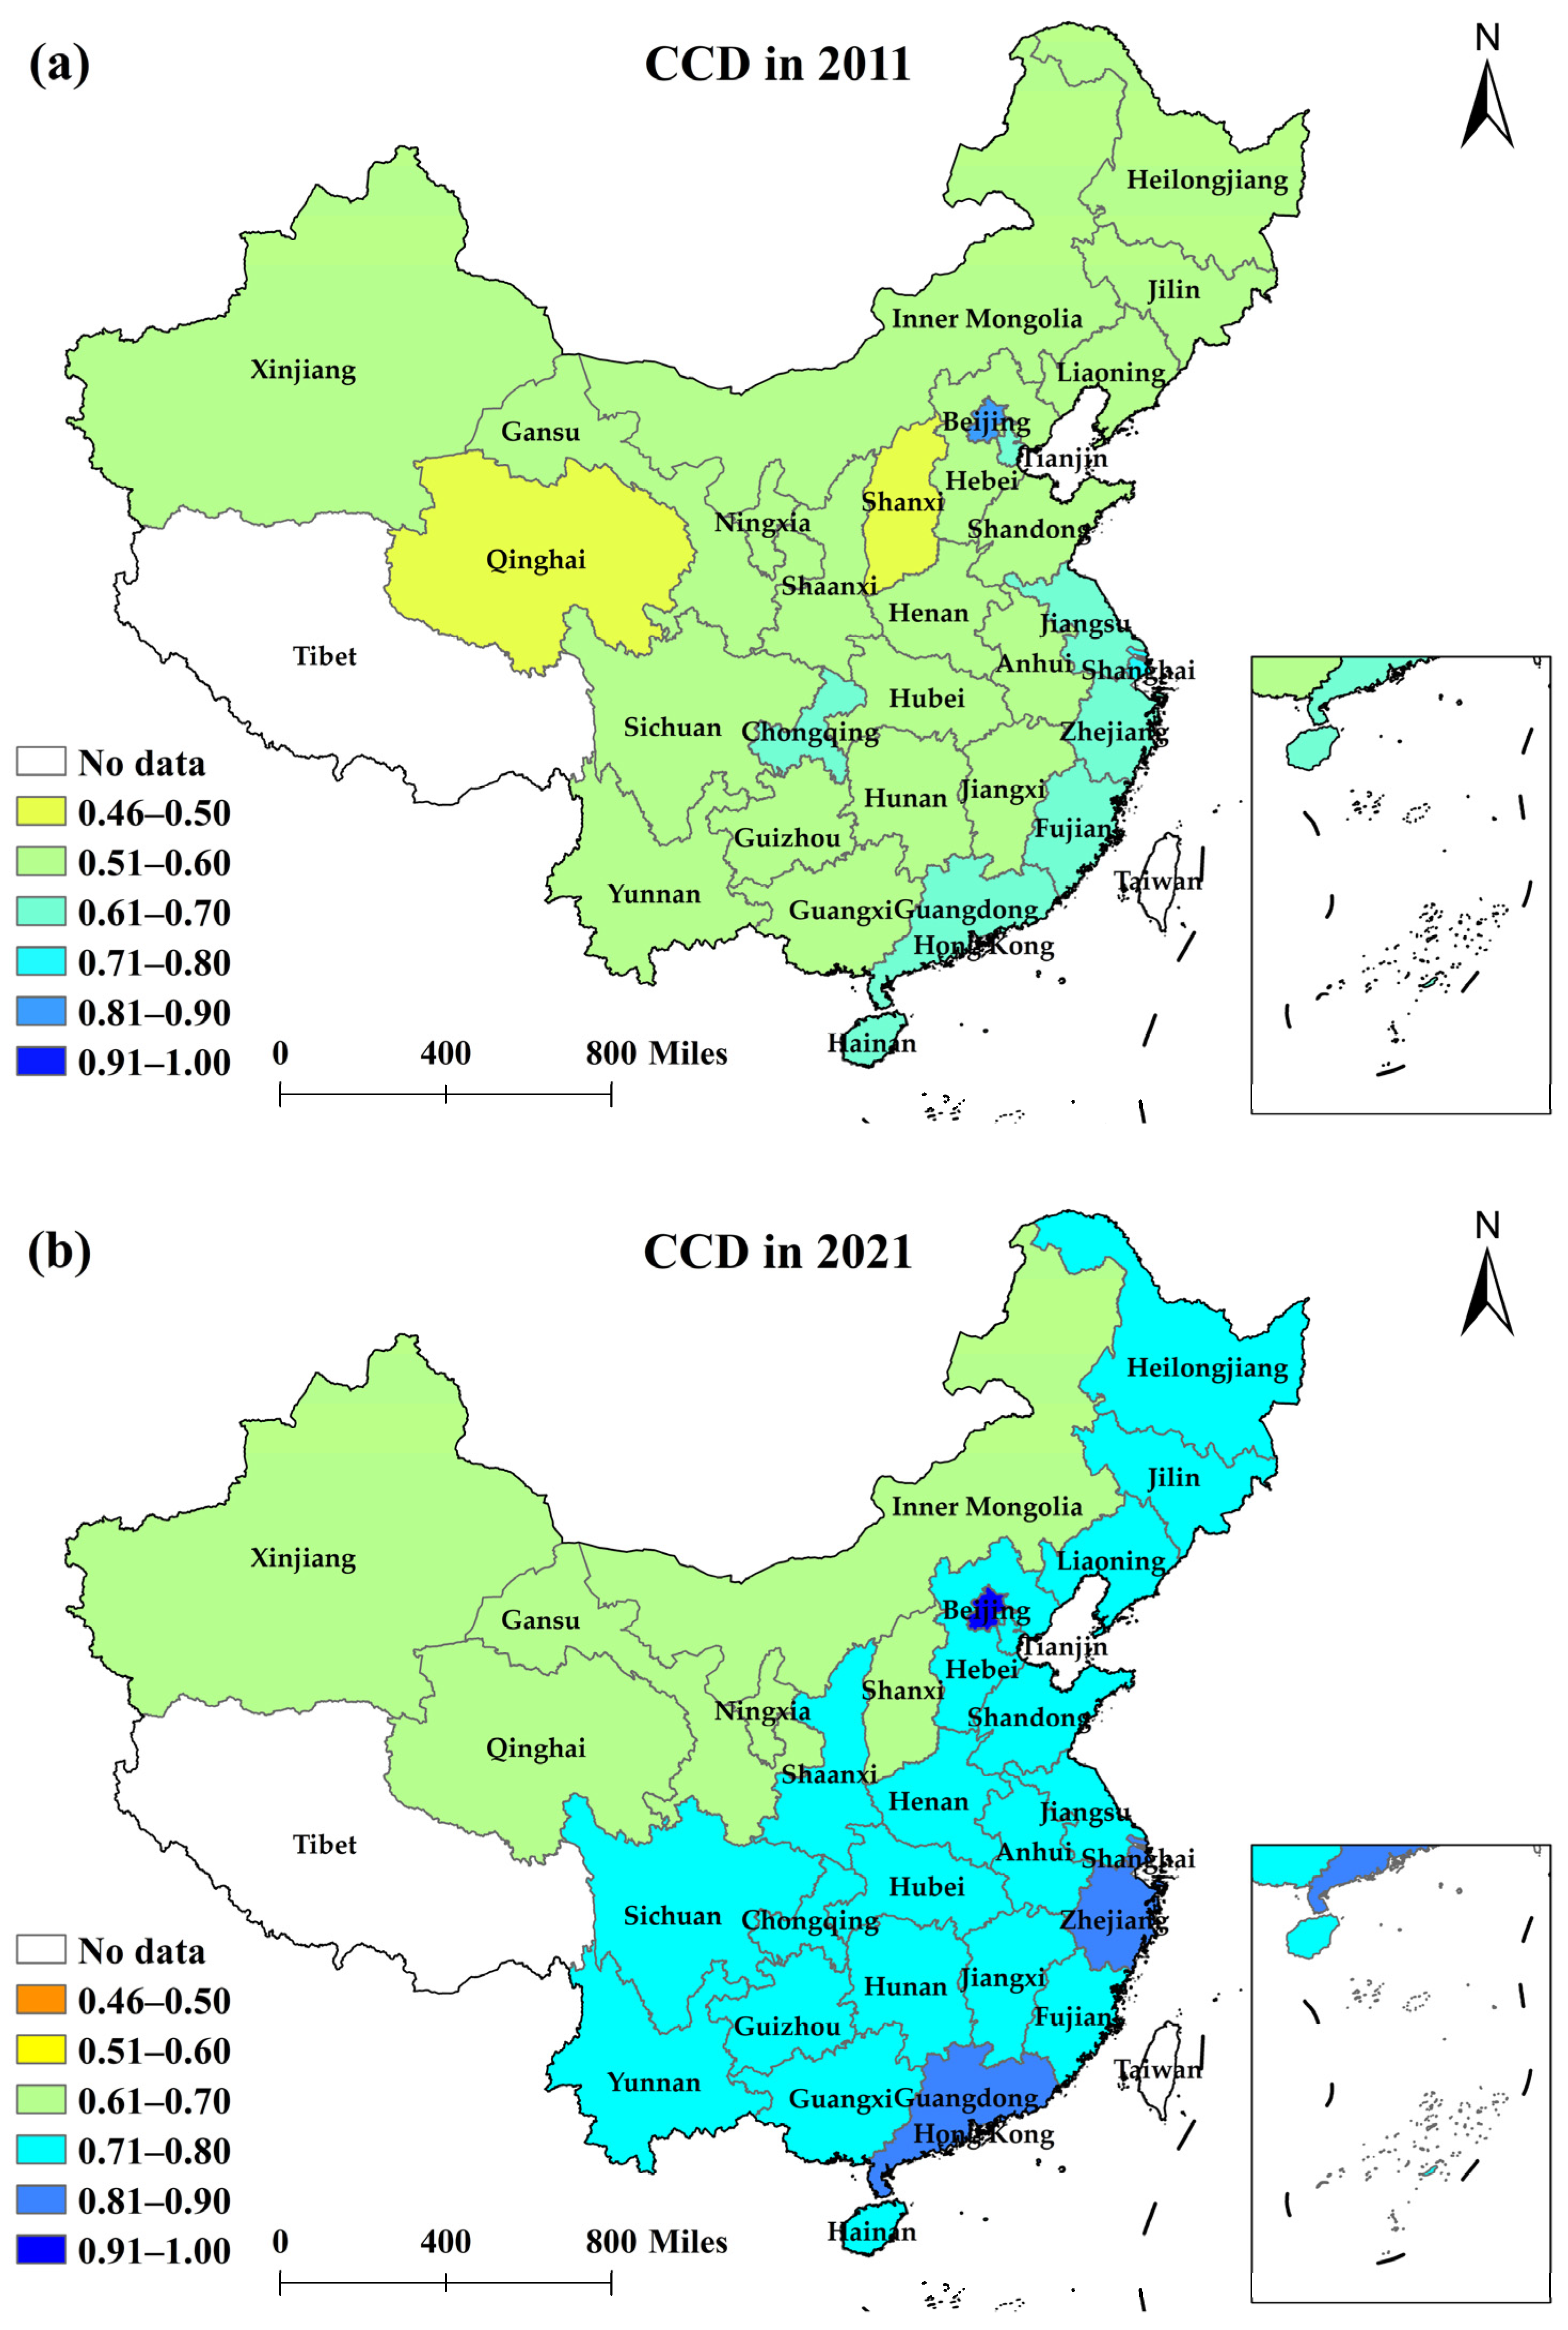
Based on the ArcGIS 10.6 software, we visualized the spatial distribution pattern of CCD in China in 2011 and 2021, as shown in Figure 3. From 2011 to 2021, the CCD of all 30 provinces increased. The number of provinces at the level of primary and medium coordination shows a significant increase, indicating that each province has achieved substantial progress in the synergistic promotion of CC, PR, and EG.
In 2011, over 60% of provinces were at the barely coordinated stage. Most provinces in the eastern region entered the elementary coordination stage, while Shanxi and Qinghai Provinces were on the edge of being uncoordinated. Shanxi Province, as a traditional heavy industry base, has high energy consumption and high emission characteristics of its pillar industries, thereby leading to prominent contradictions between economic development and emission reduction targets. Although Qinghai Province has achieved remarkable results in carbon and pollution reduction, the relative lag in economic development has resulted in an evident imbalance between environmental protection and economic growth.
In 2021, all 30 provinces in China have achieved a primary or higher level of coordination. Beijing’s CCD topped the national list, reflecting that its carbon and pollution reduction and economic growth have formed an ideal pattern of positive interaction and perfect coordination. Beijing, as the national capital, relying on its strong economic foundation and excellent environmental governance capacity, has taken the lead in achieving the decoupling of economic growth and carbon emissions [55,56]. Zhejiang and Guangdong achieved a well-coordinated level, which benefits from their substantial economic strength and the vigorous development of emerging strategic industries. By contrast, Shanxi and provinces in Northwest China have relatively low CCD and are currently in an elementarily coordinated stage. These provinces (excluding Qinghai), as important energy bases in China, have long been dominated by coal in their energy structure, leading to high carbon emissions and prominent environmental problems. These provinces, restricted by the dual constraints of a biased industrial structure and a single energy structure, still face serious challenges in balancing emission reduction targets with development needs.
Overall, CCD in China is characterized by a high distribution in the east and a low distribution in the northwest. This finding is consistent with that of Lu et al. [32]. The formation of this distribution pattern is related to the regional development mode and resource endowment. The eastern region is ahead of other provinces in terms of economic scale, technical level, and environmental management [57,58,59]. Abundant capital accumulation and advanced technology provide continuous power for industrial transformation and upgrading. By contrast, northwestern provinces are relatively lagging behind in the economic development stage and lack technological innovation capacity. These disadvantages lead to low energy utilization efficiency and high carbon emission intensity, thereby restricting the coordinated development of CC, PR, and EG.

4.2. Spatial Agglomeration Characteristics of CCD

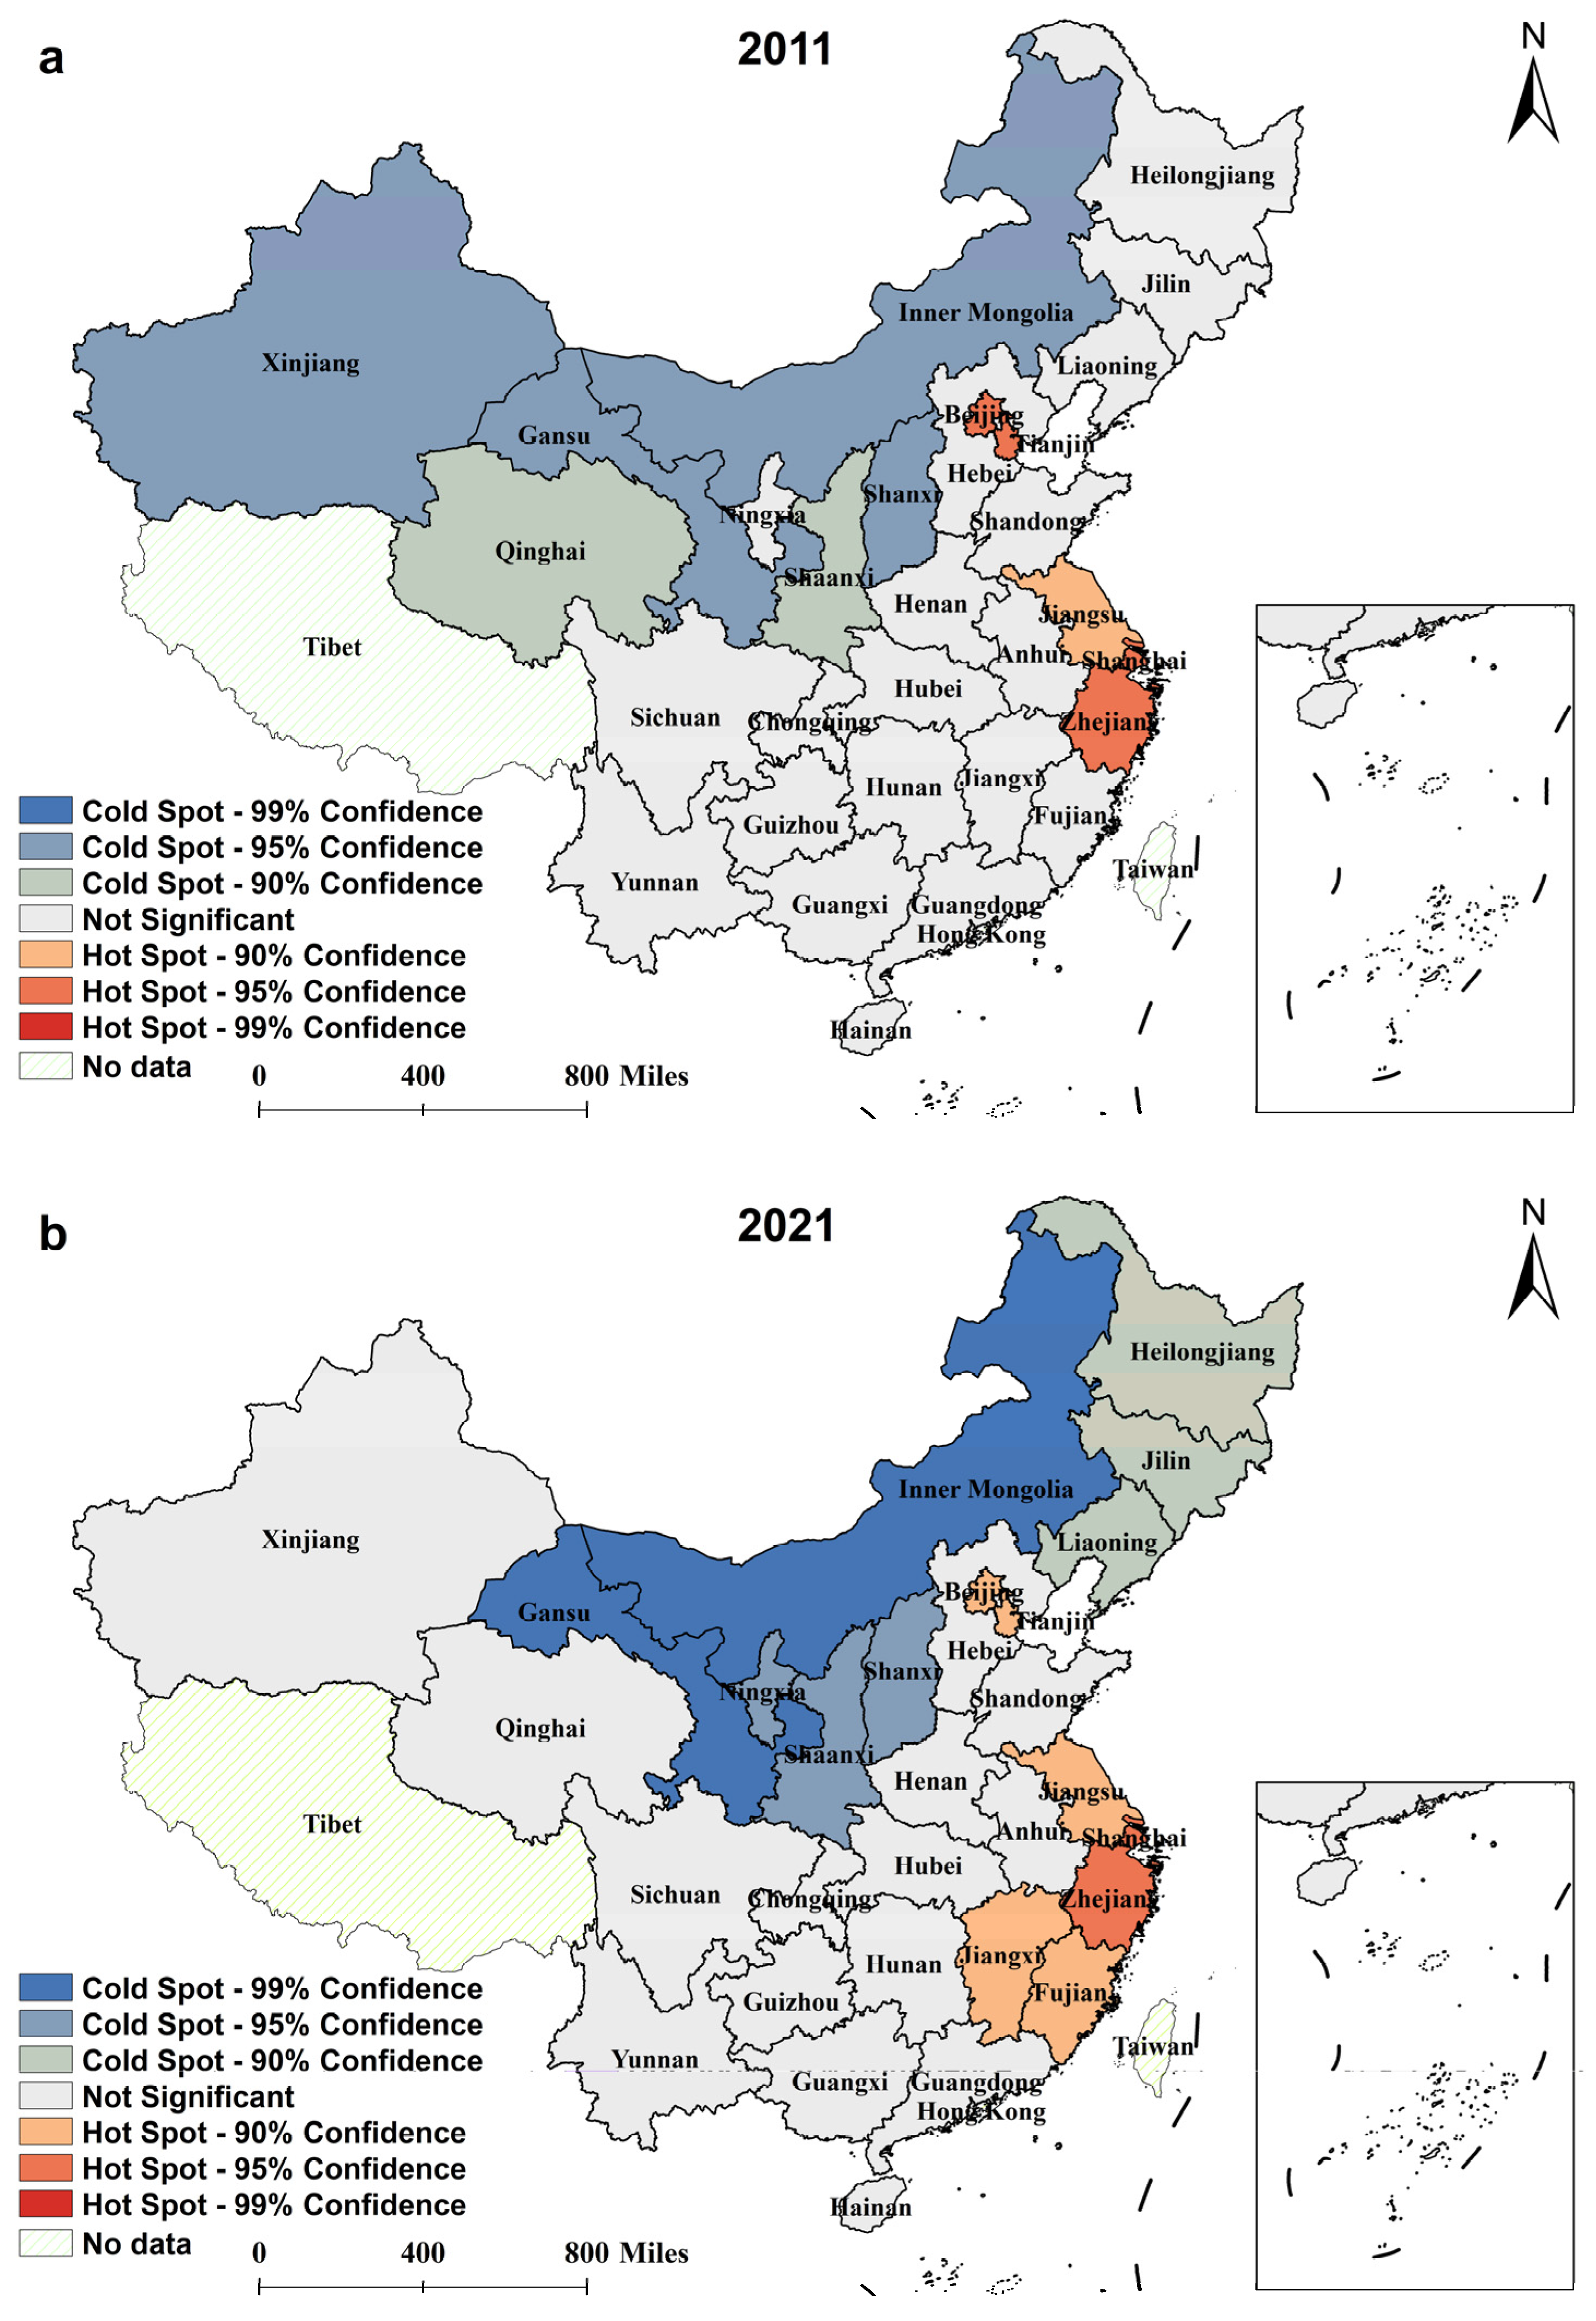
The spatial clustering characteristics of CCD were investigated using the hot spot analysis tool in ArcGIS 10.6 software. The results show that the number and spatial distribution of hot and cold spots present spatio-temporal heterogeneity from 2011 to 2021 (Figure 4). In 2011, five hot spots and six cold spots were identified in the study area. The hot spots were concentrated in the eastern region, forming a significant spatial agglomeration. The cold spots mainly appeared in the northwest region and Shanxi. By 2021, the number of hot spots increased to seven, comprising two medium-significance hot spots and five low-significance hot spots. Spatial distribution showed an evolutionary trend of expansion in the southeast and penetration in the center, forming a hot spot concentration zone in the southeast coastal provinces. The number of cold spots increased to eight. Two highly significant cold spots were located in Inner Mongolia and Gansu. Three medium-significance cold spots clustered in Shanxi, Shaanxi, and Ningxia. In the northeast, three low-significance cold spots were distributed, showing group distribution characteristics.
The distribution patterns of cold spots and hot spots are highly consistent with the distribution characteristics of low and high CCD values. In particular, the southeastern coastal provinces have the advantages of green competitiveness and high-quality development [48,60]. These advantages exhibit high CCD themselves and also have a positive radiation effect on the neighboring regions, resulting in the formation of high-CCD agglomeration areas. This phenomenon corroborates with the findings of Sun et al. [22]. By contrast, the northeast region and resource-based provinces, such as Shanxi, Inner Mongolia, and Shaanxi, face more severe challenges in green and low-carbon transformation, resulting in the formation of an obvious low-CCD cold spot agglomeration.

4.3. Regional Differences in CCD

4.3.1. The Total Difference and Its Sources

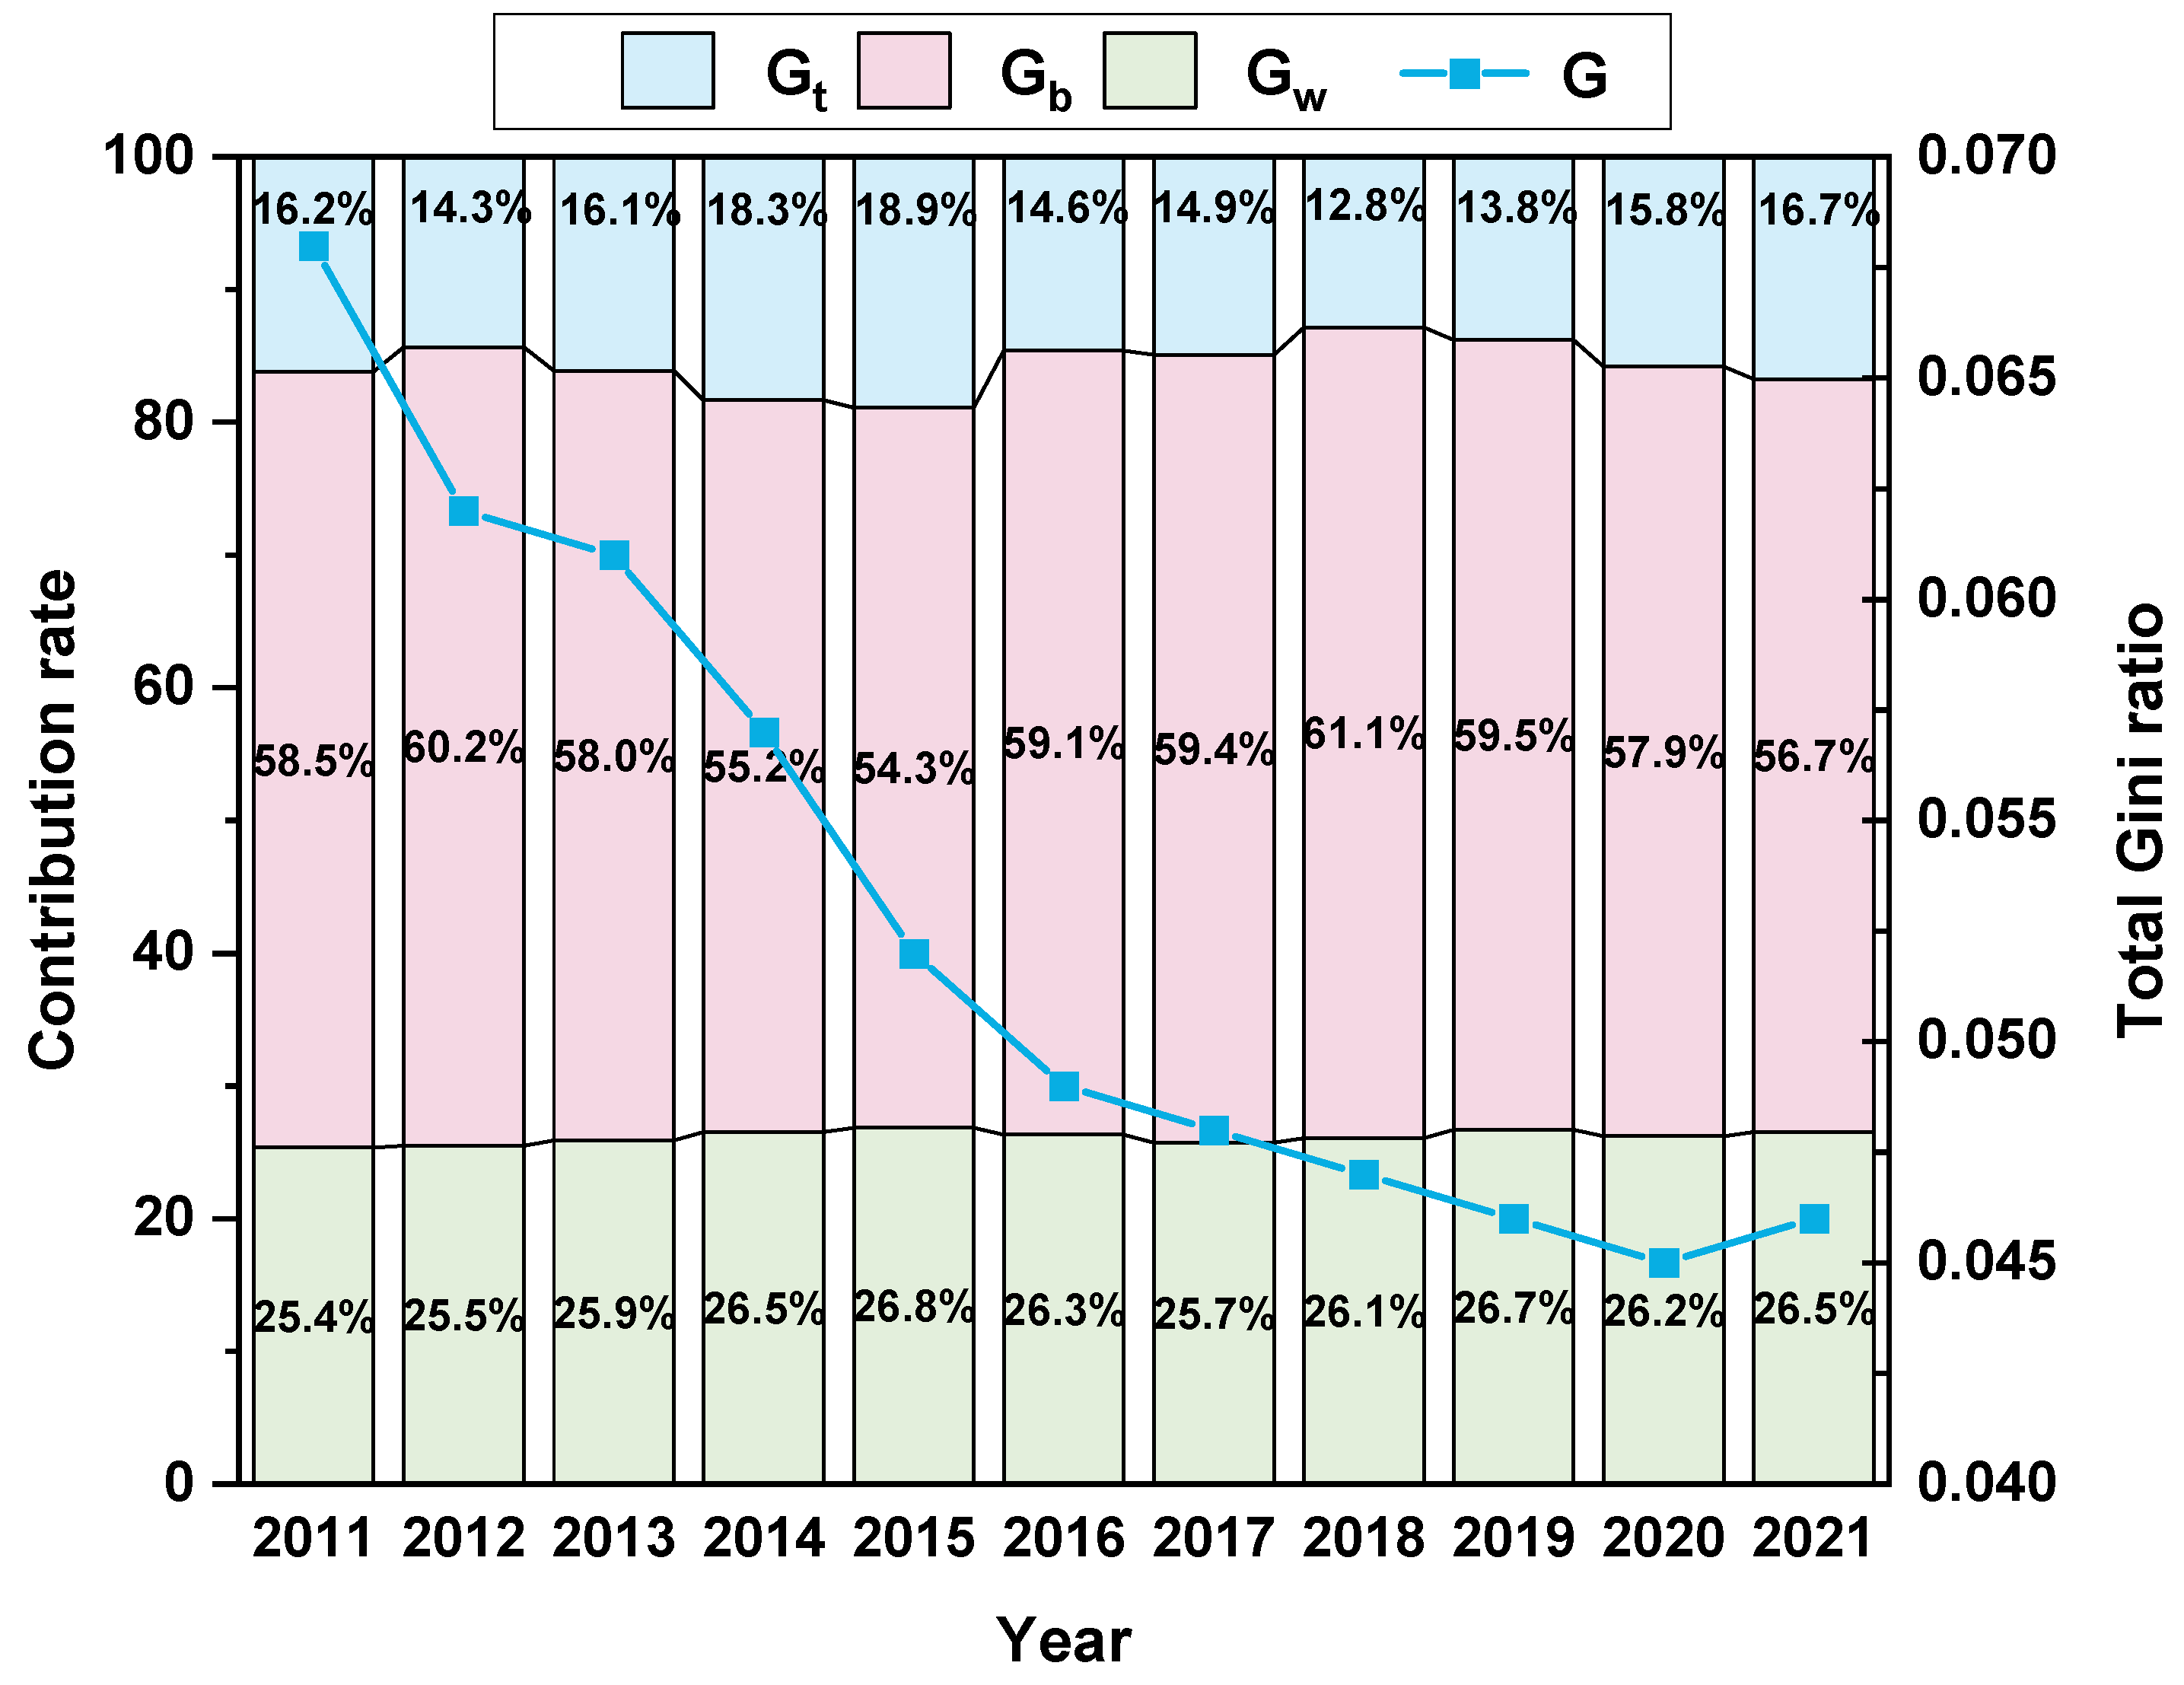
As shown in Figure 5, the total difference in CCD among Chinese provinces during the study period shows two features. First, the total difference gradually decreases. The total Gini coefficient decreases significantly from 0.068 to 0.046, a decrease of 32.4%. A probable reason is that provinces with lower CCD have achieved a rapid increase in sustainability through the implementation of more stringent environmental regulation policies. This finding corroborates the empirical results of higher growth rates in lower CCD provinces. Second, overall differences show an accelerated reduction in 2011–2016. This phenomenon may be closely related to the policy implementation of the Air Pollution Prevention and Control Action Plan. Existing studies confirm that the implementation of this policy significantly enhances the synergistic effect of pollution and carbon reduction [61].
Looking at the contribution rates of the three decomposition terms, interregional differences are the main source of the overall differences, with an average contribution rate of 58.2%, followed by intra-regional differences (26.5% on average). Meanwhile, the intensity of transvariation has a relatively minimal contribution, with a contribution rate of 15.7%. The variation trend indicates that the contribution rate of inter-regional shows a fluctuating downward trend, while the contribution rate of intra-regional continues to increase. In addition, the phenomenon of lower contribution of intensity of transvariation coincides with the characteristics of the spatial distribution of CCD in China. That is, provinces with high CCD tend to be distributed within a region. Therefore, strengthening regional cooperation and narrowing regional development gaps will effectively enhance the overall coordination level of CC, PR, and EG in China.

4.3.2. Intra-Regional Differences

According to Figure 6, the intra-regional differences exhibit two distinctive features. First, all internal differences of the three regions show a narrowing trend. The Gini coefficient in the eastern region continues to decrease after reaching a peak in 2014. The Gini coefficient in the central region showed a fluctuating decline from 0.037 to 0.029. Moreover, intra-regional differences in the western region are characterized by a decline and then an increase, but the overall trend of narrowing is still maintained. Second, in a horizontal comparison, the Gini coefficient of the eastern region always tops the list, reflecting obvious differences in CCD among the provinces in the region. This difference may stem from the unevenness of economic development within the eastern region. By contrast, the central region exhibits minimal regional differences and shows good prospects for coordinated development. This finding may be attributed to similar ecological conditions and markedly small economic development gaps among the provinces in the region.

4.3.3. Inter-Regional Differences

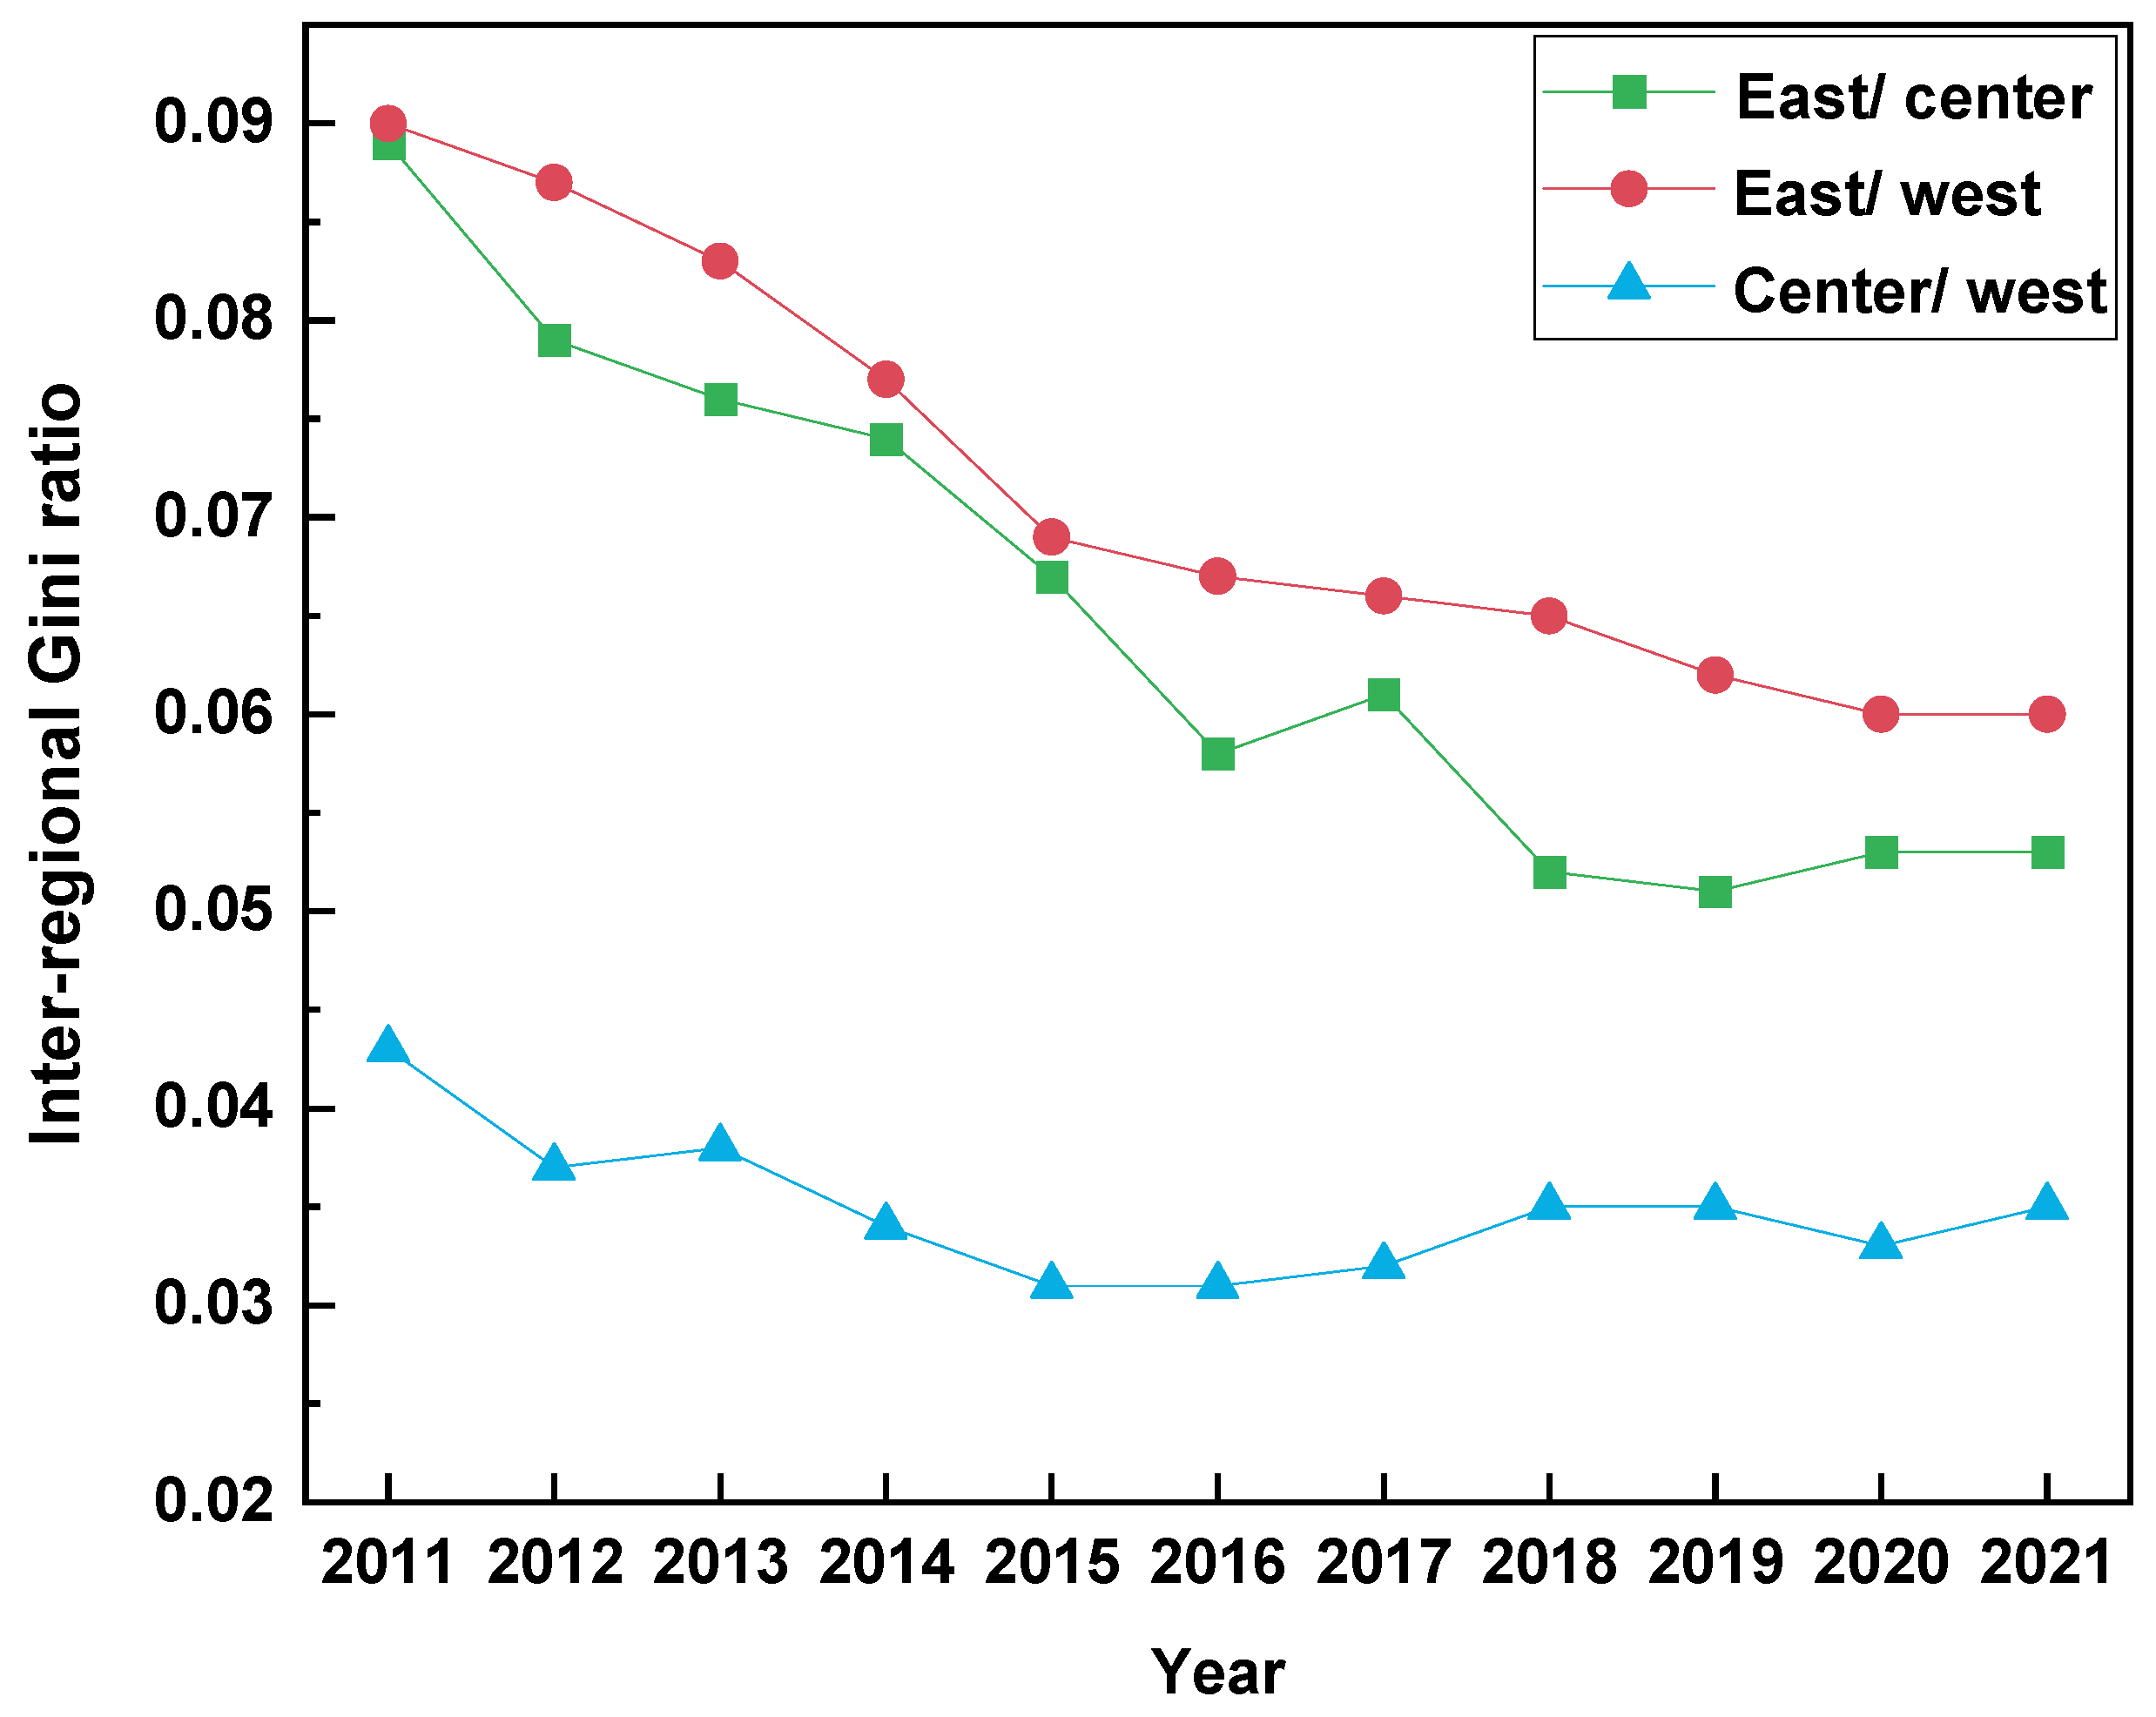
As shown in Figure 7, the differences between the eastern and western regions during the sample period are the most prominent (with an average Gini coefficient of 0.071), followed by the eastern and central regions (0.065). Meanwhile, the difference between the central and western regions is relatively minimal (0.033). The results indicate that there are large gaps between the eastern region and the other two regions in the coordination level of CC, PR, and EG, while the central and western regions show a relatively balanced character.
From 2011 to 2021, the differences in CCD among the three major regions have narrowed. In particular, gaps between the eastern and central and western regions have narrowed most significantly (by 40.4% and 33.3%, respectively). The gradual narrowing of the regional gaps is mainly caused by two aspects. First, technological innovation has a significant spillover effect on carbon emission reduction [62,63], thereby enabling central provinces to fully benefit from the pioneering advantages and development dividends of the eastern region. Second, the Chinese government has always taken coordinated regional development as an important strategic policy. The implementation of the strategy for the emergence of the central region and the western development strategy has effectively promoted balanced development and narrowed the economic gaps between regions. Critical projects, such as the West–East Natural Gas Transmission and West–East Power Transmission, have strongly promoted the transformation of energy resource advantages into economic development advantages and accelerated the construction of the new energy system in the western region. In particular, the national industrial transfer guidance policy introduced in 2014 has promoted the transfer of industries from east to west in an orderly manner. This transfer has broadened the employment space and injected new momentum into green development in the western region.

4.4. Spatial Heterogeneity Analysis of Influencing Factors

4.4.1. Explanatory Variable Selection

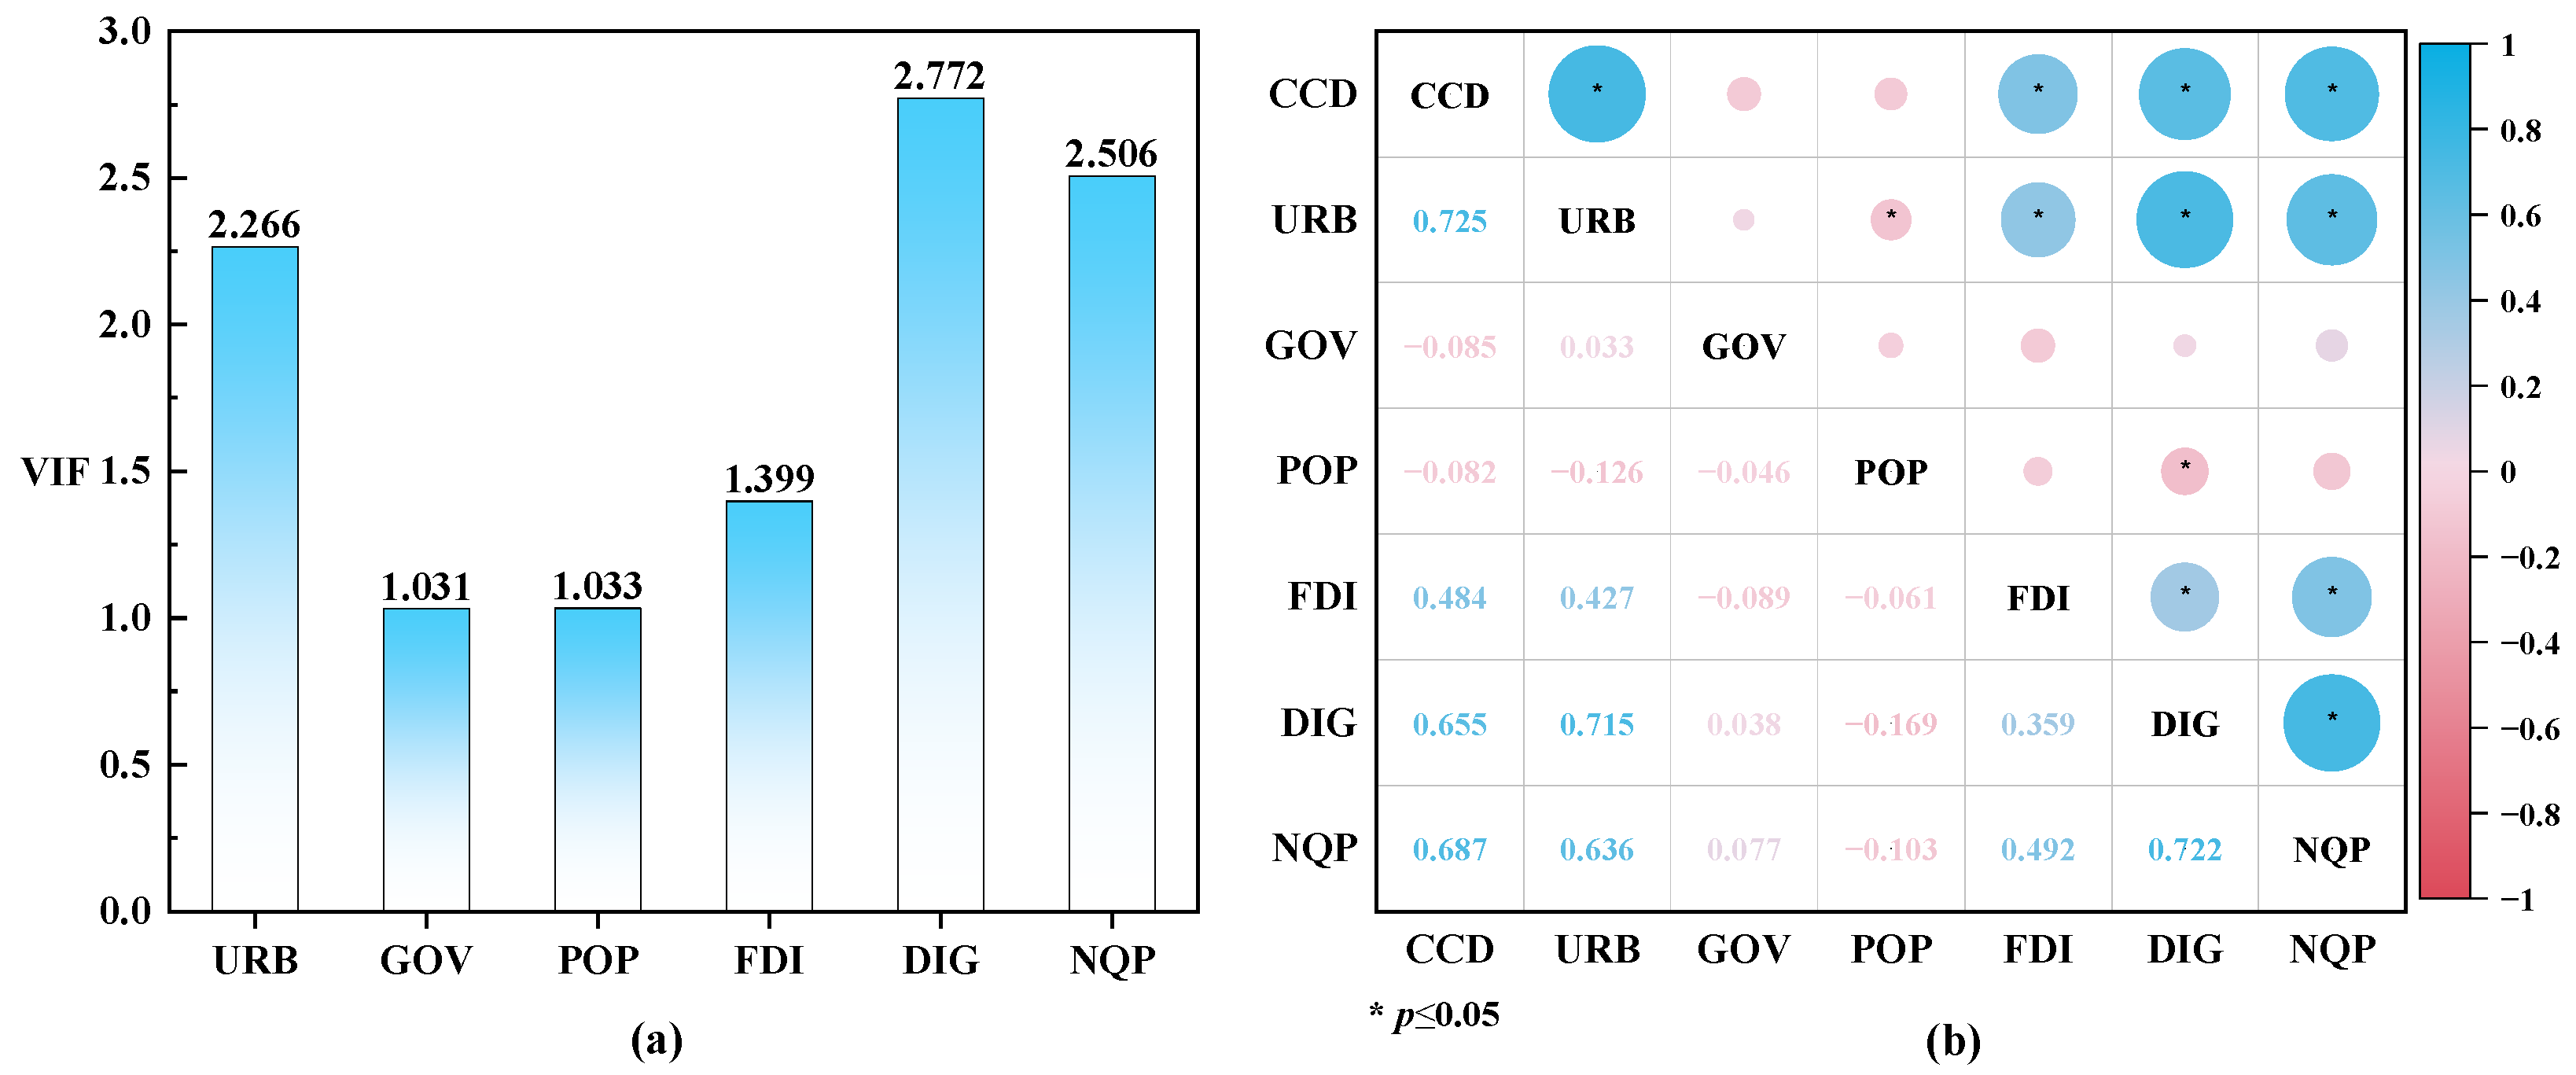
The cold and hot spot analysis result shows that CCD exhibits significant spatial clustering characteristics in China, which provides the necessary preconditions for the construction of the GWR model. Before the regression analysis, we first standardized the variables with z-score using SPSS Statistics 26 software to eliminate the influence of the differences in units on the regression results. Subsequently, a multicollinearity test was conducted, and the results show (Figure 8a) that the variance inflation factor (VIF) of each variable is below the critical value of 10. This finding indicates no multicollinearity problem among the selected variables. Thereafter, we performed a Pearson correlation analysis (see Figure 8b) and found that GOV and POP do not show a significant correlation with CCD and are, therefore, excluded. Furthermore, the OLS regression analysis results show that the remaining variables pass the significance test, as shown in Table 4.
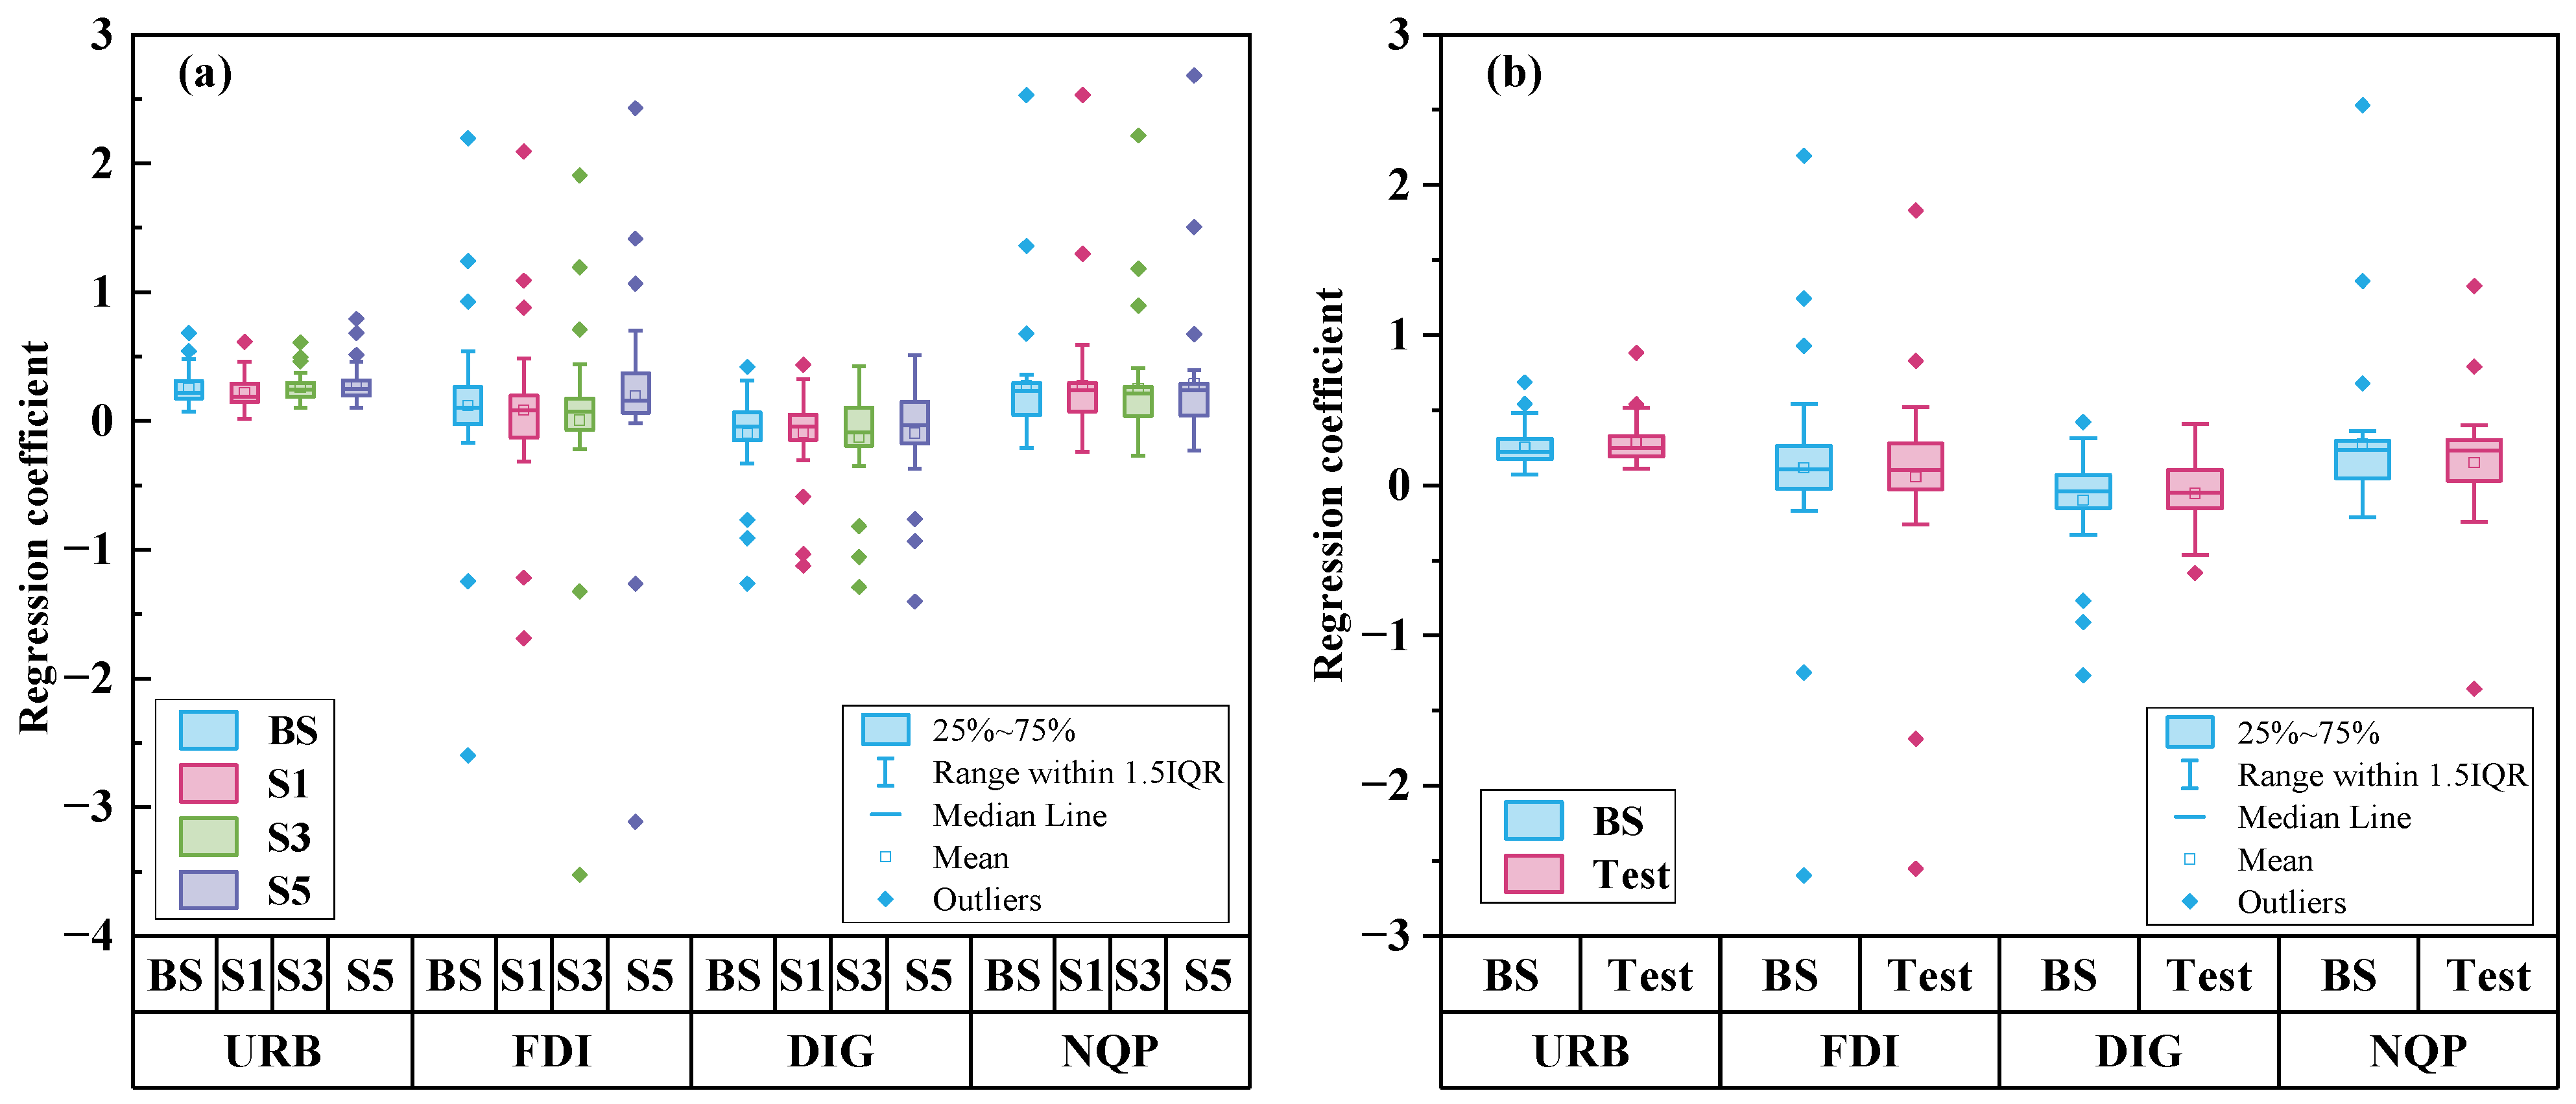
On the basis of the preceding analysis, URB, FDI, DIG, and NQP were eventually selected as the core explanatory variables in this study, focusing on the spatial heterogeneity of their impact on the synergy levels of CC, PR, and EG. The GWR model was performed based on the ArcGIS 10.6 platform. The parameter estimation results of the GWR model are shown in Table 4 The R2 and adjusted R2 of the GWR model are significantly improved compared with the OLS model, and the value of AICc is significantly reduced, indicating that the GWR model fits better than the OLS model.

4.4.2. Regression Result

To further test the regression effect of the GWR model, we performed a spatial autocorrelation test on the regression residuals (Table 5). The test results show that the residuals are not characterized by significant spatial autocorrelation (p > 0.05) and conform with the conditions of random distribution. This result confirms that the GWR model has an excellent fit.
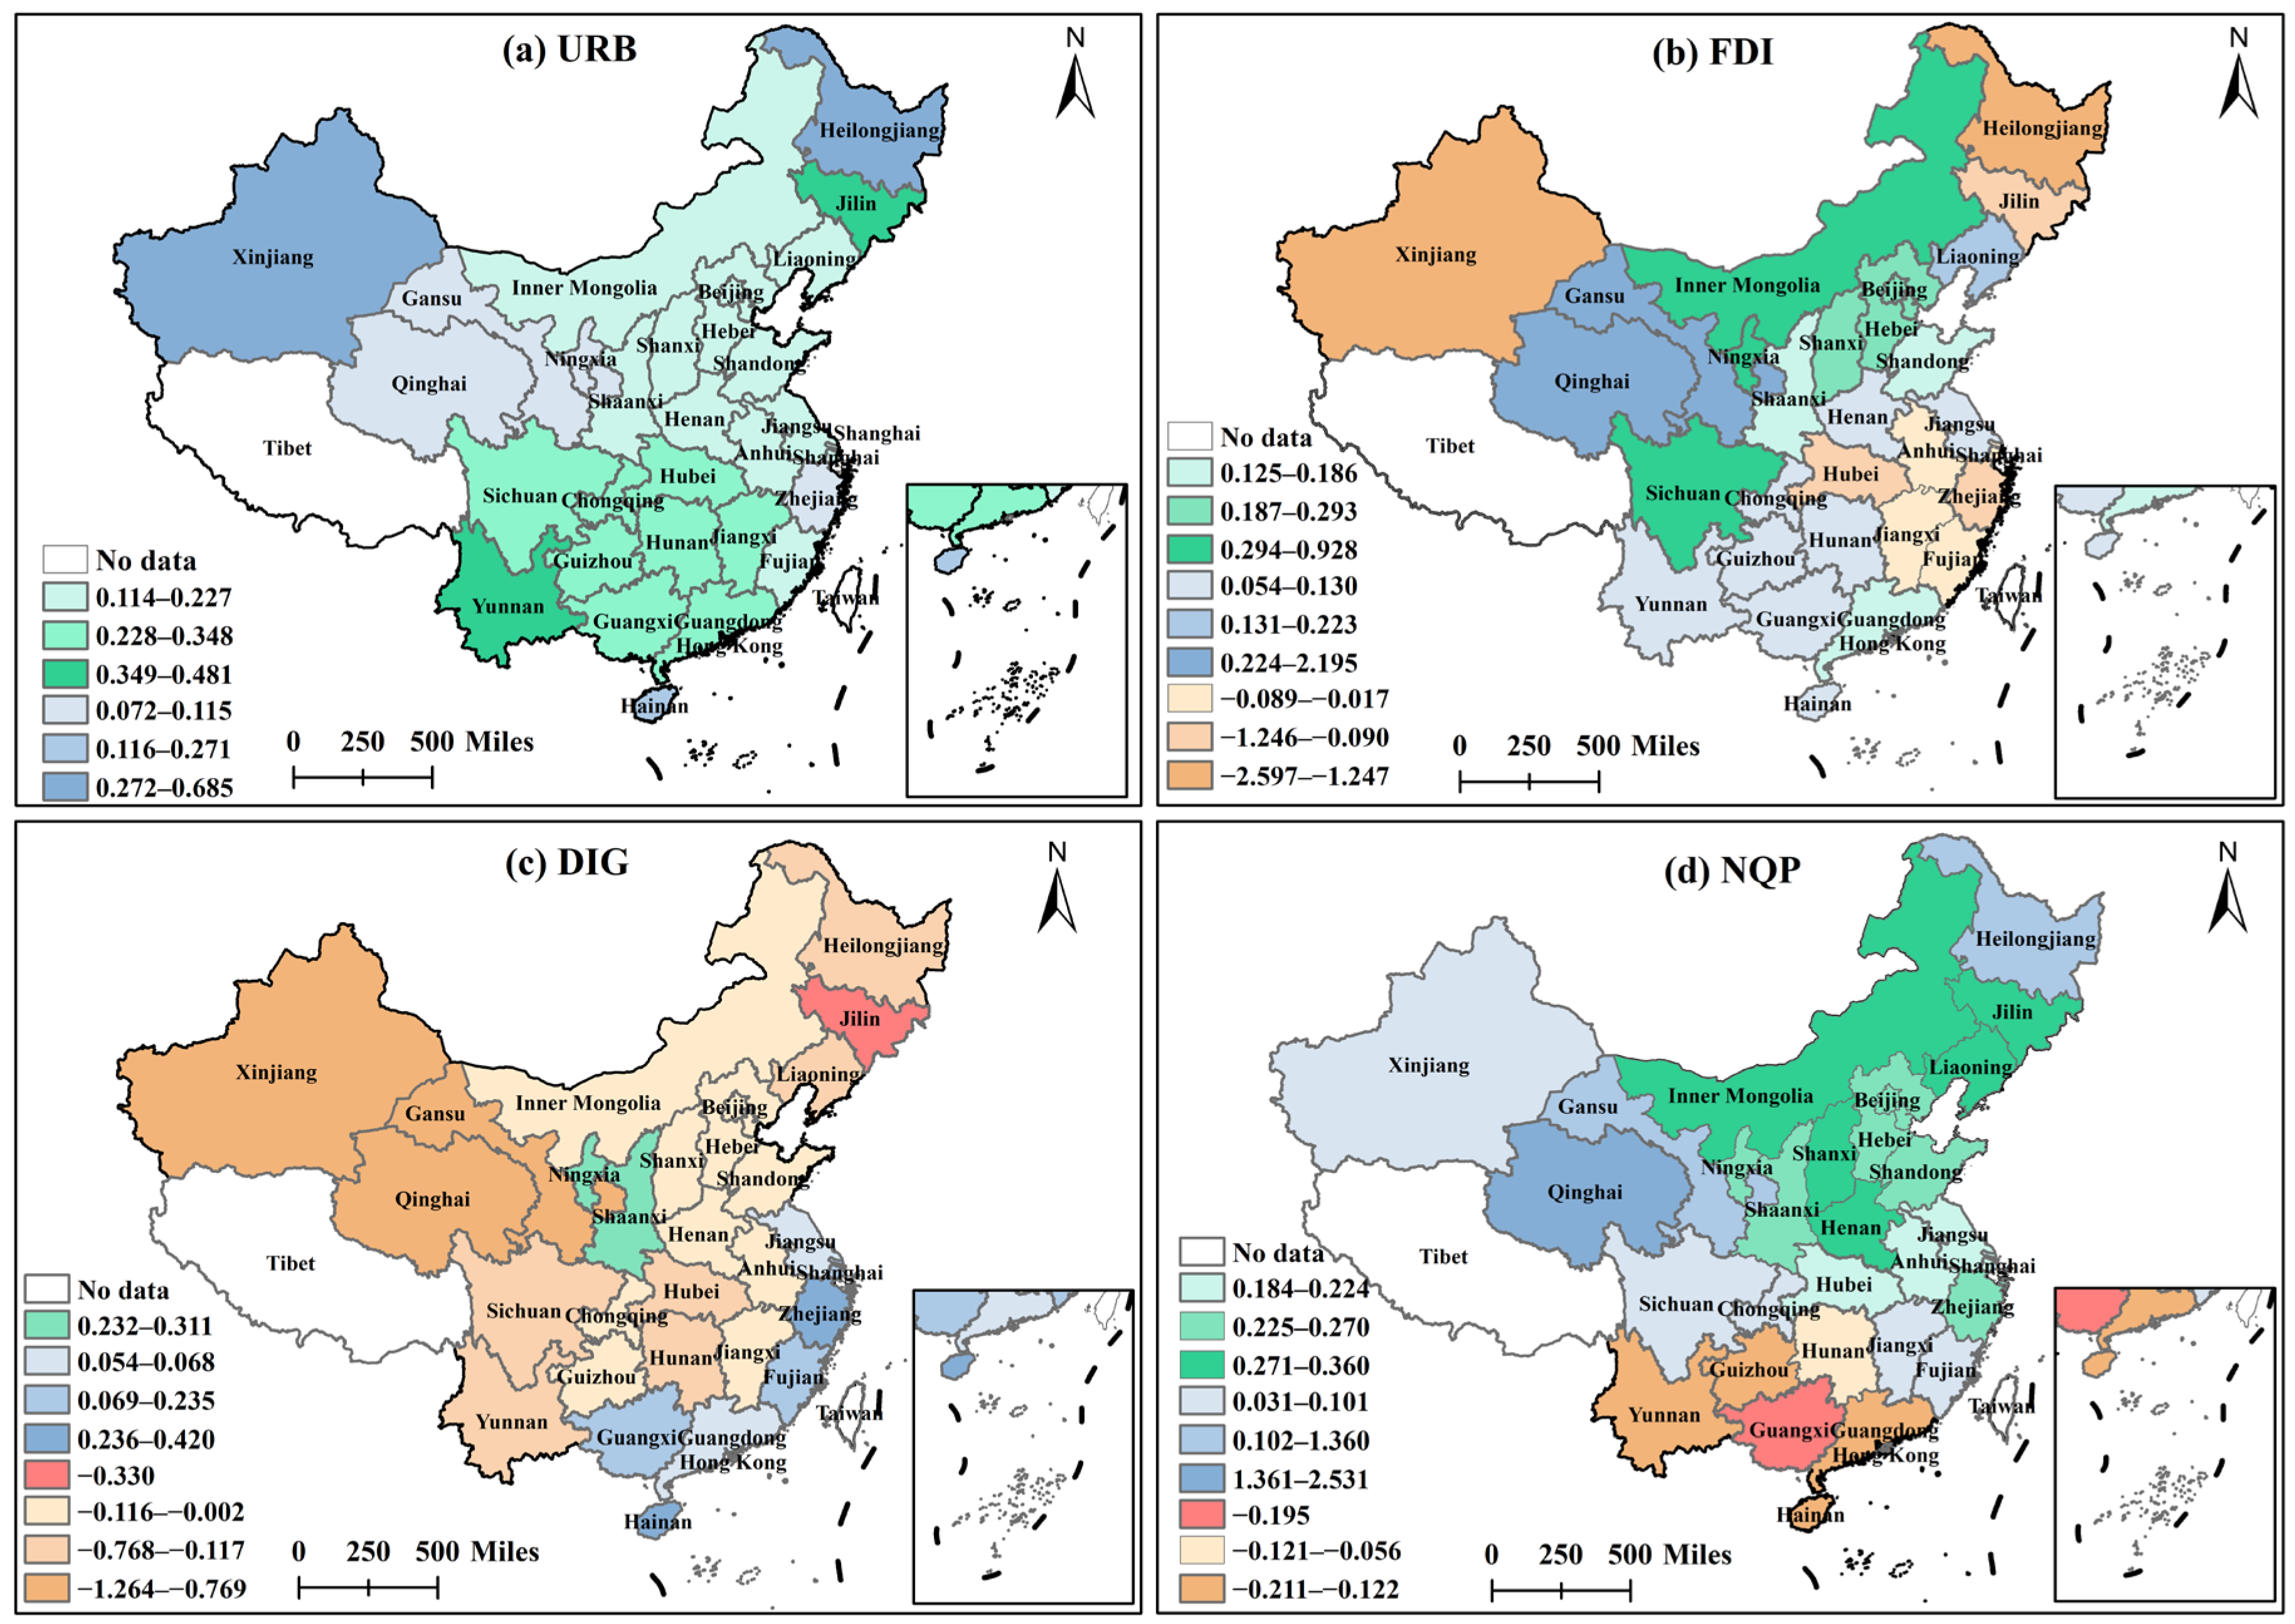
Table 6 presents the regression results of the GWR model. From the regression coefficients, the coefficients of URB are positive, indicating that URB has a facilitating effect on the synergy levels of CC, PR, and EG. In particular, a significant positive correlation exists between URB and CCD in 76.67% of the study samples. This finding confirms the positive effect of urbanization in achieving the synergistic promotion of CC, PR, and EG. The coefficient range of FDI is [−2.597, 2.195], showing evident regional heterogeneity characteristics. Note that FDI has a significant positive impact on CCD in one-third of the provinces, which implies that increasing foreign investment helps to enhance the synergistic effect of CC, PR, and EG. The regression coefficients of DIG range from −1.264 to 0.421. However, the impact of DIG on CCD in most provinces fails the significance test. Only 10% of the provinces show significant FDI impact. The proportions showing significant positive and negative correlations are two-third and one-third, respectively. The regression coefficient of NQP is from −0.211 to 2.531. In 56.67% of the provinces, the coefficients of NQP are significant. Meanwhile, the influential effect is different. In particular, 94.12% are influenced positively by NQP and 5.88% are influenced negatively.
To deeply analyze the differential effects of the variables on CCD, this study plotted the spatial distribution of regression coefficients based on the ArcGIS 10.6 software, as shown in Figure 9. Four colors are used to identify the different types of impact: the green area indicates that the variable has a significant positive effect on CCD; the blue area represents a non-significant positive correlation; the red area indicates a significant negative effect; and the orange area indicates a non-significant negative correlation.
As shown in Figure 9a, URB indicates a significant positive correlation with CCD in the central, southwestern, and eastern regions. This positive association is mainly reflected in two mechanisms. First, the advancement of urbanization can contribute to guiding the optimization and upgrading of regional industrial structure, especially to promoting the rapid development of the tertiary industry, thereby providing a driving force for regional low-carbon economic transformation [64]. Second, the environmental infrastructure construction, along with urbanization, is constantly improved, which promotes the improvement in regional climate and ecological environment quality. It is worth noting that the regression coefficient of URB is higher in the northeast and southwest regions, indicating that the enhancement effect of URB on CCD in the two regions is more prominent. This phenomenon is mainly attributed to the policy dividends of national strategies. The implementation of the Northeast Revitalization Strategy and Western Development Strategy has brought new opportunities for local urbanization development, accelerated the process of urban–rural integration, and promoted the intensive use of resources.
Figure 9b shows that FDI has a positive impact on the synergy level of CC, PR, and EG in most provinces in China. To circumvent the “pollution paradise” effect, China has formulated a strict negative list for foreign investment access and explicitly restricted foreign investment in high-energy consumption and high-pollution industries. This policy has effectively blocked the transfer of international carbon emissions. In Beijing–Tianjin–Hebei and its neighboring areas, which are the key areas of air pollution prevention and control, environmental regulatory standards and project access mechanisms are significantly strict, thereby inhibiting the inflow of pollution-intensive foreign investment projects and stimulating foreign investment to gather in the high-tech and green and low-carbon areas. In the foreign investment agglomeration areas of Inner Mongolia, Shaanxi, Sichuan, and Chongqing in the western region, the production efficiency of local enterprises has been enhanced through the introduction of advanced production technology and management experience [65]. Furthermore, strengthening international cooperation has a catalytic role in promoting a shift in the energy structure toward renewable energy [66]. Zhang and Zhou [67] further found that the technology spillover effect brought by FDI contributes evidently better to energy efficiency improvement and carbon emission reduction in the western region than in the eastern region. This finding may be the reason why the impact effect of FDI on CCD is stronger in the western region than in the eastern region.
From Figure 9c, it can be seen that in Ningxia and Shaanxi Provinces, DIG exhibits a significant positive facilitating effect. By contrast, a significant negative effect is observed in Jilin Province. The impact of DIG in most provinces in China fails the significance test. This phenomenon may stem from the mutual offsetting of effects at different stages of DIG development. At the early stage of DIG development, the effect of increased energy demand resulting from the digital infrastructure construction dominates, leading to an increase in regional carbon emissions [68]. The scale-up of production driven by DIG will temporarily increase pollutant emissions. With the improvement of DIG infrastructure, a synergy effect of CC and PR of DIG gradually appears [69].
As shown in Figure 9d, NQP and CCD in some provinces in North and Central China show a significant positive correlation, indicating that NQP development effectively promotes the coupling coordination level of CC, PR, and EG. According to the regional industrial characteristics, these provinces can be divided into two types. The first category is the resource-based provinces, represented by Inner Mongolia, Liaoning, Shanxi, and Shandong. These provinces have long relied on resource-intensive industries for their economic development, and the transformation and upgrading of the traditional industries urgently need to be empowered by NQP. NQP development can stimulate the growth of new industries through technological innovation and promote the industrial transformation into high-end and green industries [70]. The other category is represented by technology-intensive provinces, such as Beijing, Tianjin, Jiangsu, and Shanghai. These provinces, with strong scientific and technological innovation capacity and developed high-tech industries, have a solid foundation for NQP development. Therefore, they have a considerably strong endogenous impetus for regional green transformation and an evident first-mover advantage in low-carbon development.

4.5. Robustness Test

4.5.1. Robustness Test of the CCD Model

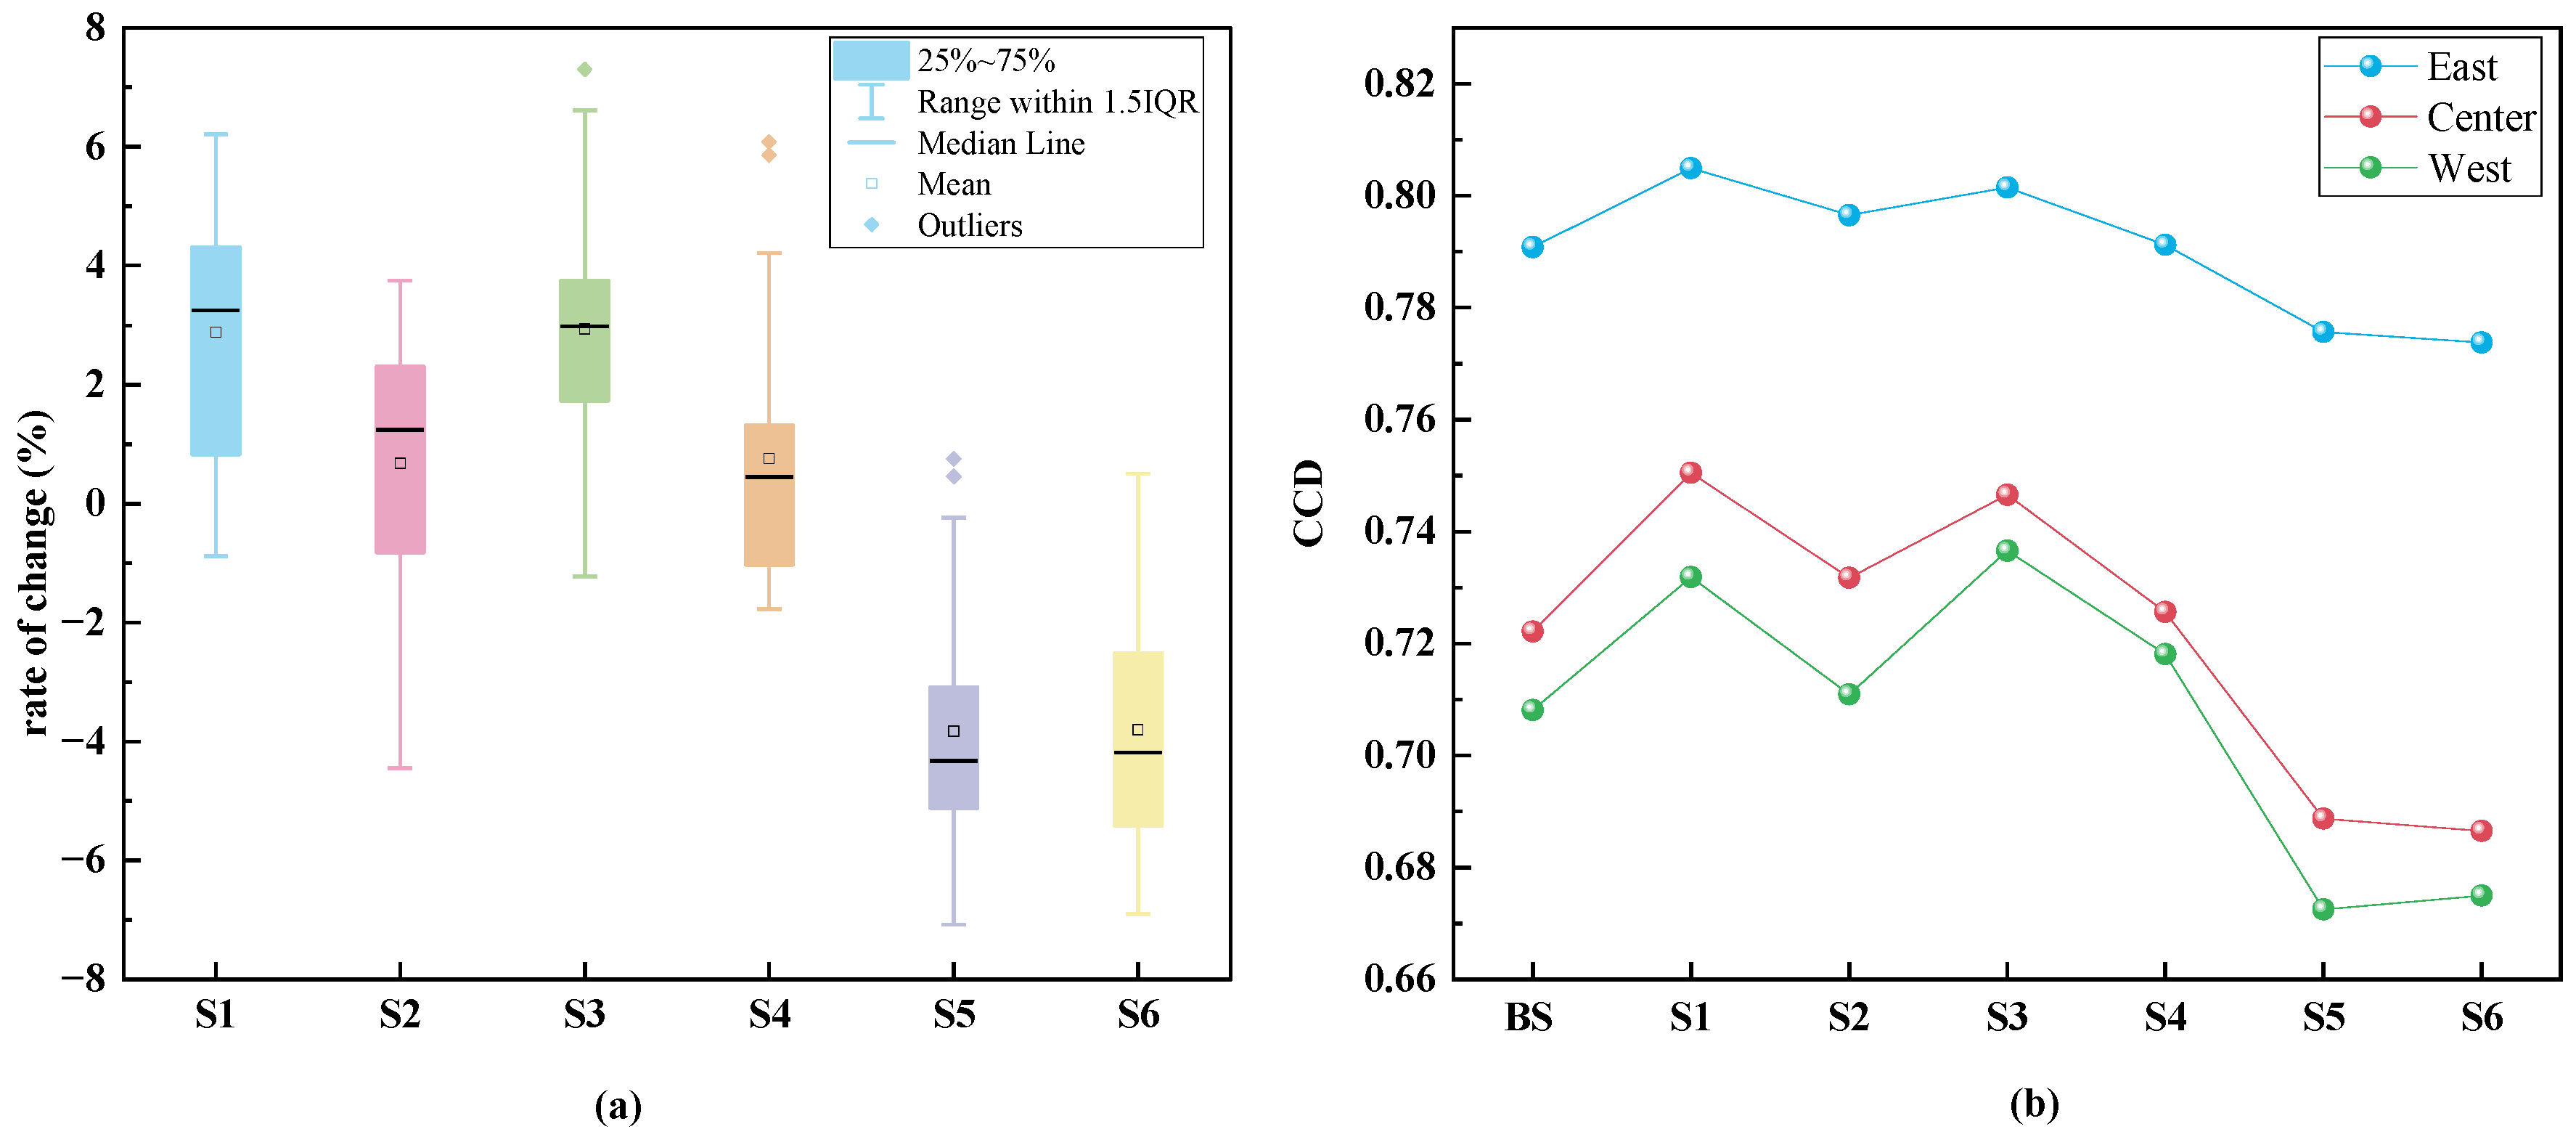
This study analyzes the coordination level of CC, PR, and EG based on the assumption that they are of equal importance to China’s socioeconomic development. However, the focus on actual policy implementation may be different because of the significant differences in the economic development level and environmental conditions among Chinese provinces [71]. To test the reliability of the CCD model, this paper designed six scenarios by adjusting the values of α , β , and δ (Table 7). Reliability analyses were conducted based on the data in 2021. The CCD under different scenarios is shown in Figure 10.
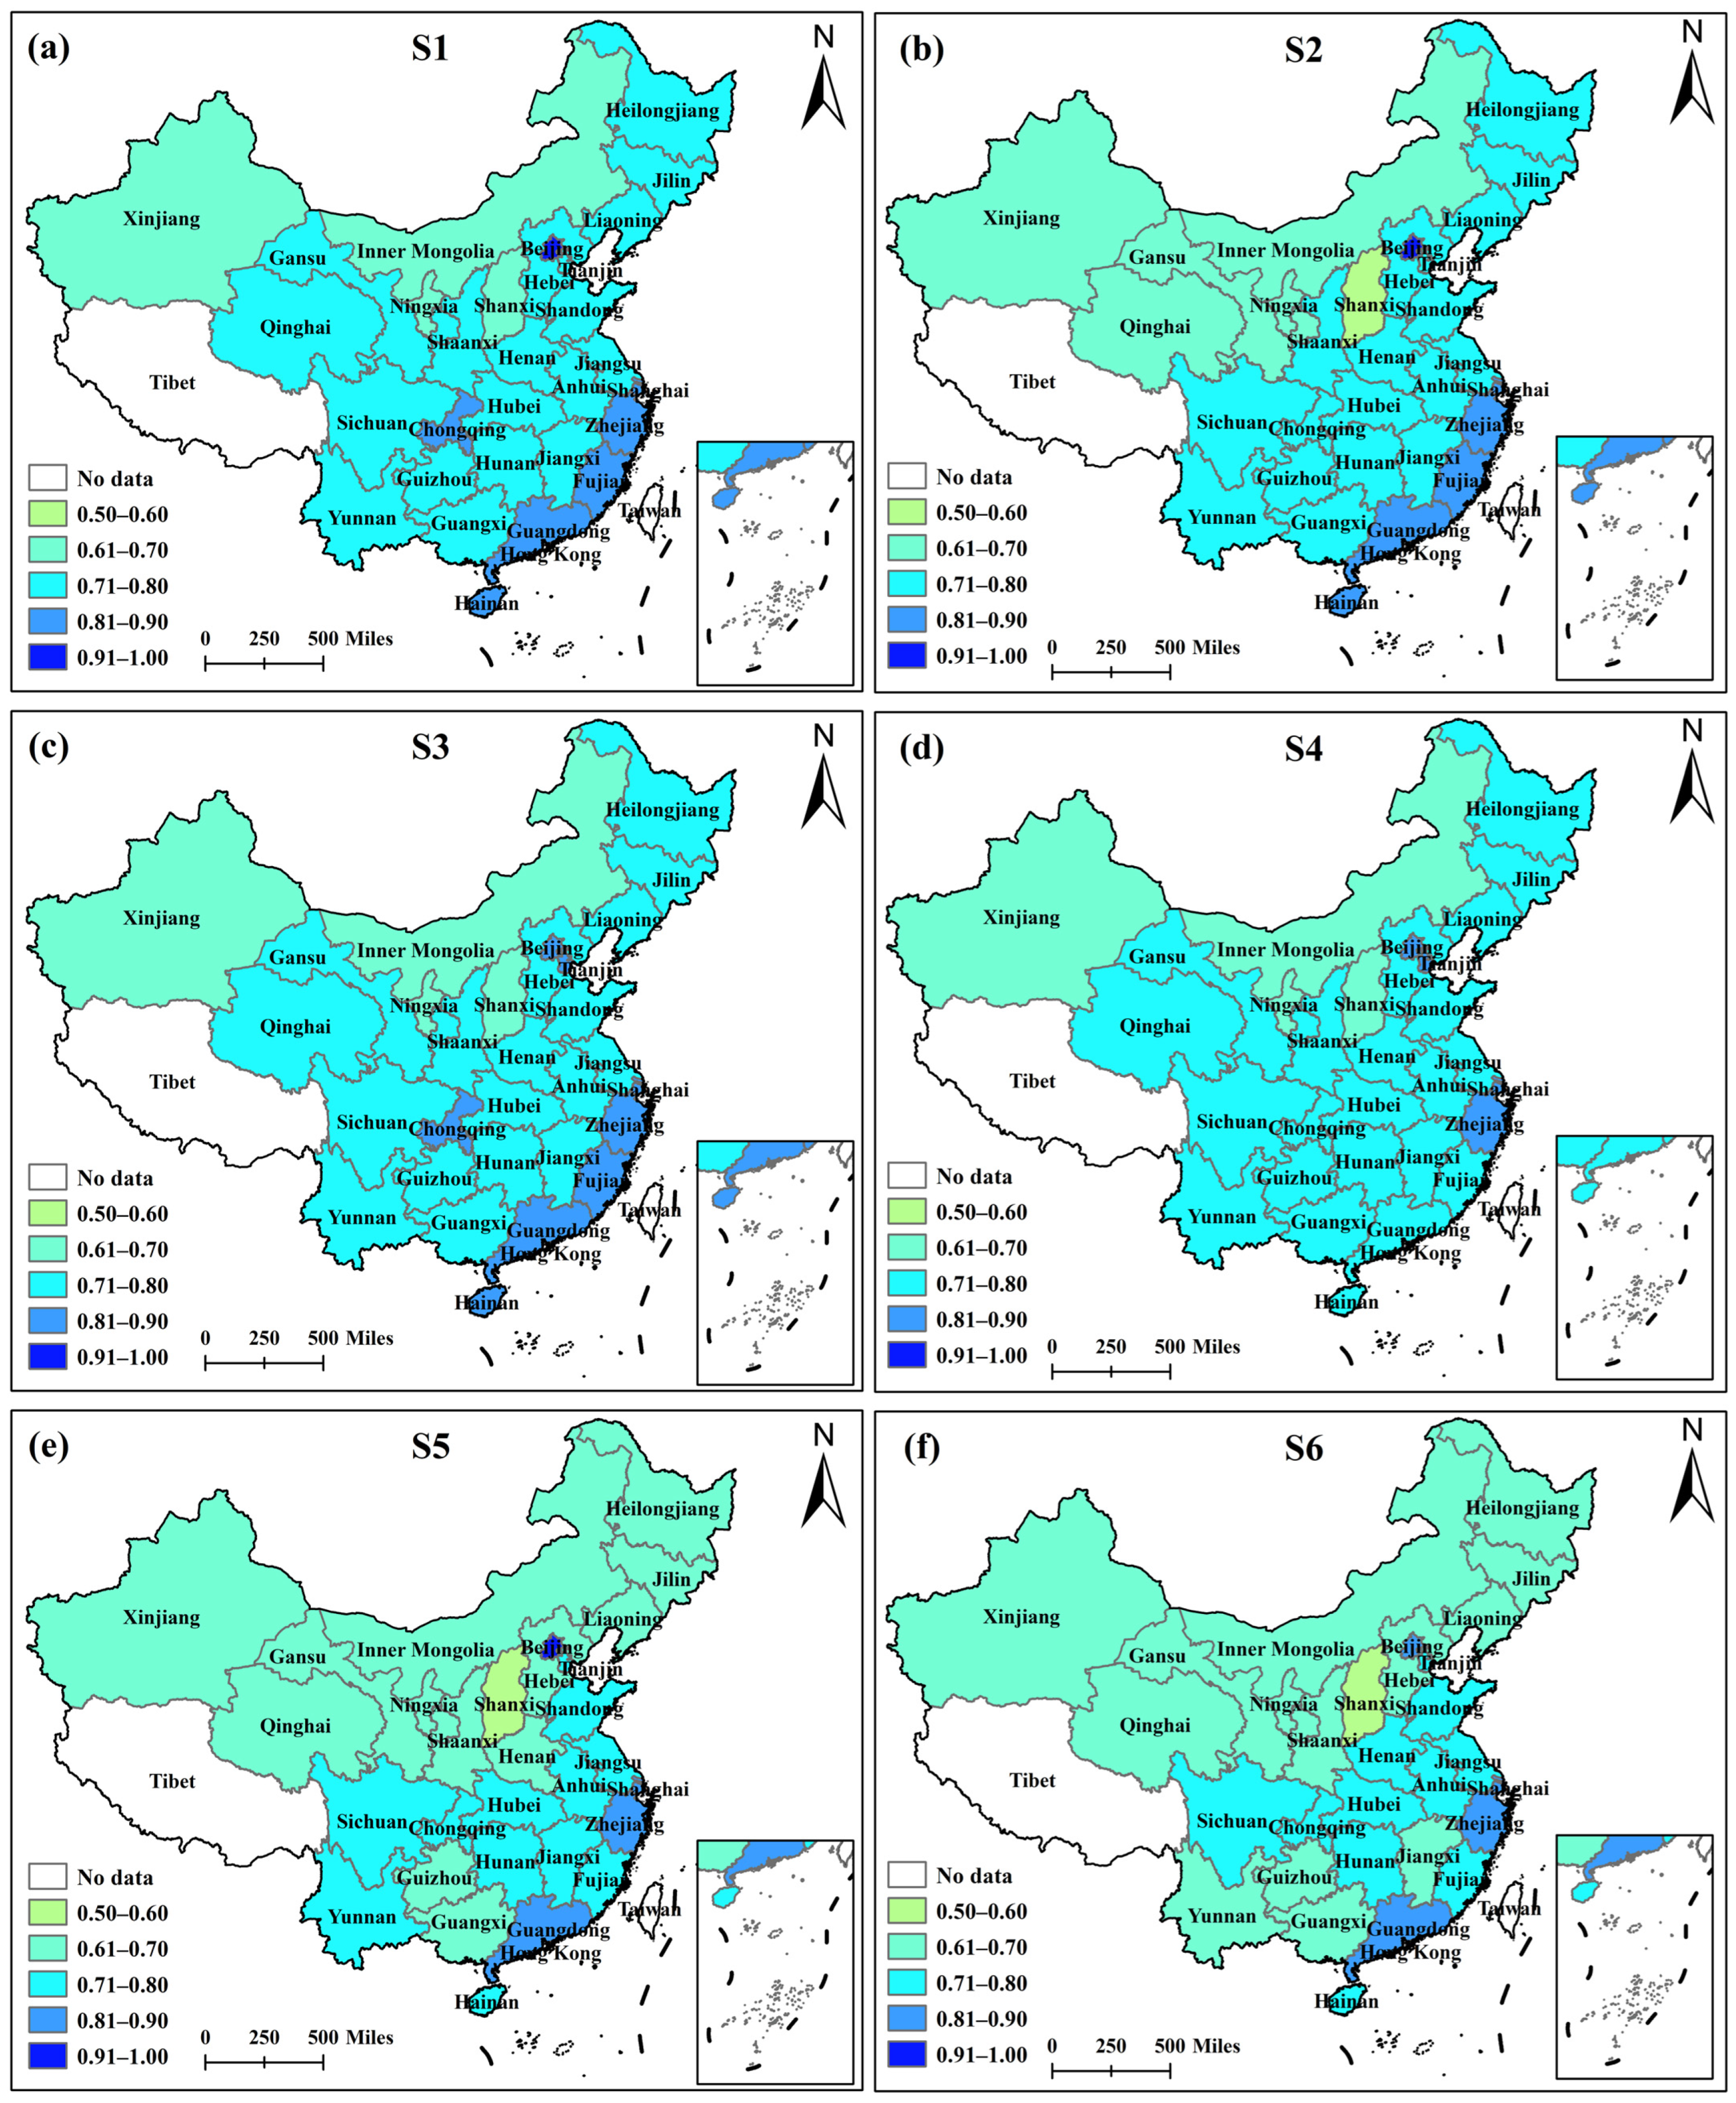
According to the statistical results in Figure 10a, the absolute difference in CCD under each scenario, compared with the baseline scenario, ranges from −0.052 to 0.047, and the relative rate of change ranges from −7% to 8%, with most of the data clustered between −5% and 4%. This result suggests that the magnitude of CCD fluctuations under the six scenarios is generally small. For the regional comparisons (Figure 10b), all scenarios show consistent regional differences in characteristics: CCD is highest in the eastern region, followed by the central region, and lowest in the western region. For the spatial distribution characteristics (Figure 11), northwest China is shown as a low-coordination-level region under all scenarios, while Beijing, Tianjin, and the southeast coastal region always maintain high coordination level statuses. This stable spatial differentiation pattern further validates the reliability and robustness of the CCD model.
When observing the changes in the coordination level, the percentages of provinces with coordination levels remaining consistent with the baseline scenario under the six scenario settings are 86.7%, 96.7%, 76.7%, 83.3%, 70.0%, and 63.3%. This change feature highlights that the EG coefficient has a greater impact on the assessment results of the coordination level, especially in provinces with unbalanced economic and environmental development. The reason is that China’s economic growth is shifting from crude to intensive, but fossil energy is still indispensable for economic development. Economic development still stimulates carbon emissions [72,73]. With the exception of some eastern provinces, most provinces are in the middle stage of industrialization, and the tertiary industry tendency of industrial restructuring may lead to structural deceleration of the local economic development, which may affect the sustainable growth of the local economy [74]. Consequently, the EG index of other provinces, except Beijing, Guangdong, and Jiangsu, is substantially lower than the CC and PR indexes, and evaluation results in these provinces are more sensitive to the parameters. Therefore, promoting carbon and pollution reduction in tandem with economic growth can effectively reduce the interference of parameter sensitivities in assessment results.

4.5.2. Robustness Test of the GWR Model

To examine the impact of variable selection on the empirical results, this study conducts model robustness tests by replacing variables and adding variables.
(1) Replace variables
In this study, we replaced the explanatory variables in the baseline model with the CCD of Scenarios 1, 3, and 5 to analyze the influencing factors. As shown in Table 8, the adjusted R2 of the design scenarios are relatively close to those of the baseline scenario. To further verify the model robustness, we analyzed the regression coefficients of all explanatory variables with descriptive statistics (Figure 12a). The results indicate that the directionality (positive and negative), numerical value, average value, and interquartile distribution of the regression coefficients of the explanatory variables remain highly consistent. The analysis results verify that the GWR model passed the robustness test and also indicate that the adjustment of the CCD model parameters has a limited impact on the final results of the analysis of the affecting factors.
(2) Add variable
The GWR model robustness test was conducted by introducing the population density variable into the system of explanatory variables. The result shows that the adjusted R2 of the test model is 0.881, which is similar to that of the benchmark model. Further descriptive statistics on the regression coefficients of the core variables found that the fluctuation of the regression coefficients under the test model is smaller compared with the benchmark model. This empirical result fully verifies that the GWR model estimation conclusions have good robustness.

5. Conclusions and Suggestions

5.1. Conclusions

Based on China’s provincial panel data from 2011 to 2021, this paper constructs a comprehensive evaluation framework to systematically examine the coordination level of CC, PR, and EG. We deeply analyze the spatial and temporal evolution characteristics of CCD and reveal the spatial clustering law of CCD using the cold and hot spot analysis method. We further extend the study of regional disparities by introducing the Dagum Gini coefficient. Thereafter, the degree of regional differences in the coordination level of CC, PR, and EG is quantified. To compensate for the shortcomings of the existing literature in the analysis of influencing factors, this research constructs a GWR model to explore the spatial heterogeneity of core factors. Furthermore, this study innovatively tests the robustness of the CCD model through multiple scenario parameter settings. The main research conclusions are as follows.
First, the national average CCD from 2011 to 2021 increased significantly from 0.590 to 0.742, marking a leap from “barely coordinated” to “moderately coordinated” in the coordination level of CC, PR, and EG in China. At the regional level, the eastern region ranks first, with a CCD value of 0.791, while the western region is at the bottom with 0.708. However, the three regions have entered the moderately coordinated stage. At the provincial level, Beijing, Zhejiang, and Guangdong constitute the first echelon of CCD, while such provinces as Shanxi, Inner Mongolia, and Xinjiang lag behind. These findings show significant interprovincial development imbalances. Provinces should formulate differentiated green and low-carbon development plans based on local development stages and resource endowments.
Second, the coordination level of CC, PR, and EG in Chinese provinces shows significant spatial clustering characteristics. The hot spot areas of CCD are mainly concentrated in Beijing, Tianjin, and the economically developed southeastern coastal provinces. Meanwhile, cold spot areas are mainly distributed in the northwestern and northeastern regions. It is worth noting that the spatial distribution pattern of the cold and hot spot areas is highly consistent with the spatial distribution characteristics of its low- and high-value areas.
Third, the analysis based on the Dagum Gini coefficient shows obvious regional differences in the coordination levels of CC, PR, and EG. However, the overall differences in CCD show a convergence trend from 2011 to 2021. First, for the decomposition results, the inter-regional differences are the main source of the total differences. The gap between the east and west is the most significant but continues to narrow. The difference between the central and western regions is the smallest and fluctuates gradually. Second, the contribution of the intra-regional differences is on an upward trend, which is specifically reflected in the fact that the internal differences within the eastern region are the most prominent, followed by the west, and the central region is markedly balanced. The contribution of the intensity of transvariation is limited, reflecting that high CCD provinces have clear regional clustering characteristics in spatial distribution. Therefore, narrowing the inter-regional disparities will contribute to the overall level of synergies between CC, PR, and EG across the country.
Fourth, the results of the spatial heterogeneity analysis of the influencing factors show that urbanization has a positive effect on achieving the synergistic promotion of CC, PR, and EG. In the northeast and southwest regions, the boosting effect of URB on CCD is considerably prominent. FDI has a significant positive effect in Beijing–Tianjin–Hebei and its neighboring provinces and in the western provinces of Mongolia, Shaanxi, Sichuan, and Chongqing. The effect of FDI on CCD is stronger in the western region than in the eastern provinces. The effect of DIG on CCD fails the test of significance in most of the provinces. In Ningxia and Shaanxi Provinces, DIG shows a significant positive facilitating effect; however, a significant negative effect is observed in Jilin Province. In some provinces in North and Central China, NQP shows a significant positive correlation with CCD. Therefore, efforts to enhance the regional coordination level of CC, PR, and EG should focus on promoting urbanization and strengthening FDI.
Fifth, the robustness test results of the CCD model show that the model parameter adjustments have a limited impact on CCD. All scenarios show consistent spatial distribution patterns. The regression coefficients of the influencing factors fluctuated minimally in different scenarios. The findings indicate that the CCD model is robust.

5.2. Policy Suggestions

On the bases of the preceding findings, the following suggestions are proposed.
Differentiation policy is necessary. Developed provinces with a high level of coordination should continue to focus on “technological breakthroughs + global links”, reconstruct industrial competitiveness through technological innovation, and build an open innovation network to link global innovation resources, thereby promoting the in-depth integration of the innovation chain with the industrial chain. Consistent with the global clean energy development trend, western provinces should rely on rich clean energy resources, strive to develop new energy industries, accelerate the transformation of resource endowment into economic development advantages, and form a benign cycle of development pattern of green energy–economic development–ecological protection.
To narrow the regional gap, local governments should break down administrative division barriers and deepen regional synergistic development. The government should exert efforts to accelerate the establishment of a cross-regional technology transfer system and improve benefit-sharing and ecological compensation mechanisms. Institutional innovation will provide sustained impetus for balanced regional development. Furthermore, there is a necessity to establish a cross-regional talent think tank and deepen cooperation among scientific research institutions, which will contribute to the efficient flow of capital, technology, and other factors.
Considering the facilitating effect of URB and FDI on the coordination level of CC, PR, and EG, provinces should emphasize optimizing the layout of the urban spatial structure, improving the low-carbon infrastructure system, and comprehensively promoting the intensive and efficient use of resources. For external cooperation, it is necessary to deepen the cross-border financial collaboration mechanism, smooth international capital flow channels, and establish a green investor network. Moreover, it is suggested to improve the policy support system and create a favorable business environment to attract high-quality international capital investment. Provinces should fully grasp the strategic opportunities of the Belt and Road Initiative, strengthen practical cooperation with countries along the route, and focus on introducing internationally advanced green production technology and modern management experience.
In this study, a comprehensive evaluation system was constructed to examine the coordination level of CC, PR, and EG in China. Due to data availability, only a few representative indicators were included in the current indicator system. It is worth pointing out that a more systematic and comprehensive evaluation index system is expected to be established in the future as the synergistic mechanism of carbon and pollution reduction continues to be improved. In addition, through subsequent data updates, the study period can be further expanded to dynamically assess the degree of coordination among the three in more years after the “dual-carbon” goal was achieved, so as to more comprehensively reflect the effectiveness of China’s efforts in integrating economic growth and ecological and environmental governance.

Author Contributions

Conceptualization, Y.L. and H.C.; methodology, H.C.; formal analysis, H.C.; investigation, H.C.; writing—original draft preparation, H.C.; writing—review and editing, Y.L. and H.C.; funding acquisition, Y.L. All authors have read and agreed to the published version of the manuscript.

Funding

This research was funded by the National Social Science Fund of China, grant number 21FJYB023 and the Beijing Social Science Found, grant number 24GLA007.

Institutional Review Board Statement

Not applicable.

Informed Consent Statement

Not applicable.

Data Availability Statement

The data sources are described in Section 3.2.

Acknowledgments

Sincere thanks to the academic editors and anonymous reviewers for their kind suggestions and valuable comments.

Conflicts of Interest

The authors declare no conflicts of interest.

Abbreviations

The following abbreviations are used in this manuscript:
CCCarbon cutting
PRPollution reduction
EGEconomic growth
CCDCoupling coordination degree

References

  1. Wang, E.; Liu, B.; Dai, C. China’s energy Consumption, Carbon Emissions and Economic Growth Coordinated Development Evaluation Indicating System and Its Application. Energy Procedia 2012, 16, 1241–1246. [Google Scholar] [CrossRef]
  2. Zhu, B.; Jiang, M.; Wang, K.; Chevallier, J.; Wang, P.; Wei, Y.-M. On the road to China’s 2020 carbon intensity target from the perspective of “double control”. Energy Policy 2018, 119, 377–387. [Google Scholar] [CrossRef]
  3. Sarkodie, S.A.; Ozturk, I. Investigating the Environmental Kuznets Curve hypothesis in Kenya: A multivariate analysis. Renew. Sustain. Energy Rev. 2020, 117, 109481. [Google Scholar] [CrossRef]
  4. Chang, H.; Wang, W.; Yu, J. Revisiting the environmental Kuznets curve in China: A spatial dynamic panel data approach. Energy Econ. 2021, 104, 105600. [Google Scholar] [CrossRef]
  5. Zhong, M.; Zhang, X. Summary about the Critique of Environmental Kuznets Curve. China Popul. Resour. Environ. 2010, 20, 62–67. [Google Scholar] [CrossRef]
  6. Ma, L.; Jin, F.; Song, Z.; Liu, Y. Spatial coupling analysis of regional economic development and environmental pollution in China. J. Geogr. Sci. 2013, 23, 525–537. [Google Scholar] [CrossRef]
  7. Han, H.; Guo, L.; Zhang, J.; Zhang, K.; Cui, N. Spatiotemporal analysis of the coordination of economic development, resource utilization, and environmental quality in the Beijing-Tianjin-Hebei urban agglomeration. Ecol. Indic. 2021, 127, 107724. [Google Scholar] [CrossRef]
  8. Bahtebay, J.; Zhang, F.; Ariken, M.; Chan, N.W.; Tan, M.L. Evaluation of the coordinated development of urbanization-resources-environment from the incremental perspective of Xinjiang, China. J. Clean. Prod. 2021, 325, 129309. [Google Scholar] [CrossRef]
  9. Deng, M.; Chen, J.; Tao, F.; Zhu, J.; Wang, M. On the Coupling and Coordination Development between Environment and Economy: A Case Study in the Yangtze River Delta of China. Int. J. Environ. Res. Public Health 2022, 19, 586. [Google Scholar] [CrossRef]
  10. Liu, K.; Qiao, Y.; Shi, T.; Zhou, Q. Study on coupling coordination and spatiotemporal heterogeneity between economic development and ecological environment of cities along the Yellow River Basin. Environ. Sci. Pollut. Res. 2021, 28, 6898–6912. [Google Scholar] [CrossRef]
  11. Wang, J.; Han, Q.; Wu, K.; Xu, Z.; Liu, P. Spatial-temporal patterns and evolution characteristics of the coordinated development of industrial economy, natural resources and environment in China. Resour. Policy 2022, 75, 102463. [Google Scholar] [CrossRef]
  12. Yin, Z.; Tang, Y.; Liu, H.; Dai, L. Coupling coordination relationship between tourism economy-social welfare-ecological environment: Empirical analysis of Western Area, China. Ecol. Indic. 2023, 155, 110938. [Google Scholar] [CrossRef]
  13. Peng, D.; Mu, Y.; Zhu, Y. Evaluating the level of coordinated development of fisheries economic growth and environmental quality in selected Chinese regions. Environ. Impact Assess. Rev. 2021, 89, 106605. [Google Scholar] [CrossRef]
  14. Liu, J.; Qu, J.; Zhao, K. Is China’s development conforms to the Environmental Kuznets Curve hypothesis and the pollution haven hypothesis? J. Clean. Prod. 2019, 234, 787–796. [Google Scholar] [CrossRef]
  15. Pata, U.K. Renewable energy consumption, urbanization, financial development, income and CO2 emissions in Turkey: Testing EKC hypothesis with structural breaks. J. Clean. Prod. 2018, 187, 770–779. [Google Scholar] [CrossRef]
  16. Wang, Y.; He, X. Spatial economic dependency in the Environmental Kuznets Curve of carbon dioxide: The case of China. J. Clean. Prod. 2019, 218, 498–510. [Google Scholar] [CrossRef]
  17. Khan, I.; Lei, H.; Ali, I.; Ji, X.; Sharif, A.; Elkhrachy, I.; Khan, I. Striving for carbon neutrality and economic prosperity in the top ten emitting countries: Testing N shape Kuznets curve hypothesis. J. Clean. Prod. 2023, 429, 139641. [Google Scholar] [CrossRef]
  18. Lu, C.; Venevsky, S.; Shi, X.; Wang, L.; Wright, J.S.; Wu, C. Econometrics of the environmental Kuznets curve: Testing advancement to carbon intensity-oriented sustainability for eight economic zones in China. J. Clean. Prod. 2021, 283, 124561. [Google Scholar] [CrossRef]
  19. Jiang, J.; Zhu, S.; Wang, W.; Li, Y.; Li, N. Coupling coordination between new urbanisation and carbon emissions in China. Sci. Total Environ. 2022, 850, 158076. [Google Scholar] [CrossRef]
  20. Zhang, H.; Xu, L.; Zhou, P.; Zhu, X.; Cudjoe, D. Coordination between economic growth and carbon emissions: Evidence from 178 cities in China. Econ. Anal. Policy 2024, 81, 164–180. [Google Scholar] [CrossRef]
  21. Zhang, Q.; Li, J.; Li, Y.; Huang, H. Coupling analysis and driving factors between carbon emission intensity and high-quality economic development: Evidence from the Yellow River Basin, China. J. Clean. Prod. 2023, 423, 138831. [Google Scholar] [CrossRef]
  22. Sun, G.; Liu, Y.; Li, B.; Guo, L. Road to sustainable development of China: The pursuit of coordinated development between carbon emissions and the green economy. J. Clean. Prod. 2024, 434, 139833. [Google Scholar] [CrossRef]
  23. Shen, L.; Huang, Y.; Huang, Z.; Lou, Y.; Ye, G.; Wong, S.-W. Improved coupling analysis on the coordination between socio-economy and carbon emission. Ecol. Indic. 2018, 94, 357–366. [Google Scholar] [CrossRef]
  24. Chu, H.; Liu, M.; Wang, M.; Qie, X.; Ning, Y. Measurement and analysis of the comprehensive emission intensity and coupling coordination relationship of carbon dioxide emissions and pollutant emissions in the Yangtze River Delta Urban Agglomeration. Atmos. Pollut. Res. 2023, 14, 101897. [Google Scholar] [CrossRef]
  25. Zhang, Y.; Cheung, A.; Qu, X. Can digital financial inclusion promote the coupling coordination between pollution reduction and low-carbon development? Evidence from China. Econ. Anal. Policy 2024, 82, 1113–1130. [Google Scholar] [CrossRef]
  26. Nie, C.; Lee, C.-C. Synergy of pollution control and carbon reduction in China: Spatial–temporal characteristics, regional differences, and convergence. Environ. Impact Assess. Rev. 2023, 101, 107110. [Google Scholar] [CrossRef]
  27. Chen, X.; Meng, Q.; Wang, K.; Liu, Y.; Shen, W. Spatial patterns and evolution trend of coupling coordination of pollution reduction and carbon reduction along the Yellow River Basin, China. Ecol. Indic. 2023, 154, 110797. [Google Scholar] [CrossRef]
  28. Xu, Y.; Liu, Z.; Walker, T.R.; Adams, M.; Dong, H. Spatio-temporal patterns and spillover effects of synergy on carbon dioxide emission and pollution reductions in the Yangtze River Delta region in China. Sustain. Cities Soc. 2024, 107, 105419. [Google Scholar] [CrossRef]
  29. Yi, H.; Zhao, L.; Qian, Y.; Zhou, L.; Yang, P. How to achieve synergy between carbon dioxide mitigation and air pollution control? Evidence from China. Sustain. Cities Soc. 2022, 78, 103609. [Google Scholar] [CrossRef]
  30. Wang, H.; Li, H.; Wang, H.; Wang, S.; Zhang, W. Research on the difference in air pollution and carbon dioxide reduction and regional economic development levels in China. J. Environ. Eng. Technol. 2022, 12, 1584–1592. [Google Scholar] [CrossRef]
  31. Chen, X.; Di, Q.; Jia, W.; Hou, Z. Spatial correlation network of pollution and carbon emission reductions coupled with high-quality economic development in three Chinese urban agglomerations. Sustain. Cities Soc. 2023, 94, 104552. [Google Scholar] [CrossRef]
  32. Lu, C.; Wang, D.; Li, H.; Cheng, W.; Tang, X.; Liu, W. Measurement of the Degree of Coordination in Regard to Carbon Emissions, Economic Development, and Environmental Protection in China. Appl. Sci. 2021, 11, 1750. [Google Scholar] [CrossRef]
  33. Chen, S.; Tan, Z.; Mu, S.; Wang, J.; Chen, Y.; He, X. Synergy level of pollution and carbon reduction in the Yangtze River Economic Belt: Spatial-temporal evolution characteristics and driving factors. Sustain. Cities Soc. 2023, 98, 104859. [Google Scholar] [CrossRef]
  34. Ma, P.; Zhang, M.; Wu, W.; Zhu, B. Synergistic efficiency in pollution and carbon reduction: Measurement, evolution, and pathways in Chinese cities. Environ. Impact Assess. Rev. 2025, 113, 107879. [Google Scholar] [CrossRef]
  35. Hong, W.Y. A techno-economic review on carbon capture, utilisation and storage systems for achieving a net-zero CO2 emissions future. Carbon Capture Sci. Technol. 2022, 3, 100044. [Google Scholar] [CrossRef]
  36. Jiang, P.; Khishgee, S.; Alimujiang, A.; Dong, H. Cost-effective approaches for reducing carbon and air pollution emissions in the power industry in China. J. Environ. Manag. 2020, 264, 110452. [Google Scholar] [CrossRef]
  37. Li, Y.; Dai, J.; Zhao, H. Analysis of collaborative emission reduction of air pollutants and greenhouse gases under carbon neutrality target: A case study of Beijing, China. Clean Technol. Environ. Policy 2024, 26, 3995–4008. [Google Scholar] [CrossRef]
  38. Yue, L.; Huang, C.; Ren, W. Performance evaluation and driver analysis of pollution control and carbon reduction in China: Based on a new analytical framework. Environ. Sci. Pollut. Res. 2023, 30, 84368–84385. [Google Scholar] [CrossRef]
  39. Jiang, B.; Zhang, H. Spatiotemporal characteristics and strategies of synergistic effect of pollution and carbon reduction in China. J. Environ. Eng. Technol. 2025, 15, 465–473. (In Chinese) [Google Scholar]
  40. Moosavian, S.F.; Zahedi, R.; Hajinezhad, A. Economic, environmental and social impact of carbon tax for Iran: A computable general equilibrium analysis. Energy Sci. Eng. 2022, 10, 13–29. [Google Scholar] [CrossRef]
  41. Yang, X.; Pang, J.; Teng, F.; Gong, R.; Springer, C. The environmental co-benefit and economic impact of China’s low-carbon pathways: Evidence from linking bottom-up and top-down models. Renew. Sustain. Energy Rev. 2021, 136, 110438. [Google Scholar] [CrossRef]
  42. Peng, D.; Liu, H. Measurement and Driving Factors of Carbon Emissions from Coal Consumption in China Based on the Kaya-LMDI Model. Energies 2022, 16, 439. [Google Scholar] [CrossRef]
  43. Qiu, Z.; Feng, Z.; Song, Y.; Li, M.; Zhang, P. Carbon sequestration potential of forest vegetation in China from 2003 to 2050: Predicting forest vegetation growth based on climate and the environment. J. Clean. Prod. 2020, 252, 119715. [Google Scholar] [CrossRef]
  44. Wang, Y.; Geng, Q.; Si, X.; Kan, L. Coupling and coordination analysis of urbanization, economy and environment of Shandong Province, China. Environ. Dev. Sustain. 2020, 23, 10397–10415. [Google Scholar] [CrossRef]
  45. Fan, Y.; Fang, C.; Zhang, Q. Coupling coordinated development between social economy and ecological environment in Chinese provincial capital cities-assessment and policy implications. J. Clean. Prod. 2019, 229, 289–298. [Google Scholar] [CrossRef]
  46. Shi, T.; Yang, S.; Zhang, W.; Zhou, Q. Coupling coordination degree measurement and spatiotemporal heterogeneity between economic development and ecological environment—Empirical evidence from tropical and subtropical regions of China. J. Clean. Prod. 2020, 244, 118739. [Google Scholar] [CrossRef]
  47. Zhang, Y.; Khan, S.U.; Swallow, B.; Liu, W.; Zhao, M. Coupling coordination analysis of China’s water resources utilization efficiency and economic development level. J. Clean. Prod. 2022, 373, 133874. [Google Scholar] [CrossRef]
  48. Cheng, X.; Long, R.; Chen, H.; Li, Q. Coupling coordination degree and spatial dynamic evolution of a regional green competitiveness system—A case study from China. Ecol. Indic. 2019, 104, 489–500. [Google Scholar] [CrossRef]
  49. Ye, S.; Ge, Y.; Xu, S.; Ma, X. Measurement and prediction of coupling coordination level of economic development, social stability and ecological environment in Qinghai—Thoughts on sustainable societal safety. Sustainability 2022, 14, 10515. [Google Scholar] [CrossRef]
  50. Yin, K.; Zhang, R.; Jin, X.; Yu, L. Research and optimization of the coupling and coordination of environmental regulation, technological innovation, and green development. Sustainability 2022, 14, 501. [Google Scholar] [CrossRef]
  51. Dong, Q.; Zhong, K.; Liao, Y.; Xiong, R.; Wang, F.; Pang, M. Coupling coordination degree of environment, energy, and economic growth in resource-based provinces of China. Resour. Policy 2023, 81, 103308. [Google Scholar] [CrossRef]
  52. Lian, Y.; Lin, X.; Luo, H.; Zhang, J.; Sun, X. Distribution characteristics and influencing factors of household consumption carbon emissions in China from a spatial perspective. J. Environ. Manag. 2024, 351, 119564. [Google Scholar] [CrossRef]
  53. Han, H.; Ding, T.; Nie, L.; Hao, Z. Agricultural eco-efficiency loss under technology heterogeneity given regional differences in China. J. Clean. Prod. 2020, 250, 119511. [Google Scholar] [CrossRef]
  54. Dagum, C. Decomposition and interpretation of Gini and the generalized entropy inequality measures. Statistica 1997, 57, 295–308. [Google Scholar] [CrossRef]
  55. Ren, J.; Bai, H.; Zhong, S.; Wu, Z. Prediction of CO2 emission peak and reduction potential of Beijing-Tianjin-Hebei urban agglomeration. J. Clean. Prod. 2023, 425, 138945. [Google Scholar] [CrossRef]
  56. Shi, B.; Xiang, W.; Bai, X.; Wang, Y.; Geng, G.; Zheng, J. District level decoupling analysis of energy-related carbon dioxide emissions from economic growth in Beijing, China. Energy Rep. 2022, 8, 2045–2051. [Google Scholar] [CrossRef]
  57. Lin, S.; Lin, R.; Sun, J.; Wang, F.; Wu, W. Dynamically evaluating technological innovation efficiency of high-tech industry in China: Provincial, regional and industrial perspective. Socioecon. Plann. Sci. 2021, 74, 100939. [Google Scholar] [CrossRef]
  58. Zhou, X.; Zhang, M.; Zhou, M.; Zhou, M. A comparative study on decoupling relationship and influence factors between China’s regional economic development and industrial energy–related carbon emissions. J. Clean. Prod. 2017, 142, 783–800. [Google Scholar] [CrossRef]
  59. Zuo, X.; Hua, H.; Dong, Z.; Hao, C. Environmental Performance Index at the Provincial Level for China 2006–2011. Ecol. Indic. 2017, 75, 48–56. [Google Scholar] [CrossRef]
  60. Li, Q.; Yang, Z.; Tian, Z.; Yin, Q. Multidimensional measurement of the High-Quality development of city Clusters: Dynamic Evolution, regional differences and trend forecasting--based on the basic connotation of Chinese-style modernization. Ecol. Indic. 2024, 161, 111989. [Google Scholar] [CrossRef]
  61. Yang, X.; Yang, X.; Zhu, J.; Jiang, P.; Lin, H.; Cai, Z.; Huang, H.; Long, J. Synergic emissions reduction effect of China’s “Air Pollution Prevention and Control Action Plan”: Benefits and efficiency. Sci. Total Environ. 2022, 847, 157564. [Google Scholar] [CrossRef] [PubMed]
  62. Chen, Y.; Lee, C.-C. Does technological innovation reduce CO2 emissions? Cross-country evidence. J. Clean. Prod. 2020, 263, 121550. [Google Scholar] [CrossRef]
  63. Zhou, K.; Yang, J.; Yang, T.; Ding, T. Spatial and temporal evolution characteristics and spillover effects of China’s regional carbon emissions. J. Environ. Manag. 2023, 325, 116423. [Google Scholar] [CrossRef]
  64. Ding, Y.; Li, F. Examining the effects of urbanization and industrialization on carbon dioxide emission: Evidence from China’s provincial regions. Energy 2017, 125, 533–542. [Google Scholar] [CrossRef]
  65. Yuan, W.; Sun, H.; Chen, Y.; Xia, X. Spatio-Temporal evolution and spatial heterogeneity of influencing factors of SO2 Emissions in Chinese cities: Fresh evidence from MGWR. Sustainability 2021, 13, 12059. [Google Scholar] [CrossRef]
  66. Nan, S.; Huo, Y.; Lee, C.-C. Assessing the role of globalization on renewable energy consumption: New evidence from a spatial econometric analysis. Renew. Energy 2023, 215, 118974. [Google Scholar] [CrossRef]
  67. Zhang, C.; Zhou, X. Does foreign direct investment lead to lower CO2 emissions? Evidence from a regional analysis in China. Renew. Sustain. Energy Rev. 2016, 58, 943–951. [Google Scholar] [CrossRef]
  68. Xie, B.; Liu, R.; Dwivedi, R. Digital economy, structural deviation, and regional carbon emissions. J. Clean. Prod. 2024, 434, 139880. [Google Scholar] [CrossRef]
  69. Liang, C.; Chen, X.; Di, Q. Path to pollution and carbon reduction synergy from the perspective of the digital economy: Fresh evidence from 292 prefecture-level cities in China. Environ. Res. 2024, 252, 119050. [Google Scholar] [CrossRef]
  70. Xu, S.; Wang, J.; Peng, Z. Study on the Promotional Effect and Mechanism of New Quality Productive Forces on Green Development. Sustainability 2024, 16, 8818. [Google Scholar] [CrossRef]
  71. Chen, J.; Li, Z.; Dong, Y.; Song, M.; Shahbaz, M.; Xie, Q. Coupling coordination between carbon emissions and the eco-environment in China. J. Clean. Prod. 2020, 276, 123848. [Google Scholar] [CrossRef]
  72. Cui, S.; Wang, Y.; Xu, P.; Shi, Y.; Liu, C. Spatial-temporal multi-factor decomposition and two-dimensional decoupling analysis of China’s carbon emissions: From the perspective of whole process governance. Environ. Impact Assess. Rev. 2023, 103, 107291. [Google Scholar] [CrossRef]
  73. Yang, X.; Jin, K.; Duan, Z.; Gao, Y.; Sun, Y.; Gao, C. Spatial-temporal differentiation and influencing factors of carbon emission trajectory in Chinese cities—A case study of 247 prefecture-level cities. Sci. Total Environ. 2024, 928, 172325. [Google Scholar] [CrossRef] [PubMed]
  74. Yu, B. Economic growth effects of industrial restructuring and productivity improvement: Analysis of dynamic spatial panel model with Chinese city data. China Ind. Econ. 2015, 12, 83–98. [Google Scholar] [CrossRef]
Figure 1. Research area and the division of the three regions.
Sustainability 17 05052 g001
Figure 2. Coordination level grading standard.
Sustainability 17 05052 g002
Figure 3. Temporal and spatial variation of CCD in China. (a) CCD of 30 provinces in 2011. (b) CCD of 30 provinces in 2021.
Sustainability 17 05052 g003
Figure 4. The cold and hot spots of CCD in China. (a) The cold and hot spots of CCD in 2011. (b) The cold and hot spots of CCD in 2021.
Sustainability 17 05052 g004
Figure 5. The total Gini ratio and the contribution rate of its decomposition terms.
Sustainability 17 05052 g005
Figure 6. Intra-regional differences in CCD.
Sustainability 17 05052 g006
Figure 7. Inter-regional differences in CCD.
Sustainability 17 05052 g007
Figure 8. VIF of variables and the correlation of variables with CCD. (a) VIF of varbiables. (b) Correlation analysis results.
Sustainability 17 05052 g008
Figure 9. Spatial distribution of variable regression coefficients. (a) The regression coefficients of URB; (b) the regression coefficients of FDI; (c) the regression coefficients of DIG; (d) the regression coefficients of NQP.
Sustainability 17 05052 g009
Figure 10. CCD in different scenarios. (a) The rate of change of CCD. The colors in the image represent different scenarios. (b) the CCD in China and the three regions in all scenarios.
Sustainability 17 05052 g010
Figure 11. The spatial distribution of CCD in different scenarios. (a) The spatial distribution of CCD in Scenario 1; (b) the spatial distribution of CCD in Scenario 2; (c) the spatial distribution of CCD in Scenario 3; (d) the spatial distribution of CCD in Scenario 4; (e) the spatial distribution of CCD in Scenario 5; (f) the spatial distribution of CCD in Scenario 6.
Sustainability 17 05052 g011
Figure 12. Test robustness test results. (a) Regression coefficients of variables in the different scenarios; (b) regression coefficients of variables in the reference model and test model.
Sustainability 17 05052 g012
Table 1. Assessment indicators of the CC, PR, and EG systems.
Object LevelCriterion LevelIndicator LevelPropertyWeight
Carbon cutting
(CC)
Carbon emissionsCarbon dioxide emission0.081
Carbon emission intensities0.086
Per capita carbon emissions0.082
Energy consumptionTotal energy consumption0.106
Energy intensity0.100
Energy consumption per capita0.089
Proportion of coal consumption+0.131
Carbon fixationForest coverage rate+0.224
Coverage rate of afforestation in developed area+0.101
Pollution reduction
(PR)
Air pollutionSO2 emissions0.102
NOx emissions0.110
PM emission0.090
Water pollutionCOD emissions0.128
NH3-N emissions0.100
Environmental governanceComprehensive utilization rate of solid wastes+0.160
Decontamination rate of urban refuse+0.093
Proportion of environmental governance investment in GDP+0.218
Economic growth
(EG)
Economic scaleGDP+0.192
Per capita GDP+0.137
Per capita disposable income+0.133
Industrial structurePercentage of the secondary industry0.106
Percentage of the tertiary industry+0.105
Technological innovationProportion of R&D expenditure in GDP+0.194
Patent application per R&D personnel+0.133
Table 2. Variable selection and description.
VariableAbbreviationDescriptionMeaning
UrbanizationURBProportion of urban population in total populationMeasuring the regional urbanization level and its environmental effects
Government interventionGOVRatio of environmental protection input to fiscal expenditureReflecting the intensity of local government policy regulation in environmental governance
Population sizePOPUrban population densityExamining the impact of population agglomeration on environmental pressures
Foreign direct investmentFDIForeign direct investmentAssessment of technology spillovers from international economic and trade cooperation
Industry digitizationDIGRatio of information technology service revenue to GDPCharacterization of the degree of intelligent transformation of traditional industries
New quality productive forces NQPRatio of value added of high-tech industries to industrial value addedReflecting the level of green technology innovation and industrial upgrading
Table 3. CCD in China and the three regions.
YearChinaEastCenterWest
20110.5900.6530.5530.553
20120.6120.6720.5820.573
20130.6300.6880.6010.593
20140.6450.6990.6160.611
20150.6620.7110.6360.631
20160.6880.7380.6670.653
20170.6930.7450.6690.659
20180.7150.7650.6990.677
20190.7270.7760.7100.690
20200.7320.7810.7100.699
20210.7420.7910.7220.708
Table 4. Regression coefficients of OLS model.
ParameterURBFDIDIGNQPConsR2Adjusted R2 p-ValueAICc
OLS0.034 ***0.011 ***0.009 **0.023 ***0.676 ***0.6270.6220.000−1029.7
Note: ** and *** represent p ≤ 0.05 and p ≤ 0.01, respectively.
Table 5. The spatial autocorrelation analysis of residuals.
ParameterMoran’s IZ-Valuep-Value
Residuals−0.0330.0580.460
Table 6. Regression coefficient of the variables using GWR model.
VariableRegression CoefficientPercentage of Provinces by Significance
MinMaxMeanp < 0.05 (%)Positive (%)Negative (%)
URB0.0720.6850.25376.671000
FDI −2.5972.1950.11833.331000
DIG−1.2640.421−0.09710.0066.6733.33
NQP−0.2112.5310.27556.6794.125.88
Residual−0.0900.002−0.042
Table 7. Parameter setting under different scenarios.
ScenariosParameter SettingLabel
α = β = δBaseline scenarioα = β = δ = 1/3BS
α > β > δScenario 1α = 0.5, β = 0.3, δ = 0.2S1
α > δ > βScenario 2α = 0.5, β = 0.2, δ = 0.3S2
β > α > δScenario 3α = 0.3, β = 0.5, δ = 0.2S3
β > δ > αScenario 4α = 0.2, β = 0.5, δ = 0.3S4
δ > α > βScenario 5α = 0.3, β = 0.2, δ = 0.5S5
δ > β > αScenario 6α = 0.2, β = 0.3, δ = 0.5S6
Table 8. Regression results of the GWR model in the different scenarios.
ParameterR2Adjusted R2Residual SquaresAICcBandwidth
BS0.8700.8690.289−1308.50.115
S10.8690.8670.271−1329.70.115
S30.8500.8480.281−1317.20.115
S50.8760.8740.339−1255.60.115
Disclaimer/Publisher’s Note: The statements, opinions and data contained in all publications are solely those of the individual author(s) and contributor(s) and not of MDPI and/or the editor(s). MDPI and/or the editor(s) disclaim responsibility for any injury to people or property resulting from any ideas, methods, instructions or products referred to in the content.