
Spatiotemporal Evolution and Driving Mechanisms of Composite Ecological Sensitivity in the Western Sichuan Plateau, China Based on Multi-Process Coupling Mechanisms

 and
and
Abstract
1. Introduction
2. Materials and Methods
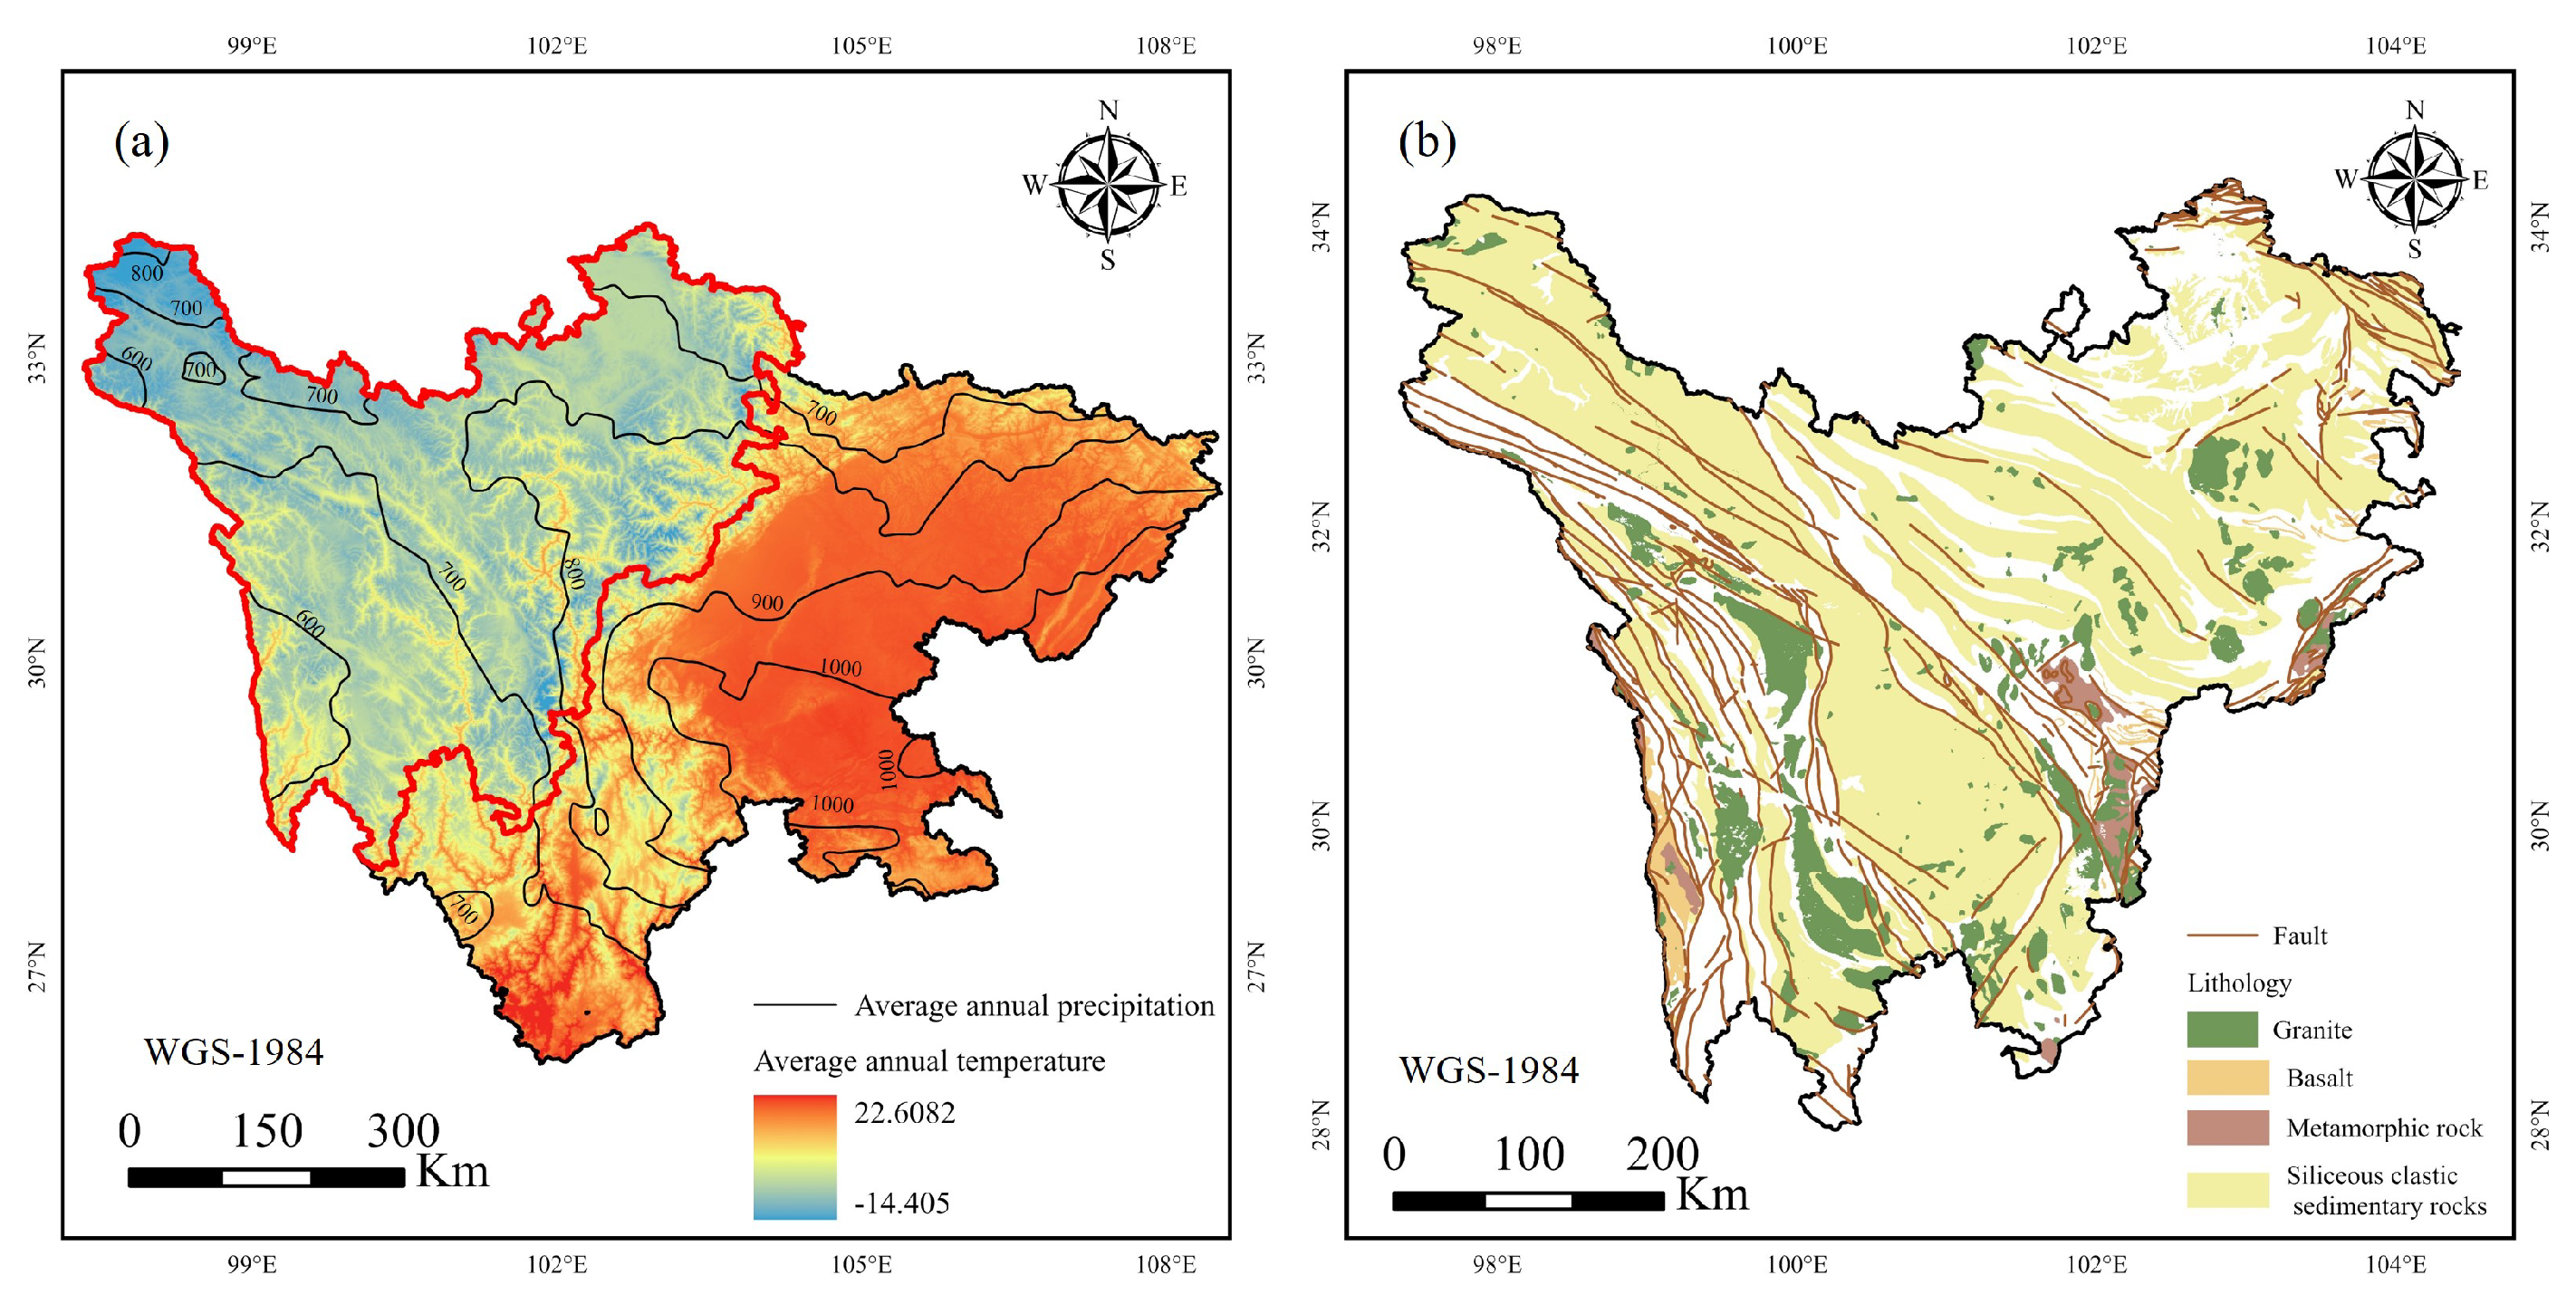
2.1. Research Area
2.2. Data Sources and Processing
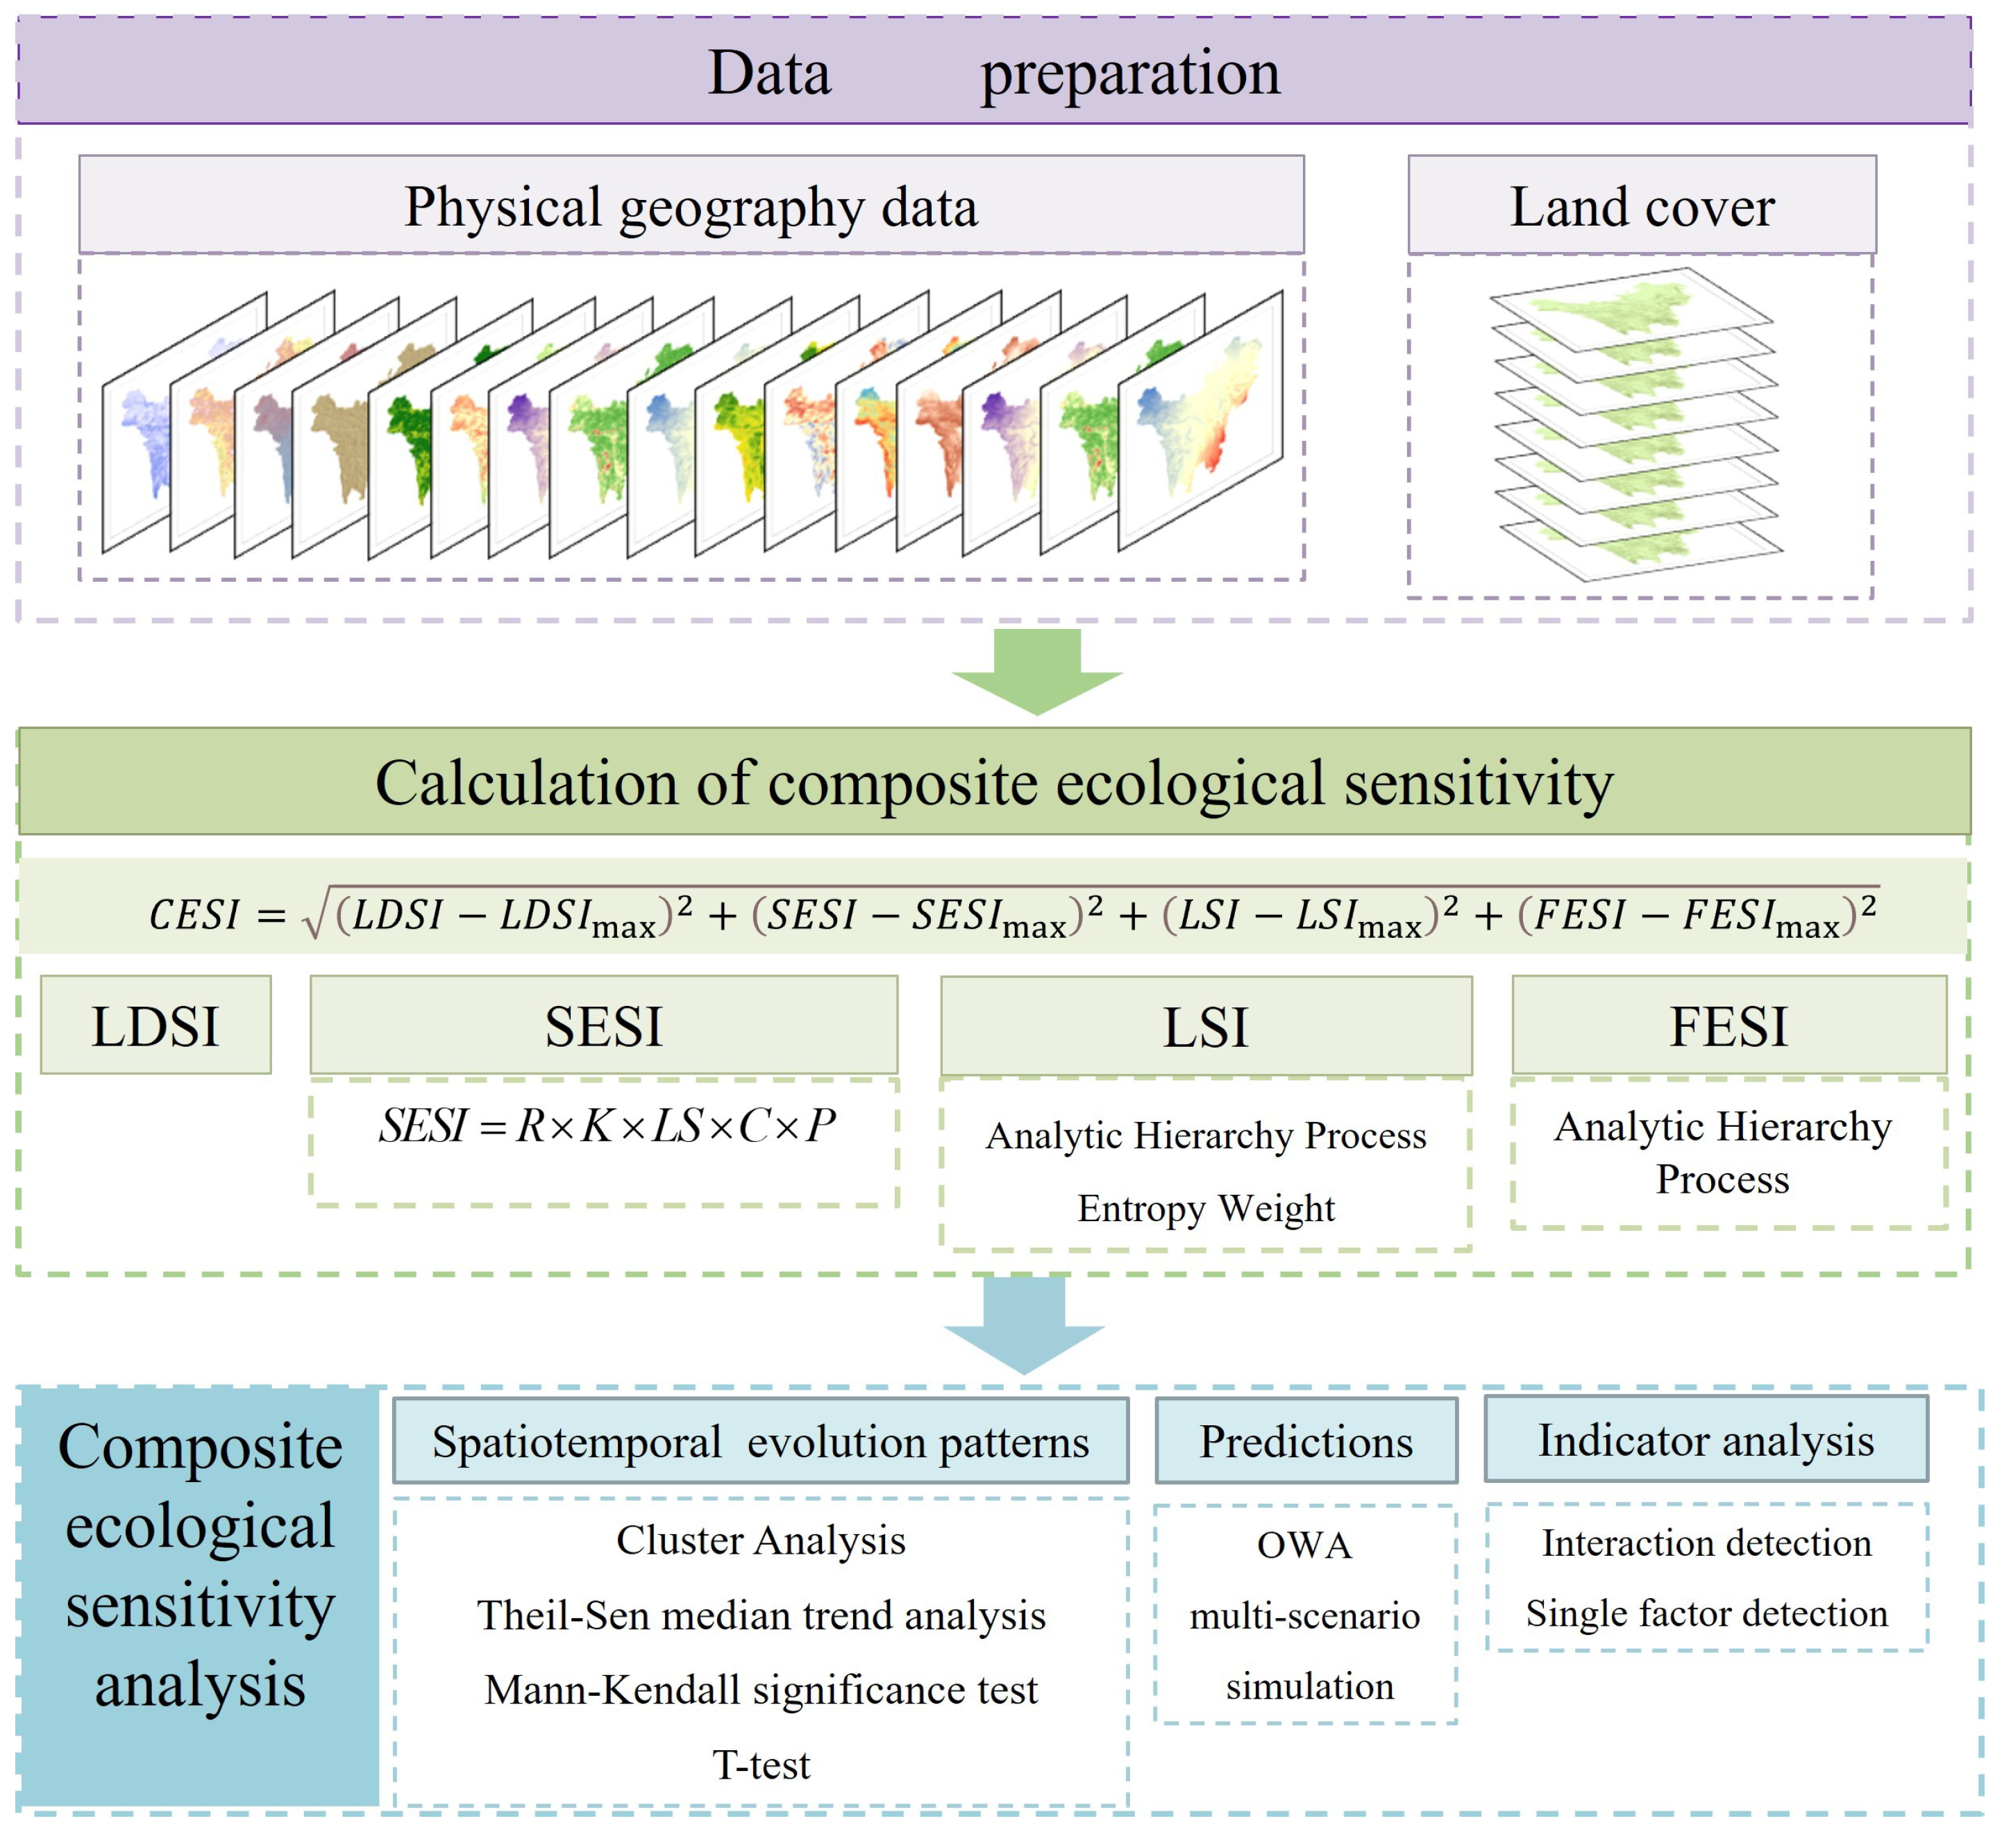
2.3. Research Methods
2.3.1. Composite Ecological Sensitivity Model Construction
- 1.
- Land Desertification Sensitivity Index
- 2.
- Soil Erosion Sensitivity Index
- 3.
- Landslide Disaster Sensitivity Index
- 4.
- Freeze-thaw erosion sensitivity index
- 5.
- Composite Ecological Sensitivity Index
2.3.2. Spatiotemporal Analysis of Composite Ecological Sensitivity
- 1.
- Mann–Kendall Abrupt Change Detection Method
- 2.
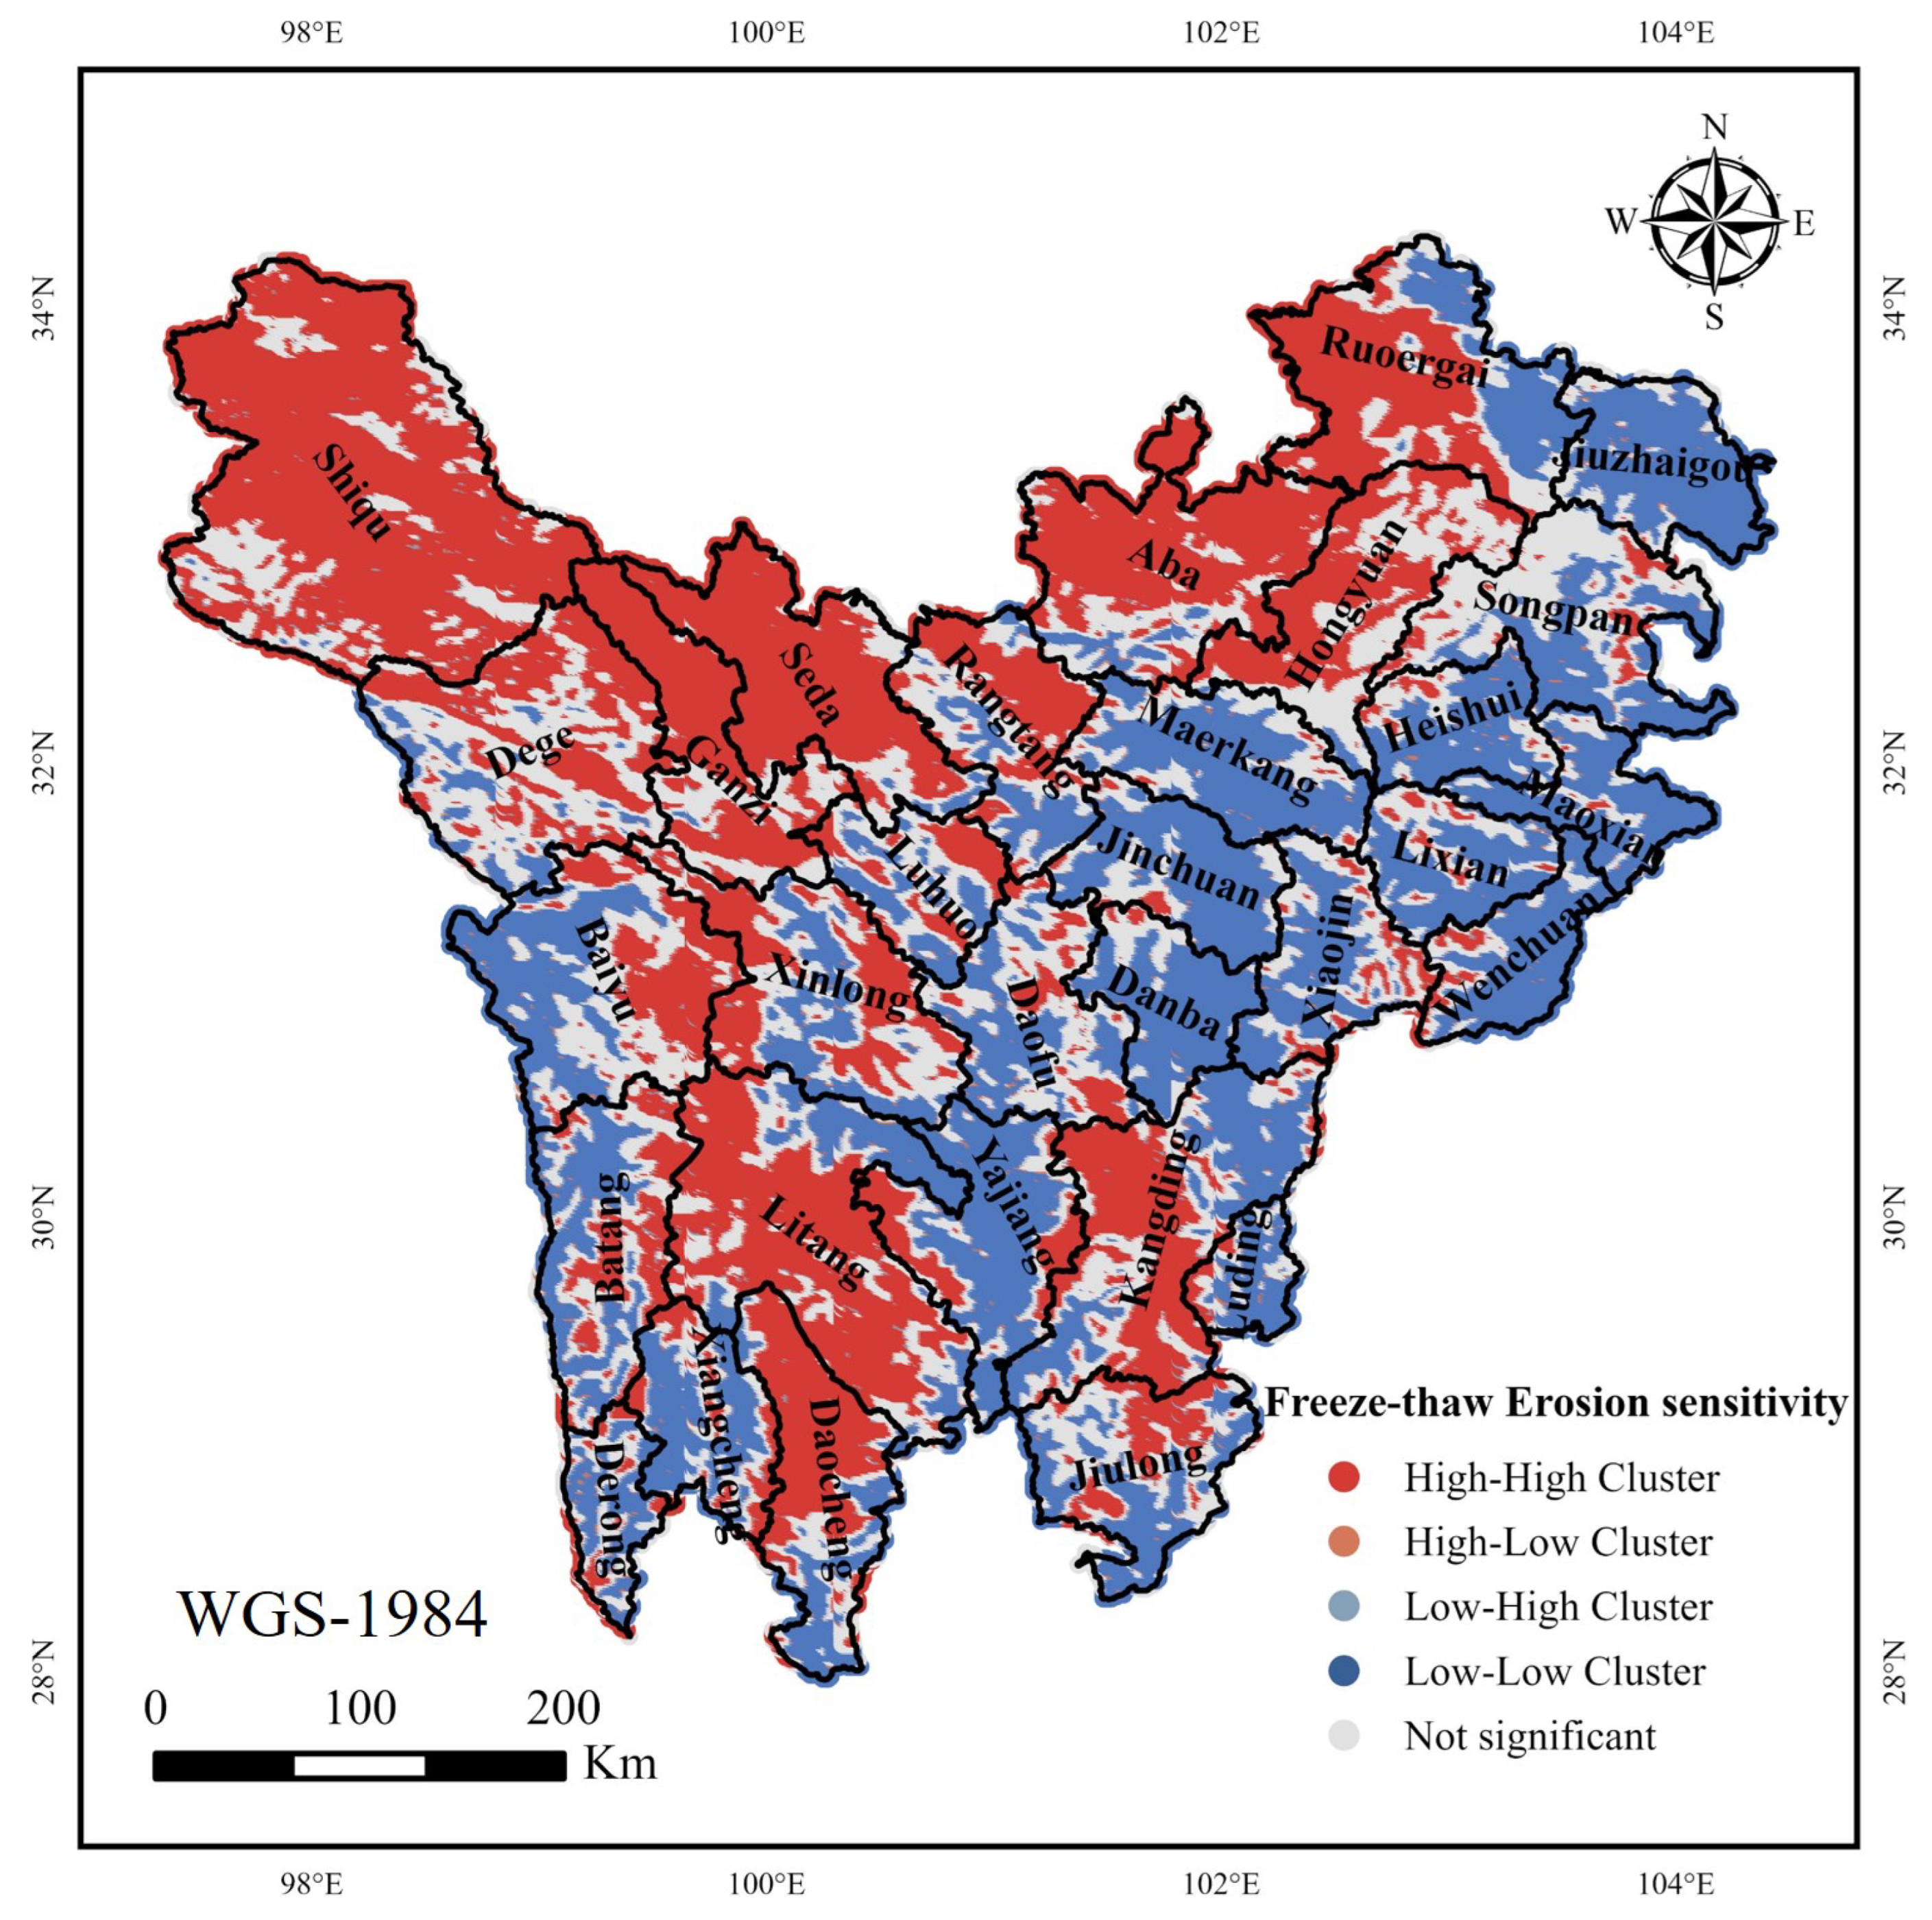
- Cluster Analysis
- 3.
- Sen+Mann–Kendall Trend Analysis Method
- 4.
- OWA multi-scenario simulation
- 5.
- Optimal Parameter Geodetector
3. Results
3.1. Single Ecological Sensitivity Characteristic
3.1.1. Land Desertification Sensitivity
3.1.2. Soil Erosion Sensitivity
3.1.3. Landslide Disaster Sensitivity
3.1.4. Freeze-Thaw Erosion Sensitivity Index
3.2. Characteristics of Composite Ecological Sensitivity
3.2.1. Spatial Characteristics of Composite Ecological Sensitivity
3.2.2. Spatiotemporal Evolution and Prediction of Composite Ecological Sensitivity
- 1.
- Temporal Evolution
- 2.
- Spatial evolution and multi-scenario simulation
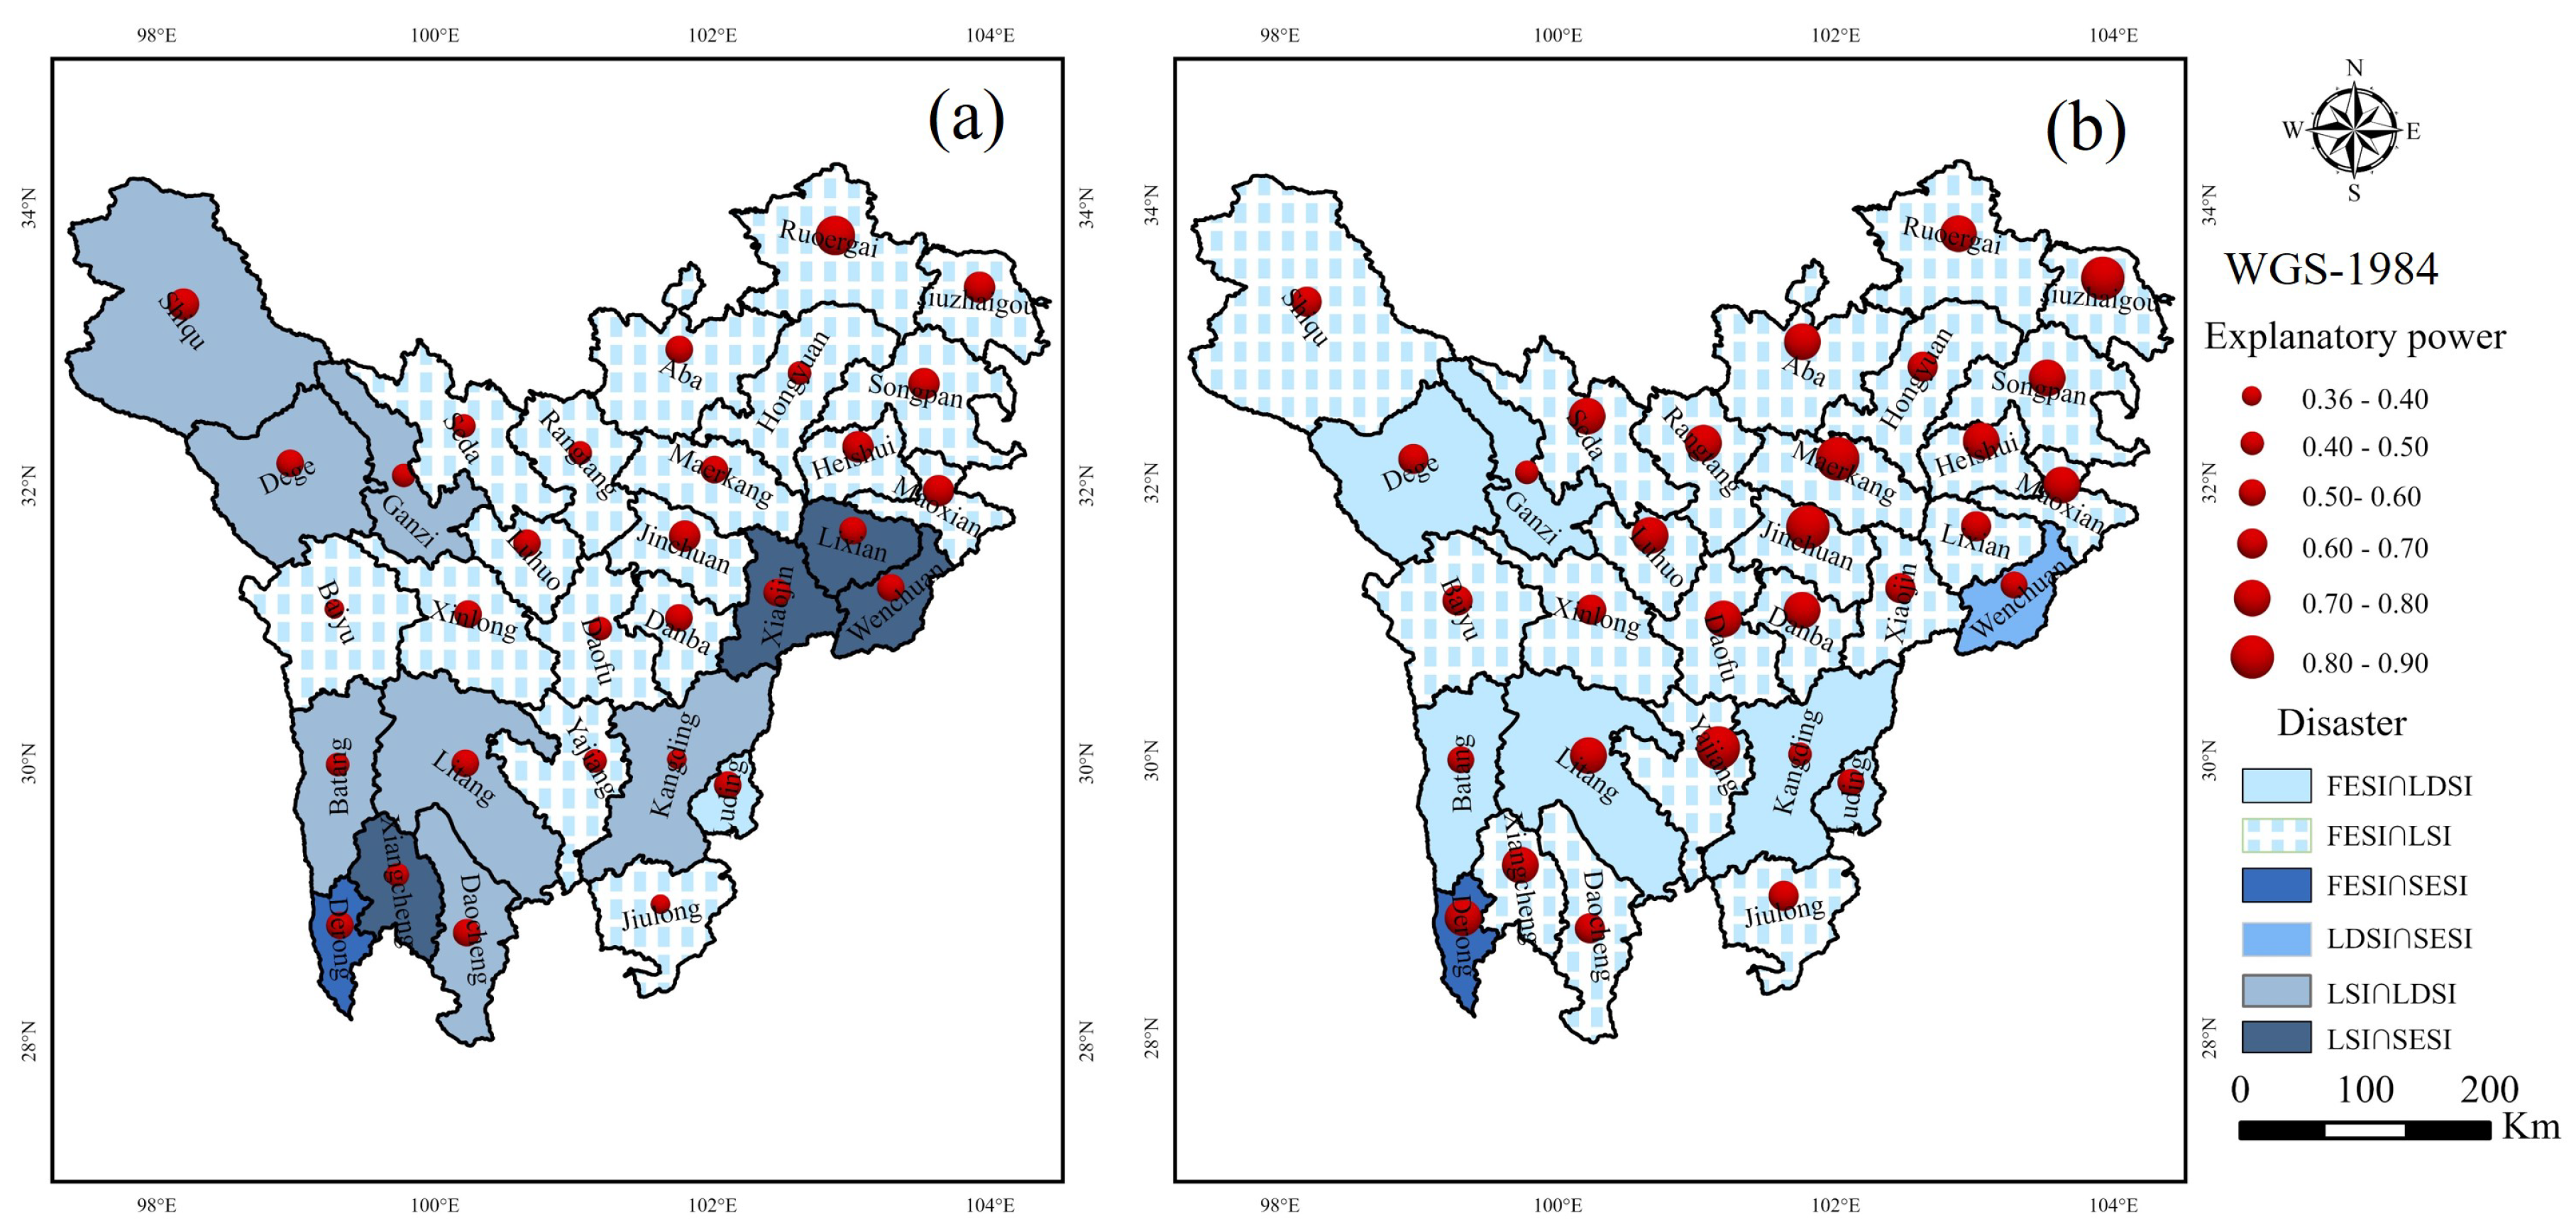
3.2.3. Driving Mechanisms of Composite Ecological Sensitivity
- Analysis of Dominant Ecological Disasters
- 2.
- Analysis of Main Driving Factors
4. Discussion
5. Conclusions
Supplementary Materials
Author Contributions
Funding
Institutional Review Board Statement
Informed Consent Statement
Data Availability Statement
Conflicts of Interest
References
- Tsou, J.Y.; Gao, Y.F.; Zhang, Y.Z.; Sun, G.Y.; Ren, J.C.; Li, Y. Evaluating urban land carrying capacity based on the ecological sensitivity analysis: A case study in Hangzhou, China. Remote Sens. 2017, 9, 529. [Google Scholar] [CrossRef]
- Zhang, J.; Wang, K.; Chen, X.M.; Zhu, W.J. Combining a fuzzy matter-element model with a geographic information system in eco-environmental sensitivity and distribution of land use planning. Int. J. Environ. Res. Public Health 2011, 8, 1206–1221. [Google Scholar] [CrossRef] [PubMed]
- Tang, H.S.; Wang, L.; Wang, Y. Spatial and Temporal Variation Characteristics of Vegetation Cover in the Tarim River Basin, China, and Analysis of the Driving Factors. Sustainability 2025, 17, 1414. [Google Scholar] [CrossRef]
- An, Y.; Xu, X.B.; Li, J.Y.; Yang, Z.Z.; Ren, C. Review on research progress of ecological sensitivity assessment. Environ. Ecol. 2024, 6, 38–44+65. [Google Scholar]
- Li, Z.Y.; Wei, W.; Zhou, L.; Liu, C.F.; Guo, Z.C.; Pang, S.F.; Zhang, J. Spatio-temporal evolution characteristics of terrestrial ecological sensitivity in China. Acta Geogr. Sin. 2022, 77, 150–163. [Google Scholar]
- Yi, Q.; Yi, R.L. Spatio-temporal Differentiation Characteristics of Ecological Sensitivity in the Middle Reaches of the Yellow River. Environ. Sci. 2024, 1–16. [Google Scholar] [CrossRef]
- Wei, W.; Li, Z.Y.; Xie, B.B.; Zhou, J.J.; Guo, Z.C. Spatial distance-based integrated evaluation of environmentally sensitivity for ecological management in northwest China. Ecol. Indic. 2020, 118, 106753. [Google Scholar] [CrossRef]
- Wei, W.; Guo, Z.C.; Zhou, L.; Xie, B.B.; Zhou, J.J. Assessing environmental interference in northern China using a spatial distance model: From the perspective of geographic detection. Sci. Total Environ. 2020, 709, 136170. [Google Scholar] [CrossRef]
- Zhang, K.J. Is the Songpan-Ganzi terrane (central China) really underlain by oceanic crust? J.-Geol. Soc. India 2001, 57, 223–230. [Google Scholar]
- Zhang, K.J.; Ji, C.; Zhou, Y.Z.; Zhang, Y.J. Tracing oceanic plateau relics in the basement of mainland China: A synthesis of aeromagnetic and seismic refraction data. Earth-Sci. Rev. 2024, 255, 104849. [Google Scholar] [CrossRef]
- Hua, T.; Zhao, W.W.; Cherubini, F.; Hu, X.P.; Pereira, P. Sensitivity and future exposure of ecosystem services to climate change on the Tibetan Plateau of China. Landsc. Ecol. 2021, 36, 3451–3471. [Google Scholar] [CrossRef] [PubMed]
- Yang, J.; Huang, X. 30 m annual land cover and its dynamics in China from 1990 to 2019. Earth Syst. Sci. Data Discuss. 2021, 13, 3907–3925. [Google Scholar] [CrossRef]
- Feng, Q.; Ma, H.; Jiang, X.M.; Wang, X.; Cao, S.X. What has caused desertification in China? Sci. Rep. 2015, 5, 15998. [Google Scholar] [CrossRef] [PubMed]
- Li, C.; Wang, Y.; Gao, Z.H.; Sun, B. Spatial and temporal characteristics of forest and grass cover in the potential range of desertification in China from 2000 to 2020. J. Geogr. 2022, 77, 2803–2816. [Google Scholar]
- Yang, D.; Yi, G.H.; Zhang, T.B.; Li, J.J.; Qin, Y.B.; Wen, B.; Liu, Z.Y. Spatiotemporal variation and driving factors of growing season NDVI in the Tibetan Pla-teau, China. J. Appl. Ecol. 2021, 32, 1361–1372. [Google Scholar]
- Cai, C.F.; Ding, S.W. Study of applying USLE and geographical information system IDRISI to predict soil erosion in small watershed. J. Soil Water Conserv. 2000, 14, 19–24. [Google Scholar]
- Islam, M.R.; Imran, H.; Islam, M.R.; Saha, G.C. A RUSLE-based comprehensive strategy to assess soil erosion in a riverine country, Bangladesh. Environ. Earth Sci. 2024, 83, 162. [Google Scholar] [CrossRef]
- Terranova, O.; Antronico, L.; Coscarelli, R.; Iaquinta, P. Soil erosion risk scenarios in the Mediterranean environment using RUSLE and GIS: An application model for Calabria (southern Italy). Geomorphology 2009, 112, 228–245. [Google Scholar] [CrossRef]
- Zhou, Y.Y.; Yue, D.X.; Liang, G.; Li, S.Y.; Zhao, Y.; Chao, Z.Z.; Meng, X.M. Risk assessment of debris flow in a mountain-basin area, western China. Remote Sens. 2022, 14, 2942. [Google Scholar] [CrossRef]
- Li, S.; Ni, Z.Y.; Zhao, Y.B.; Hu, W.; Long, Z.R.; Ma, H.Y.; Zhou, G.L.; Luo, Y.H.; Geng, C.T. Susceptibility analysis of geohazards in the Longmen Mountain Region after the Wenchuan Earthquake. Int. J. Environ. Res. Public Health 2022, 19, 3229. [Google Scholar] [CrossRef]
- Ye, H.; Bai, D.; Liu, S.Y.; Tan, S.C.; Wang, J.L.; Xie, F.M.; Zhu, Y. Spatiotemporal evolution characteristics of freeze–thaw erosion intensity in the high-cold mountainous areas of Northwestern Yunnan from 2017 to 2023. Sci. Rep. 2025, 15, 9521. [Google Scholar] [CrossRef] [PubMed]
- Wei, W.; Zhang, H.Y.; Ma, L.B.; Wang, X.F.; Guo, Z.C.; Xie, B.B.; Zhou, J.J.; Wang, J.P. Reconstruction and application of the temperature-vegetation-precipitation drought index in mainland China based on remote sensing datasets and a spatial distance model. J. Environ. Manag. 2022, 323, 116208. [Google Scholar] [CrossRef] [PubMed]
- Wei, W.; Guo, Z.C.; Xie, B.B.; Zhou, J.J.; Li, C.H. Spatiotemporal evolution of environment based on integrated remote sensing indexes in arid inland river basin in Northwest China. Environ. Sci. Pollut. Res. 2019, 26, 13062–13084. [Google Scholar] [CrossRef]
- Cao, Y.W.; Zhang, R.R.; Zhang, D.H.; Zhou, C.S. Urban agglomerations in China: Characteristics and influencing factors of population agglomeration. Chin. Geogr. Sci. 2023, 33, 719–735. [Google Scholar] [CrossRef]
- Jiang, J.M.; You, X.T. Where and when did an abrupt climatic change occur in China during the last 43 years? Theor. Appl. Climatol. 1996, 55, 33–39. [Google Scholar] [CrossRef]
- Tang, W.X.; Liu, S.G.; Feng, S.L.; Xiao, F.M.; Ogbodo, U.S. Evolution and improvement options of ecological environmental quality in the world’s largest emerging urban green heart as revealed by a new assessment framework. Sci. Total Environ. 2023, 858, 159715. [Google Scholar] [CrossRef]
- Zheng, J.H.; Wang, H.L.; Liu, B.J. Impact of the long-term precipitation and land use changes on runoff variations in a humid subtropical river basin of China. J. Hydrol. Reg. Stud. 2022, 42, 101136. [Google Scholar] [CrossRef]
- Wang, J.S. Determining the most accurate program for the Mann-Kendall method in detecting climate mutation. Theor. Appl. Climatol. 2020, 142, 847–854. [Google Scholar] [CrossRef]
- Lunetta, R.S.; Knight, J.F.; Ediriwickrema, J.; Lyon, J.G.; Worthy, L.D. Land-cover change detection using multi-temporal MODIS NDVI data. In Geospatial Information Handbook for Water Resources and Watershed Management, Volume II; CRC Press: Boca Raton, FL, USA, 2022; pp. 65–88. [Google Scholar]
- Fernandes, R.; Leblanc, S.G. Parametric (modified least squares) and non-parametric (Theil–Sen) linear regressions for predicting biophysical parameters in the presence of measurement errors. Remote Sens. Environ. 2005, 95, 303–316. [Google Scholar] [CrossRef]
- Li, T.; Li, M.Y.; Ren, F.; Tian, L. Estimation and spatio-temporal change analysis of NPP in subtropical forests: A case study of Shaoguan, Guangdong, China. Remote Sens. 2022, 14, 2541. [Google Scholar] [CrossRef]
- Zhong, X.Z.; Li, J.; Wang, J.L.; Zhang, J.P.; Liu, L.F.; Ma, J. Linear and nonlinear characteristics of long-term NDVI using trend analysis: A case study of Lancang-Mekong River Basin. Remote Sens. 2022, 14, 6271. [Google Scholar] [CrossRef]
- Cao, Q.; Zhang, X.W.; Lei, D.M.; Guo, L.Y.; Sun, X.H.; Kong, F.E.; Wu, J.S. Multi-scenario simulation of landscape ecological risk probability to facilitate different decision-making preferences. J. Clean. Prod. 2019, 227, 325–335. [Google Scholar] [CrossRef]
- Han, C.Q.; Zheng, J.H.; Guan, J.Y.; Yu, D.L.; Lu, B.B. Evaluating and simulating resource and environmental carrying capacity in arid and semiarid regions: A case study of Xinjiang, China. J. Clean. Prod. 2022, 338, 130646. [Google Scholar] [CrossRef]
- Qian, W.Q.; Zhao, Y.; Li, X.Y. Construction of ecological security pattern in coastal urban areas: A case study in Qingdao, China. Ecol. Indic. 2023, 154, 110754. [Google Scholar] [CrossRef]
- Song, Y.Z.; Wang, J.F.; Ge, Y.; Xu, C.D. An optimal parameters-based geographical detector model enhances geographic characteristics of explanatory variables for spatial heterogeneity analysis: Cases with different types of spatial data. GIScience Remote Sens. 2020, 57, 593–610. [Google Scholar] [CrossRef]
- Wang, G.J.; Peng, W.F.; Zhang, L.D.; Zhang, J. Quantifying the impacts of natural and human factors on changes in NPP using an optimal parameters-based geographical detector. Ecol. Indic. 2023, 155, 111018. [Google Scholar] [CrossRef]
- Zheng, B.F.; Wang, J.; Wu, S.Y.; Wu, H.Q.; Xie, Z.Y.; Wan, W. Spatio-temporal patterns and driving mechanisms of rice biomass during the growth period in China since 2000. Ecol. Indic. 2023, 153, 110389. [Google Scholar] [CrossRef]
- Peng, W.F.; Kuang, T.T.; Tao, S. Quantifying influences of natural factors on vegetation NDVI changes based on geographical detector in Sichuan, western China. J. Clean. Prod. 2019, 233, 353–367. [Google Scholar] [CrossRef]
- Xu, Q.; Yang, J.; Li, L.; Xue, P. Quantitative study on spatiotemporal changes of soil erosion in western Sichuan based on CSLE model. Resour. Inf. Eng. 2024, 39, 76–79+83. [Google Scholar]
- Ran, T.; Xu, R.G.; Zhou, H.F.; Zhang, J.H.; Chen, H.; Wang, Y.K.; Sun, J.; Cui, Y.Z. Type, formation mechanism and distribution regularity of landslides in the deeply incised valley area of Yalong River Basin—A case study of Zituoxi–Malangcuo river section. Geol. China 2024, 51, 511–524. [Google Scholar]
- Jiang, J.Q.; Wu, Z.H.; Huang, X.L.; Huang, F.P.; Wang, S.F. Development characteristics and formation mechanism of giant landslides on the main stream of the Jinsha River. Prog. Earthq. Sci. 2024, 54, 680–695. [Google Scholar]
- Liu, X.H.; Yao, X.; Yang, B.; Tang, W.K.; Zhou, Z.K. InSAR-based indentification and spatial distribution analysis of active landslides in the Western Sichuan Plateau. J. Geomech. 2023, 29, 111–126. [Google Scholar]
- Wu, Q.; Cao, Y.; Zhang, Y.J.; Su, D.; Fang, X.Q. Linking ecosystem services trade-offs, human preferences and future scenario simulations to ecological security patterns: A novel methodology for reconciling conflicting ecological functions. Appl. Geogr. 2025, 176, 103534. [Google Scholar] [CrossRef]
- Wang, X.F.; Zheng, Y.Y.; Sun, Z.C.; Zhou, J.T.; Wang, X.X.; Zhu, M.N. Evolution and Simulation of Ecological Vulnerability in Qinghai-Xizang Plateau Nature Reserve. Environ. Sci. 2025, 46, 1633–1644. [Google Scholar]
- Lü, Y.Y.; Liu, Z.H.; Ye, B.P.; Zhang, S.; Zhang, Y. Evaluation on ecological sensitivity of Chuanxi Plateau based on GIS. Res. Soil Water Conserv. 2016, 23, 272–277. [Google Scholar]
- Da, F.Q. Issues that need to be solved urgently after Sichuan launched the natural forest resource protection project. Ecol. Econ. 1999, 5, 64–67. [Google Scholar]
- Lin, B.; Liu, Q.; You, X.; Pang, X. Engineering of Changing cultivation into tree planting and its effects to the development of rural economics in Western Sichuan. China J. Mt. Sci. 2002, 20, 438–444. [Google Scholar]
- Wu, C.S.; Wang, W.J.; Liu, X.F.; Zhang, Z.; Guo, X.; Chen, C.; Feng, Y. Research on ecological restoration in Wenchuan earthquake badly-damaged regions based on TM Journal of Geo. Inf. Sci. 2012, 14, 666–672. [Google Scholar]
- Yang, B.; Cao, C.X.; Tian, R.; Liu, C.; Tian, H.J.; Liu, D.; Xiang, H.B. Recovery evaluation of the eco-environ mental quality after the Wenchuan Earthquake. J. Remote Sens. 2014, 18, 946–957. [Google Scholar]
- Nie, L.M.; Zhang, Z.H.; Lu, H. Vulnerability assessment and analysis of cryosphere changes in the Western Sichuan Plateau. Arctic Antarct. Alp. Res. 2024, 56, 2312594. [Google Scholar] [CrossRef]
- Liu, T.J.; Zhang, M.; Zou, D.J.; Liu, J.P.; Ou, J.P. Analysis and zonation of freeze–thaw action in the Chinese Plateau region considering spatiotemporal climate characteristics. Engineering 2024, 42, 308–325. [Google Scholar] [CrossRef]
- Zhang, J.G.; Liu, S.Z.; Fan, J.R. Identification and evaluation of freeze-thaw erosion in Sichuan province on the basis of GIS. Mt. Res. 2005, 23, 248–253. [Google Scholar]
- Zhang, H.J. A study on the characteristics of climate change on northwestern Sichuan plateau. J. Southwest. Univ. (Nat. Sci. Ed.) 2014, 36, 148–156. [Google Scholar]
- Tie, Y.B.; Bai, Y.J.; Song, Z. Damage types and hazards effects from freezing mThawing process in plateau of western Sichuan Province. Bull. Soil Water Conserv. 2015, 35, 241–245. [Google Scholar]
- Zhang, L.; Ren, F.P.; Li, H.; Cheng, D.B.; Sun, B.Y. The influence mechanism of freeze-thaw on soil erosion: A review. Water 2021, 13, 1010. [Google Scholar] [CrossRef]
- Li, P.Y.; Tie, Y.B.; Wang, D.H.; Tang, Y.Q. Characteristics and Cause Analysis of Freeze-Thaw Landslide on Western Sichuan Plateau. Bull. Soil Water Conserv. 2014, 34, 173–177. [Google Scholar] [CrossRef]


| Types of Sensitivity | Name | Data Source | Data Accuracy |
|---|---|---|---|
| Land desertification | NDVI | Resources and Environmental Sciences and Data Center, Chinese Academy of Sciences | 1000 m |
| (https://www.resdc.cn/) (accessed on 1 April 2024) | |||
| Soil erosion | Soil erodibility factor | National Earth System Science Data Center | 1000 m |
| (https://www.geodata.cn/) (accessed on 28 March 2024) | |||
| Slope length and steepness | National Earth System Science Data Center | 1000 m | |
| (https://www.geodata.cn/) (accessed on 28 March 2024) | |||
| Annual precipitation | Resources and Environmental Sciences and Data Center, Chinese Academy of Sciences | 1000 m | |
| (https://www.resdc.cn/) (accessed on 28 March 2024) | |||
| Land cover | See paper [12] | 30 m | |
| Landslide Disaster | Lithology | Resources and Environmental Sciences and Data Center, Chinese Academy of Sciences | 1000 m |
| (https://www.resdc.cn/) (accessed on 2 April 2024) | |||
| Elevation (slope, aspect) | Geospatial Data Cloud | 30 m | |
| (https://www.gscloud.cn/) (accessed on 2 April 2024) | |||
| River | OpenStreetMap | ||
| (https://www.openstreetmap.org) (accessed on 3 April 2024) | |||
| Fault | China Geological Survey Geological Cloud | ||
| (https://geocloud.cgs.gov.cn/) (accessed on 4 April 2024) | |||
| Freeze-thaw erosion | Temperature | NASA | 1000 m |
| (https://ladsweb.modaps.eosdis.nasa.gov) (accessed on 7 April 2024) |
| Land Type | P | Land Type | P |
|---|---|---|---|
| Farmland | 0.25 | Snowfield | 0.2 |
| Forest | 1 | Bare Land | 0.4 |
| Shrubland | 1 | Impervious surface | 0.1 |
| Grassland | 0.9 | Wetlands | 0.1 |
| Waters | 0 |
| Level | LDSI | SESI | LSI | FESI | CESI |
|---|---|---|---|---|---|
| Insensitive | 0.80–1.00 | 0.00–0.24 | 0.18–0.40 | 0.14–0.29 | 4.11–4.32 |
| Light | 0.60–0.80 | 0.24–0.49 | 0.40–0.47 | 0.29–0.36 | 3.87–4.11 |
| Moderate | 0.40–0.60 | 0.49–0.65 | 0.47–0.53 | 0.36–0.41 | 3.52–3.87 |
| Intense | 0.20–0.40 | 0.65–0.83 | 0.53–0.58 | 0.41–0.47 | 2.95–3.52 |
| Extreme | 0.00–0.20 | 0.83–1.00 | 0.58–0.82 | 0.47–0.69 | 0.63–2.95 |
| Order Weight | = 0.1 | = 0.5 | = 0.8 | = 1 | = 1.2 | = 2 | = 10 | = 10,000 | |
|---|---|---|---|---|---|---|---|---|---|
| 1.00 | 0.87 | 0.50 | 0.33 | 0.25 | 0.19 | 0.06 | 0.00 | 0.00 | |
| 0.00 | 0.06 | 0.21 | 0.24 | 0.25 | 0.25 | 0.19 | 0.00 | 0.00 | |
| 0.00 | 0.04 | 0.16 | 0.22 | 0.25 | 0.27 | 0.31 | 0.06 | 0.00 | |
| 0.00 | 0.03 | 0.13 | 0.21 | 0.25 | 0.29 | 0.44 | 0.94 | 1.00 | |
| Risk attitude | Most optimistic | Optimism | Slightly optimistic | No preference | Slightly pessimistic | Pessimistic | Most pessimistic |
| Factors | Name | Q Value | Classification Methods | Number of Classifications |
|---|---|---|---|---|
| Annual Temperature Difference | 0.3182 | Quantile Classification Method | 11 | |
| Distance to Fault | 0.1732 | Standard Deviation Classification Method | 9 | |
| Slope | 0.1609 | Quantile Classification Method | 9 | |
| Distance to River | 0.1354 | Standard Deviation Classification Method | 9 | |
| Lithology | 0.1277 | Quantile Classification Method | 9 | |
| Artificial Measures | 0.1249 | Standard Deviation Classification Method | 8 | |
| Soil Erodibility | 0.1180 | Quantile Classification Method | 11 | |
| NDVI | 0.1135 | Geometric Interval Classification Method | 11 | |
| Elevation | 0.0727 | Natural Breaks Classification Method | 10 | |
| Aspect | 0.0154 | Quantile Classification Method | 11 | |
| Annual Precipitation | 0.0142 | Standard Deviation Classification Method | 11 | |
| Slope Length | 0.0049 | Standard Deviation Classification Method | 11 |
Disclaimer/Publisher’s Note: The statements, opinions and data contained in all publications are solely those of the individual author(s) and contributor(s) and not of MDPI and/or the editor(s). MDPI and/or the editor(s) disclaim responsibility for any injury to people or property resulting from any ideas, methods, instructions or products referred to in the content. |
© 2025 by the authors. Licensee MDPI, Basel, Switzerland. This article is an open access article distributed under the terms and conditions of the Creative Commons Attribution (CC BY) license (https://creativecommons.org/licenses/by/4.0/).
Share and Cite
Chen, D.; Zou, Y.; Zhu, J.; Wei, W.; Liang, D.; Zhang, W.; Cheng, W. Spatiotemporal Evolution and Driving Mechanisms of Composite Ecological Sensitivity in the Western Sichuan Plateau, China Based on Multi-Process Coupling Mechanisms. Sustainability 2025, 17, 4941. https://doi.org/10.3390/su17114941
Chen D, Zou Y, Zhu J, Wei W, Liang D, Zhang W, Cheng W. Spatiotemporal Evolution and Driving Mechanisms of Composite Ecological Sensitivity in the Western Sichuan Plateau, China Based on Multi-Process Coupling Mechanisms. Sustainability. 2025; 17(11):4941. https://doi.org/10.3390/su17114941
Chicago/Turabian StyleChen, Defen, Yuchi Zou, Junjie Zhu, Wen Wei, Dan Liang, Weilai Zhang, and Wuxue Cheng. 2025. "Spatiotemporal Evolution and Driving Mechanisms of Composite Ecological Sensitivity in the Western Sichuan Plateau, China Based on Multi-Process Coupling Mechanisms" Sustainability 17, no. 11: 4941. https://doi.org/10.3390/su17114941
APA StyleChen, D., Zou, Y., Zhu, J., Wei, W., Liang, D., Zhang, W., & Cheng, W. (2025). Spatiotemporal Evolution and Driving Mechanisms of Composite Ecological Sensitivity in the Western Sichuan Plateau, China Based on Multi-Process Coupling Mechanisms. Sustainability, 17(11), 4941. https://doi.org/10.3390/su17114941