Abstract
Road transport remains a dominant mode of transportation in Europe, yet it significantly contributes to fatalities and injuries, particularly in crashes involving heavy goods vehicles and trucks. Advanced Driver Assistance Systems (ADAS) are widely recognized as a promising solution for improving truck safety. However, given that the average age of the EU truck fleet is 12 years and ADAS technologies is mandatory for new vehicles from 2024, their full impact on crash reduction may take over a decade to materialize. To address this delay, retrofitting ADAS onto existing truck fleets presents a viable strategy for enhancing road safety more promptly. This study integrates a systematic literature review, cost–benefit analysis, and a pilot field test to assess the feasibility and effectiveness of retrofitting ADAS. The literature review categorizes ADAS technologies based on their crash prevention potential, cost-effectiveness, market availability, and overall efficacy. A cost–benefit analysis applied to the Italian context estimates that ADAS retrofitting could save over 250 lives annually and reduce societal costs by more than €350 million. Moreover, the economic analysis indicates that the installation cost of retrofitted ADAS is outweighed by the societal savings associated with prevented crashes. Finally, pilot field testing suggests high user acceptance, providing a foundation for further large-scale studies. In conclusion, retrofitting ADAS onto existing truck fleets represents an effective and immediate strategy for significantly reducing truck-related crashes in Europe, bridging the gap until newer, ADAS-equipped vehicles dominate the fleet.
1. Introduction
In the last decade, the number of trucks and heavy vehicles necessary for primary services, such as public transport, deliveries and logistics, and urban services, significantly increased in Europe [1]. The truck category, including light trucks (N1 category), lorries (N2 and N3) and coaches (M2 and M3) [2], accounts for about 34 million vehicles in the European Union [3]. The use of trucks in densely populated areas by vulnerable road users (pedestrians, bicyclists, and motorcyclists) or on highways for long trips, is cause of a high number of crashes with life-changing injuries and fatalities [4]. In 2019, 22,800 road traffic collision fatalities occurred in Europe: about 23% of these crashes involved at least one truck [4]. Over the past decade, the reduction in fatalities from crashes involving trucks has been slower (−16%) than for passenger cars (−21%) [4], suggesting that current technological safety improvements for trucks may not be sufficient to meet the European goals of achieving zero road fatalities by 2050 [5].
In recent years, technological advancements have increasingly focused on enhancing the protection of vulnerable road users like pedestrian, cyclist and motorcyclist from vehicle-related hazards, including those posed by trucks [6]. Passive safety measures, such as the implementation of soft bumpers, pedestrian airbags, crumple zones have been introduced to reduce the severity of injuries during collisions with pedestrians. These systems aim to minimize the consequences of a crash once it occurs, making them essential for reducing the impact of crashing involving unprotected road users [7]. In addition, various active safety technologies, such as Anti-lock Braking Systems (ABS), Electronic Stability Control (ESC), and traction control, have been implemented to prevent skidding, improve vehicle handling, and maintain control during emergency manoeuvres. Despite these important advances, the most significant contributions to a safer transport system, especially in preventing crashes, is coming from Advanced Driver Assistance Systems (ADAS) [7]. For trucks, ADAS technologies such as Automatic Emergency Braking (AEB), Lane Departure Warning, Blind Spot Detection, and Adaptive Cruise Control have become critical tools in preventing crashes and safeguarding both unprotected road users and vehicle occupants [8]. These systems, focused on collision avoidance, represent a key pillar in modern vehicle safety, particularly for large vehicles like trucks, which represent the most promising solution among on-board technologies for improving safety [9]. ADAS have shown to be capable of substantially reducing the risk and the consequences of crashes and providing technological support for an efficient transport system [9]. In Europe, most of the ADAS technologies are mandatory from 2024 on new trucks [10], but due average fleet renewal time (about 12 years [11]), the expected benefits will become tangible not earlier than in the next decade. To accelerate this process, one promising solution is to adopt commercially available aftermarket ADAS on the current fleets [12]. This measure could bring a rapid and tangible increase in the safety of all road users, but its implementation, in terms of feasibility, benefits and costs must be assessed thoroughly. Open issues are still related to the technologies and ADAS functionalities commercially available, their potential effectiveness, the economic sustainability in adopting retrofit ADAS on trucks and their acceptability among drivers.
This study deals with a critical safety challenge: the growing number of trucks and heavy vehicles in Europe coupled with the time required for replacing older models with new vehicles equipped with ADAS. To address this issue, our research explores the potential of retrofitting existing truck fleets with innovative aftermarket ADAS. The study aims to: (i) identify currently available technical solutions that could significantly reduce crashes, injuries, and fatalities involving heavy vehicles in the next decade; (ii) evaluate the economic benefits of retrofitting ADAS on current fleets; and (iii) develop a test procedure to assess the applicability and acceptability of these systems among end-users. This approach offers a novel and practical strategy to enhance road safety without waiting for fleet renewal.
2. Materials and Methods
This study was organized into three parts employing different methodologies selected to address the specific research questions. First, a systematic review of the scientific literature was conducted to review published studies dealing with ADAS for trucks and identify a broad list of technologies previously investigated, and their potential effectiveness in preventing crashes, including those systems available for retrofit. Second, a cost–benefit analysis was conducted to estimate the cost-effectiveness of retrofitting ADAS on actual truck fleets, employing Italy as a case study. The third part of the study investigated trough pilot test campaign conducted on a light truck, the applicability and acceptability of a commercially available retrofit ADAS.
2.1. Systematic Review Procedure
The Cochrane Handbook for Systematic Reviews of Interventions [13] was used as the guideline for the systematic review, following the approach used by authors in a previous work [14]. A literature search was conducted in the following databases: Google Scholar, Scopus, PubMed, IEEE Xplore, and the Cochrane Library. In each database, the search strings combined one word referring to truck (e.g., “truck”, “heavy vehicle”; “articulated vehicle”; etc.) with any word of a set referring to ADAS, V2V technologies and driver acceptance (see Appendix A for the full list). After the exclusion of duplicates, a total of 1357 documents were identified. Five reviewers conducted the selection process in four phases. In the first phase, the reviewers defined the inclusion and exclusion criteria and carried out a joint selection session for training. The agreement among reviewers was then assessed on a set of 20 documents, obtaining a satisfactory level of agreement (K-Fleis = 0.41) [15,16]. In the second phase, the reviewers screened the study titles and, whenever necessary, the abstracts, excluding ineligible references, thus obtaining 415 studies. In the third phase, all abstracts and available full texts were then checked for another step of the selection process, obtaining 190 papers for further review. The final selection was conducted analysing the papers’ full text, considering the following parameters: Sampling, Study Type, ADAS considered, Target Condition, Language, and Time of publication (the full list of inclusion and exclusion criteria are reported in Appendix B). Thirty-two (32) papers were finally included in the review (see Figure 1).
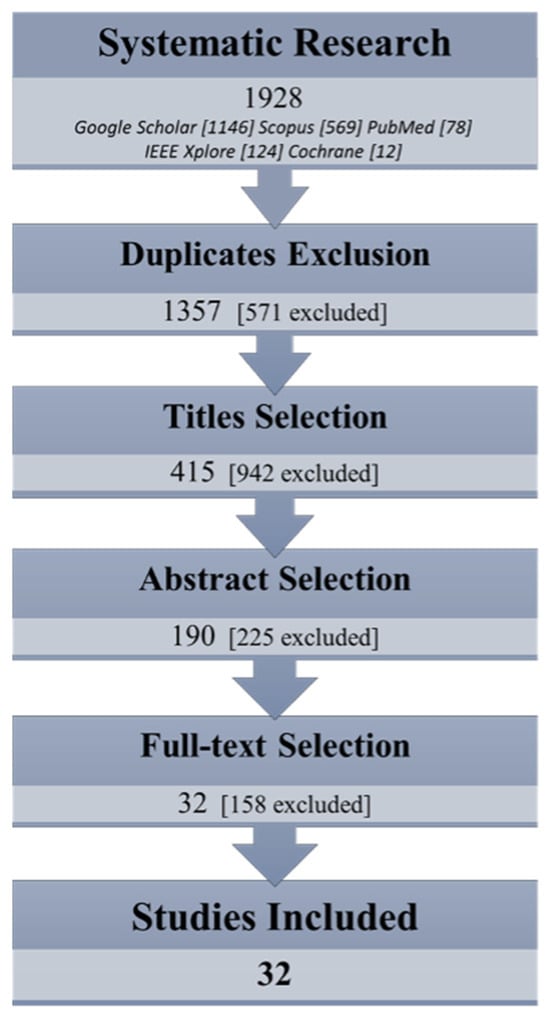
Figure 1.
Flow chart of the literature review selection process.
Methods and results of each study included in the final list were then analyzed in group discussions by the five reviewers, to evaluate the quality of results and the presence of biases. The assessment of the study reliability was based on the following methodological aspects: data source, statistical analysis, sample size, criteria for the case selection, experimental test procedures, and appropriate interpretation of the results. Lastly, for each study, key results linked with the research questions, reviewers’ remarks and notes concerning bias and limitations were collected. Based on both findings and limitations, whenever possible, the reviewers extrapolated data regarding the effectiveness in terms of crash injury mitigation and driver acceptance of each ADAS technology.
2.2. Cost–Benefit Analysis Procedure
The cost–benefit analysis aimed to achieve an economic evaluation of retrofitting ADASs on trucks, which in this study includes light trucks (N1 category), lorries (N2 and N3) and coaches (M2 and M3) [2], employing as a case study the Italian fleet of vehicles and related crash data. The economic benefits were calculated for all the ADAS functionalities identified during the systematic review of the literature suitable for retrofitting: Forward Collision Warning (FCW), Lane Departure Warning (LDW), Blind-Spot Detection (BSD), Fatigue Warning System (FWS), and Pedestrian and Cyclist Collision Warning (PCW). All these technologies are classified as Warning Systems (see Figure 2), while active systems were excluded from the analysis since, according to [17], OEMs do not grant access to vehicle security electronics (brakes, steering or throttle controls) through external systems. Therefore, the “Dynamics Control Systems”, including Lane Keeping Assist (LKA) or Autonomous Emergency Braking (AEB), which intervene directly on brakes or steering, are not suitable for retrofitting.
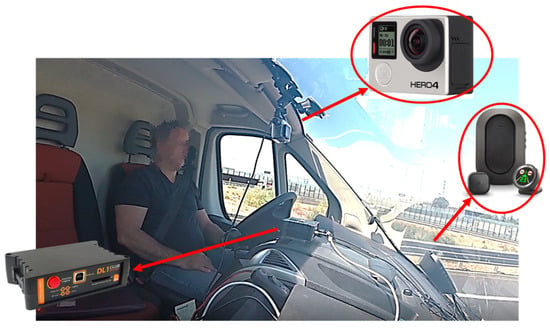
Figure 2.
Recording view of the vehicle’s cabin and instrumentation (GoPro hero4 cameras, Mobileye 8 Connect, and Race Technology DL1club datalogger).
Being the effectiveness of ADASs strongly influenced by the specific crash configuration, the first step of the analysis aimed to classify crashes recorded into the Italian crash database (ISTAT—[18]) in different clusters of crash configurations. Then, at each cluster was assigned a potential applicability and effectiveness of each ADASs functionality. Ten clusters were identified, and for each of them, a set of pictograms (see Appendix C) were defined to characterize the crash configuration. For each cluster of crash configurations, reviewers identified ADAS functionalities that could be potentially effective in each crash configuration based on findings from the literature review (see Table 1).

Table 1.
ADAS functionality applicability per crash scenario (see Appendix C for detailed description of crash configuration).
To estimate the potential economic benefits in the Italian context, it was required to identify the number of vehicles potentially involved in the measure of retrofitting ADASs. In 2019 the truck fleet in Italy accounted for 4.2 million vehicles [11]. Most of them (83%) were registered before 2014, when FCW and LDW became mandatory for heavy trucks (N2, N3) and coaches (M2, M3). Therefore, in the analysis, 100% of the trucks registered in Italy were considered suitable for retrofitting BSD, PCW and FWS (considering that such technologies were not mandatory on trucks at that time), while 83% of the trucks were considered suitable for retrofitting LDW and FCW, excluding trucks registered after 2019 (17%).
The cost assessment of retrofitting ADAS was performed based on the purchase price and maintenance costs of ADAS devices. The estimate available in the literature [12] were refined with a market analysis updated in 2021 of commercially available technologies for ADAS retrofit (see Table 2).

Table 2.
Costs considered per ADAS technology from [12] and market analysis.
The benefit estimation was made considering ADAS effectiveness in terms of crash reduction calculated in the crash scenarios where according to the literature, such technologies were potentially effective. The systematic review identified 32 studies assessing ADAS effectiveness, but none of them focused on retrofit solutions. In this study, the effectiveness of ADAS factory-fitted and the corresponding retrofit solution was considered the same.
The economic benefits of retrofitting ADASs were calculated on annual basis, employing the number of crashes that occurred in one year in each cluster of crash configurations in which the ADASs were considered applicable. To estimate the economic benefits deriving from the reduction in crashes, fatalities, and injuries due to ADAS retrofitting, a tool developed in the European Commission funded project called “SafetyCube” was used to calculate the saved societal costs [19]. These costs were based on data provided by the Italian Ministry of Transport [20].
The final assessment of benefit–cost ratios was calculated employing the Decision Support System developed in the SafetyCube project [21]. Based on the number of crashes, the effectiveness of the considered ADAS functionalities, and the estimated costs, the tool provided the number of crashes avoided and the benefit–cost ratio.
2.3. Pilot Testing Procedure
2.3.1. ADAS System Selection and Functionalities
The third part of the study was a pilot testing investigation on the acceptability among users of technologies for retrofitting ADAS commercially available. A market analysis was performed in order to build a comprehensive database of commercially available devices. The systems were classified based on the available ADAS functionalities, purchase price, availability of technical information, Italian retailers and homologations (see Table 3). The devices providing LDW and FCW functionalities were selected for detailed analysis. They were compared considering the additional ADAS functionalities available and their operating speed range.

Table 3.
Comparison of the five most comprehensive ADAS devices commercially available identified by the market analysis.
The favorite compromise between operating range, price and ADAS functionalities was found in the Mobileye 8 Connect [21]. This device provides Forward Collision Warning (FCW), Urban Forward Collision Warning (UFCW), Lane Departure Warning (LDW), Headway Monitoring and Warning (HMW), Speed Limit Indicator (SLI) and Pedestrian and Cyclist Collision Warning (PCW). FCW is based on Time-to-Collision (TTC) calculations: an alert is generated when TTC falls below 2.4 s, 2.7 s or 3 s depending on the setting; the system is operational in the speed range 30–180 km/h. UFCW is similar to FCW, working at low speeds in the range 0–30 km/h. LDW is active above 65 km/h; using a front camera, the system is capable to detect the road lanes: an alert is issued when the vehicle moves over the lane without the use of direction indicators. HMW provides continuous monitoring of the distance in seconds from the vehicle ahead, issuing a warning when such distance is below 0.7 s. SLI (Speed Limit Indicator) monitors road speed limit signs via the front camera: an alert is issued when the speed of the vehicle is above the posted speed limit. PCW is operational below 50 km/h and provides an alert when the TTC with a pedestrian (or cyclist) reaches 2.5 s.
2.3.2. Instrumentation and Data Recording
In the field test session, data from the vehicle (e.g., acceleration, speed) during the entire driving session were recorded using a datalogger (Race Technology DL1club), which records data from internal sensors and GNSS position. Thanks to the online service platform provided by the retrofit ADAS employed (Mobileye Connect Platform), the recording of the path followed by the vehicle based on GNSS location linked to the warnings produced by the system were available for the analysis. Two GoProHero4 cameras were installed in the vehicle to monitor forward traffic conditions and driver’s reactions to the warnings. Figure 2 shows the instrumentation installed in the vehicle cabin. Subjective data about participants’ experience before and after testing the van equipped with ADAS were collected using questionnaires designed for this study.
2.3.3. Questionnaires
Participants were asked to fill out two questionnaires: before and after the driving test (pre and post-test evaluation). The questionnaires were intended to assess driving experience, driving style and behavior, risk perception, and attitudes toward driver assistance systems.
The Pre-test driving questionnaire contained the following measures: basic demographic information and driving records, including an estimation of how many kilometers they usually drive weekly (28 items). Five items measured driving style and behaviors (concentration, planning, etc.; i.e., “If I am tired, I prefer to quickly reach the destination”). Responses were on a 5-pass scale, ranging from “strongly agree” (1) to “strongly disagree” (5). Two items measuring Crash risk perception were included. On a ten point response scale, ranging from ‘‘very low” (1) to ‘‘very high” (10), respondents were asked to evaluate their likelihood of being involved in a car crash compared to their fellows (i.e., ‘‘If you drive a car, how would you assess your risk of having a road crash as against the persons of your age?”) and to indicate their level of concern about this possibility (i.e., ‘‘How much are you worried about this possibility?”). Fifteen items measured attitudes toward the use of driver assistance systems (nine passive and six active systems), particularly perceived usefulness: respondents indicated their answers on a 7-step scale: useful (1) to useless (7)
The Post-test driving questionnaire contained the following measures: Five items measured the perception of driving fatigue with the use of assistance systems (i.e., “Thinking back to city driving, how do you think the system made the driving task?”). Respondents indicated their response on a 5-step scale, from very fatiguing (1) to very light (5). Eight items measured perceptions of usefulness of driving support systems (i.e., “How do you rate distance keeping warnings?”). The response scale was 5-step, from very useful (1) to very useless (5). Eight items measured the perceived annoyance of the warnings (i.e., “How do you rate safety distance keeping warnings?”). The response scale was 5-step, from very annoying (1) to very comfortable (5). Three items measured the effects of warnings on attention while driving (i.e., “By the presence of the system my attention...”). Responses on a 5-step scale, ranging from Decrease significantly (1) to Increase significantly (5). Four items measured behavioral reactions to warnings (i.e., “In the presence of a lane departure warnings you saw fit”). In this case, respondents had several answer options.
2.3.4. Test Procedure
The participants were recruited among University of Florence staff members having a minimum of two years of driving experience and aged between 20 and 65. All participants provided their informed written consent for inclusion before participating. The study was conducted with the written approval of the University of Florence Research Ethics Committee (Decision N. 215, 13 May 2022). See the following Table 4 and Section 3.1.1 for further details of participants included in the study.

Table 4.
Participant included in the study.
The field test procedure was developed based on previous studies available in the literature dealing with ADAS field testing [26,27]. The test protocol was structured in four different phases: in the first phase participants were informed in detail about the test procedure, and they were asked to fill in a questionnaire on driving behavior, driving habits, and opinions about ADAS. The second phase consisted of a short introduction to vehicle controls, ADAS functionalities available on the test vehicle including the alerts (sounds and images). In the third part, participants were asked to drive alone the vehicle following the satnav which guided them along a route within the city suburbs of Florence (see Figure 3). The test track consisted of two parts: a section in a motorway (about 27 km) and a section in urban areas (18 km). The itinerary was selected in order to include two parts with different driving scenarios (motorway and urban areas) to test the ADAS in both conditions. Also, using the same starting point for all participants, it was selected a route allowing to present the two scenarios counterbalanced among participants: half participants encountered before the motorway section and the others encountered before the urban one. In this phase, all the recording devices were turned on for the whole duration of the test. At the end of the driving session, in the fourth phase participants were asked their opinion on their interaction with the ADAS during the test, through a final questionnaire and a brief interview.
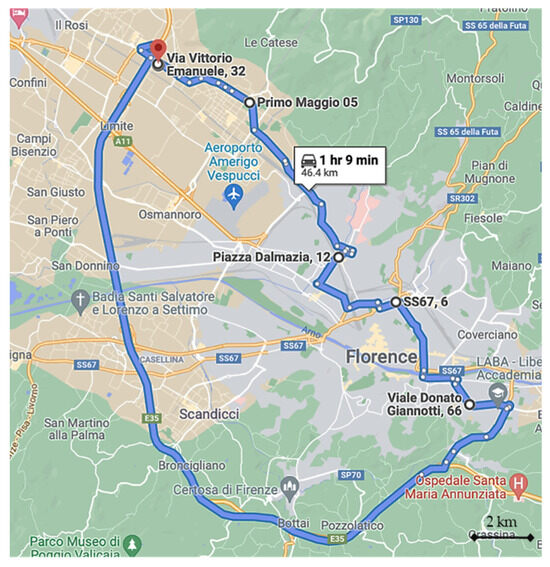
Figure 3.
Test route around the metropolitan area of Florence (source: Google Maps).
3. Results
3.1. Systematic Review
Thirty-two papers were identified through the systematic search and the selection process. The vast majority of the papers were published over the past decade, which corresponds to the higher growth of ADAS technology. Twenty-two studies were conducted in the US, six in Europe, two in Australia, and one in Taiwan and Malesia. Regarding the typology of the study, a balance between observational and experimental studies was found. The observational studies were typically based upon the statistical analyses conducted on a large amount of data, with the aim of identifying intervention scenarios for a given ADAS technology and estimating the potential decrease in the number of collisions due to its penetration in the overall fleet. Experimental studies aimed to assess the performance and the driver acceptance of a specific ADAS technology; methodologies included both in-the-field and driving simulator testing, typically involving professional drivers. Simulation studies were employed to model the road environment and the ADAS operational strategies to assess their benefits.
Based on the literature review, the ADAS technologies were classified into seven categories: “Stability control system”; “Longitudinal dynamics control system”, “Lateral dynamic control system”; “Warning system”; “Driver status monitoring system”; “Vehicle-to-vehicle (V2V) communication”, and “Vehicle-to-X (V2X) communication” (see Figure 4). Based on the specific research question concerning ADAS, the studies were grouped into four categories (Crash reduction; Performance; Cost–Benefit analysis, and Acceptance—see Table 5).
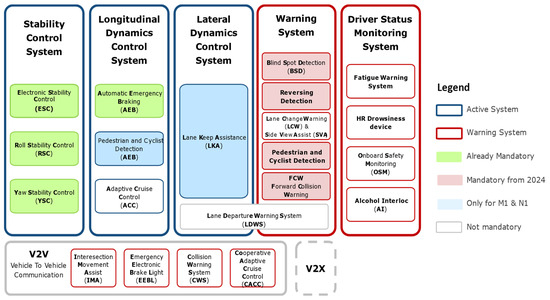
Figure 4.
ADAS classification result of literature review.

Table 5.
Number of studies identified by the literature review divided in four groups.
3.1.1. Stability Control System
Electronic Stability Control (ESC) resulted to be capable of mitigating up to 11% of fatal crashes involving trucks and up to 19% of crashes with severe or moderate injuries [9,28]. ESC was indicated to reduce the experience gap between drivers dealing with dangerous scenarios. It was found more effective in articulated trucks than in trucks and tractor-trailers [29]. However, the percentage rises to 41% when considering the system’s effectiveness in reducing vehicle loss of control, regardless of vehicle type [30]. The Benefit/Cost (B/C) rate is about 1.5 [31].
3.1.2. Longitudinal Dynamics Control System
A high-performance AEB (an AEB capable of avoiding crashes with both stationary and moving vehicles) could prevent up to 18% of fatal rear-end crashes and offer a B/C rate ranging between 1.0 and 6.1 [32]. Cyclist and Pedestrian AEB combined with high-performance AEB showed to be effective in approximately 78% of crashes in which intervenes [33], while the B/C rate is about 0.2 [32]. Recent research by Tan et al. [34] has confirmed that the effectiveness of AEB in mitigating rear-end collisions varies widely, ranging from 18% to 72%, depending on the research methodologies used. AEB has been shown to reduce rear-end crash rates by 44% for large trucks on limited-access highways and decrease the impact speed by over 50% [35]. Additionally, AEB can reduce rear-end crashes by 24% to 29% (with an average reduction of 26.7%) and intersection crashes by 22% to 29% (with an average reduction of 26.0%), regardless of vehicle type [36].
Adaptive Cruise Control (ACC) could prevent approximately 20% of fatal collisions involving trucks, while if it is used with a Collision Warning System, together, they could prevent up to 28% of rear-end crashes [37]. However, Tan et al. [34] reported lower effectiveness rates for ACC alone, showing reductions of 12% and 14% based on field operational tests and statistical analyses, respectively. The effectiveness increases to 16% when ACC is used in conjunction with Forward Collision Warning (FCW). Bai et al. [30] demonstrated that increasing the market penetration rates of ACC-equipped vehicles significantly reduces the probability of conflicts between leading trucks and trailing cars, with a notable reduction observed from a 75% penetration rate onwards.
3.1.3. Lateral Dynamics Control System
The Lane Departure Warning (LDW) has the potential to prevent up to 26% of road crashes due to unintentional lane changes [38], leading to a decrease in lane departure and an increase in the use of indicators. These findings are supported by recent studies, which reported a broader effectiveness range of 10% to 48% [34] and identified an average reduction of 25% regardless of vehicle type [8]. The B/C rate ranges between 1.3 and 7.5 [31,32].
The Lane Keep Assist (LKA) system combined with an LDW could prevent up to 51% of road crashes involving unintentional lane changes [38]. Moreover, Haptic-LKA systems were found effective in lane keeping and in avoiding driver distraction [39].
3.1.4. Collision Warning System
Collision Warning Systems (CWS) could prevent up to 11% of crashes relevant to this technology [39]. Trucks with CWS showed a lower percentage of crashes involving other vehicles (42% versus 53%) and a lower percentage of multi-vehicle crashes than trucks without CWS (62% versus 71%) [40]. Additionally, a CWS increases the driver’s awareness, while driver acceptance seems linked to the number of invalid warnings (false positives) [41].
Lane Change Warning (LCW) could prevent up to 10% of all road crashes and up to 2% of fatalities [28]. The B/C rate is about 0.7 [31].
Forward Collision Warning system (FCW) could prevent up to 21% of rear-end crashes [42,43]. FCW helps drivers maintain a greater safety distance and improve their response times [37], particularly in instances of driver distraction, improving response times by 40% [44]. More recently, Teoh [36] confirmed the effectiveness of FCW, reporting a statistically significant 22% reduction in the crash rate per vehicle mile traveled for large trucks on highways. Similarly, other studies found that FCW contributes to a 21% reduction in rear-end collisions involving trucks [8] and estimated that FCW can reduce rear-end crashes by up to 23%, regardless of vehicle type [34].
The Blind Spot Detection (BSD) system could prevent between 27% and 43% of road crashes involving pedestrians [45]. A BSD may prevent up to 24% pedestrian crashes and 10 and 11 per cent of crashes involving cyclists and motorcyclists, respectively [46].
3.1.5. Driver Status Monitoring
The Fatigue Warning System (FWS) could prevent up to four per cent of fatal road Australian crashes involving trucks [47]. The B/C rate is about 2.9 [31].
The Alcohol Interlock (AI) systems could prevent up to 2.5% of fatal road crashes involving trucks, with a B/C rate of about 2.5 [31].
The Onboard Safety Monitoring (OSM) systems could affect driving performance preventing dangerous behaviour. The B/C rate of these systems ranges between 1.2 and 10.7 [48].
3.1.6. Vehicle-to-Vehicle Communication (V2V)
V2V communication systems can be effective in detecting vulnerable road users (e.g., cyclists and motorcyclists). The effectiveness of a Left Turn Assist (LTA) system at urban intersections is about 40% [33]. On the other hand, a system made of Intersection Management Assist (IMA), LCW, and FCW could prevent between 45% and 49% of US crashes involving trucks. Of these, 24% might be ascribable to the IMA system, 15% to an FCW system, and up to 10% to the LCW system [49].
About Cooperative Adaptive Cruise Control (CACC) systems, truck drivers stressed preferences in using CACC systems on the highway and having full vehicle control in heavy traffic conditions or near highway junctions [50].
From the acceptability standpoint, professional truck drivers may be strongly inclined to use V2V communication systems that can detect and signal impending crash events. Nonetheless, truck drivers may rely entirely on crash warning systems, lowering their alert levels [51].
3.2. Cost–Benefit Analysis
3.2.1. ADAS Applicability
The first result of the analysis is the assessment of crashes in which each ADAS technology could intervene. In 2019, in Italy, 17,317 crashes occurred involving at least one truck, causing 24,603 injured people and 571 fatalities [52]. Table 6 shows the number of crashes in which each ADAS functionality is potentially effective based on the crash configuration.

Table 6.
Crashes in which each ADAS functionality could intervene in Italy (2019): all crashes, crashes resulting in injuries and fatalities. For each crash, more than one ADAS functionality can be applicable.
3.2.2. ADAS Benefits
The benefits in terms of reduced crashes, injuries, and victims, and, therefore, the Cost–Benefit ratio, were estimated considering the number of relevant crashes and the effectiveness of each ADAS functionality based on the literature. According to the literature, the FCW has the potential to reduce 22% of fatal crashes and 20% of crashes with injuries in crash scenarios where it can be applicable. The LDW was indicated to be capable of reducing 11.2% of fatal crashes and 20% of injuries, while FWS has the potential to reduce 4.2% the fatal crashes and 4% of injury crashes. PCW was assessed in the literature to provide a reduction of 0.5% of fatal crashes and 0.1% of injury crashes. BSD has been assessed capable to reduce 7.9% of road crashes. A summary of ADAS effectiveness considered for this study is displayed in Table 7. The reduction rates in Table 7 were derived from previously published studies that analyzed the effectiveness of ADAS in preventing or mitigating crashes. These studies utilized different methods including simulations, observational studies and crash data analysis to estimate the reduction in crashes and fatalities associated with trucks equipped with the different ADAS functionalities.

Table 7.
Effectiveness of different ADAS functionalities considered in this study.
Table 8 reports, for each ADAS functionality, the potential benefits in terms of reduced crashes, fatally injured and injured people every year in Italy (using 2019 as a reference) considering retrofitting the Italian fleet of trucks. These estimations have been obtained as an average value of the different estimations made in the studies found in the systematic review of the literature (see previous section [28,32,45]).

Table 8.
Number of crashes potentially prevented by each ADAS functionality every year in Italy.
3.2.3. Cost–Benefit
With reference to 2019, the trucks considered for FCW and LDW retrofitting were 4,193,257, being FCW and LDW mandatory for new N2 and N3 vehicles since 2014 [10], while 4,278,216 vehicles were considered for calculating costs of retrofitting BSD, FWS and PCW in Italy.
Table 9 reports, for each ADAS functionality, a range of costs for retrofitting, Break-Even costs and Cost–Benefit ratios. The most cost-effective ADAS technology was the FCW, which with a cost of retrofitting ranging between €250 and €900 resulted in a high Cost–Benefit ratio (between 1.12 and 2.88) and break-even cost (€1228). The other ADAS functionalities achieved lower break-even costs, with Cost–Benefit ratios lower than 1. For the BSD technology was not possible to obtain a suitable cost estimation. Only the break-even cost has been estimated, resulting in €457 per vehicle.

Table 9.
Break-even cost and Cost–benefit Ratios calculated for the five ADAS functionality considered in this study. Data related to Italian crash statistics in 2019.
3.3. Pilot Testing
3.3.1. Test Participants
Nine participants were involved in field-testing retrofitted ADAS, eight were male and one female. Potential participants were selected considering age, level of education, driving experience (both with trucks and other vehicles), type of vehicle most frequently used and opinion regarding safety systems and ADASs. The average age of the participants was 45 years (SD 16 years) and they used to drive a car for daily commuting. Five participants reported driving light commercial vehicles similar to the test vehicle for short routes on average once a month, while the remaining four drivers were professional drivers who usually (more than once a week) drive trucks similar to the test vehicle. Three participants reported holding a C-category driving licence, which allows driving all types of trucks. None of the participants reported being used to drive vehicles equipped with ADAS systems like the one used in this test.
3.3.2. ADAS Intervention and Driver Behaviour
Overall, the tests lasted a total of about 10 h, three of which were on motorways and seven on urban roads. A total of approximately 500 km were driven: 160 km on urban roads and 340 km on motorways. A total of 281 warnings were recorded, classified according to the area in which they were detected (urban or motorway) and divided by type (see Table 10).

Table 10.
ADAS warnings collected in the field-test, divided by driving scenario.
Based on the recorded time at which each warning was issued and the geographical location, data from the ADAS was synchronized with videos and measures of vehicle dynamics. Combining this information, it was possible to analyze the traffic conditions in which each warning was produced, the driver’s behavior in the moments before and after the warning and the effects on the dynamics given by the driver’s reaction. Results for each type of warning are presented below, while subjective results are presented in the following section.
Forward Collision Warning
Five forward collision warnings were recorded: after detailed analysis through videos, three turned out to be potentially dangerous situations, in which the driver was getting close to the vehicle in front. Vehicle dynamics indicated that following the warning, after an average reaction time of 1.5 s, drivers braked with average decelerations of 0.25 g. In Figure 5 the actions of the driver in response to the frontal collision warning is represented in terms of speed reduction and deceleration. The limited number of events in the whole test campaign is linked to a low number of false positive interventions. The FCW intervention was detected trough data and cameras installed in the vehicle monitoring the warning screen. Once the FCW alert was issued (and recognized in recorded data and videos), the driver reacted with braking action (which produced the deceleration and speed reduction represented in the figure, after about 1,5 s from the alert required as reaction time). This behavior was consistently recognised in all the FCW events recorded.
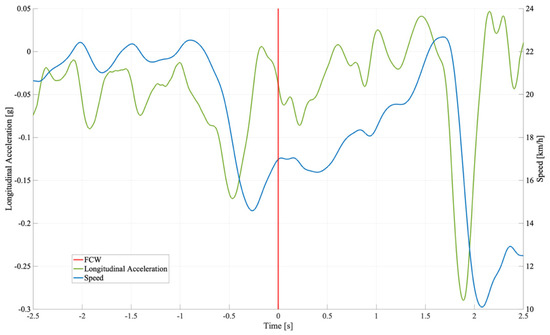
Figure 5.
Example of FCW intervention and effects on the longitudinal dynamics of the vehicle.
Urban Forward Collision Warning
The UFCW warning was mainly triggered in traffic jam conditions, in which the driver went too close to the vehicle in front. One hundred and forty-four activations were recorded among the nine participants. The analysis of the vehicle dynamics and driver behavior revealed that these warnings were never really taken into account by drivers, as indicated in the questionnaires where it was mostly considered unnecessary, too conservative and annoying.
Headway Monitoring and Warning
The headway distance warnings were recorded when the distance from the preceding vehicle was lower than 0.7 s but the warning to the driver was issued only when this condition was maintained for at least 0.5 s. Most of the 70 warnings recorded were because of a lane change or the return of a vehicle from overtaking. In these conditions the system produced no acoustic warning, and no driver reaction was detected. There were 16 events in which drivers received an acoustic warning. Following these warnings, in 13 cases, the driver reacted by slowing down and increasing the distance from the vehicle in front. Figure 6 shows the vehicles before and after HMW intervention: the driver was accelerating (positive 0.05 g longitudinal acceleration) while approaching the vehicle in front received the warning (red vertical line): this produced a reduction in the acceleration for about 0.8 s after the warning allowing to re-establishing proper distance from the vehicle in front.
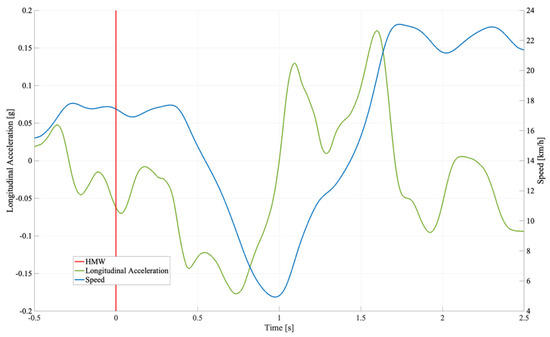
Figure 6.
Example of HMW intervention and effects on the longitudinal dynamics of the vehicle.
Lane Departure Warning
LDWs were mainly (78%) issued on highways in similar driving conditions: the driver moves laterally the vehicle until it approaches one of the two lines, triggering the warning. In these situations, after an average reaction time of 1.0 s, a corrective action on the steering was noted, resulting in lateral acceleration to correct the trajectory. In Figure 7, one example of vehicle behavior after LDW is represented: while the driver was proceeding straight at constant speed (lateral acceleration near to 0.0 g), the vehicle moved close to the line marking lane. The ADAS issued a warning and after about half a second, the driver performed a corrective manoeuvre by bending to the left (positive lateral acceleration) to bring the vehicle back to the central position with respect to the lane it was occupying. At the end of the manoeuvre the vehicle continued with its straight trajectory.
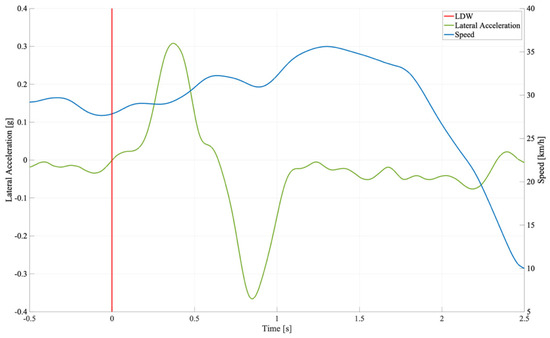
Figure 7.
Example of LDW intervention and effects on the lateral dynamics of the vehicle.
3.3.3. ADAS Acceptability and Subjective Assessment
In this research, we tried to verify the perception of usefulness, fatigue, and annoyance in the use of ADAS. Furthermore, correlations between driving styles and perceived usefulness of ADAS were calculated. This further investigation, of a qualitative and preliminary nature, employed a sample of 9 subjects, a decision driven by the aim to explore an under-researched phenomenon in an initial manner (see Table 11). The small sample size also reflects the difficulties encountered in recruiting eligible participants, which limited the ability to expand the sample. In qualitative contexts, small samples are frequently used to gain specific insights rather than to produce statistical generalizations. While a larger sample size could increase the robustness of the estimates, the exploratory design of this study allows for the identification of emerging trends and the formulation of hypotheses to be tested in subsequent re-search. Therefore, while the results should be interpreted with caution, considering the limitations related to generalizability, the findings contribute significantly to the preliminary understanding of the phenomenon under investigation.

Table 11.
Demographic and Driving Habit Data of Participants.
All nine participants agreed to fill in questionnaires before and after the driving test. The graphs below show the average scores for Effort, Fatigue, and Usefulness perceived, using ADAS during the driving test. The mean scores show low fatigue and annoyance while driving and a high perception of usefulness (see Figure 8 and Figure 9).
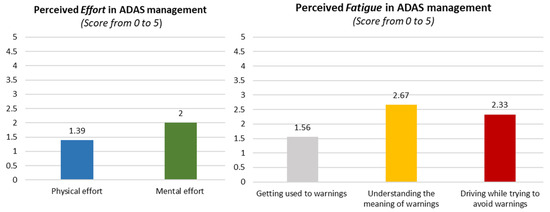
Figure 8.
Mean score among the nine participants of perceived Effort (left) and Fatigue (right) in ADAS management.
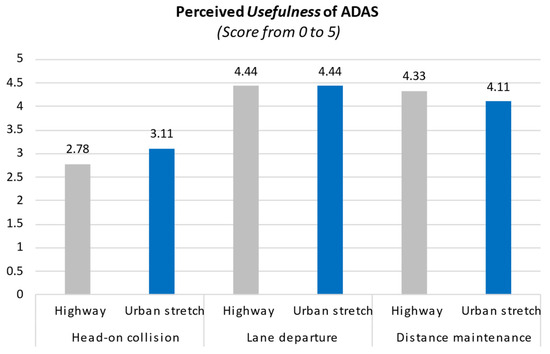
Figure 9.
Mean score among the nine participants of perceived usefulness of ADAS functionalities in highway and urban scenario.
A correlation analysis was conducted between habitual driving behavior and the perceived usefulness of Advanced Driver Assistance Systems (ADAS). The results indicated the following significant correlations (see Table 12): (i) Safe Driving Style was positively correlated with Usefulness in the city (r = 0.791, p = 0.011), General Usefulness for road safety (r = 0.690, p = 0.040); (ii) Negative attitude towards traffic regulations was Negatively correlated with General Usefulness for road safety (r = −0.658, p = 0.049); (iii) Attention when driving was negative correlated with Usefulness on the Highway (r = −0.781, p = 0.013); and General Usefulness for road safety (r = −0.791, p = 0.011); These last results are interesting: increasing the score of a style attentive to driving decreases the perception of utility on the highway and in general. People who usually have a high focus on driving probably feel less of the use of driver assistance. This information can be employed as starting hypothesis to be verified with a broader sample of participants in further studies.

Table 12.
Correlation between Driving Behavior and Usefulness (Participants: n = 9; Age M = 39.9; SD = 15.1).
4. Discussion
Being the first goal of the study the identification of scientific evidence about the benefits of Advanced Driver Assistant Systems (ADAS) in improving the road safety of goods transport, the main goal of the systematic review was the investigation of their crash reduction, performance, driver acceptance, and the cost–benefit ratio. The systematic review process has enabled the analysis of 32 scientific studies conducted over the past two decades.
Electronic Stability Control (ESC) remains a fundamental assistance system, limiting the phenomenon of loss of control and rollover of vehicles. Along with Automatic Emergency Braking (AEB), the ESC shows the highest potential for reducing road crashes involving heavy vehicles. ESC could prevent up to 19% of truck crashes [28] with a significantly greater potential for crash reduction in articulated trucks than in lorries or truck-trailers [45]. The Cost–Benefit analysis shows a positive rate (B/C = 1.5, [31]).
AEB and Adaptive Cruise Control (ACC) are the most effective in controlling longitudinal dynamics. A high-performance AEB could prevent up to 18% of fatal rear-end crashes with a beneficial advantage in terms of cost/benefit (B/C = 1.0 ÷ 6.1, [33]). While ACC may prevent around 20% of fatal collisions involving trucks [37], as well as when in use in combination with a Collision Warning System (CWS) they could prevent up to 28% of rear-end crashes [37]. With regard to warnings, the Forward Collision Warning (FCW) could prevent up to 21% of rear-end crashes on its own [42,43], helping drivers maintain a greater safety distance and improve their response time [37]. Lane Keeping Assist (LKA) and Lane Departure Warning (LDW) could prevent up to 25% and up to 26% of road crashes in which the truck driver made unintentional lane changes, showing similar effectiveness. This advantage could even be summed up for the combined use (56%, [38]).
In general, Collision Warning Systems (CWS), such as FCW, LDW, LCW and BSD, increase the driver’s awareness of early detection of hazards, thus reducing driver response times by up to 40% and increasing the likelihood of effective evasive manoeuvres [41]. However, driver acceptance is linked to the number of false-positive warnings sent [41,44]. On the other hand, driver status monitoring systems such as the Fatigue Warning System (FWS) and the Alcohol Interlock (AI) showed a positive cost/benefit rate (2.9 and 2.5, respectively [31]), which could increase up to 10.7 given the Onboard Safety Monitoring (OSM) systems able to prevent dangerous driver behavior. Vehicle-to-Vehicle (V2V) communication systems are also a solution that could positively impact road safety in the long term, particularly in detecting other vehicles and preventing crashes [35].
The systematic review highlighted that the maximum effectiveness in reducing truck-related crashes comes from the combined use of warning systems and systems active on the vehicle dynamics. The vast majority of such systems will be mandatory in Europe on new vehicles from 2024 [10], but to achieve a significant reduction in crashes in the next decade, retrofitting such technologies on current truck fleets is required. ADAS functionalities suitable for retrofitting have the potential to substantially reduce the number of road crashes, deaths, and injuries in crashes involving trucks. Recent studies [8,34,36] analyzing data from the past few years of ADAS technology application have substantially confirmed the effectiveness of ADAS in preventing crashes, validating the findings of previous research.
In addition to the priceless advantage for life and health of people, the adoption of retrofit ADAS technologies can also bring economic benefits. The Forward Collision Warning (FCW) and the Lane Departure Warning (LDW), with a Break-Even cost of €1200 and €500, respectively, resulted as the most promising technologies in the Italian context. The Cost–Benefit ratio estimated for the FCW reaches 2.88, indicating high cost-effectiveness. The LDW has cost–benefit ratios lower than one, mainly due to high estimated purchase costs (€500–1500). However, the market analysis highlighted that most of the ADAS retrofit systems available in the market (which cost on average of €800) include both FCW and LDW technologies, while in this analysis each ADAS functionality was assessed separately.
FWS and PCW were found not cost-effective with a very low break-even cost. This was due to the low number of road crashes where those functionalities have been considered effective. From this study appears that every ADAS function, if considered alone (with exception of the FCW) has cost–benefit ratios lower than one due to high purchase cost. However, FCW, LDW and PCW are generally all based on a camera placed on the windscreen of the vehicle and therefore installing a single camera can provide the three functionalities and related benefits with approximately the same cost of one, resulting in a very high break-even cost and low cost–benefit ratio. A limitation of the cost–benefit analysis is related to the missing detailed information about the crash dynamics contained in the ISTAT database: this could lead to an inaccurate assessment of the size of each cluster where the ADAS functionalities could be effective to avoid the crash or mitigate the consequences. Our cost–benefit analysis, projecting the potential to save over 250 lives and €350 million in societal costs annually over the next decade, was based on data from national crash databases and relevant literature. We considered 4,278,216 vehicles for the retrofitting of BSD, FWS, and PCW systems in Italy. The analysis utilized a robust tool developed by a European project, ensuring reliable and validated results.
The final step of this study consisted in a pilot test campaign using one of the most advanced, commercially available retrofit ADAS systems. Nine participants (four were professional drivers) drove a truck equipped with this system on a route designed to reproduce urban and highway driving. Since this was a pilot test, we used a convenience sampling approach to select the participants. Within the limitations of our potential participant pool, we aimed to include a wide range of variability in terms of age, gender, and driving experience. Future studies should focus on identifying a well-stratified sample of participants based on age, gender, experience with truck driving, and use of ADAS technologies. This sample should be large enough to enable robust statistical analyses. The pilot field testing was conducted with nine drivers to facilitate an initial, exploratory investigation. This sample size allows for manageable, qualitative analysis and identification of trends. For future research, we recommend expanding the sample size to enhance statistical power and robustness. Additionally, conducting multi-phase testing with iterative refinements will provide more generalizable conclusions. Overall, more than 280 warnings were issued by the system, although about half of them turned out to be false alarms. In urban areas, the low-speed frontal collision warning (UFCW) resulted conservative and annoying for drivers, being ignored most of the time by drivers. The other warnings, particularly those given by the LDW and HMW were considered particularly useful by drivers who reacted to the warning with corrective measures. The frontal collision warning (FCW) in extra-urban conditions occurred five times, highlighting potentially dangerous situations. Drivers provided corrective manoeuvres in response to the warnings (particularly to FCW and LDW) and expressed a general good acceptance of the system. Even if the sample of participants cannot be considered sufficient to draw robust conclusions and cannot fully represent the category of potential users of this device, the pilot testing allowed to develop a test protocol to be extended to a larger sample of participants and a wider range of test vehicles. However, it is important to note some limitations. Firstly, due to the limited duration of the test, it was not possible to evaluate the long-term effects of ADAS on drivers’ driving style or their potential behavioral adaptations. Secondly, the small sample size of participants hindered obtaining statistically significant results regarding the frequency of warnings and users’ opinions about the system using questionnaire data. The questionnaire results suggests that a higher perception of usefulness correlates with safer driving behavior. Therefore, subjects tend to perceive greater usefulness of ADAS when their behavior is more risk-averse. Interestingly, perceived usefulness on the motorway has no significant correlation with driving styles. Therefore, the perception of usefulness changes depending on the road context. In general, the results obtained seem to comfort us with a good level of acceptance of this important driving support technology. However, these results have a strong limitation due to the small sample size of participants and duration of data acquisition, which did not allow us to build a structural equation model because it would not have yielded robust results.
The findings of this study, along with the test procedure and questionnaire, serve as a solid foundation for further testing involving similar retrofit ADAS technologies on a larger and more diverse group of drivers. In the future, a naturalistic study in which a sample of drivers is monitored over a long period of time and distances is recommended to further investigate the efficacy of ADAS in improving drivers’ behavior. Also, a wider sample of participants would allow predictive analyses based on the driving behavior and declared driving style employing the questionnaire devised for this study. The findings of this study suggest also conducting cost–benefit analyses for the retrofitting of ADAS in countries other than Italy, particularly where the fleet renewal cycle is longer and consequently the implementation time for ADAS is expected to be extended. This may highlight even higher benefits of retrofitting ADAS on trucks and could provide a positive push to safer vehicles.
5. Conclusions
This study provides a comprehensive investigation into the effectiveness, feasibility, and economic viability of retrofitting Advanced Driver Assistance Systems (ADAS) on trucks operating across Europe. Through a systematic review of existing literature, the study identified and classified various ADAS technologies, offering a thorough assessment of their potential in preventing road crashes, mitigating injuries, and reducing fatalities involving trucks. The findings revealed that Electronic Stability Control (ESC), Automatic Emergency Braking (AEB), Adaptive Cruise Control (ACC), and Collision Warning Systems (CWS) are among the most effective technologies in enhancing vehicle safety, with substantial potential for reducing accidents.
The cost–benefit analysis, using Italy as a case study, demonstrated that retrofitting these systems on the current truck fleet could result in a remarkable reduction in road fatalities, saving over 250 lives annually and preventing societal costs of up to €350 million per year over the next decade. This cost-effectiveness underscores the value of ADAS technologies in improving road safety and highlights the importance of incorporating these systems into the existing vehicle fleet, particularly in light of their potential for large-scale impact.
A field test conducted as part of this research offered promising insights into driver acceptance and the effectiveness of retrofitted ADAS technologies. Despite the limitations of a small sample size and short test duration, the results suggested that drivers showed a positive response to the systems, particularly in terms of safety improvements and driving behavior. The study’s test protocol also provides a strong foundation for future field tests with larger and more diverse samples.
In conclusion, this study emphasizes the importance of retrofitting ADAS technologies to significantly enhance the safety of commercial trucks. The positive outcomes from the systematic review, cost–benefit analysis, and pilot test offer clear evidence of the potential for reducing crashes and improving driver behavior. Future research should focus on expanding the sample size in field tests, conducting long-term studies on driver adaptation, and assessing the global applicability of retrofitting ADAS, particularly in regions with older vehicle fleets. Moreover, the findings suggest that the widespread adoption of these technologies could drive significant improvements in road safety, ultimately benefiting all road users.
Author Contributions
Conceptualization, M.P. (Matteo Pizzicori), S.P., C.L., and G.S.; methodology, M.P. (Matteo Pizzicori), S.P., C.L., P.C., and G.S.; software, M.P. (Matteo Pizzicori), and C.L.; validation, M.P. (Matteo Pizzicori) and C.L.; formal analysis, M.P. (Matteo Pizzicori), C.L., and P.C.; investigation, M.P. (Matteo Pizzicori), S.P., and C.L.; resources, S.P. and G.S.; data curation, M.P. (Matteo Pizzicori); writing—original draft preparation, M.P. (Matteo Pizzicori), S.P., C.L., and P.C.; writing—review and editing, C.L., P.C., and G.S.; visualization, M.P. (Matteo Pizzicori); supervision, G.S.; project administration, G.S., and M.P. (Marco Pierini) funding acquisition, G.S. and M.P. (Marco Pierini). All authors have read and agreed to the published version of the manuscript.
Funding
This study has been carried out thanks to the contribution of the Associazione Lorenzo Guarnieri Onlus, which is a no-profit organization working to improve road safety in memory of Lorenzo.
Institutional Review Board Statement
The study was conducted in accordance with the Declaration of Helsinki, and the protocol was approved by the Ethics Committee of the University of Florence (Decision N. 215, 13 May 2022).
Informed Consent Statement
Written informed consent was obtained from all subjects involved in the study.
Data Availability Statement
The authors confirm that the data supporting the findings of this study are available within the article.
Acknowledgments
The authors would like to acknowledge the Lunghi family, Stefano and Stefania Guarnieri for inspiration and support to perform this research. The authors also acknowledge Eng. Vincenzo Cultrera for his involvement in the first part of the study and Autobynet SRL for their contribution, and, in particular, Alessandro Finicelli, by providing the ADAS device.
Conflicts of Interest
The authors declare no conflicts of interest.
Appendix A. Literature Search Strategy
In each database, the search strings combined one word referring to truck (“truck”, “heavy vehicle”; “articulated vehicle”; “trailer”; “wagon”; “lorry coach”; “tractor”) with any word of a set referring to either ADAS and V2V technologies and driver acceptance (“driver assistance”, ADAS, “safety system”, “advanced safety”, “active safety”, “safety impact”, AST, “cruise control”, “adaptive speed control”, “ASC”, “intelligent speed adaptation”, “accident prevention systems”, “intelligent transportation systems”, “ITS”, “ABS”, “AEB”, “ emergency braking”, “autonomous braking”, “side view assist”, “lane keeping”, “lane change”, LKS, LCS, “lane assistance”, “steering assistance”, “active steering”, “collision avoidance”, “warning collision system”, “WCS”, “collision Warning”, “collision detection”, “obstacle detection”, “E-Call”, “curve warning”, “crash detection”, “crash alerts”, “crash risk”, “crash avoidance”, “crash warning”, “fall detection”, “collision mitigation”, “collision avoidance”, “driver distraction”, “naturalistic driving”, FCW, “forward Crash”, LDW, “lateral drift”, LCM, “blind spot”, “blind spot warning”, “blind spot assistance”, BSW, “emergency electronic brake light”, EEBL, “weigh in motion”, WIM, “automatic vehicle identification”, AVI, “automatic vehicle classification”, AVC, “video onboard monitoring”, OSM, “onboard safety monitoring”, “vulnerable road users”, “adjacent vehicle”, “lane margin path”, LMP, “adjacent lane collision”, “ALCWS”, “driver-vehicle interface”, “driving conflicts”, “driver acceptance”, “safety pilot”, V2V, “intersection movement assist”, IMA, “electronic stability control”, “ESC”, “human machine interface”, “HMI”, “assisted driver”, ”road safety”). The complete search strategy is provided in Appendix A. Considering the continuous evolution of ADAS technologies, only studies published between 2000 and 2020 were taken into account.
Appendix B. Inclusion and Exclusion Criteria
| Inclusion Criteria | Exclusion Criteria | |
| Sampling | Truck Heavy Vehicle Tractor-trailer Semi-trailer Truck Road train Autobus | Car Vans SUVs Pickup Farm Tractor Railway Vehicle |
| ADAS System | Active safety system Warning Safety system Driver-vehicle interface V2V Truck Platooning | Passive Safety Infrastructure interventions Driver’s health, drugs-alcohol Overweight |
| Study type | Randomized controlled trials Cohort studies Case–control studies Cross-sectional surveys Case studies | Systematic reviews Opinions Discussions Letters |
| Target Condition | Effectiveness Impact on Safety B/C Analysis Acceptance | About engine Construction/design About emissions |
| Language | English, Italian | Non-English or Non-Italian |
| Time of publication | After 2000 | Before 2000 |
Appendix C. Crash Configuration Clusters
For each defined cluster the pictograms used to identify the crash configurations are reported.
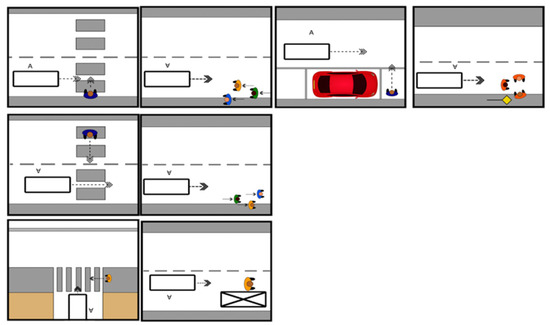
Figure A1.
Pictograms used to represent the cluster “Crash with pedestrian”.
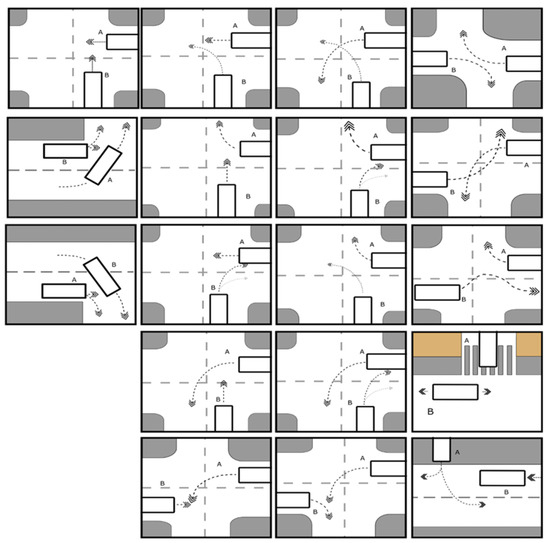
Figure A2.
Pictograms used to represent the cluster “Crash at road intersection”.

Figure A3.
Pictograms used to represent the cluster “Frontal crash”.
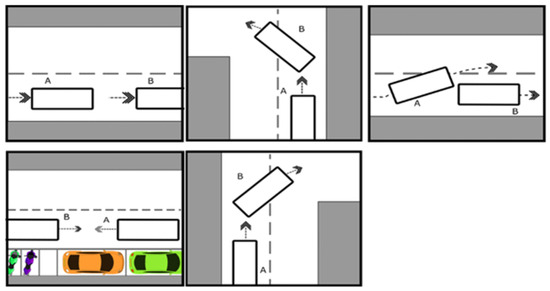
Figure A4.
Pictograms used to represent the cluster “Rear-end crash”.
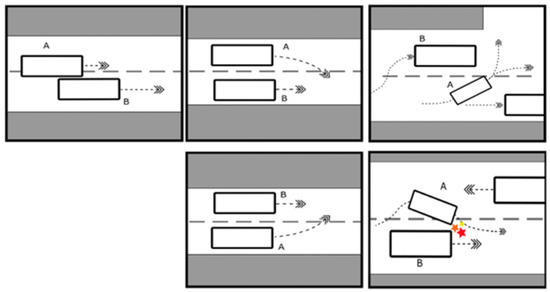
Figure A5.
Pictograms used to represent the cluster “Lateral/Lane-change crash”.
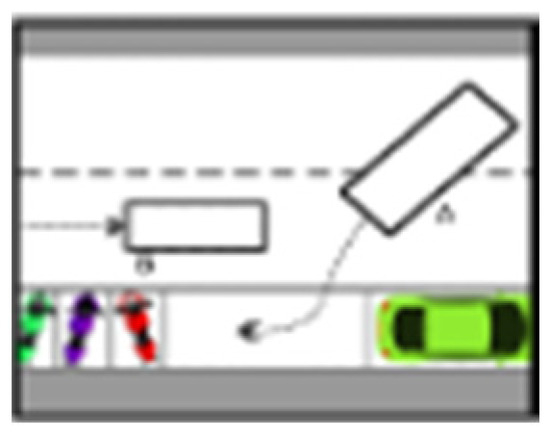
Figure A6.
Pictogram used to represent the cluster “Left turn to park”.

Figure A7.
Pictograms used to represent the cluster “Truck performing U-turn or leaving the park”.

Figure A8.
Pictograms used to represent the cluster “Opponent vehicle performing U-turn or leaving the park”.

Figure A9.
Pictograms used to represent the cluster “Crash with fixed objects”. Source: VicRoads. (2013). Crashstats user guide—Road Crash Statistics Victoria.

Figure A10.
Pictograms used to represent the cluster “Crash with fixed objects”. Source: VicRoads. (2013). Crashstats user guide—Road Crash Statistics Victoria.
References
- Eurostat. Road Freight Transport by Vehicle Characteristics; Eurostat: Luxembourg, 2021. [Google Scholar]
- UNECE. Consolidated Resolution on the Construction of Vehicles (R.E.3); UNECE: Geneva, Switzerland, 2017. [Google Scholar]
- ANFIA Studies and Statistics. Western Europe Annual Data/Commercial Vehicles (Reference Year 2019); ANFIA: Torino, Italy, 2021. [Google Scholar]
- EU Mobility and Transport. Collision Matrix: Road Traffic Fatalities in the EU in 2019 by Road User and (Other) ‘Main Vehicle’ Involved in the Crash; EU Mobility and Transport: Brussels, Belgium, 2021. [Google Scholar]
- Kuehn, M.; Hummel, T.; Bende, J. Advanced driver assistance systems for trucks–benefit estimation from real-life accidents. In Proceedings of the 22nd International Technical Conference on the Enhanced Safety of Vehicles, Washington, DC, USA, 13–16 June 2011. [Google Scholar]
- Otte, D.; Jänsch, M.; Haasper, C. Injury protection and accident causation parameters for vulnerable road users based on German In-Depth Accident Study GIDAS. Accid. Anal. Prev. 2012, 44, 149–153. [Google Scholar] [CrossRef]
- Gandhi, T.; Trivedi, M.M. Pedestrian Protection Systems: Issues, Survey, and Challenges. IEEE Trans. Intell. Transp. Syst. 2007, 8, 413–430. [Google Scholar] [CrossRef]
- Masello, L.; Castignani, G.; Sheehan, B.; Murphy, F.; McDonnell, K. On the road safety benefits of advanced driver assistance systems in different driving contexts. Transp. Res. Interdiscip. Perspect. 2022, 15, 100670. [Google Scholar] [CrossRef]
- European Commission. EU Road Safety Policy Framework 2021–2030—Next Steps Towards ‘Vision Zero’; European Commission: Brussels, Belgium, 2019. [Google Scholar]
- European Parliament. Regulation (EU) 2019/2144 on Type-Approval Requirements to Ensure the General Safety of Vehicles and the Protection of Vulnerable Road Users; European Parliament: Strasbourg, France, 2019. [Google Scholar]
- ACI—Automobile Club d’Italia. Parco Veicoli 2019.xslx—Sheet: Trucks by Geographical Area and Year of Registration. Autoritratto; ACI: Reggio nell’Emilia, Italy, 2019. [Google Scholar]
- Scholliers, J.; Tarkiainen, M.; Silla, A.; Modijefsky, M.; Janse, R.; van den Born, G. Study on the Feasibility, Costs and Benefits of Retrofitting Advanced Driver Assistance to Improve Road Safety; Final Report; European Commission: Brussels, Belgium, 2020. [Google Scholar]
- Higgins, J.P.; Green, S. Cochrane Handbook for Systematic Reviews of Interventions, 1st ed.; Cochrane, B., Ed.; JohnWiley & Sons Ltd.: Hoboken, NJ, USA, 2008. [Google Scholar]
- Lucci, C.; Piantini, S.; Savino, G.; Pierini, M. Motorcycle helmet selection and usage for improved safety: A systematic review on the protective effects of helmet type and fastening. Traffic Inj. Prev. 2021, 22, 301–306. [Google Scholar] [CrossRef] [PubMed]
- Fleiss, J.L. Measuring nominal scale agreement among many raters. Psychol. Bull. 1971, 76, 378–382. [Google Scholar] [CrossRef]
- Landis, J.; Koch, R.; Koch, G. The Measurement of Observer Agreement for Categorical Data. Biometrics 1977, 33, 159–174. [Google Scholar] [CrossRef]
- ACEA. ACEA Position Paper, Access to In-Vehicle Data; ACEA: Brussels, Belgium, 2021. [Google Scholar]
- ISTAT: Databases and Informational Systems. Available online: https://www.istat.it/en/analysis-and-products/databases (accessed on 24 October 2022).
- Wijnen, W.; Weijermars, W.; Vanden Berghe, W.; Schoeters, A.; Bauer, R.; Carnis, L.; Elvik, R.; Theofilatos, A.; Filtness, A.; Reed, S.; et al. Crash Cost Estimates for European Countries. Deliverable 3.2 of the H2020 Project SafetyCube. 2017. Available online: https://www.safetycube-project.eu/wp-content/uploads/SafetyCube-D3.2-Crash-costs-estimates-for-European-countries.pdf (accessed on 8 October 2024).
- Ministero delle Infrastrutture e dei Trasporti. Costi Sociali dell’Incidentalità Stradale; Ministero delle Infrastrutture e dei Trasporti: Rome, Italy, 2019. [Google Scholar]
- Martin, O.; Talbot, R.; Papadimitriou, E.; Krishnakumar, R.; Mettel, C.; Thomson, R. Economic Evaluation of Vehicle Related Measures. Deliverable 6.3 of the H2020 Project SafetyCube. 2017. Available online: https://www.safetycube-project.eu/wp-content/uploads/SafetyCube-D6.3-EconomicEvaluationOfVehicleRelatedMeasures.pdf (accessed on 8 October 2024).
- Mobileye 8 Connect. Available online: https://www.mobileye.com/uk/fleets/products/mobileye-8-connect/ (accessed on 24 October 2022).
- Plk Global. Available online: https://plktech.tradekorea.com/main.do (accessed on 15 July 2022).
- Movon Eu. Available online: http://movonhome.sloop.co.kr/front/adas (accessed on 15 July 2022).
- Garmin. Available online: https://www.garmin.com/it-IT/p/677370 (accessed on 15 July 2022).
- Bao, S.; LeBlanc, D.J.; Sayer, J.R.; Flannagan, C. Heavy-truck drivers’ following behavior with intervention of an integrated, in-vehicle crash warning system: A field evaluation. Hum. Factors 2012, 54, 687–697. [Google Scholar] [CrossRef] [PubMed]
- Xiaonan, Y.; Jung Hyup, K. Acceptance and Effectiveness of Collision Avoidance System in Public Transportation. In Proceedings of the 7th International Conference DUXU 2018, Las Vegas, NV, USA, 15–20 July 2018; Proceedings, Part III. Springer: Berlin/Heidelberg, Germany, 2018; pp. 424–434. [Google Scholar] [CrossRef]
- Jermakian, J.S. Crash avoidance potential of four large truck technologies. Accid. Anal. Prev. 2012, 49, 338–346. [Google Scholar] [CrossRef] [PubMed]
- Markkula, G.; Ola, B.; Krister, W.; Mattias, W. Effects of Experience and Electronic Stability Control on Low Friction Collision Avoidance in a Truck Driving Simulator. Accid. Anal. Prev. 2013, 50, 1266–1277. [Google Scholar] [CrossRef] [PubMed]
- Bai, J.; Lee, J.; Mao, S. Effects of Adaptive Cruise Control System on Traffic Flow and Safety Considering Various Combinations of Front Truck and Rear Passenger Car Situations. Transp. Res. Rec. 2024, 2678, 1009–1028. [Google Scholar] [CrossRef]
- Anderson, R.W.G.; Hutchinson, T.P.; Linke, B.; Ponte, G. Analysis of Crash Data to Estimate the Benefits of Emerging Vehicle Technology. CASR Report Series. 2011. Available online: https://casr.adelaide.edu.au/casrpubfile/1081/CASR094.pdf (accessed on 8 October 2024).
- Hickman, J.S.; Medina-flintsch, A.; Hanowski, R.J.; Tefft, B.B. Societal Benefit of Automatic Emergency Braking and Lane Departure Warning. System in large trucks. In Proceedings of the 26th International Technical Conference on the Enhanced Safety of Vehicles (ESV): Technology: Enabling a Safer Tomorrow, Eindhoven, The Netherlands, 10–13 June 2019. [Google Scholar]
- Yue, L.; Abdel-Aty, M.; Wu, Y. The Crash Avoidance Effectiveness of Advanced Driver Assistance Systems in Real-World Environment. In Proceedings of the International Conference on Transportation and Development 2019, Alexandria, Virginia, 9–12 June 2019; pp. 41–51. [Google Scholar] [CrossRef]
- Tan, H.; Zhao, F.; Hao, H.; Liu, Z. Evidence for the Crash Avoidance Effectiveness of Intelligent and Connected Vehicle Technologies. Int. J. Environ. Res. Public Health 2021, 18, 9228. [Google Scholar] [CrossRef] [PubMed]
- Validi, A.; Ludwig, T.; Hussein, A.; Olaverri-Monreal, C. Examining the Impact on Road Safety of Different Penetration Rates of Vehicle-to-Vehicle Communication and Adaptive Cruise Control. IEEE Intell. Transp. Syst. Mag. 2018, 10, 24–34. [Google Scholar] [CrossRef]
- Teoh, E.R. Effectiveness of front crash prevention systems in reducing large truck real-world crash rates. Traffic Inj. Prev. 2021, 22, 284–289. [Google Scholar] [CrossRef]
- Lehmer, M.J.; Brown, V.; Carnell, R.; Christiaen, A.; McMillan, N.; Orban, J.; Stark, G.; Miller, R.; Rini, N.A. Volvo Trucks Field Operational Test: Evaluation of Advanced Safety Systems for Heavy Trucks. In Proceedings of the 20th International Technical Conference on the Enhanced Safety of Vehicles (ESV), Lyon, France, 18–21 June 2007. [Google Scholar]
- Scanlon, J.M.; Kusano, K.D.; Gabler, H.C. Lane Departure Warning and Prevention Systems in the U.S. Vehicle Fleet: Influence of Roadway Characteristics on Potential Safety Benefits. Transp. Res. Rec. 2016, 2559, 17–23. [Google Scholar] [CrossRef]
- Roozendaal, J.; Johansson, E.; Winter, J.; de Abbink, D.; Petermeijer, S. Haptic Lane-Keeping Assistance for Truck Driving: A Test Track Study. Hum. Factors 2021, 63, 1380–1395. [Google Scholar] [CrossRef]
- Chen, G.; Jenkins, E.; Husting, E. A Comparison of Crash Patterns in Heavy Trucks with and Without Collision Warning System Technology. SAE Tech. Pap. 2004, 113, 360–365. [Google Scholar]
- Sayer, J.R.; Funkhouser, D.S.; Bao, S.; Bogard, S.E.; LeBlanc, D.J.; Blankespoor, A.D.; Buonarosa, M.L.; Winkler, C.B. Integrated Vehicle-Based Safety Systems Heavy-Truck Field Operational Test Methodology and Results Report; The University of Michigan Transportation Research Institute: Ann Arbor, MI, USA, 2010; Report N° UMTRI-2010-27. [Google Scholar]
- Rakha, H.A.; Fitch, G.M.; Arafeh, M.; Blanco, M.; Hanowski, R.J. Evaluation of Safety Benefits from a Heavy-Vehicle Forward Collision Warning System. Transportation Res. Rec. 2010, 2194, 44–54. [Google Scholar] [CrossRef]
- Woodrooffe, J.; Blower, D.; Flannagan, C.A.; Bogard, S.E.; Bao, S. Effectiveness of a Current Commercial Vehicle Forward Collision Avoidance and Mitigation Systems. SAE Tech. Pap. 2013. [Google Scholar] [CrossRef]
- Tidwell, S.; Blanco, M.; Trimble, T.; Atwood, J.; Morgan, J.F. Evaluation of Heavy-Vehicle Crash Warning Interfaces; Report No. DOT HS 812 191; National Highway Traffic Safety Administration: Washington, DC, USA, 2015. [Google Scholar]
- Li, X.; Lin, K.Y.; Meng, M.; Li, X.; Li, L.; Hong Yand Chen, J. A Survey of ADAS Perceptions with Development in China. IEEE Trans. Intell. Transp. Syst. 2022, 23, 14188–14203. [Google Scholar] [CrossRef]
- Wang, M.H.; Wei, C.H. Potential Safety Benefit of the Blind Spot Detection System for Large Trucks on the Vulnerable Road Users in Taiwan. In Proceedings of the 5th International Conference on Transportation and Traffic Engineering, Lucerne, Switzerland, 6–12 July 2016. [Google Scholar] [CrossRef]
- Budd, L.; Newstead, S.V. Potential Safety Benefits of Emerging Crash Avoidance Technologies in Australasian Heavy Vehicles; Report No. MUARC#324; Monash University Accident Research Centre: Victoria, Australia, 2014. [Google Scholar]
- Guglielmi, J.; Yanagisawa, M.; Swanson, E.; Stevens, S.; Najm, W.J. Safety Benefits of Heavy-Vehicle Crash Warning Applications Based on Vehicle-to-Vehicle Communications; Report No. DOT HS 812 429; National Highway Traffic Safety Administration: Washington, DC, USA, 2017. [Google Scholar]
- Yang, S.; Shladover, S.E.; Lu, X.; Spring, J.; Nelson, D.; Ramezani, H. A First Investigation of Truck Drivers’ On-the-Road Experience Using Cooperative Adaptive Cruise Control; UC Berkeley: California Partners for Advanced Transportation Technology: Berkeley, CA, USA, 2018; Available online: https://escholarship.org/uc/item/92359572 (accessed on 8 October 2024).
- Svenson, A.L.; Stevens, S.; Guglielmi, J. Evaluating Driver Acceptance of Heavy Truck Vehicle-To-Vehicle Safety Applications. In Proceedings of the 23rd International Technical Conference on the Enhanced Safety of Vehicles (ESV), Seoul, Republic of Korea, 27–30 July 2013; Available online: https://trid.trb.org/view/1360788 (accessed on 8 October 2024).
- ISTAT. Road Accidents 2019. 2020. Available online: https://www.istat.it/en/archivio/245981 (accessed on 17 October 2022).
- Greenwood, P.M.; Lenneman, J.K.; Baldwin, C.L. Advanced driver assistance systems (ADAS): Demographics, preferred sources of information, andaccuracy of ADAS knowledge. Transp. Res. F Traffic Psychol. Behav. 2022, 86, 131–150. [Google Scholar] [CrossRef]
Disclaimer/Publisher’s Note: The statements, opinions and data contained in all publications are solely those of the individual author(s) and contributor(s) and not of MDPI and/or the editor(s). MDPI and/or the editor(s) disclaim responsibility for any injury to people or property resulting from any ideas, methods, instructions or products referred to in the content. |
© 2025 by the authors. Licensee MDPI, Basel, Switzerland. This article is an open access article distributed under the terms and conditions of the Creative Commons Attribution (CC BY) license (https://creativecommons.org/licenses/by/4.0/).