
Explaining Urban Vitality Through Interpretable Machine Learning: A Big Data Approach Using Street View Images and Environmental Factors


Abstract
1. Introduction
1.1. Introduction to Urban Vitality
1.2. Evolution of Urban Vitality Measurement
1.3. The Need for Nonlinear Modeling and Interpretability
1.4. The Black Box Challenge: Towards Interpretable Machine Learning
1.5. Research Objectives and Contributions
- (1)
- Urban vitality measurement and spatial correlation analysis: Using Beijing’s fifth ring road as the research region, we compute the urban vitality values there and do a thorough examination of its spatial distribution features and correlations using the ResNet50 model, which was trained using the Place Pulse 2.0 dataset.
- (2)
- Modeling of nonlinear relationships and exploration of threshold effects: Cross-validation is used to optimize the hyperparameters and construct the optimal GBDT model, which provides high-precision data support for the exploration of the nonlinear correlation between environmental data and urban vitality and the threshold effect.
- (3)
- To determine the dominating components and quantify their respective contributions to urban vitality, an interpretation framework based on SHAP was presented. This framework was used to compute the RIs of environmental factors using the global SHAP values.
- (4)
- Local interpretation and visualization: Using the Local Dependence Plots (LDPs) of SHAP, the SHAP values of the environmental data for each urban vitality factor were visually presented, thus revealing the nonlinear relationship and threshold characteristics between the environmental factors and the urban vitality.
2. Study Area and Materials
2.1. Study Area
2.2. Data
2.3. The Place Pulse 2.0 Dataset
2.4. Street View Images of Beijing
2.5. Variables
2.5.1. Built Environment Data
2.5.2. Socioeconomic Data
3. Methodology
3.1. Overview of the Framework
- (1)
- Defining variables and computing urban vitality
- (2)
- Modeling nonlinear associations and interpreting results
- (3)
- Model validation and spatial analysis
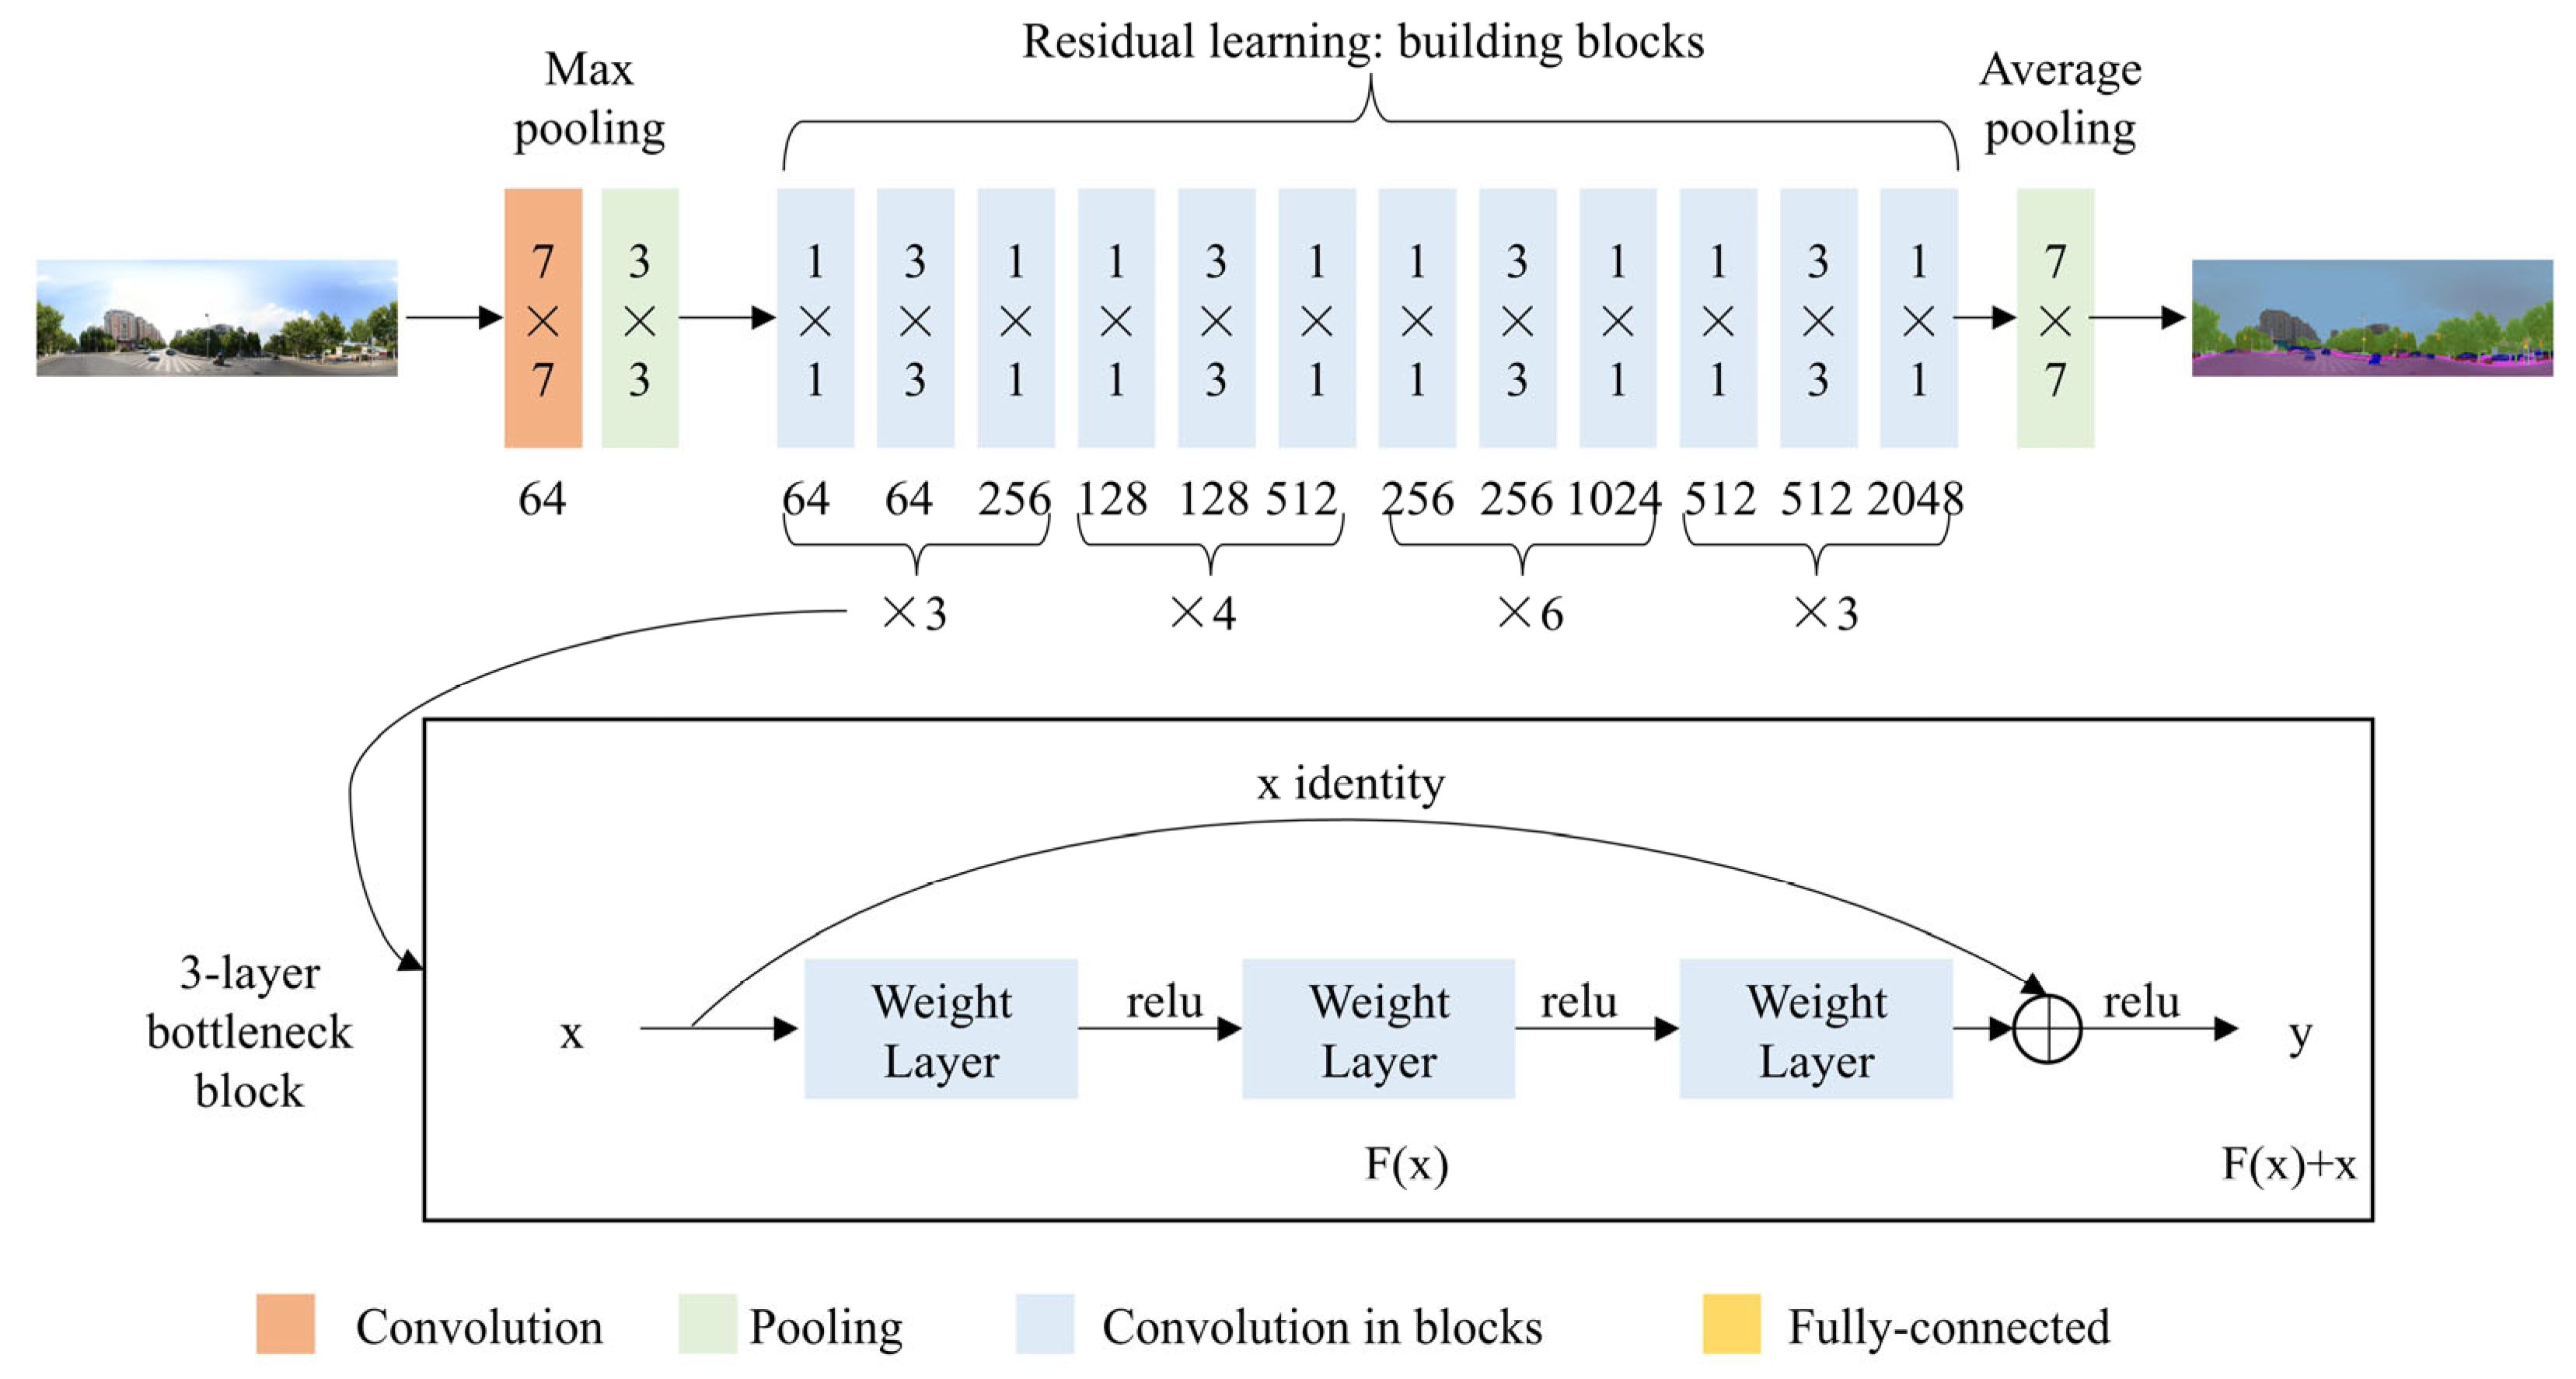
3.2. Perceptions of Urban Vitality Using ResNet50
3.3. GBDT Model
3.4. Shapley Additive Explanations Model
4. Result
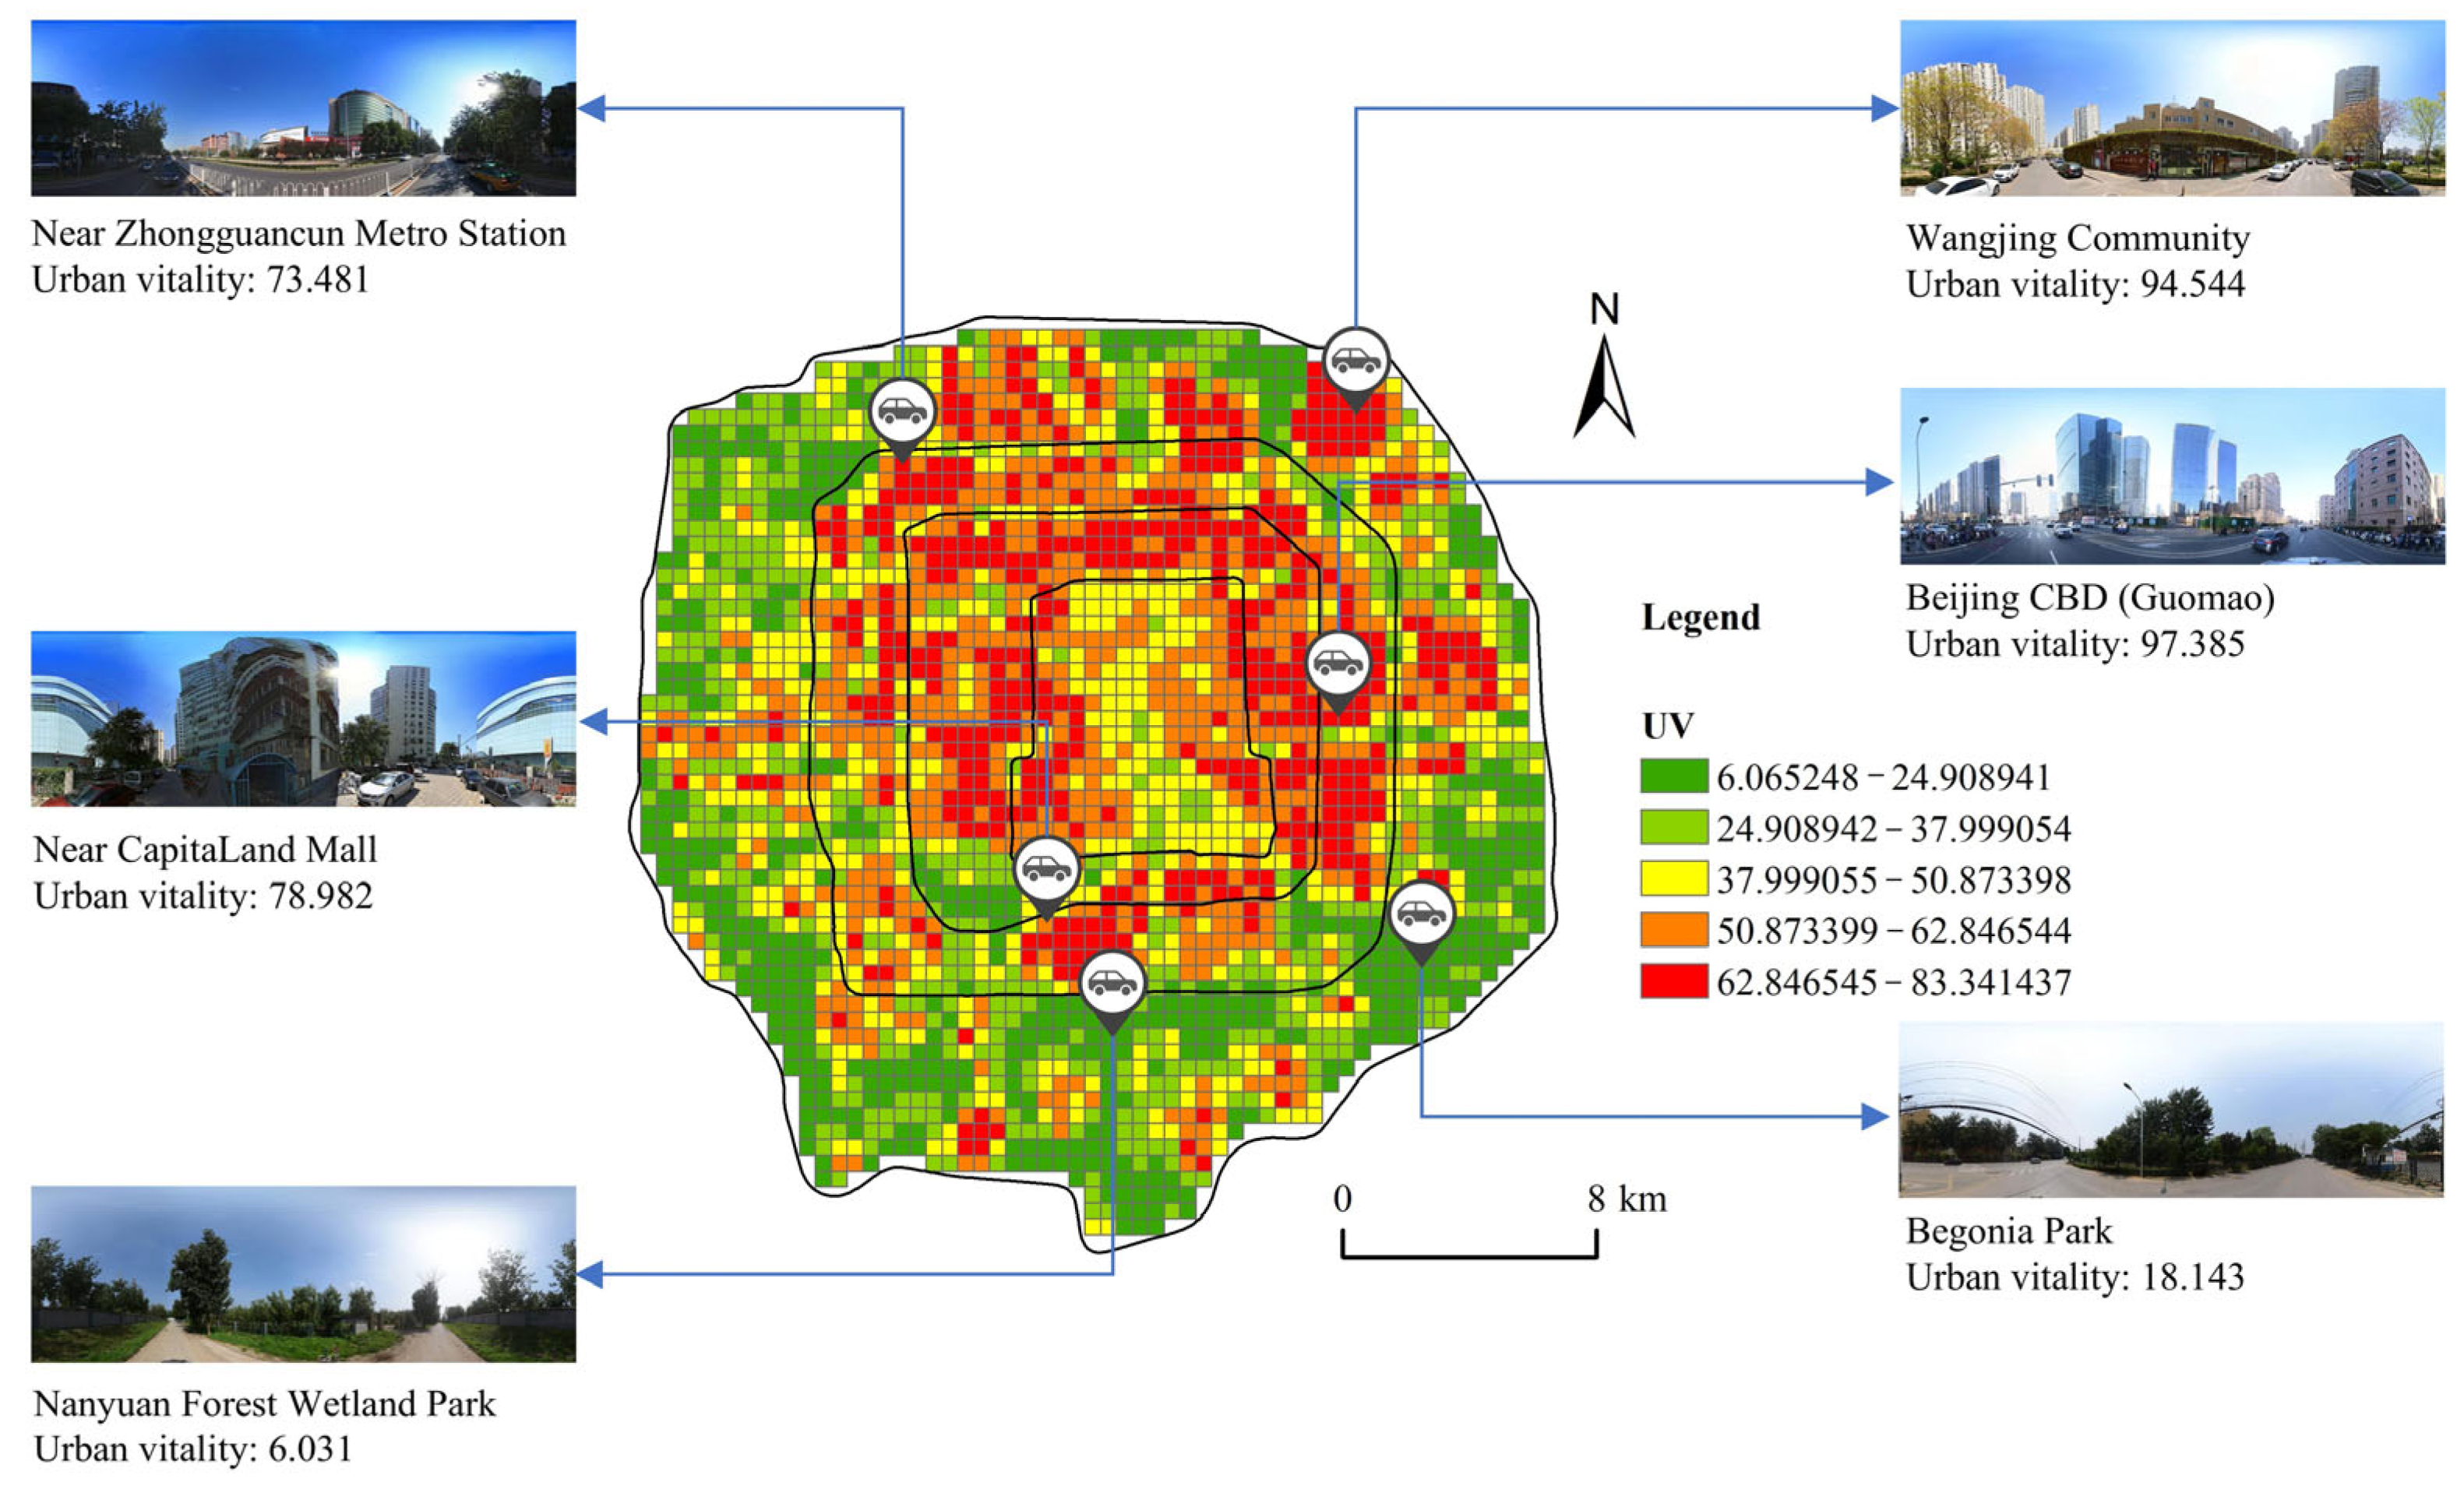
4.1. Spatial Autocorrelation Analysis of Urban Vitality
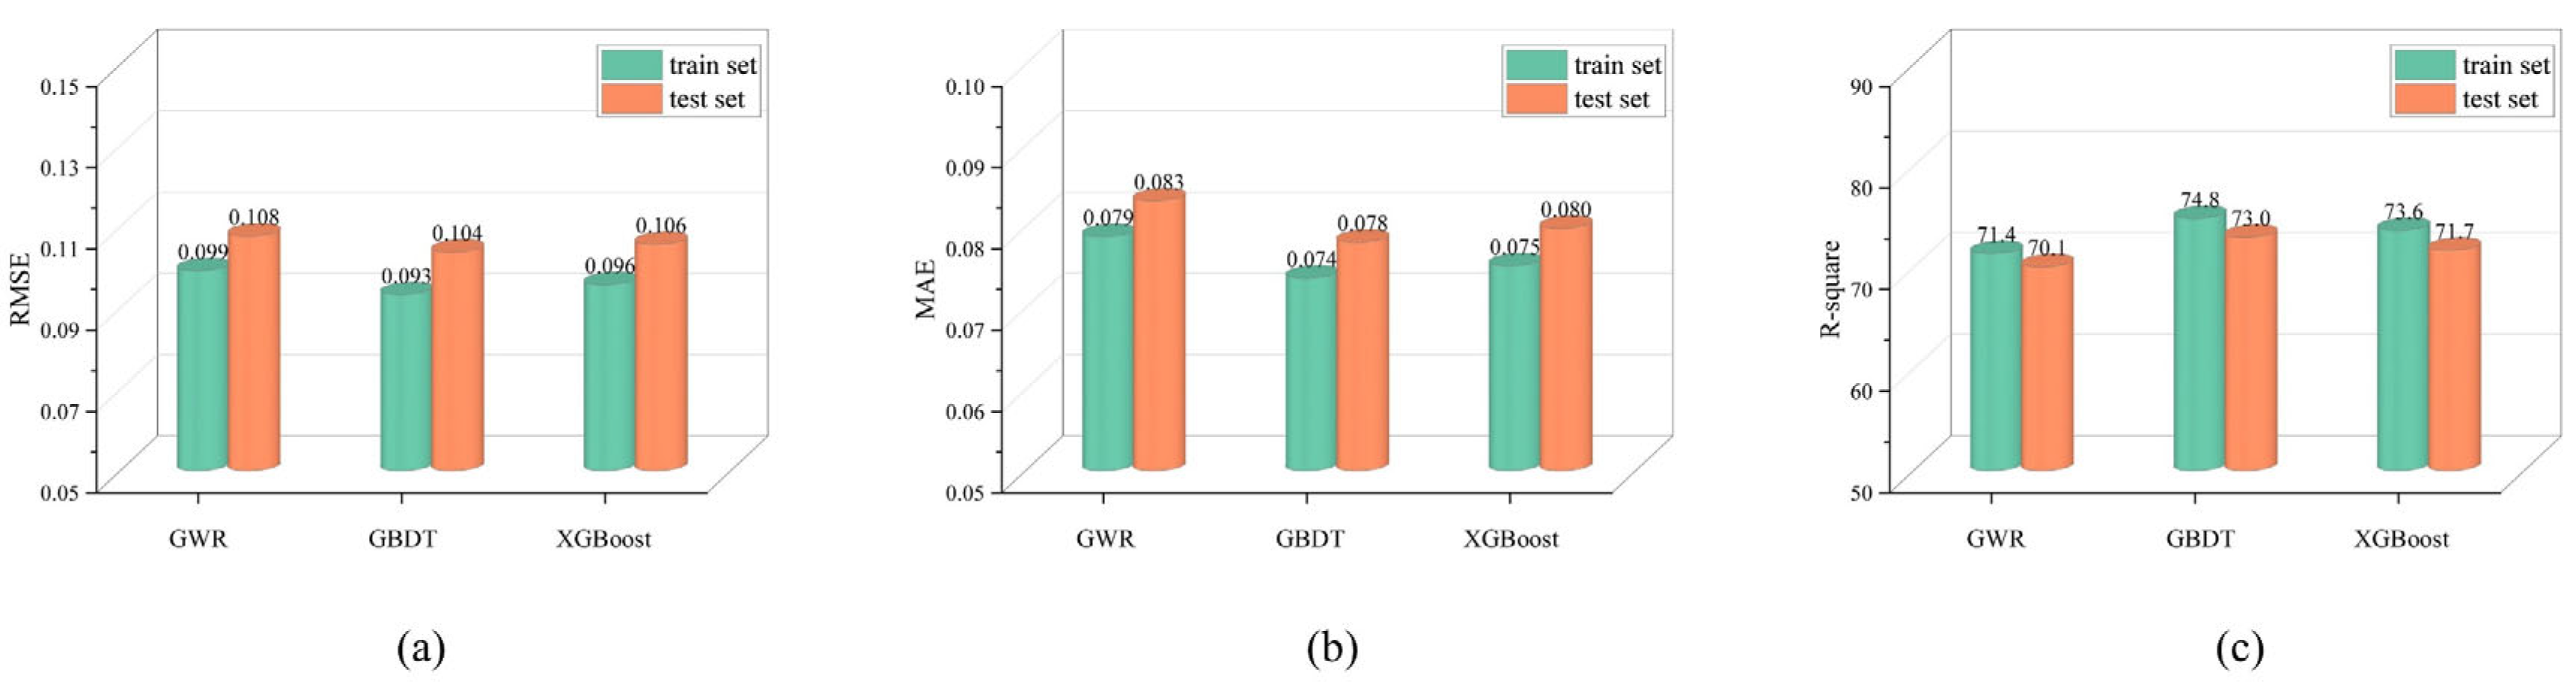
4.2. Model Comparison
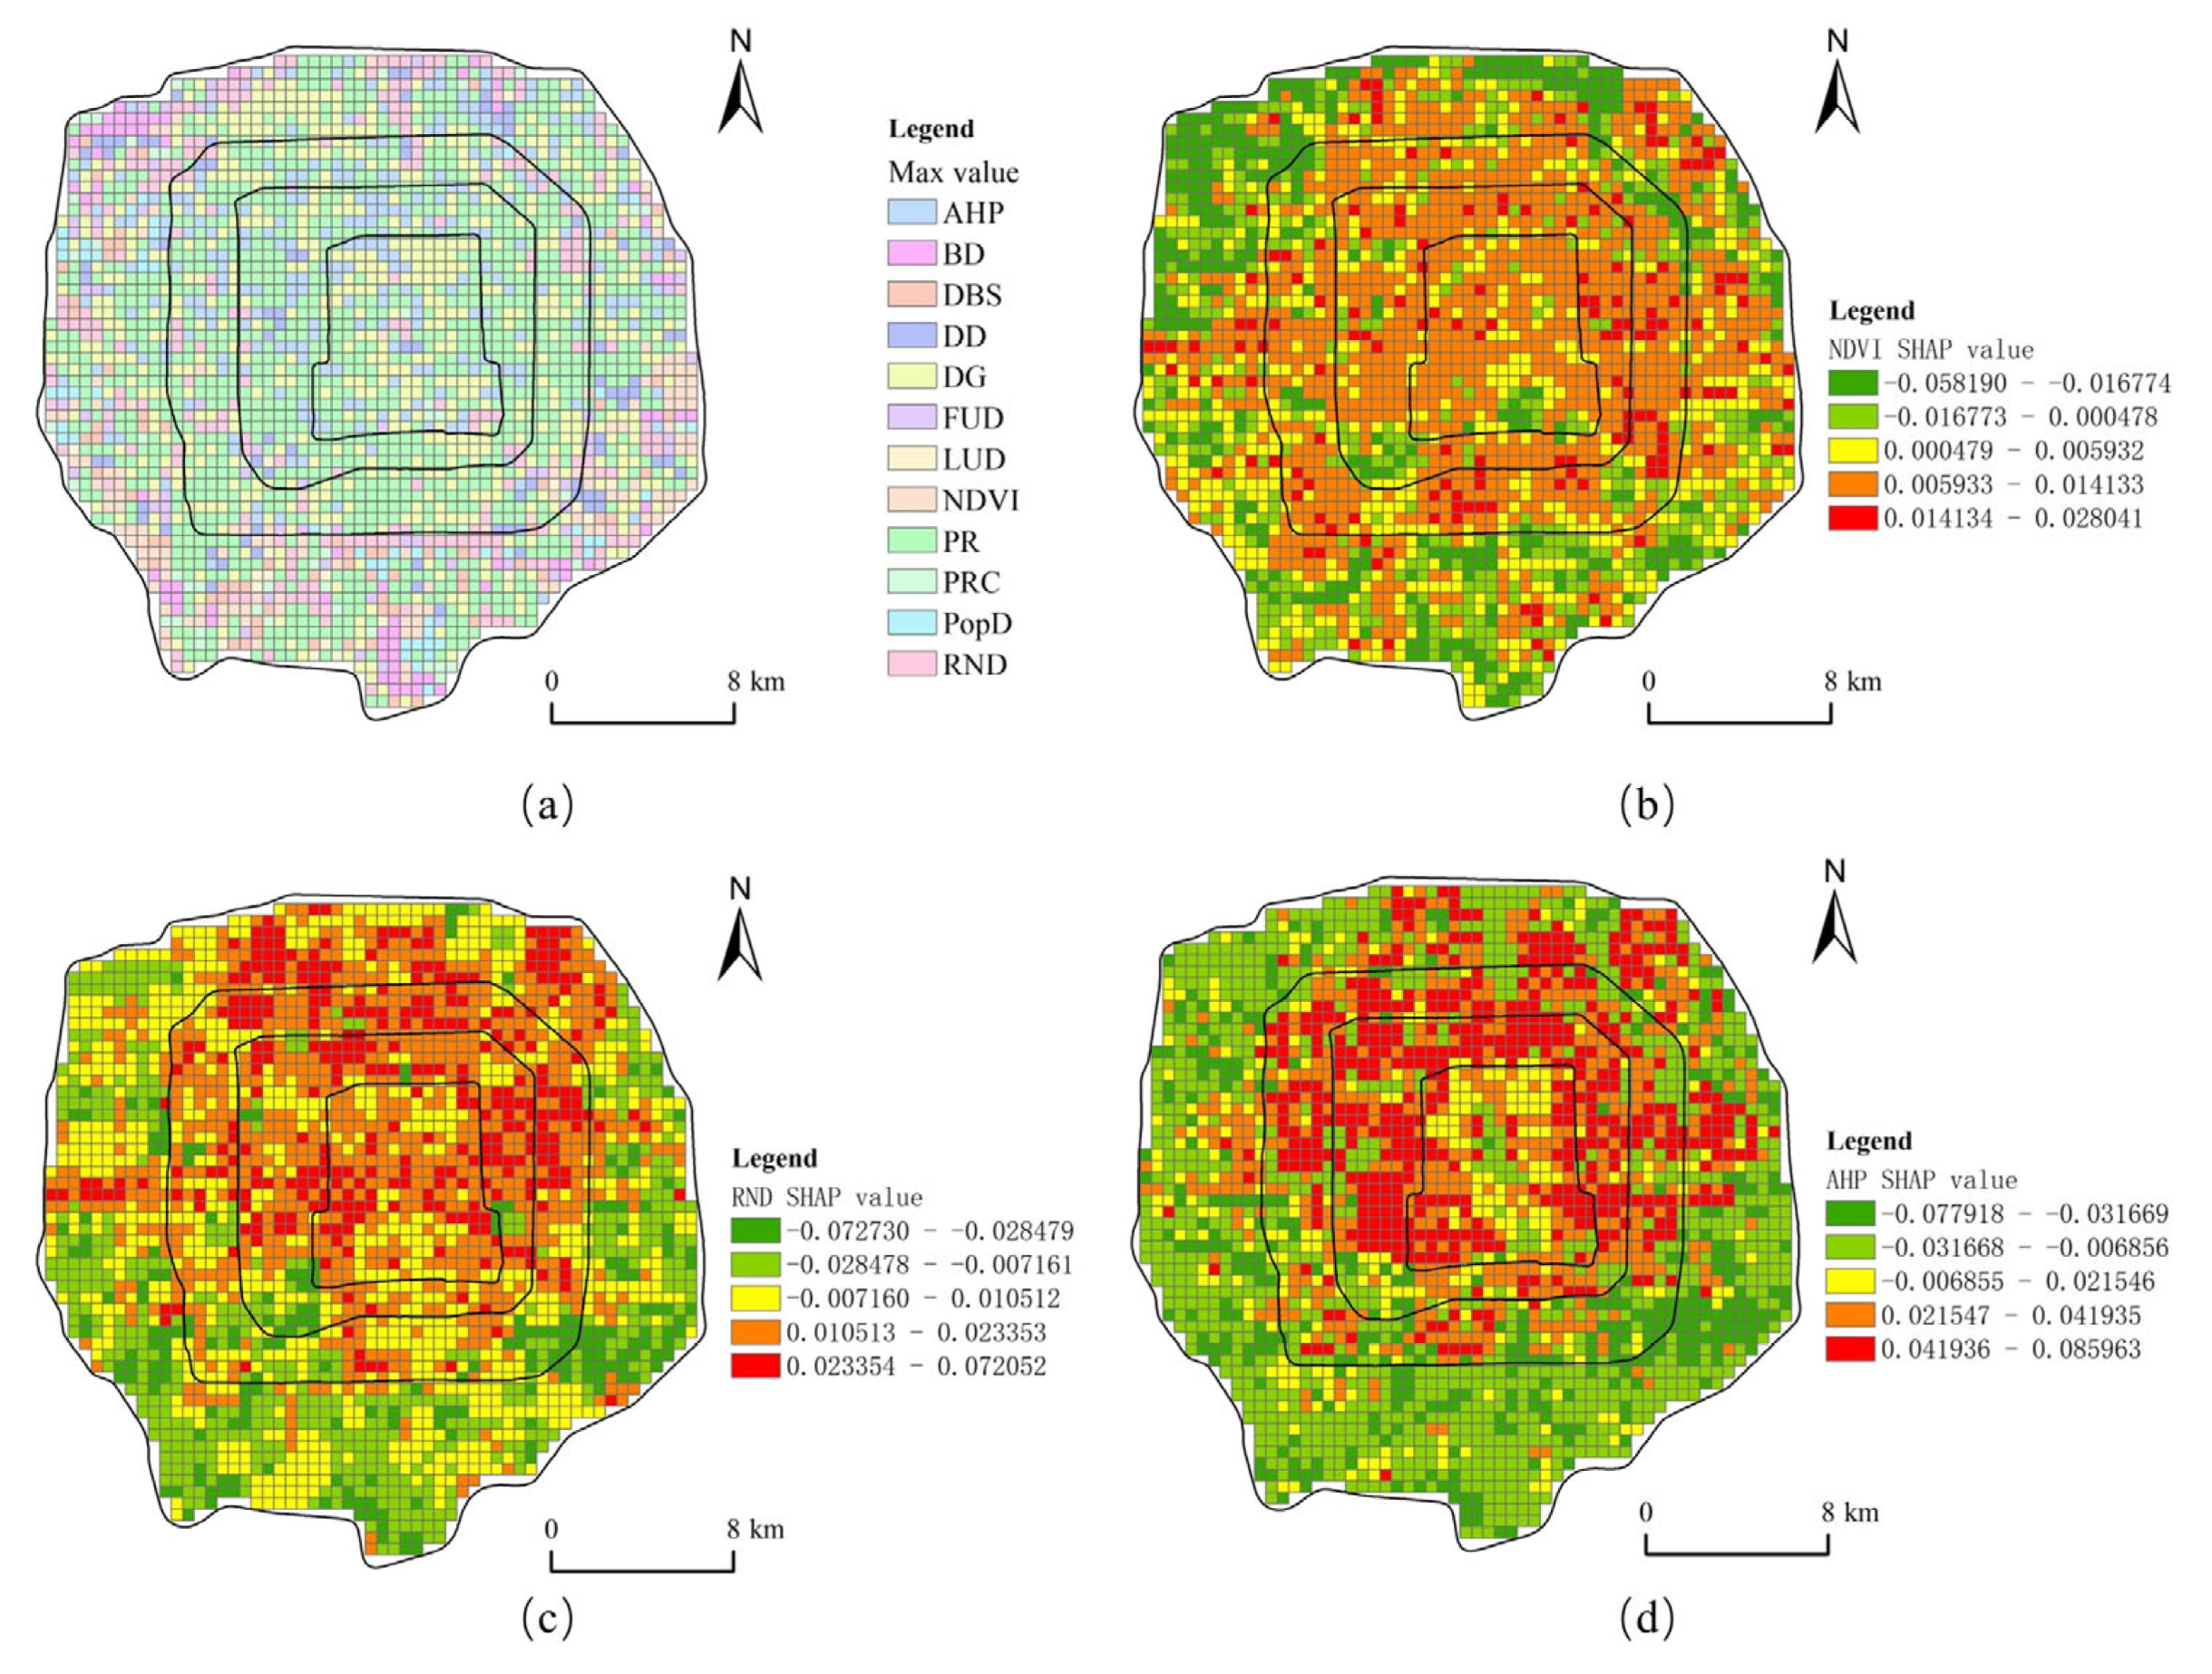
4.3. Relative Importance of Variables
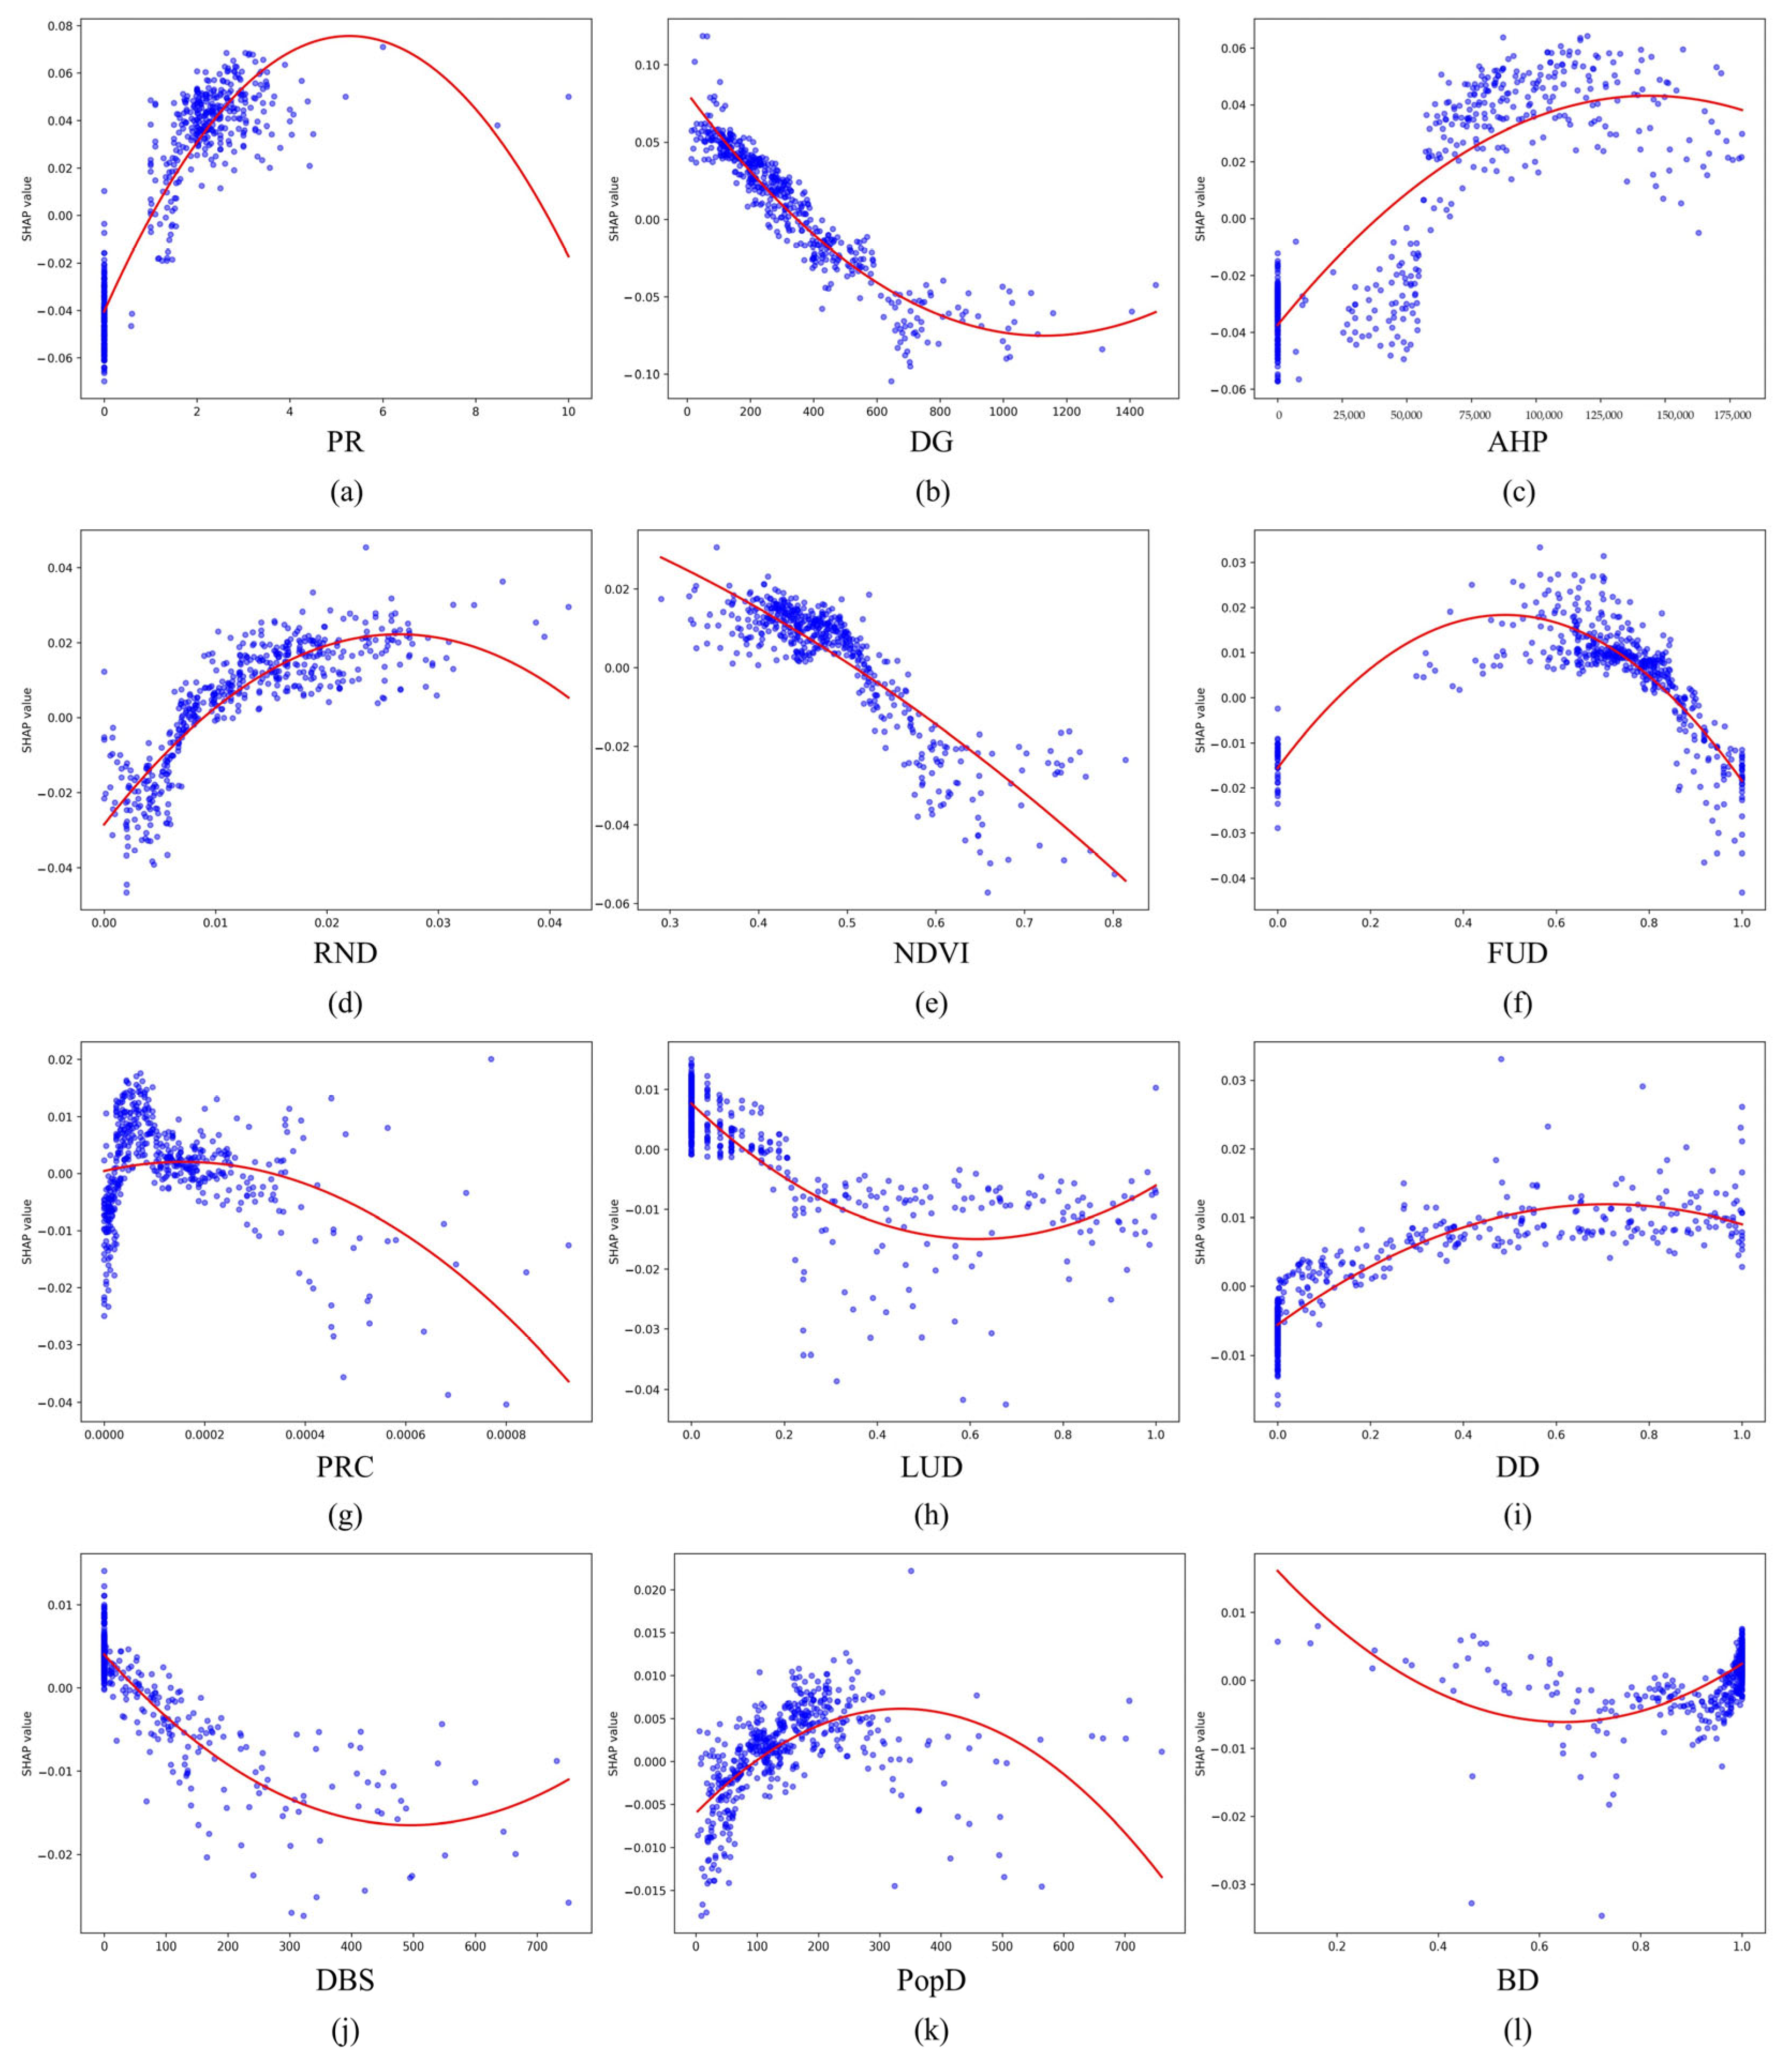
4.4. Nonlinear Association Analysis
5. Discussion
5.1. Overall Evaluation of the Experiment
5.2. Influence of Built Environment Factors on Urban Vitality
5.3. Influence of Socioeconomic Factors on Urban Vitality
5.4. Limitations and Future Research Directions
6. Conclusions
- (1)
- Urban vitality within Beijing’s fifth ring road exhibits significant spatial clustering and positive correlations, characterized by marked spatial heterogeneity with aggregated distribution in both hot-spot and cold-spot areas.
- (2)
- The optimized GBDT model, tuned via grid search, outperforms GWR and XGBoost by achieving the best overall prediction accuracy, effectively capturing complex nonlinear relationships.
- (3)
- Among all the environmental variables, PR demonstrates the strongest positive influence on urban vitality, whereas DG exhibits the most significant negative correlation with urban vitality.
- (4)
- The study reveals notable nonlinear and threshold effects of DG, the built environment, and socioeconomic conditions on urban vitality.
Author Contributions
Funding
Institutional Review Board Statement
Informed Consent Statement
Data Availability Statement
Conflicts of Interest
References
- Liu, H.; Gou, P.; Xiong, J. Vital triangle: A new concept to evaluate urban vitality. Comput. Environ. Urban Syst. 2022, 98, 101886. [Google Scholar] [CrossRef]
- Jiang, Y.; Han, Y.; Liu, M.; Ye, Y. Street vitality and built environment features: A data-informed approach from fourteen Chinese cities. Sustain. Cities Soc. 2022, 79, 103724. [Google Scholar] [CrossRef]
- Yue, W.; Chen, Y.; Thy, P.T.M.; Fan, P.; Liu, Y.; Zhang, W. Identifying urban vitality in metropolitan areas of developing countries from a comparative perspective: Ho Chi Minh City versus Shanghai. Sustain. Cities Soc. 2021, 65, 102609. [Google Scholar] [CrossRef]
- Dogan, O.; Lee, S. Jane Jacobs’s urban vitality focusing on three-facet criteria and its confluence with urban physical complexity. Cities 2024, 155, 105446. [Google Scholar] [CrossRef]
- Glaeser, E. Cities, Productivity, and Quality of Life. Science 2011, 333, 592–594. [Google Scholar] [CrossRef]
- Wu, C.; Ye, X.; Ren, F.; Du, Q. Check-in behaviour and spatio-temporal vibrancy: An exploratory analysis in Shenzhen, China. Cities 2018, 77, 104–116. [Google Scholar] [CrossRef]
- Yue, Y.; Zhuang, Y.; Yeh, A.G.O.; Xie, J.Y.; Ma, C.L.; Li, Q.Q. Measurements of POI-based mixed use and their relationships with neighbourhood vibrancy. Int. J. Geogr. Inf. Sci. 2017, 31, 658–675. [Google Scholar] [CrossRef]
- Huang, B.; Zhou, Y.; Li, Z.; Song, Y.; Cai, J.; Tu, W. Evaluating and characterizing urban vibrancy using spatial big data: Shanghai as a case study. Environ. Plan. B Urban Anal. City Sci. 2019, 47, 1543–1559. [Google Scholar] [CrossRef]
- Delclòs-Alió, X.; Miralles-Guasch, C. Looking at Barcelona through Jane Jacobs’s eyes: Mapping the basic conditions for urban vitality in a Mediterranean conurbation. Land Use Policy 2018, 75, 505–517. [Google Scholar] [CrossRef]
- Wu, J.; Ta, N.; Song, Y.; Lin, J.; Chai, Y. Urban form breeds neighborhood vibrancy: A case study using a GPS-based activity survey in suburban Beijing. Cities 2018, 74, 100–108. [Google Scholar] [CrossRef]
- Jin, X.; Long, Y.; Sun, W.; Lu, Y.; Yang, X.; Tang, J. Evaluating cities’ vitality and identifying ghost cities in China with emerging geographical data. Cities 2017, 63, 98–109. [Google Scholar] [CrossRef]
- Wang, B.; Zhen, F.; Wei, Z.; Guo, S.; Chen, T. A theoretical framework and methodology for urban activity spatial structure in e-society: Empirical evidence for Nanjing City, China. Chin. Geogr. Sci. 2015, 25, 672–683. [Google Scholar] [CrossRef]
- Long, Y.; Huang, C.C. Does block size matter? The impact of urban design on economic vitality for Chinese cities. Environ. Plan. B Urban Anal. City Sci. 2017, 46, 406–422. [Google Scholar] [CrossRef]
- Ye, Y.; Li, D.; Liu, X. How block density and typology affect urban vitality: An exploratory analysis in Shenzhen, China. Urban Geogr. 2018, 39, 631–652. [Google Scholar] [CrossRef]
- Xia, C.; Yeh, A.G.-O.; Zhang, A. Analyzing spatial relationships between urban land use intensity and urban vitality at street block level: A case study of five Chinese megacities. Landsc. Urban Plan. 2020, 193, 103669. [Google Scholar] [CrossRef]
- Kim, Y.-L. Seoul’s Wi-Fi hotspots: Wi-Fi access points as an indicator of urban vitality. Comput. Environ. Urban Syst. 2018, 72, 13–24. [Google Scholar] [CrossRef]
- Xiao, L.; Lo, S.; Zhou, J.; Liu, J.; Yang, L. Predicting vibrancy of metro station areas considering spatial relationships through graph convolutional neural networks. Case Shenzhen China 2021, 48, 2363–2384. [Google Scholar] [CrossRef]
- Yang, J.; Cao, J.; Zhou, Y. Elaborating non-linear associations and synergies of subway access and land uses with urban vitality in Shenzhen. Transp. Res. Part A Policy Pract. 2021, 144, 74–88. [Google Scholar] [CrossRef]
- Pengjun, Z.; Jia, L.U.O.; Haoyu, H.U. Spatial match between residents’ daily life circle and public service facilities using big data analytics: A case of Beijing. Prog. Geogr. 2021, 40, 541–553. [Google Scholar] [CrossRef]
- Cong, W.; Zhou, J.; Lai, Y. The coordination between citywide rail transit accessibility and land-use characteristics in Shenzhen, China: An explorative analysis based on multidimensional spatial data. Sustain. Cities Soc. 2024, 113, 105691. [Google Scholar] [CrossRef]
- Long, Y.; Wu, Y.; Huang, L.; Aleksejeva, J.; Iossifova, D.; Dong, N.; Gasparatos, A. Assessing urban livability in Shanghai through an open source data-driven approach. NPJ Urban Sustain. 2024, 4, 7. [Google Scholar] [CrossRef]
- Sicong, Z.O.U.; Shanqi, Z.; Feng, Z. Measurement of community daily activity space and influencing factors of vitality based on residents’ spatiotemporal behavior: Taking Shazhou and Nanyuan streets in Nanjing as examples. Prog. Geogr. 2021, 40, 580–596. [Google Scholar] [CrossRef]
- Wang, B.; Lei, Y.; Xue, D.; Liu, J.; Wei, C. Elaborating Spatiotemporal Associations Between the Built Environment and Urban Vibrancy: A Case of Guangzhou City, China. Chin. Geogr. Sci. 2022, 32, 480–492. [Google Scholar] [CrossRef]
- Li, D.; Liu, J.; Zhao, Y. Prediction of Multi-Site PM2.5 Concentrations in Beijing Using CNN-Bi LSTM with CBAM. Atmosphere 2022, 13, 1719. [Google Scholar] [CrossRef]
- Li, D.; Liu, J.; Zhao, Y. Forecasting of PM2.5 Concentration in Beijing Using Hybrid Deep Learning Framework Based on Attention Mechanism. Appl. Sci. 2022, 12, 11155. [Google Scholar] [CrossRef]
- Li, D.; Wang, J.; Tian, D.; Chen, C.; Xiao, X.; Wang, L.; Wen, Z.; Yang, M.; Zou, G. Residual neural network with spatiotemporal attention integrated with temporal self-attention based on long short-term memory network for air pollutant concentration prediction. Atmos. Environ. 2024, 329, 120531. [Google Scholar] [CrossRef]
- Zhaomin, T.; Rui, A.N.; Yaolin, L.I.U. Impact of the built environment on residents’ commuting mode choices: A case study of urban village in Wuhan City. Prog. Geogr. 2021, 40, 2048–2060. [Google Scholar] [CrossRef]
- Liu, J.; Wang, B.; Xiao, L. Non-linear associations between built environment and active travel for working and shopping: An extreme gradient boosting approach. J. Transp. Geogr. 2021, 92, 103034. [Google Scholar] [CrossRef]
- Chen, C.; Wang, J.; Li, D.; Sun, X.; Zhang, J.; Yang, C.; Zhang, B. Unraveling nonlinear effects of environment features on green view index using multiple data sources and explainable machine learning. Sci. Rep. 2024, 14, 30189. [Google Scholar] [CrossRef]
- Jerome, H.F. Greedy function approximation: A gradient boosting machine. Ann. Stat. 2001, 29, 1189–1232. [Google Scholar] [CrossRef]
- Yang, W.; Li, Y.; Liu, Y.; Fan, P.; Yue, W. Environmental factors for outdoor jogging in Beijing: Insights from using explainable spatial machine learning and massive trajectory data. Landsc. Urban Plan. 2024, 243, 104969. [Google Scholar] [CrossRef]
- Ben Khedher, M.B.; Yun, D. An Interpretable Machine Learning-Based Hurdle Model for Zero-Inflated Road Crash Frequency Data Analysis: Real-World Assessment and Validation. Appl. Sci. 2024, 14, 10790. [Google Scholar] [CrossRef]
- Pasic, M.; Marinkovic, D.; Lukic, D.; Begic-Hajdarevic, D.; Zivkovic, A.; Milosevic, M.; Muhamedagic, K. Prediction and Optimization of Surface Roughness and Cutting Forces in Turning Process Using ANN, SHAP Analysis, and Hybrid MCDM Method. Appl. Sci. 2024, 14, 11386. [Google Scholar] [CrossRef]
- Santamato, V.; Tricase, C.; Faccilongo, N.; Iacoviello, M.; Pange, J.; Marengo, A. Machine Learning for Evaluating Hospital Mobility: An Italian Case Study. Appl. Sci. 2024, 14, 6016. [Google Scholar] [CrossRef]
- Plakias, S.; Kokkotis, C.; Mitrotasios, M.; Armatas, V.; Tsatalas, T.; Giakas, G.J.A.S. Identifying Key Factors for Securing a Champions League Position in French Ligue 1 Using Explainable Machine Learning Techniques. Appl. Sci. 2024, 14, 8375. [Google Scholar] [CrossRef]
- Dubey, A.; Naik, N.; Parikh, D.; Raskar, R.; Hidalgo, C.A. Deep Learning the City: Quantifying Urban Perception at a Global Scale. In Computer Vision—ECCV 2016: 14th European Conference, Amsterdam, The Netherlands, 11–14 October 2016, Proceedings, Part I; Springer International Publishing: Cham, Switzerland, 2016; pp. 196–212. [Google Scholar]
- Wei, J.; Yue, W.; Li, M.; Gao, J. Mapping human perception of urban landscape from street-view images: A deep-learning approach. Int. J. Appl. Earth Obs. Geoinf. 2022, 112, 102886. [Google Scholar] [CrossRef]
- Shi, J.; Miao, W.; Si, H.; Liu, T. Urban Vitality Evaluation and Spatial Correlation Research: A Case Study from Shanghai, China. Land 2021, 10, 1195. [Google Scholar] [CrossRef]
- Niu, S.; Hu, A.; Shen, Z.; Huang, Y.; Mou, Y. Measuring the built environment of green transit-oriented development: A factor-cluster analysis of rail station areas in Singapore. Front. Archit. Res. 2021, 10, 652–668. [Google Scholar] [CrossRef]
- He, K.; Zhang, X.; Ren, S.; Sun, J. Deep Residual Learning for Image Recognition. In Proceedings of the 2016 IEEE Conference on Computer Vision and Pattern Recognition (CVPR), Las Vegas, NV, USA, 27–30 June 2016; pp. 770–778. [Google Scholar]
- Zhang, B.; Zou, G.; Qin, D.; Ni, Q.; Mao, H.; Li, M. RCL-Learning: ResNet and convolutional long short-term memory-based spatiotemporal air pollutant concentration prediction model. Expert Syst. Appl. 2022, 207, 118017. [Google Scholar] [CrossRef]
- Yang, W.; Fei, J.; Li, Y.; Chen, H.; Liu, Y. Unraveling nonlinear and interaction effects of multilevel built environment features on outdoor jogging with explainable machine learning. Cities 2024, 147, 104813. [Google Scholar] [CrossRef]
- Chen, Y.; Yu, B.; Shu, B.; Yang, L.; Wang, R. Exploring the spatiotemporal patterns and correlates of urban vitality: Temporal and spatial heterogeneity. Sustain. Cities Soc. 2023, 91, 104440. [Google Scholar] [CrossRef]
- Bao, Z.; Ou, Y.; Chen, S.; Wang, T. Land Use Impacts on Traffic Congestion Patterns: A Tale of a Northwestern Chinese City. Land 2022, 11, 2295. [Google Scholar] [CrossRef]
- Li, M.; Pan, J. Assessment of Influence Mechanisms of Built Environment on Street Vitality Using Multisource Spatial Data: A Case Study in Qingdao, China. Sustainability 2023, 15, 1518. [Google Scholar] [CrossRef]
- Ding, J.; Luo, L.; Shen, X.; Xu, Y. Influence of built environment and user experience on the waterfront vitality of historical urban areas: A case study of the Qinhuai River in Nanjing, China. Front. Archit. Res. 2023, 12, 820–836. [Google Scholar] [CrossRef]
- Xie, Y.; Zhang, J.; Li, Y.; Zhu, Z.; Deng, J.; Li, Z. Integrating Multi-Source Urban Data with Interpretable Machine Learning for Uncovering the Multidimensional Drivers of Urban Vitality. Land 2024, 13, 2028. [Google Scholar] [CrossRef]
- Zhang, P.; Zhang, T.; Fukuda, H.; Ma, M. Evidence of Multi-Source Data Fusion on the Relationship between the Specific Urban Built Environment and Urban Vitality in Shenzhen. Sustainability 2023, 15, 6869. [Google Scholar] [CrossRef]
- Honghu, S.U.N.; Yupei, J. Spatial heterogeneity of the impact of built environment on urban vitality: A case study of the central urban area of Nanjing. Geogr. Res. 2024, 43, 1700–1714. [Google Scholar] [CrossRef]
- Xu, D.; Zhou, D.; Wang, Y.; Meng, X.; Gu, Z.; Yang, Y. Temporal and spatial heterogeneity research of urban anthropogenic heat emissions based on multi-source spatial big data fusion for Xi’an, China. Energy Build. 2021, 240, 110884. [Google Scholar] [CrossRef]
- Xiao, Z.; Li, C.; Pan, S.; Wei, G.; Tian, M.; Hu, R. Exploring the Spatial Impact of Multisource Data on Urban Vitality: A Causal Machine Learning Method. Wirel. Commun. Mob. Comput. 2022, 2022, 5263376. [Google Scholar] [CrossRef]
- Jiang, B.; Larsen, L.; Deal, B.; Sullivan, W.C. A dose–response curve describing the relationship between tree cover density and landscape preference. Landsc. Urban Plan. 2015, 139, 16–25. [Google Scholar] [CrossRef]
- Li, G.; Cao, Y.; Fang, C.; Sun, S.; Qi, W.; Wang, Z.; He, S.; Yang, Z. Global urban greening and its implication for urban heat mitigation. Proc. Natl. Acad. Sci. USA 2025, 122, e2417179122. [Google Scholar] [CrossRef] [PubMed]
- Chen, H.; Jia, B.; Lau, S.S.Y. Sustainable urban form for Chinese compact cities: Challenges of a rapid urbanized economy. Habitat Int. 2008, 32, 28–40. [Google Scholar] [CrossRef]
- Ünalan, G.; Çamalan, Ö.; Yılmaz, H.H. The Impact of Increases in Housing Prices on Income Inequality: A Perspective on Sustainable Urban Development. Sustainability 2025, 17, 4024. [Google Scholar] [CrossRef]


| Variables | Abbreviation | Formula | Descriptions |
|---|---|---|---|
| Urban vitality index | UV | Grid’s average urban vitality value | |
| Built environment data | |||
| Normalized difference vegetation index | NDVI [38] | - | Grid’s average NDVI value |
| Population density | PopD | is the total number of users. | |
| Building density | BD | . | |
| Road network density | RND | . | |
| Land-use diversity | LUD | in the region of the grid to which it belongs. | |
| Functional utilization diversity | FUD | is the percentage of category j functional area types in the region of the grid to which they belong. | |
| Point of road connectivity | PRC | . | |
| Plot ratio | PR | The gross floor area above ground of each building in the grid is denoted by . | |
| The distance to the closest metro station and bus stop | DBS | - | The separation between the grid halfway and the nearest bus stop and subway station. |
| The distance to the closest park | DG | - | The distance between the middle of the grid and the nearest park. |
| Business density | DD | is the total area occupied by financial facilities in the grid. | |
| Socioeconomic data | |||
| Average house price | AHP | - | Average house price in the grid. |
Disclaimer/Publisher’s Note: The statements, opinions and data contained in all publications are solely those of the individual author(s) and contributor(s) and not of MDPI and/or the editor(s). MDPI and/or the editor(s) disclaim responsibility for any injury to people or property resulting from any ideas, methods, instructions or products referred to in the content. |
© 2025 by the authors. Licensee MDPI, Basel, Switzerland. This article is an open access article distributed under the terms and conditions of the Creative Commons Attribution (CC BY) license (https://creativecommons.org/licenses/by/4.0/).
Share and Cite
Li, D.; Han, H.; Wang, J.; Xiao, X. Explaining Urban Vitality Through Interpretable Machine Learning: A Big Data Approach Using Street View Images and Environmental Factors. Sustainability 2025, 17, 4926. https://doi.org/10.3390/su17114926
Li D, Han H, Wang J, Xiao X. Explaining Urban Vitality Through Interpretable Machine Learning: A Big Data Approach Using Street View Images and Environmental Factors. Sustainability. 2025; 17(11):4926. https://doi.org/10.3390/su17114926
Chicago/Turabian StyleLi, Dong, Houzeng Han, Jian Wang, and Xingxing Xiao. 2025. "Explaining Urban Vitality Through Interpretable Machine Learning: A Big Data Approach Using Street View Images and Environmental Factors" Sustainability 17, no. 11: 4926. https://doi.org/10.3390/su17114926
APA StyleLi, D., Han, H., Wang, J., & Xiao, X. (2025). Explaining Urban Vitality Through Interpretable Machine Learning: A Big Data Approach Using Street View Images and Environmental Factors. Sustainability, 17(11), 4926. https://doi.org/10.3390/su17114926