Abstract
A thorough understanding of the consequences of urbanization can be significantly advanced by examining urban environmental dynamics at high spatial and temporal resolutions. This study evaluates eco-environmental quality and investigates the underlying drivers of urban greening within the functional units of Haikou, a tropical coastal city located on Hainan Island, China, using advanced techniques from Landsat and Google Earth imagery. Ecological index and land use change analyses were conducted using Landsat 5 (TM) imagery for 2010 and Landsat 8 (OLI) imagery for 2020. In addition, Google Earth imagery was used to interpret the driving factors influencing urban functional units (UFUs) in 2010 and 2020. Spatial and temporal environmental changes were quantitatively assessed. Multi-spectral Landsat 8 data at a 30 m resolution were used to construct a remote sensing ecological index (RSEI) to assess Haikou’s ecological condition. Land use impacts on eco-environmental quality were evaluated through RSEI values from 2010 to 2020, showing that eco-environmental quality improved over time, revealing a gradual improvement over time. Land use across 190 UFUs from 2010 to 2020 was categorized into five types: trees and shrubs, herbs, built-up areas, sandy lands, and water bodies. The primary drivers of greening percentage in each UFU were identified as housing prices, maintenance duration, and construction age. The most significant changes in land cover type were observed in the herb areas. Similarly, maintenance duration emerged as the most influential factor driving changes in urban green space (UGS). In conclusion, this study offers valuable insights for future urban planning and improvements in eco-environmental quality in Haikou, Hainan Island, China.
1. Introduction
Over the past few decades, remote sensing data have been widely used to assess eco-environmental quality, with factors derived from these datasets playing a central factor. In recent decades, eco-environmental quality has emerged as a critical metric for evaluating regional environmental governance and development planning [1]. Variations in eco-environmental quality are closely associated with rapid transformations in land use, land cover, urban structures, and socioeconomic dynamics [2,3,4]. Urban ecological dynamics are intrinsically linked to human activities, drawing considerable research attention to current trends in urban eco-environmental quality [5]. Urban eco-environmental quality is intricately linked to social behavior and human activity patterns. Consequently, spatial and temporal variations across different urban functional units (UFUs) can be systematically quantified and compared [6]. Urban green spaces (UGSs) are vital to both ecological sustainability and the social fabric of cities [4].
Prior research on urban development practices has primarily concentrated on UGS [6,7]. Over the next 20 years, China’s urban population is projected to account for approximately 80% of the national total [8]. To optimize the allocation of urban development resources, research into eco-environmental quality, land use, and land cover has emerged as a critical research priority [9]. Urban green space provides vital ecosystem services to city residents, and its functions evolve in tandem with urban expansion [10]. Aesthetically, UGS encourages outdoor activity, thereby reducing the prevalence of obesity and chronic diseases [11,12,13]. UGS is distributed across parks, streets, residential neighborhoods, waterways, schools, and other urban settings, with residential zones offering considerable potential for further greening [14,15]. In recent years, cities around the world have launched large-scale initiatives to expand tree canopy coverage. For example, major cities in the United States (e.g., Los Angeles, Washington) and China (e.g., Beijing, Shanghai) have committed to planting one million trees [16,17]. Land cover describes the biophysical features of the Earth’s surface (e.g., vegetation, water bodies, bare soil), whereas land use refers to human activities and purposes assigned to land parcels (e.g., residential areas, infrastructure, agricultural use) [18].
The structural composition of UGS is a critical determinant of its ability to deliver ecosystem services, such as enhancing agricultural productivity and preventing soil erosion [19]. Urban ecology places a strong emphasis on examining the relationship between UGS structure and land use, housing markets, demographic trends, and other socioeconomic drivers under urbanization processes. This approach is essential for deepening our understanding of the spatial–temporal dynamics and long-term evolution of urban eco-environmental quality [20]. Urban green space plays a central role in enhancing the quality of life and physical well-being of urban residents. It reduces noise pollution, mitigates dust, and alleviates the urban heat island effect, while simultaneously enhancing urban spatial aesthetics and cultural values [21]. Several studies suggest that urban green space is closely associated with various socioeconomic indicators [22]. For instance, in Phoenix, Arizona, a study revealed a direct correlation between wealth and plant coverage, indicating that high-priced housing is often associated with increased plant coverage, implying that areas with higher income levels tend to exhibit greater vegetation [23]. In Baltimore, Maryland, researchers explored the interplay among vegetation cover, housing prices, population density, and socioeconomic status, concluding that private landowner lifestyles significantly influence local vegetation patterns [24]. Research has also revealed strong correlations between socioeconomic variables and urban ecological characteristics across diverse UFU types (e.g., universities, parks, and residential areas), highlighting their interdependence within the urban ecosystem [25].
Two prevailing hypotheses have been proposed to explain the distribution of UGS. The first is the luxury effect (e.g., maintenance time, housing price), which suggests that affluent neighborhoods possess more space and resources to invest in vegetation coverage. The second is the legacy effect (e.g., population density, construction age), which posits that older developments tend to retain vegetation due to the longevity of perennial species and their ecological legacies. Coastal and inland cities demonstrate distinct urban development patterns and ecological driving mechanisms. For example, Beijing has expanded radially from a central axis, whereas Shanghai has developed across the Huangpu River, forming an extensive economic corridor [26,27]. Similarly, Haikou holds a strategically significant location in the development of China’s free trade port initiative [28]. Supported by the transit of natural goods, Haikou’s free trade port functions as a central hub for the “Belt and Road” initiative and serves as the core city of Hainan’s emerging free trade zone [29]. Few studies have examined how eco-environmental quality, land use change, housing prices, infrastructure, and demographic factors interact within the urban context of Haikou. However, limited research has explored the interrelationships among ecological, land cover, and socioeconomic factors in tropical coastal urban ecosystems [28,29]. Studies focusing on UGS and parkland often overlook marginal green spaces in cities, including those found in residential areas, hospitals, and industrial zones [30,31].
Another important research gap lies in understanding how land use patterns influence environmental indices in tropical coastal cities of China. Understanding the dynamics of urban green space and eco-environmental quality is essential for the strategic planning of sustainable urban green infrastructure. The remote sensing ecological index (RSEI) integrates vegetation, moisture, land surface temperature, and built-up indices using principal component analysis (PCA) [32]. A total of 190 UFUs were randomly selected in Haikou, Hainan Island, and SPOT satellite imagery from 2010 was used to extract land use and land cover data [33].
Recent advances in remote sensing technologies, including Unmanned Aerial Systems (UAS), LiDAR, and high-resolution satellite imagery, have significantly improved the monitoring of urban green structure and vegetation health. UAS provide centimeter-level spatial resolution and flexible deployment options that are particularly useful for fine-scale vegetation analysis in complex urban environments. For example, vegetation vertical structure and canopy characteristics can be accurately captured using drone-based multispectral or hyperspectral sensors, which complement traditional satellite-based approaches. The integration of UAS-derived data enhances the interpretation of ecological indicators such as NDVI or RSEI by providing finer granularity and reducing classification uncertainty [34].
To assess changes in Haikou’s eco-environmental quality, this study was designed with the following objectives: (1) to quantify the ecological changes within individual UFUs; (2) to examine variations in eco-environmental quality and land use across UFUs; (3) to identify the key factors influencing UGS dynamics within these units.
2. Materials and Methods
Study area: Haikou, situated at the southernmost tip of China (E110°10′~1110°41′, N19°32′~20°05′, is recognized as the largest island city in the nation (Figure 1). UGS comprises 40.3% of Haikou’s area, with per capita parkland reaching approximately 12.1 m2 in 2020. In comparison to the parkland per capita in 2010 (10.91 m2/cap) and 2000 (10.91 m2/cap), this represents a significant increase. The study area encompasses approximately 3145.93 km2 and is home to a population of 2,046,189 as per the sixth population census (http://www.haikou.gov.cn/, accessed on 15 January 2020). We chose this area as it is an integral part of the overall urban development plan for Haikou and represents a typical urban landscape [35]. Haikou city was delineated with the Qiongzhou Strait forming the northern boundary, the Haikou Ring Expressway marking the southern limit, the Nandu River to the east, and Huoshankou Road defining the western edge.
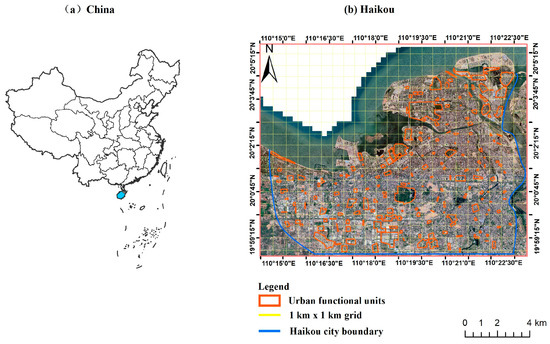
Figure 1.
A map of China showing the location of (a) Haikou city, and (b) the 190 urban functional units surveyed within the study area, as indicated by red boundaries. We used ArcGIS 10.8 software to generate the map in this figure. The base-map data are sourced from Landsat 8. Below are the software details and the map source link (https://landsat.gsfc.nasa.gov/satellites/landsat-8/, accessed on 25 January 2020). The blue area in (a) represents the geographical location of Haikou City in Hainan Province, China.
Sampling: A grid-based stratified random sampling method was employed to classify UFUs in Haikou. Each 1 × 1 km grid cell was treated as a sampling unit, within which one UFU was randomly selected to ensure spatial dispersion and avoid repetition. UFU types were recorded in advance to maintain a balanced representation across categories. Approximately 190 grid units were sampled, covering all urbanized areas of Haikou, including both the central urban core and peripheral zones, to capture the full heterogeneity of the city’s landscape. This method ensured consistent and comprehensive coverage of all UFU types. A cloud-free Google Earth image of Haikou, with a spatial resolution of 10 m and captured in May 2020, was used to assist in accurate UFU identification (Figure 1, Table 1).

Table 1.
Haikou is divided into 190 urban functional units of five primary and 16 secondary types.
Image data and preprocessing: Haikou is located within WRS2 paths/rows (124/046) of Landsat 8 images. From the USGS Earth Resources Observation and Science (EROS) Data Center (earthexplorer.usgs.gov), we obtained two surface reflectance higher-level data products: the Landsat Thematic Mapper (TM) and Operational Land Imager (OLI) imagery at a 30 m spatial resolution (Table 2). Due to the low-density cloud cover in Haikou, images acquired between January and June in both 2010 and 2020 were used to compute the urban RSEI. Image preprocessing included radiometric calibration, atmospheric correction, mosaicking, and cropping. The normalized difference vegetation index (NDVI), normalized difference built-up and soil index (NDBSI), wetness component of the tasseled cap transformation (WET), and land surface temperature (LST) were calculated based on Landsat TM/OLI imagery using Equations (1)–(9) [36]. These values were used to map land use patterns and for urban RSEI assessment.
where ρBLUE, ρGREEN, ρRED, ρNIR, ρSWIRI1, and ρSWIRI2 are the surface reflectance values of the blue (0.45–0.52 μm/0.45–0.51 μm), green (0.52–0.60 μm/0.53–0.59 μm), red (0.63–0.69 μm/0.64–0.67 μm), near infrared (0.76–0.90 μm/0.85–0.88 μm), shortwave infrared one (1.55–1.75 μm/1.57–1.65 μm), and shortwave infrared two (2.08–2.35 μm/2.11–2.29 μm) spectral bands of Landsat TM/OLI imagery, respectively [36].
Table 2.
Summary of the Landsat images used in this study.
Land cover classification and interpretation: A decision tree model was utilized to classify land use types by optimizing the classification accuracy through the separation and refinement of key ecological factors. The model incorporated the normalized difference vegetation index (NDVI), wetness component (WET), land surface temperature (LST), and normalized difference built-up and soil index (NDBSI). The classification rules were defined as follows: areas with NDVI values less than 0 were categorized as water, while areas with NDBSI values less than 0.39 were identified as bare soil or buildings. Areas where NDVI values exceeded 0.66 were classified as tree and shrub areas, and those with NDVI values between 0.5 and 0.66 were categorized as herb areas. This systematic approach enabled more accurate land use classification by ensuring consistent ecological factor thresholds.
Socioeconomic variables in each urban functional unit: We selected urban functional unit (UFU) type, building age, housing price, and greening percentage as the key characteristics for each UFU for several reasons: (1) accurate data for these four factors were readily available; (2) UFU type serves as a representative indicator of land use type; (3) there is an established relationship between the construction period and land use types; and (4) a known correlation exists between housing price and greening percentage. Building age, defined as the length of time since the UFU was developed, was calculated for both 2010 and 2020 by subtracting the year of establishment. For instance, if a UFU was established in 2000, its construction ages would be 10 and 20 years for 2010 and 2020, respectively. The date of establishment for each UFU was determined using one or more of the following methods: (1) referencing the official UFU website, (2) consulting with the UFU administrator, or (3) analyzing past aerial photographs compiled from Google Earth. Housing price data were sourced from Anjuke (https://haikou.anjuke.com) with query dates of December 2010 and July 2020. For non-residential UFUs, the average housing price of the nearest residential area was assigned. Maintenance time was collected through field investigations, while population density was estimated by multiplying the number of aboveground buildings by the number of households. All singular data were filtered and removed to ensure accuracy.
Data analysis: Using SPSS 22 statistical software, we selected Duncan’s multiple comparison test to investigate differences in tree and shrub areas, herb areas, water areas, built-up areas, and sandy areas within 190 UFUs. Correlation analyses were conducted using the greening percentage and the maintenance time, construction age, or housing price. We used p-values to select significant predictors for further analysis. We used generalized linear models (GLMs) to analyze which factors influenced greening percentage. All predictive variables were log-transformed to achieve normalization. Simple linear regression models (LMs) were used to test the influence of a single predictor on the response variables.
3. Results
Spatiotemporal changes in land use in Haikou: The land use types in Haikou exhibit distinct spatial structural characteristics, primarily categorized into water bodies, trees and shrubs, sandy areas, built-up land, and herbaceous vegetation (Figure 2). From 2010 to 2020, significant changes in the land use status of Haikou’s central urban area can be observed, particularly in the context of four primary land cover types: trees and shrubs, herbaceous vegetation, built-up and sandy areas, and water bodies. Notably, built-up land has seen the most substantial expansion. Green space and construction land have increased steadily over the years, while the area of water bodies has remained largely constant.
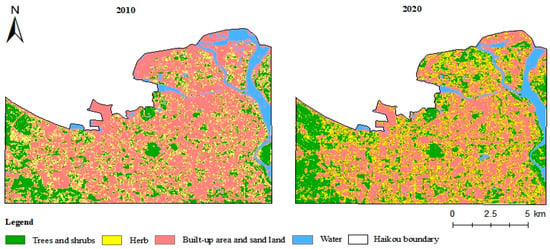
Figure 2.
Spatial distribution of land use in Haikou in 2010 and 2020. The map was created using ArcGIS (version 10.8, Esri, Redlands, CA, USA, https://www.esri.com).
Land use types and their relationship with ecological factors: The ecological factors contributing to the remote sensing ecological index (RSEI) include the normalized difference vegetation index (NDVI), the normalized difference built-up soil index (NDBSI), the wetness (WET) index, and the land surface temperature (LST) (Figure 3). Higher NDVI values reflect improved habitat quality and increased vegetation coverage. A decrease in LST and NDBSI values indicates an improvement in eco-environmental quality (Figure 4). Collectively, these four indicators show that the RSEI has improved from 2010 to 2020 (Figure 5).
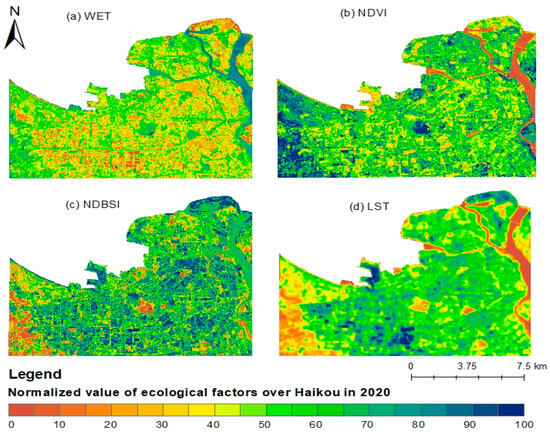
Figure 3.
Spatial distribution and temporal changes of normalized ecological factors over Haikou Island. (a) Wetness component of the tasseled cap transformation, WET; (b) normalized difference vegetation index, NDVI; (c) normalized difference built-up and soil index, NDBSI; and (d) land surface temperature, LST. The map was created using ArcGIS (version 10.8, Esri, Redlands, CA, USA, https://www.esri.com).
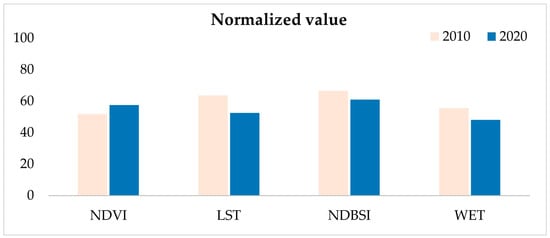
Figure 4.
The average values of all ecological factors in 2010 and 2020. The range of all ecological factors is normalized from 0 to 100.
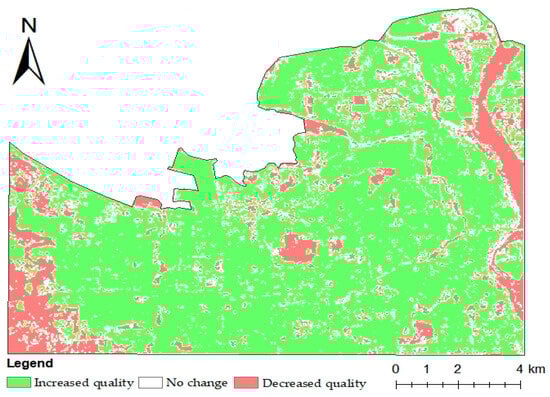
Figure 5.
Remote sensing ecological index (RSEI) change from 2010 to 2020. The map was created using ArcGIS (version 10.8, Esri, Redlands, CA, USA, https://www.esri.com).
Land cover in different secondary urban functional units from 2010 to 2020: Areas of Wetland were excluded from the study, as they are subject to significant human development and may change dramatically in a short time. Compare the 2020 figure with the 2010 figure of Zhu [37]. Parks had the largest tree and shrub area in 2010 and 2020. The area covered by trees and shrubs was lower in 2020 (23.08 c ± 25.12 ha) than in 2010 (28.03 ± 33.04 ha) but was significantly higher than the other secondary UFUs overall. The herb area increased in 2020 compared with 2010. Parks had the largest water area in 2010 (3.27 c ± 7.98 ha), whereas no water areas were found within bus parking areas, hotels, main/secondary roads, primary/middle schools, research institutes, or supermarkets. In 2020, colleges/universities had the largest water area (2.9 c ± 7.2 ha), whereas no water areas were found within bus parking areas, industrial offices, or supermarkets. The most densely constructed areas were low-density residential areas in both 2010 (22.68 ± 10.43 ha) and 2020 (23.96 b ± 12.92 ha). The least built-up areas were research institutes in both 2010 (0.39 ± 0.50 ha) and 2020 (0.46 a ± 0.23 ha). The difference in sandy area between 2010 and 2020 was not significant (Table 3).
Table 3.
The average land cover (e.g., trees and shrubs area, herb area, water area, built-up area, and sandy area) in each urban functional unit in 2020 (areas in hectares). “a, ab, b, c, bc” indicate statistical significance between groups: groups with the same letter are not significantly different, groups with different letters are significantly different, and mixed letters (e.g., ab) are not significantly different from either group.
Relationships between urban greening percentage and driving forces within each UFU: The greening percentage and maintenance time showed a positive correlation in residential districts, public affairs service districts, and recreation and leisure districts. In contrast, a negative correlation was observed in transportation and industry and business districts (Figure 6).
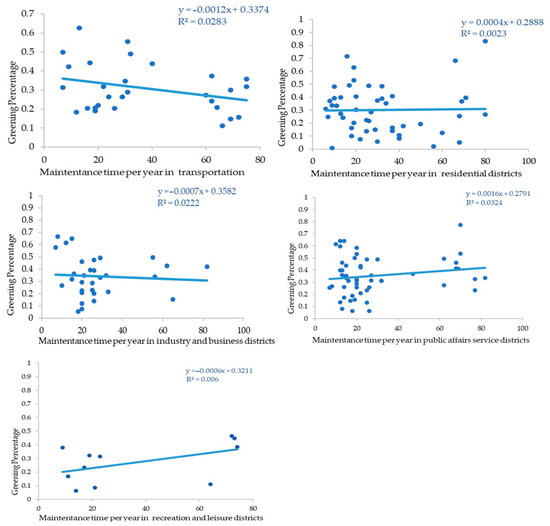
Figure 6.
Linear correlations between greening percentage and maintenance time in transportation areas, residential districts, industry and business districts, public affairs service districts, and recreation and leisure districts.
The greening percentage and housing prices were positively correlated across several district types, including transportation, residential, industry and business, public affairs service, and recreation and leisure (Figure 7).
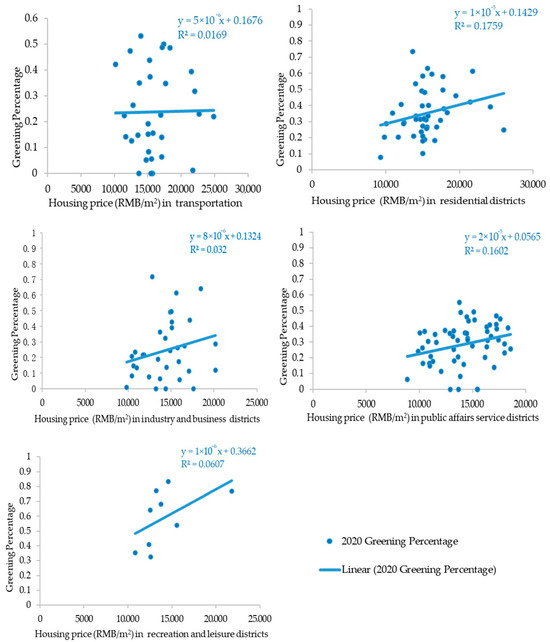
Figure 7.
Linear correlations between greening percentage and housing price in transportation areas, residential districts, industry and business districts, public affairs service districts, and recreation and leisure districts.
The relationship between greening percentage and construction age varied across district types. In public affairs service districts and industry and business districts, there was a positive association, meaning that older constructions tended to have a higher greening percentage. Conversely, a negative association was observed in transportation, residential, and recreation and leisure districts, where newer constructions were associated with more green spaces (Figure 8).
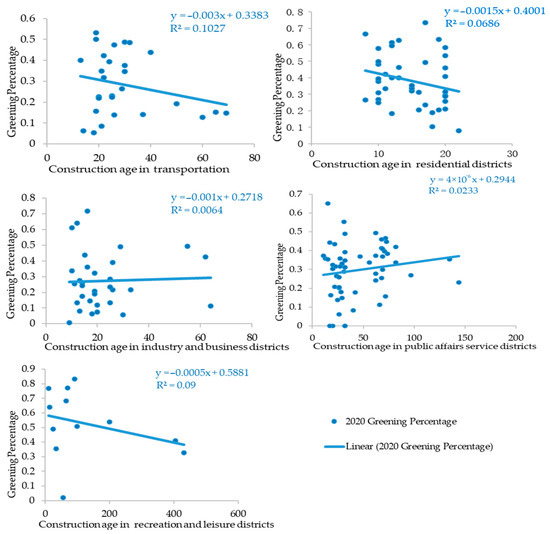
Figure 8.
Linear correlations between greening percentage and construction age in transportation areas, residential districts, industry and business districts, public affairs service districts, and recreation and leisure districts.
The greening percentage and population density exhibited different trends across various district types. In residential districts, recreation and leisure districts, and public affairs service districts, a positive association was observed, indicating that higher population densities in these areas are linked to increased greening efforts. On the other hand, a negative association was found in transportation and industry and business districts, where higher population densities corresponded to lower greening percentages (Figure 9).
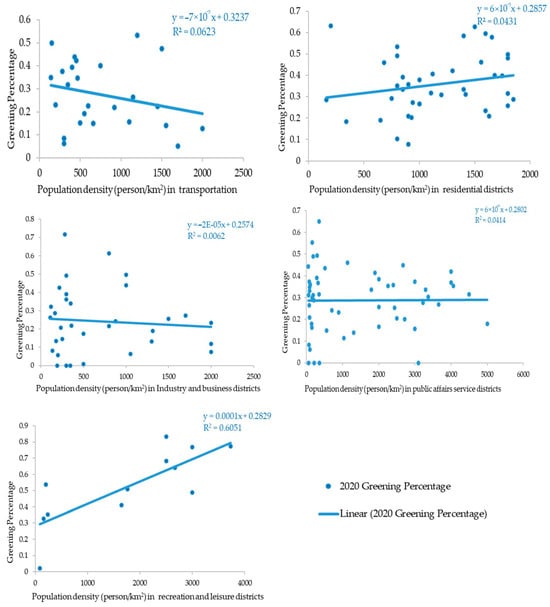
Figure 9.
Linear correlations between greening percentage and population density in transportation areas, residential districts, industry and business districts, public affairs service districts, and recreation and leisure districts.
The driving factors of urban land cover change in Haikou city in 2020: The generalized linear model (GLM) included maintenance time, housing price, and construction age as key factors influencing greening percentage across various districts. The analysis identified significant correlations within specific districts. In public affairs and residential districts, the greening percentage was correlated with maintenance time, while in residential districts, it was also correlated with housing price. Additionally, in transport areas, industrial and commercial districts, and residential districts, the greening percentage was linked to construction age. Although greening percentage and maintenance time were correlated with housing price and construction age across all UFUs, these correlations were not statistically significant. The GLM analysis, evaluated using the Akaike information criterion (AIC), demonstrated the model’s reliability. Maintenance time was the most significant factor impacting greening percentage, but the R2 value was notably low, indicating that the model had limited explanatory power. Despite the significant impact of maintenance time on greening percentage across all UFUs, the strength of this correlation was weak (Table 4).
Table 4.
Relationships between greening percentage and underlying factors based on generalized linear models (GLMs); nm = not in the model. For each predictor, the estimated coefficient was provided: * p < 0.05, p < 0.1.
4. Discussion
Changes in land use and eco-environmental quality from 2010 to 2020: Land reclamation and natural processes contributed significantly to land use changes in Haikou between 2010 to 2020. Extensive areas previously covered by sandy beaches, water bodies, and unused land were converted into built-up zones and green spaces in northeastern Haikou. In recent years, Haikou has actively developed the Dongzhai Port area, constructing supporting infrastructure for the free trade port and reclaiming underutilized coastal land [15]. Moreover, population growth and the rising demand for housing have driven increased urban construction across the city. As demand for recreational and leisure spaces continues to rise, the expansion of green areas is expected to accelerate. Between 2010 and 2020, the increase in NDVI values in Haikou aligned with findings by Sun et al., who reported that human activities positively contribute to urban ecological development, particularly through the expansion of green spaces driven by recreational demand [38]. Our findings corroborate this trend, highlighting the influence of recreational demand on the expansion of urban green space (UGS). An ecological index was developed to evaluate the environmental impact of land use changes in Haikou between 2010 and 2020. To minimize confounding variables during the study period, the remote sensing ecological index (RSEI) was employed to assess urban eco-environmental quality. Sun et al. reported an improvement in the ecological index of Hainan Island, as evidenced by a steady increase in NDVI from 1990 to 2015 [38]. Our findings revealed that both NDVI and RSEI values improved in Haikou during the 2010–2020 period. NDVI, WET, LST, and NDBSI indices were utilized to comprehensively assess eco-environmental quality. Areas showing declines in RSEI were primarily affected by anthropogenic disturbances, including restoration and construction activities. RSEI improvements can be attributed to human interventions that converted abandoned beaches and barren land into parks, residential areas, and recreational spaces equipped with green infrastructure (Haikou Statistical Yearbook). In 2010, green space coverage in Haikou was 37.5%, increasing to 40.3% by 2020 [39]. These figures align with our findings, which indicate that green space within Haikou’s built-up areas increased during the 2010–2020 period. Moreover, RSEI outcomes provide a theoretical foundation for guiding economic development and optimizing resource allocation in Haikou.
Human activities have significantly disrupted global ecosystems, triggering widespread environmental concern. Timely monitoring of multiscale ecosystem dynamics in urban areas, along with early identification of ecological issues, has become a vital strategy for safeguarding urban environmental health [39]. Current Earth observation satellite systems provide extensive spatial coverage. The advantages—real-time, high-frequency, and repeated observation—have been widely applied in ecological studies, including the assessment of forests and grasslands, monitoring of river ecosystems, and observation of entire watersheds. In future research, remote sensing technology could be employed to monitor a broader range of ecological parameters and to further investigate RESI components in evaluating environmental quality changes.
Land cover changes within urban functional units from 2010 to 2020: Our findings reveal that parks exhibited the greatest coverage of trees and shrubs, whereas hotels displayed the least. This pattern reflects the fundamental function of park vegetation, which primarily serves purposes such as human engagement and the provision of shade. Conversely, trees in the vicinity of hotels are predominantly ornamental, designed to enhance aesthetic appeal while limiting vegetative coverage and minimizing maintenance and management. These results are consistent with those reported in a comparable study conducted in 2010 [15]. Moreover, all UFUs demonstrated varying levels of increase in herbaceous cover between 2010 and 2020. This trend likely stems from intensified human activity, especially the acceleration of socioeconomic development, which has amplified the demand for leisure and recreational spaces. For instance, in response to the growing demand for recreational spaces, grassland areas within parks and residential districts have expanded. The availability of natural public spaces in urban areas is essential for public health, and the increasing demand for recreational amenities raises concerns regarding the adequacy of urban green space (UGS) [40,41]. From 2010 to 2020, water-covered areas exhibited minimal variation, largely due to their confinement within UFUs such as park lakes and community swimming facilities. In 2020, Haikou exhibited the highest concentration of built-up land within low-density residential areas, particularly in urban villages lacking structured long-term development plans. These regions are often characterized by insufficient green infrastructure and a consistently high demand for additional urban greenery. The distribution of urban green space (UGS) is influenced by a range of socioeconomic factors, including local income levels, social activity rates, and housing market dynamics, thus informing the need for expanded UGS development and management [42].
Drivers of urban greening percentage in Haikou: The development of urban green spaces (UGSs) is substantially shaped by patterns of social activity. In this context, the proportion of green space within a city may be conceptualized as a subsystem driven by human social behavior. The configuration of these activities exerts a direct influence on UGS availability. In Haikou, variables such as maintenance duration, building age, population density, and housing price significantly contribute to determining UGS. Urban environments consist of diverse urban functional unit (UFU) types, each differing spatially in size, morphology, configuration, and socioeconomic functionality [42]. Greening percentage was found to correlate with maintenance duration, highlighting broader trends in social development. Quantitative analysis elucidates the mechanisms underlying land use transformations throughout the evolution of urban functionality. In high-density residential sectors, greening interventions are limited, whereas private residential zones demonstrate significantly elevated greening levels. The analytical hierarchy process (AHP) was utilized to identify primary drivers of vegetation coverage, revealing socioeconomic variables as pivotal determinants. During urbanization, residents’ maintenance efforts substantially influence urban vegetation management. The findings of this study support the luxury effect hypothesis, which posits that increased maintenance frequency and elevated housing prices are positively associated with greater green space availability. A correlation was identified between various UFU types and greening percentage, with key variables including housing price, maintenance duration, building age, and population density. Greening percentage exhibited a positive correlation across all UFU categories, with building age specifically correlating positively within recreation, leisure, and public service zones. Socioeconomic factors were found to shape overall greening management strategies in Haikou [43,44,45].
Implications: The broader implications of this research transcend the specific context of Haikou, providing critical insights into sustainable urban planning, environmental governance, and the complex interplay between social dynamics and ecological systems. Several salient implications emerge from this investigation.
Urban Planning and Sustainable Development: This study underscores the critical importance of incorporating green infrastructure into urban planning strategies amid ongoing urban expansion. It emphasizes the role of urban green spaces (UGSs) in enhancing ecological integrity and improving the overall quality of urban life. For rapidly urbanizing cities, particularly those in developing regions, the findings advocate for proactive planning and the preservation of green infrastructure as essential measures for achieving sustainable urban development. This aligns with international sustainability frameworks, notably the United Nations’ Sustainable Development Goals (SDG 11), which promote the development of inclusive, safe, resilient, and sustainable cities.
Policy Development for UGS: The observed correlation between greening percentage and socioeconomic variables—including housing prices, maintenance duration, and building age—highlights the necessity for targeted policy interventions. Urban areas may benefit from policy frameworks that incentivize private stakeholders—such as landowners and developers—to integrate green infrastructure into new developments, particularly in densely populated regions with limited green space. Furthermore, the study advocates for prioritizing equitable access to green spaces in urban planning to ensure that all residents, regardless of socioeconomic background, can benefit from the ecological and health-related advantages associated with urban green spaces (UGSs).
Health and Well-being: This study reinforces the expanding body of literature highlighting the beneficial impacts of green spaces on public health, particularly by facilitating recreational opportunities that foster physical activity, psychological well-being, and social cohesion. With increasing urban density and stress levels, urban green spaces (UGSs) serve a pivotal function in mitigating these pressures by providing accessible natural settings for rest and recreation. This underscores the imperative for urban planners and policymakers to prioritize green infrastructure as an essential element of urban health systems.
Climate Resilience and Environmental Management: This research carries significant implications for enhancing urban climate resilience. By elucidating the relationship between urban green spaces (UGSs) and environmental quality, this study reinforces the notion that green spaces function not merely as aesthetic elements but as critical infrastructure for addressing climate-related challenges, such as the urban heat island effect, air pollution, and stormwater regulation. The findings indicate that urban areas must strategically invest in green infrastructure to bolster climate adaptability and sustain ecological equilibrium.
Social Equity in Urban Environments: The findings of this study underscore socioeconomic disparities in green space accessibility, particularly with respect to housing prices and residential zoning. These disparities carry substantial implications for advancing social equity within urban settings. Policymakers must address these inequalities by ensuring that low-income populations and densely populated areas are equitably allocated green infrastructure. Such measures can help bridge the environmental benefit gap across socioeconomic strata and support the implementation of a more inclusive urban development framework.
Global Relevance and Transferability: Although centered on Haikou, this study’s findings hold global relevance for cities confronting comparable challenges related to urbanization, environmental degradation, and increasing demands for green space. This research advances the global discourse on sustainable urban development by offering a replicable framework for balancing economic growth with environmental sustainability in urban contexts. It further underscores the importance of international collaboration in disseminating best practices for the development and governance of urban green spaces (UGSs).
5. Conclusions
This study explored the relationships between urban green space (UGS) and key socioeconomic drivers—namely, maintenance time, housing price, construction age, and population density—in the context of Haikou, China. While some correlations were found to be statistically significant, the explanatory power of the models remained generally low, as indicated by the relatively small R2 values. This suggests that although these factors exhibit directional trends, they can only partially account for the variability in greening percentage across different UFUs. Among the influencing factors, maintenance time showed the strongest and most consistent association with UGS, lending support to the luxury effect hypothesis, which posits that affluence and frequent maintenance promote green space. However, evidence for the legacy effect—which links older developments to persistent vegetation—was weak or unclear in Haikou’s urban setting. Furthermore, although UFUs with higher housing prices and longer maintenance durations tended to have greater green space coverage, these associations were relatively weak and should be interpreted cautiously. Despite these limitations, this study highlights valuable tendencies in how social and economic variables influence urban ecological outcomes. These insights can inform policymakers and urban planners, particularly in tropical coastal cities, in designing more equitable and efficient strategies for green space allocation. To strengthen future analyses, it is recommended to incorporate additional socioeconomic indicators and apply more advanced modeling approaches, such as non-linear or spatially explicit models. Comparative studies across various regions of Hainan Island may also reveal broader mechanisms shaping UGS distribution.
Moreover, this study utilized Landsat imagery at a 30 m resolution, which is appropriate for city-wide ecological assessments. However, future research could benefit from the integration of higher spatial resolution data sources—such as Sentinel-2, PlanetScope, or UAV-based remote sensing—to better capture the fine-scale heterogeneity of vegetation across small UFUs. In particular, LiDAR and drone-derived data offer the potential to assess vegetation structure in greater detail, including metrics like tree height, canopy volume, and understory composition. These technologies are especially useful for identifying marginal green spaces often overlooked in medium-resolution imagery. Leveraging such high-resolution platforms would allow for a more nuanced understanding of urban ecological quality and support targeted, data-driven greening interventions.
Author Contributions
Conceptualization, W.W., M.A., H.-L.Z., M.M.N. and Y.W.; methodology, W.W., M.A. and H.-L.Z.; validation, W.W., M.A., Y.W. and F.M.; formal analysis, H.-L.Z., M.M.N. and H.X.; investigation, W.W. and H.-L.Z.; resources, W.W.; data curation, W.W., M.A. and F.M.; writing—original draft preparation, W.W., H.-L.Z., M.A. and Y.W.; writing—review and editing, W.W., H.-L.Z., M.M.N., M.A. and Y.W.; visualization, W.W., H.-L.Z., M.A. and H.X.; supervision, M.M.N., H.-L.Z. and Z.Z.; project administration, W.W. and M.A.; funding acquisition, H.-L.Z. and M.M.N. All authors have read and agreed to the published version of the manuscript.
Funding
This work was supported by the Qingdao Postdoctoral Application Research Project (NO. QDBSH20240201028). This work was also supported by the Taishan Youth Scholar Program of Shandong Province (NO. tsqn202103059).
Institutional Review Board Statement
Not applicable.
Informed Consent Statement
Not applicable.
Data Availability Statement
The datasets used and analyzed during the current study are available from the corresponding author on reasonable request.
Acknowledgments
We express our sincere gratitude to the following individuals and institutions: Wei Wang, Muhammad Awais and Mir Muhammad Nizamani for their contributions to data collection and processing; Fanxin Meng and Yichao Wang for their technical support; and Hui Xue, Hai-Li Zhang, and Zongshan Zhao for their funding and material contributions. These contributions greatly facilitated the progress of this research.
Conflicts of Interest
The authors declare no conflicts of interest.
Abbreviations
The following abbreviations are used in this manuscript:
| UFU | urban functional unit |
| UGS | urban green space |
| RSEI | remote sensing ecological index |
| EROS | Earth Resources Observation and Science |
| TM | Thematic Mapper |
| OLI | Operational Land Imager |
| RSEI | sensing ecological index |
| EROS | Earth Resources Observation and Science |
| NDVI | normalized difference vegetation index |
| NDBSI | normalized difference built-up and soil index |
| LST | land surface temperature |
| WET | wetness component of the tasseled cap transformation |
| GLM | generalized linear model |
| AIC | Akaike information criterion |
| AHP | analytical hierarchy process |
| SDG 11 | Sustainable Development Goals |
| LM | linear regression model |
References
- Dahlkvist, E.; Hartig, T.; Nilsson, A.; Hogberg, H.; Skovdahl, K.; Engstrom, M. Garden greenery and the health of older people in residential care facilities: A multi-level cross-sectional study. J. Adv. Nurs. 2016, 72, 2065–2076. [Google Scholar] [CrossRef] [PubMed]
- Gascon, M.; Triguero-Mas, M.; Martinez, D.; Dadvand, P.; Rojas-Rueda, D.; Plasencia, A.; Nieuwenhuijsen, M.J. Residential green spaces and mortality: A systematic review. Environ. Int. 2016, 86, 60–67. [Google Scholar] [CrossRef] [PubMed]
- Jenerette, G.D.; Harlan, S.L.; Buyantuev, A.; Stefanov, W.L.; Declet-Barreto, J.; Ruddell, B.L.; Myint, S.W.; Kaplan, S.; Li, X. Micro-scale urban surface temperatures are related to land-cover features and residential heat related health impacts in Phoenix, AZ USA. Landsc. Ecol. 2016, 31, 745–760. [Google Scholar] [CrossRef]
- Larson, K.L.; Hoffman, J.; Ripplinger, J. Legacy effects and landscape choicesin a desert city. Landsc. Urban Plan. 2017, 165, 22–29. [Google Scholar] [CrossRef]
- Villeneuve, P.J.; Jerrett, M.; Su, J.G.; Weichenthal, S.; Sandler, D.P. Association of residential greenness with obesity and physical activity in a US cohort of women. Environ. Res. 2018, 160, 372–384. [Google Scholar] [CrossRef]
- Zhang, H.L.; Cubino, J.P.; Nizamani, M.M.; Harris, A.J.; Cheng, X.L.; Da, L.; Wang, H.F. Wealth and land use drive the distribution of urban green space in the tropical coastal city of Haikou, China. Urban For. Urban Green. 2022, 71, 127554. [Google Scholar] [CrossRef]
- Zhang, H.L.; Nizamani, M.M.; Cubino, J.P.; Harris, A.J.; Guo, L.Y.; Zhou, J.J.; Wang, H.F. Habitat heterogeneity explains cultivated and spontaneous plant richness in Haikou City, China. Ecol. Indic. 2023, 154, 110713. [Google Scholar] [CrossRef]
- Lin, B.; Meyers, J.; Barnett, G. Understanding the potential loss and inequities of green space distribution with urban densification. Urban Urban Green 2015, 14, 952–958. [Google Scholar] [CrossRef]
- Li, F.; Wang, R.; Zhao, D. Urban Ecological Infrastructure based on ecosystem services: Status, problems and perspectives. Acta Ecol. Sin. 2014, 34, 190–200. [Google Scholar] [CrossRef][Green Version]
- Pincetl, S. Implementing municipal tree planting: Los Angeles million-tree initiative. Env. Manag. 2010, 45, 227–238. [Google Scholar] [CrossRef]
- Wang, M.L. Research and development of urban forestry. Sci. Silvae Sin. 1995, 5, 460–466. [Google Scholar]
- Cai, C.J. Research on urban Forest development in Yangzhou. Chin. Acad. For. 2004, 5, 2–10. [Google Scholar] [CrossRef]
- Gounaridis, D.; Newell, J.P.; Goodspeed, R. The impact of urban sprawl on forest landscapes in Southeast Michigan, 1985–2015. Landsc. Ecol. 2020, 3, 1975–1993. [Google Scholar] [CrossRef]
- Luan, W.F.; Li, X. Rapid urbanization and its driving mechanism in the Pan-Third Pole region. Sci. Total Environ. 2020, 750, 141270. [Google Scholar] [CrossRef]
- Zhu, Z.X.; Pei, H.Q.; Schamp, B.S.; Qiu, J.X.; Cai, G.Y.; Cheng, X.L.; Wang, H.F. Land cover and plant diversity in tropical coastal urban Haikou, China. Urban Urban Green 2019, 44, 126395. [Google Scholar] [CrossRef]
- United Nations. World Population Prospects 2019: Highlights.ST/ESA/SER.A/423; United Nations, Department of Econimic and Social Affairs, Population Division: New York, NY, USA, 2019. [Google Scholar]
- Amici, V.; Rocchini, D.; Filibeck, G.; Bacaro, G.; Santi, E.; Geri, F.; Landi, S.; Scoppola, A.; Chiarucci, A. Landscape structure effects on forest plant diversity at local scale: Exploring the role of spatial extent. Ecol. Complex. 2015, 21, 44–52. [Google Scholar] [CrossRef]
- Wang, H.F.; Cheng, X.L.; Nizamani, M.M.; Balfour, K.; Da, L.J.; Zhu, Z.X.; Qureshi, S. An Integrated approach to study spatial patterns and drivers of land cover within urban functional units: A multi-city comparative study in China. Remote Sens. 2020, 12, 2201. [Google Scholar] [CrossRef]
- Peng, J.; Liu, Q.; Blaschke, T. Integrating land development size, pattern, and density to identify urban–rural fringe in a metropolitan region. Landsc. Ecol. 2020, 35, 2045–2059. [Google Scholar] [CrossRef]
- Clarke, L.W.; Jenerette, G.D.; Davila, A. The luxury of vegetation and the legacy of tree biodiversity in Los Angeles, CA. Landsc. Urban Plan. 2013, 116, 48–59. [Google Scholar] [CrossRef]
- Cavender-Bares, J.; Cubino, J.P.; Pearse, W.D.; Hobbie, S.E.; Lange, A.J.; Knapp, S.; Nelson, K.C. Horticultural availability and homeowner preferences drive plant diversity and composition in urban yards. Ecol. Appl. 2020, 30, e02082. [Google Scholar] [CrossRef]
- Wang, H.F.; Qureshi, S.; Qureshi, B.A.; Qiu, J.X.; Friedman, C.R.; Breuste, J.; Wang, X.K. A multivariate analysis integrating ecological, socioeconomic and physical characteristics to investigate urban forest cover and plant diversity in Beijing, China. Ecol. Indic. 2016, 60, 921–929. [Google Scholar] [CrossRef]
- Wang, H.F.; Qiu, J.X.; Breuste, J. Variations of urban greenness across urban structural units in Beijing, China. Urban Urban Green 2013, 12, 554–561. [Google Scholar] [CrossRef]
- Wang, H.F.; López-Pujol, J. Urban green spaces and plant diversity at different spatial–temporal scales: A case study from Beijing, China. Collect. Bot. 2015, 34, e008. [Google Scholar] [CrossRef][Green Version]
- Hope, D.; Gries, C.; Zhu, W.; Fagan, W.F.; Redman, C.L.; Grimm, N.B.; Nelson, A.L.; Martin, C.; Kinzig, A. Socioeconomics drive urban plant diversity. Proc. Natl. Acad. Sci. USA 2003, 100, 8788. [Google Scholar] [CrossRef]
- Grove, J.M.; Troy, A.R.; O’Neil-Dunne, J.P.M.; Burch Jr, W.R.; Cadenasso, M.L.; Pickett, S.T.A. Characterization of households and its implications for the vegetation of urban ecosystems. Ecosystems 2006, 9, 578–597. [Google Scholar] [CrossRef]
- Cheng, X.L.; Yuan, L.X.; Nizamani, M.M.; Zhu, Z.X.; Friedman, C.R.; Wang, H.F. Taxonomic and phylogenetic diversity of vascular plants at Ma’anling volcano urban park in tropical Haikou, China: Reponses to soil properties. PLoS ONE 2018, 13, e0198517. [Google Scholar] [CrossRef]
- Meng, X.L. Big Beijing Rim: Double-ring-palm Network Development Mode under Impact of Wave-core. China Dev. 2008, 8, 106–113. [Google Scholar] [CrossRef]
- Li, J.F.; Liang, M.G.; Jiao, J.F. The industrial development pattern and spatial distribution characteristics in the cross-river development of Shanghai. Econ. Geol. 2013. [Google Scholar] [CrossRef]
- Fu, Y.Q.; Li, Y. Development of “China Tourism Special Zone” in Hainan Province for Responding to “One Belt and One Road” Initiative. Singap. J. Trop. Geogr. 2015, 35, 646–654. [Google Scholar] [CrossRef]
- Hamylton, S.M.; Morris, R.H.; Carvalho, R.C. Evaluating techniques for mapping island vegetation from unmanned aerial vehicle (UAV) images: Pixel classification, visual interpretation and machine learning approaches. Int. J. Appl. Earth Obs. Geoinf. 2020, 89, 10205. [Google Scholar] [CrossRef]
- Chen, X.; Zhou, W.Q.; Pickett, S.T.A.; Li, W.F.; Han, L.J. Spatial-Temporal Variations of Water Quality and Its Relationship to Land Use and Land Cover in Beijing, China. Int. J. Environ. Res. Public Health 2016, 13, 449. [Google Scholar] [CrossRef] [PubMed]
- Nizamani, M.M.; Harris, A.J.; Cheng, X.L.; Zhu, Z.X.; Jim, C.Y.; Wang, H.F. Positive relationships among aboveground biomass, tree species diversity, and urban greening management in tropical coastal city of Haikou. Ecol. Evol. 2021, 11, 12204–12219. [Google Scholar] [CrossRef] [PubMed]
- Kašpar, V.; Zapletal, M.; Samec, P.; Komárek, J.; Bílek, J.; Juráň, S. Unmanned aerial systems for modelling air pollution removal by urban greenery. Urban For. Urban Green. 2022, 78, 127757. [Google Scholar] [CrossRef]
- Wang, J.; Zhou, W.Q.; Wang, J.; Yu, W.J. Spatial distribution of urban green space in response to urban Development from a multi-scale perspective. Environ. Res. Lett. 2020, 15, 064031. [Google Scholar] [CrossRef]
- Sun, C.G.; Lin, T.; Zhao, Q.J.; Li, X.H.; Ye, H.; Zhang, G.Q.; Liu, X.F.; Zhao, Y. Spatial pattern of urban green spaces in a long-term compact urbanization process—A case study in China. Ecol. Indic. 2017, 96, 111–119. [Google Scholar] [CrossRef]
- Xu, H.Q. A remote sensing urban ecological index and its application. Acta Ecol. Sin. 2013, 33, 7853–7862. [Google Scholar] [CrossRef]
- Din, D.J.; Liao, B.W.; Guan, W.; Xiong, Y.M.; Li, M.; Cheng, Y.J. Evaluation of ecosystem Service value of coastal Wetland in Dongzhai Harbor Mangrove Nature Reserve. J. Environ. Sci. 2016, 9, 182–190. [Google Scholar] [CrossRef]
- Sun, R.; Wu, Z.; Chen, B.; Yang, C.; Qi, D.; Lan, G.; Fraedrich, K. Effects of land-use change on eco-environmental quality in Hainan Island, China. Ecol. Indic. 2020, 109, 105777. [Google Scholar] [CrossRef]
- HGPC, Haikou Government Portal of China. 2010 Statistical Bulletin of Haikou National Economy and Social Development. 2014. Available online: https://ggzy.haikou.gov.cn/ (accessed on 17 February 2011).
- Shen, H.F.; Huang, L.W.; Zhang, L.P.; Wu, P.H.; Zeng, C. Long-term and fine-scale satellite monitoring of the urban heat island effect by the fusion of multi-temporal and multi-sensor remote sensed data: A 26-year case study of the city of Wuhan in China. Remote Sens. Environ. 2016, 172, 109–125. [Google Scholar] [CrossRef]
- Kim, Y.; Newman, G.; Burak, G. A review of driving factors, scenarios, and topics in urban land change models. Land 2020, 9, 246. [Google Scholar] [CrossRef]
- Wellmann, T.; Schug, F.; Haase, D.; Pflugmacher, D.; Linden, S.V.D. Green growth? On the relation between population density, land use and vegetation cover fractions in a city using a 30-years Landsat time series. Landsc. Urban Plan. 2020, 202, 103857. [Google Scholar] [CrossRef]
- Zhang, Z.; Li, N.; Wang, X.; Liu, F.; Yang, L. A comparative study of urban expansion in Beijing, Tianjin and Tangshan from the 1970s to 2013. Remote Sens. 2016, 49, 496. [Google Scholar] [CrossRef]
- Richards, D.R.; Passy, P.; Oh, R.R. Impacts of Population Density and Wealth on the Quantity and Structure of Urban Green Space in Tropical Southeast Asia. Landsc. Urban Plan. 2017, 157, 553–560. [Google Scholar] [CrossRef]
Disclaimer/Publisher’s Note: The statements, opinions and data contained in all publications are solely those of the individual author(s) and contributor(s) and not of MDPI and/or the editor(s). MDPI and/or the editor(s) disclaim responsibility for any injury to people or property resulting from any ideas, methods, instructions or products referred to in the content. |
© 2025 by the authors. Licensee MDPI, Basel, Switzerland. This article is an open access article distributed under the terms and conditions of the Creative Commons Attribution (CC BY) license (https://creativecommons.org/licenses/by/4.0/).