Abstract
The objective of this study is to explore the cold chain system in a metropolitan area, focusing on the overall system cost encompassing both distribution centers and transportation. The research delves into the planning of urban cold chain systems, considering fluctuating minimum customer demands, the traffic conditions of potential new centers, and the variability in carbon-trading prices. To manage the complexity of these objectives and inherent uncertainties, we introduce a flexible chance-constrained programming model for the cold chain system (FCCP-CCS). An FCCP-CCS programming model is developed to address the multifaceted goals and various uncertainties. The effectiveness of this model is validated through experimental analysis using real-world data from a major city’s cold chain system. The findings of this study reveal several key insights: (1) The levels of confidence and satisfaction significantly impact system optimization, with higher levels leading to increased consumption. (2) Customer demand variations would determine the transportation and the potential new centers in the system. (3) The surroundings of a distribution center partly indicate its service quality. (4) Governmental adjustments in carbon-trading prices can effectively enhance the overall sustainability of the urban cold chain system. This research highlights the importance of optimization in designing and managing urban cold chain systems, particularly in environmental sustainability.
1. Introduction
Over the past few decades, China’s economy has maintained sustained and rapid development to be the largest consumer in the world, as the purchasing power parity data show. China accounts for more than half of all e-commerce transactions, making it the largest market in the world [1]. On the other hand, Chinese people pay more attention to the health-related industry compared with past years. As the rules and standards for the cold chain become clearer, the sector for cold chain logistics in China will significantly advance due to the recent explosion in fresh food e-commerce. The country’s fresh food retail industry (online and offline) will increase to CNY 6.8 trillion (USD 1.05 trillion) in 2025, according to the China Fresh Food E-commerce Industry Research Report [2,3].
Although the cold chain industry has been studied widely and has made considerable progress in China, there still exists a notable gap and substantial room for improvement when compared to cold chain technologies in Western countries. By the end of 2021, the cold chain rate in developed countries reached around 85%, while it was only 19% in China [4]. The proportion of pre-cooled fruits and vegetables is only 10% in China [5]. The existing disparity can be primarily attributed to two factors: the insufficient cold chain infrastructure and the imbalanced distribution of cold distribution centers.
The increasing severity of global greenhouse gas emissions has sparked a surge in the popularity of green projects and low-carbon development initiatives [4,6]. At the 2015 Climate Change Conference in Paris, the Chinese government committed to reducing its CO2 emissions per unit of GDP by 60–65% from the 2005 level by 2030 [7]. Green, low-carbon and sustainable development has been clarified as the national goal of the following stages [8]. The cold chain, one of the most critical sectors in the national economy, consumes a significant amount of energy and generates a substantial volume of carbon dioxide emissions. Lowering greenhouse gas emissions is contingent upon the optimization of distribution centers and transportation in the system. Therefore, the positioning of the new cold distribution centers with considering relevant transportation will be discussed in this paper.
2. Literature Review
2.1. Competitive Logistics System
In recent years, there has been a growing focus among academics on the positioning of competitive centers in an effort to increase the market share of the logistic system [9]. According to the leader–follower competitive location model, each facility would attempt to draw customers within a ‘sphere of influence’ based on the idea of coverage [10]. A practical bi-level nonlinear programming algorithm is proposed to maximize the market share and predict the followers’ response at the same time, which is also a competitive facility-siting problem considering probabilistic behavior [11]. A new model is developed to maximize the profit, which has relations with the amount of market share and the total tax paid to the government, etc. [12]. Moreover, the flexibility in supplying products and the service of the facility are also both taken into consideration in the attractiveness function. Since the customer’s choice behavior is heterogeneous, the customers are classified into three types based on which the location and quality of facilities are determined to maximize the profit of the logistic chain [13]. In order to maximize market share, the facilities’ location of a 353-node network in Santiago is thought to benefit from comparison shopping behavior [14].
Numerous studies are exploring various aspects of logistic centers, including the attractiveness, the risk of interference and the constraints (e.g., capacity limitations) [15]. A multi-objective optimizing model is put forward to maximize the attraction of facilities and minimize the distance from customs to service centers by optimizing the location of logistic facilities [16]. The seaport site-selection problem involves many requirements and uncertain conditions, and an integrated multi-criteria decision-making model consisting of AHP and ARAS-F is proposed to seek the resolution [17]. Considering the disruption risk, a competitive facility-location model is established in [18]. To solve the problem of locating dry ports in an intermodal network, a mathematical programming model, which is based on a two-level weighted graph, is given for multiple hub locations with capacity constraints [19]. A multiple assignment (MA) model is used to design a logistic system considering the fleet size and the location of hubs, and aims to minimize the total cost for a whole system [20].
2.2. Low-Carbon Distribution Centers
Environmental considerations have consistently been a top priority, with many scholars actively involved in planning the siting of logistic centers while taking carbon emissions into account [21,22]. Under a low-carbon background, a four-tier reverse logistic network model is constructed, which includes collection and remanufacturing centers [23]. A three-echelon supply network is modeled to minimize the logistic cost and carbon emissions, with the associated constraints of capacity, transportation and carbon emission [24]. In cold chain logistic systems, the location-routing problem is a significant problem to be solved. An integrated LRIP model which considers the carbon-transaction mechanism has been proposed to optimize the cost associated with location and carbon transaction [25]. For the reverse logistic network, a mixed integer linear programming algorithm is designed to integrate the facility location and operational decision while accounting for the carbon emissions from the whole system [26]. A comparative analysis of carbon emissions is proposed for consumer shopping behavior such as transport mode and trip [27]. To overcome the challenge of reducing carbon emissions and improving customer satisfaction in cold chain logistic systems, a multi-objective mixed-integer linear programming is presented by considering penalty cost [28]. For supply chain network design, the emission and fixed and variable location costs are both considered in the objective function. Then, Lagrangian relaxation is used to solve the model [29]. By integrating the environmental, economic and social aspects, a new hybrid fuzzy multiple-criteria decision-making algorithm is presented for selecting the locations of joint distribution centers in the modern urban logistic system [30]. In a regional logistic network, logistic infrastructure selection and transportation subsidies are incorporated together to achieve the specific CO2 emission target [31].
2.3. Research Gaps and Contributions
Despite increasing research attention to cold chain system optimization, several critical research gaps in cold chain optimization remain unaddressed. First, most existing studies treat cold chain parameters as deterministic, failing to adequately capture the inherent uncertainties in urban logistics environments. Second, studies that do incorporate uncertainty typically focus on a single source of variability rather than addressing multiple concurrent uncertainties. Third, the unique challenges of rapidly developing urban environments, particularly in emerging economies like China, remain insufficiently explored.
This paper develops a novel flexible chance-constrained programming model for cold chain carbon-constrained systems. The proposed approach simultaneously considers multiple sources of uncertainty including demand fluctuations, traffic conditions and carbon-trading price variability. Furthermore, our model incorporates traffic-congestion effects through time-varying coefficients that capture the dynamic nature of urban transportation environments. By applying this model to Beijing’s metropolitan cold chain system, we quantify the relationship between carbon pricing mechanisms and system configuration, identifying threshold values where pricing drives structural changes in the cold chain network. The findings provide empirically grounded insights not only for Beijing but also for similar rapidly growing metropolitan areas facing comparable challenges.
3. Mathematical Formulation of FCCP-CCS
3.1. Flexible Chanced Constraints Programming (FCCP) Model
This paper uses a possibilistic programming-based model to solve the optimal problem of the distribution centers considering relevant transportation. Possibilistic programming is widely used in logistic systems to deal with optimization problems under uncertainties [32]. The compact form of the possibilistic programming can be stated as the following objectives while meeting the constraints:
In our cold chain system, the vectors f, c and d could correspond to the fixed opening cost of distribution centers, the variable transportation and customer cost, and the customer demand, respectively. The notations A, N and S are in the form of matrices and are constrained coefficients. Vector y is a binary variable that denotes whether a center is built, and vector x is a continuous parameter used for related elements.
For the cold chain distribution center problem, the parameters f, c, d and N representing the distribution center’s capacity are imprecise and inconstant. Thus, classic possibilistic programming cannot solve the problem due to the flexible targets and constraints. This paper introduced flexible programming technology into classic possibilistic programming to form a flexible possibilistic program (FPP) model, which could handle the imprecise parameters [33]. The FPP model can be given as follows:
where the original deterministic constraints are modified to fuzzy constraints; and are satisfactory indices to obtain an objective function’s minimum value. and are the fuzzy numbers that take violation to constraints of the model. This paper uses the triangular possibility distributions in the model, and the variable parameters are represented with the three prominent numbers [34]. Thus, and can represent the triangular fuzzy numbers, and the FPP model could handle optimization with uncertainties effectively. Even though uncertainties exist in the cold chain distribution center-siting-optimization problem, it often follows probability distributions. This reminds us of chance constraints programming (CCP) [35,36]. The CCP model could handle the constraints which are described as probabilistic distribution. Combining CCP and FPP, the flexible programming model with chanced constraints (FCCP) could be formulated as follows.
Assume that the above formulation would satisfy the constraints with a degree of confidence greater than 0.5, where ‘Pr’ means ‘probability’; and represent the degree of confidence embraced by the uncertainties in the system.
3.2. The Proposed FCCP-CCS Model
3.2.1. Symbol Description
In Beijing, the local currency used is CNY (Chinese Yuan). To facilitate better understanding for international readers, the currency has been converted to USD (United States Dollar). The conversion rate is based on the currency converter provided by Google: 1 USD = 7.28 CNY. Additionally, the precise definitions of parameters and variables are listed below.
- : the customers.
- : the existing cold chain distribution centers.
- : the new candidate cold chain distribution centers.
- : the maximum values of customers, existing centers and candidate centers, respectively.
- : the hours in a day and .
- : the three types of carbon emission, including CH4, CO and CO2.
- : the capacity of existing distribution center j (ton).
- : the carbon emission reduction of the distribution center j (ton).
- : the unit cost for building a new distribution center (USD/ton).
- : the emission factor of CH4, CO2 and CO during transportation, respectively.
- : the carbon emission of per unit volume (ton/ton).
- : the unit transportation cost (USD/ton · km).
- : the unit operating cost for a distribution center (USD/ton).
- : the unit cost for carbon emission trading (USD/ton).
- : the rent cost per unit area (USD/m2);
- : the civil construction cost per unit area (USD/m2);
- : the driving distance between existing distribution center j and customer i at time t (km).
- : the driving distance between a new candidate distribution center k and customer i at time t (km).
- : the congestion coefficient at time t.
- : the goods’ price center j sell to customer i.
- : the minimal demand for customer i one day (ton).
- : the extra cost of improved design features for new distribution center k.
- : the capacity of new candidate distribution center k (ton).
- : the demand which customer i obtains from existing distribution center j (ton).
- : the demand which customer i obtains from new candidate distribution center k (ton).
- : 0–1 variable for new distribution center k.
3.2.2. The FCCP-CCS Model
There are many complex processes that should be taken into account in a cold chain system (CCS), including the location and size of distribution centers, transportation cost, carbon emissions and customer demand. The presence of these ambiguous processes can indeed impact decision-making strategies, adding complexity and unpredictability to the equation. On the basis of the suggested FCCP algorithm, an FCCP-CCS model could be created to enhance the Beijing cold chain logistic system (as shown in Figure 1). The objective of this model is to select the location and size of new distribution centers in a manner that minimizes system costs while simultaneously accounting for carbon emission policies.
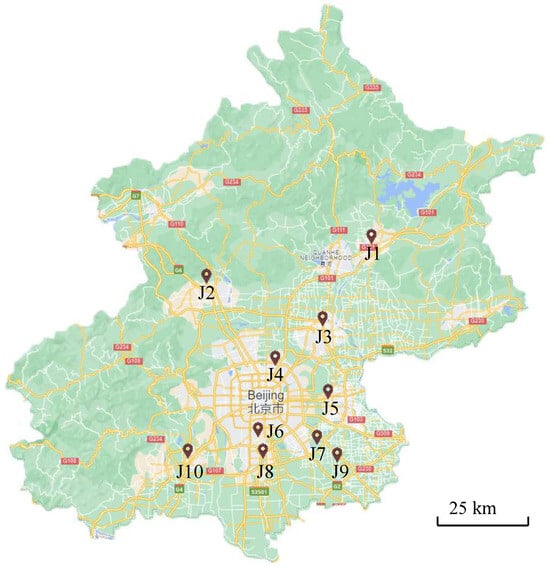
Figure 1.
Current cold chain distribution centers in Beijing.
The social cost for the whole system consists of the transportation cost, the construction cost for new distribution centers, the operating cost of existing and new centers, the carbon-trading cost and customer cost. Therefore, the mathematical model could be described as follows:
(1) The transportation cost in the cold chain system . The transportation cost is usually related to the quantity of demand and the driving distance from distribution centers to customers in the system. The driving distance is related to the physical space and the traffic conditions at different times, such as rush hours. The driving distance , where indicates the congestion coefficient at time t and means the physical distance. Thus, the transportation cost can be:
(2) The construction cost for the new distribution centers . This mainly includes equipment purchase, land rent and civil construction costs:
where denotes the rate of discount; n indicates the working life of the distribution center; is the area size of distribution center k (m2); is the improved design feature r () of new distribution center k. means the improvement level of center k.
(3) The operating cost of existing and new centers . This consists of the labor and maintenance cost of equipment in the distribution centers.
(4) The carbon emission cost . This is mainly related to the dynamic carbon emission (i.e., transportation processes; here, we do not consider truck no-load on the return trip) and the static carbon emission (i.e., cold storage warehouse). Thus, the emission cost could be calculated using an equation that takes into account emission factors and the corresponding financial subsidies.
where and represent the carbon emission reduction of centers j and k. In Beijing, enterprises that have emissions lower than the carbon quota set by the government are eligible to receive subsidies. Consequently, many enterprises are motivated to employ various techniques to reduce emissions.
(5) The risk cost of customers . This reflects the distribution centers’ impact on the customer in the system. Several factors influence the selection of distribution centers by customers, such as service design, distance, price, etc. To formulate the objective for the customer, we follow the extensive literature in [37], and produce the form of the attractiveness of center j to customer i as follows:
where is defined as the service quality of center j; and are weights. Assume there are R features such as price, facility size, good types, surrounding traffic, etc., which can be quantitative. Moreover, for center j, represents the basic design, and stands for the improvement level on feature r. Thus, the service quality of center j is defined by:
The parameters and , which indicate the weight of each part, are available from a priori knowledge. R means the maximum number of features. Specifically, a descent function , with , decides the risk degree undertaken by customer i if he purchases goods from distribution center j.
Following [37], the exponential form of attractiveness is formulated as the risk degree of goods shortage, damaged or lost:
where is a coefficient; it is evident that the risk degree undertaken by the customer would decrease along with the service quality of the distribution center. Thus, the associated objects for customers’ costs could be formulated as follows.
where is the risk cost of per unit goods undertaken by customers.
3.2.3. The Constraints
Planning new distribution centers in the logistic system should consider the constraints imposed by customers’ demand, the capacity limitation and the carbon emission policy. These limitations are described in detail.
(1) The building cost of new centers should not be more than the total investment budget .
(2) Customers’ demand: The sum of demands obtained from distribution centers (j or k) should be larger than or equal to the minimal demand of each customer i.
(3) Capacity constraint: the total volume from existing and new distribution centers should not be less than the needs of all customers in the system.
where and are the maximal volume of distribution centers .
(4) The distribution centers’ volume: The total volume assigned to customers by one distribution should not be larger than its maximal capacity.
(5) Carbon emission constraint: This formulation is to guarantee that the carbon emission in the process of transportation and storage should not exceed the policy permits.
(6) Non-negative constraint: It is essential to avoid infeasible solutions when we calculate the formulation. It is suggested that if , then ; if , then .
The values of I, J and K can be different in this article.
3.2.4. Methodology
In the FCCP-CCS model, the variables can be set as either continuous or binary, depending on the specific requirements of the problem. The model can then be solved using an improved particle swarm optimization (PSO) algorithm [38], as the pseudo code shown in Table 1. The optimized solution with various confidence degrees and satisfaction levels could be obtained by considering different and . The proposed model could be calculated as follows:
- (1)
- Under a certain satisfaction level and , calculate the FCCP-CCS model to seek a global solution using an improved PSO algorithm.
- (2)
- Calculate the FCCP-CCS algorithm under a certain confidence degree and and obtain a global solution by the improved PSO algorithm.
- (3)
- Repeat (2) and (3) with different , , and , and then we could achieve the results.
- (4)
- Provide the optimal solution for the decision-makers.

Table 1.
The pseudo code of improved PSO algorithm.
Table 1.
The pseudo code of improved PSO algorithm.
| Initialize population size, particles (, ) and coefficient variables (c, , ) |
| for t = 1: maximum generation |
| for i = 1: population size |
| (E is from Equation (4)) |
| end |
| for d = 1: dimension |
| if then |
| else if then |
| end |
| end |
| end |
Our FCCP-CCS approach offers several advantages over existing models. Firstly, traditional deterministic models cannot account for uncertainties in real-world logistics environments; however, our model incorporates these variations directly through probabilistic constraints. Secondly, unlike approaches that focus on single uncertainty factors, our model simultaneously addresses multiple uncertainties—namely, demand fluctuations, traffic conditions and carbon price variations.
Furthermore, our proposed FCCP framework balances robustness and efficiency better than conventional robust optimization methods. While robust optimization often leads to overly conservative and costly solutions due to its emphasis on worst-case scenarios, our approach allows for adjustable confidence levels and satisfaction degrees. This flexibility enables decision-makers to tailor the model according to their specific risk preferences, avoiding unnecessary conservatism while maintaining service reliability.
4. Case Study
4.1. The Beijing Cold Chain System
The growing demand for fresh foods in recent years has greatly influenced the design and planning of cold storage warehouses. In 2020, the total capacity of cold storage in China reached over 70 million tons. Increasing investment has been put into the construction of cold chain systems. In 2020, the average cold storage space per capita in China was 0.13 cubic meters, while it was 0.49, 0.32 and 0.28 in the US, Japan and South Korea. The demand for cold chain resources in china is mainly from eastern areas, especially the first-tier cities, such as Beijing and Shanghai. These cities usually suffer from warehouse explosions.
Beijing, as the capital city of China, has more than 21 million residents and has a huge cold storage demand in China. For simplification, the demand points in Beijing are centralized to be seventeen customers according to the mobile signaling, as shown in Figure 2. The cold chain capacity is 2 million tons, and the total storage is 3.5 million cubic meters. There are 91 cold chain companies and 3374 cold chain trucks in Beijing [39,40].
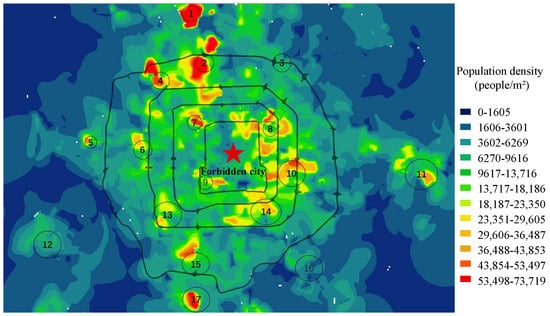
Figure 2.
Population density map of Beijing and the clustering result.
As shown in Table 2, only ten cold chain distribution centers are summarized, and their distances to demand points are shown in Table 3, resulting in a constant short lack and delivery delay in the Beijing cold chain market. Thus, the construction of four new cold chain centers (as shown in Table 4) has been placed on the agenda to meet the increasing demand in Beijing. As one of the most important infrastructures of the cold chain logistic, the optimized position of the distribution centers can significantly enhance the distribution coverage, improve delivery efficiency, reduce the total cost and improve customer satisfaction. Thus, it is essential to study the site selection and planning of cold chain distribution centers.
Table 2.
The current cold chain distribution centers.
Table 3.
Distances between current cold chain distribution centers and the demand centers (km).
Table 4.
The candidate cold chain distribution centers.
Several principles should be considered when selecting the logistic distribution center. (1) Achieving the lowest cost is the economic principle. The costs, which include construction, variable, transportation, operation and damage, when planning for new cold chain distribution centers, have a close coupling relation, e.g., the construction cost will decrease if fewer distribution centers are built. However, the transportation cost and damage costs will significantly increase. On the other hand, the price also relates to its position, scale, utility equipment, etc. (2) The distribution center should be able to meet the long-term demands of social development. Therefore, it is essential to consider not only the current market but also the social development and the resultant increasing demand.
To address significant obstacles that impede the development of cold chain system, the government has formulated the Development Plan of Cold Chain Logistics for the ‘14th Five-Year Plan’. By 2025, the cold chain network that links the origin and marketing would be conducted to meet the needs of economic and social development.
4.2. FCCP-CCS Model Assumption
The assumption of the proposed model is described as follows:
- The planning time is set to be one day. The daily planning framework is a fundamental unit that can be scaled to address seasonal variations through parameter adjustments.
- The planning of cold distribution centers is mainly from the theoretical side without considering the government’s policy and the current land conditions.
- The customers in the FCCP-CCS model are clustered to be seventeen points according to the mobile signaling (as shown in Figure 2).
- Road transportation is solely considered in the system, as our primary focus is on analyzing and optimizing the cold chain logistics in Beijing.
- All the distribution centers follow the standard of design and the percent of volume of refrigerated, chilled and deep freeze is 50%, 30% and 20%, respectively.
- The existing distribution centers cannot satisfy customer demand in the cold chain system, and it is necessary to plan a new distribution center.
- Each distribution center operates independently and has no interactive process. This reflects common practice in many cold chain systems where centers often function as separate business units. While some logistics systems benefit from coordination mechanisms, modeling independent operations provides a clear baseline for understanding core location and capacity decisions.
- We only consider the carbon emission of the transportation and cold storage processes in the cold chain logistic system.
Several scenario designs with different confidence and satisfactory degrees will be discussed. The optimal results based on different satisfaction and confidence levels can be realized with different , , and values. In the experiment, six satisfactory degrees with for soft constraints on violating demand from customers and confidence levels for embracing uncertainties with imprecise parameters are both discussed to tackle uncertainties in the objective function and constraints. Furthermore, all experiments in this article are implemented in Python 3.10. The running environment is a computing server with an Intel i9-13900K CPU and 64 GB of RAM, which is used for all of the calculations. The operating system was Microsoft Windows 10 Professional.
4.3. Model Implementation and Practical Constraints
The proposed FCCP-CCS approach offers a mathematical formulation for cold chain system optimization; however, practical implementation requires consideration of real-world challenges. Our assumption regarding cold storage facility standardization (50% refrigerated, 30% chilled, 20% deep freeze) reflects current industry averages but may require adjustment based on specific product mixes in different urban zones. Practical implementation would benefit from a modular design approach that allows facilities to adjust these proportions based on evolving demand patterns and product requirements.
The independence of distribution centers represents a simplification of increasingly interconnected logistics networks. Effective implementation would require developing coordination mechanisms, particularly for centers operated by the same company or located in proximity to each other, to capture potential synergies not addressed in the model. Finally, our one-day planning horizon provides the operational foundation for system design. However, it must be integrated into longer-term strategic planning frameworks that consider seasonality, infrastructure-development timelines and evolving urban development patterns to ensure sustained system efficiency.
5. Simulation Results and Discussion
5.1. System Cost
The system cost in this manuscript is all costs generated by every sector in the cold chain system. We assume that the capacity of distribution centers and transportation could meet all customers’ minimal demand, and then the different confidence levels and satisfactory degrees are discussed in Figure 3. The total system cost varies with various satisfactory degrees ( and ) and confidence levels ( and ) which can affect decision-makers’ preferences. The satisfactory level indicates the violation risk in cold chain logistic systems, such as the demand backlog, which is related to the robustness of the tradeoff between customers’ demand and distribution centers’ supply capacity. If the values of satisfactory level are greater, there would be lower violation risk for the system, leading to a higher system cost. Moreover, the confidence degree is associated with the probability of satisfying the soft constraints, which would also affect the system planning. Higher confidence degree values mean the constraints in the system are more easily met, and the system cost increases along with the confidence degree values certainly. In conclusion, higher satisfactory () and confidence levels () require higher system consumption (USD 282,719 per day), while lower consumption (USD 269,555 per day) is required in the reverse case.
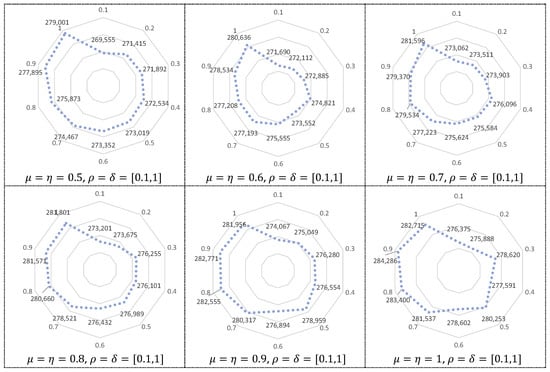
Figure 3.
The system cost (USD) under different satisfactory ( & ) and confidence levels ( & ).
5.2. The Demand’s Impact on Transportation and Centers
The minimal demand for each customer can be assumed to be as in Table 5. The need of each customer is different and they have uneven geographical distributions, which has a big influence on the transportation of the system. With the development of e-commerce and logistics, the demand for maintaining the quality and freshness of these perishable products is expected to increase gradually. The increase ranges of 5%, 10%, 15%, 20%, 25% and 30% are discussed based on the current minimal demand of each customer. Its impacts on the associated terms in the objective are also analyzed in Table 6 and Figure 4a.
Table 5.
The information of 17 centralized customers in Beijing.
Table 6.
Analysis of the impact of minimum demand.
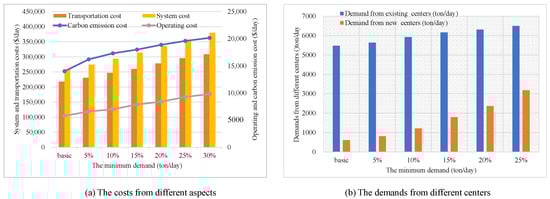
Figure 4.
The impact of the minimum demands.
As the minimal customer demand in the cold chain system increases, it is expected that the system cost and carbon emissions would also increase steadily. Additionally, the growth of minimal demand can also impact traffic costs and the trend of traffic cost growth may vary at different stages of demand growth. When the growth rate ranges from the fundamental market to 5%, 10% to 15% and 25% to 30%, the growth rates of transportation costs are low, which may be caused by the construction of new centers at these stages. If a new center is not constructed, it is likely that more traffic would be dispatched with the increase in demand, which means the traffic cost will increase accordingly (for example, the demand growth rate from 5% to 10%). The operating expenses are also increasing in response to the minimum demand and are affected by the new center construction. If the number of centers is the same and only the capacity is increased, the growth rate of the operation cost is not significant; otherwise, the operating cost increases hugely. In conclusion, the equilibrium relationship between transportation and new distribution centers due to the increased demand should be considered carefully.
The demands from existing and new centers also differ with various customers’ minimal demands, as shown in Figure 4b. Since the maximum capacity of the current centers is about 6500 tons/day, the requirements of different centers vary with the increase in demand. When the growth of the minimum markets is less than 20%, the existing centers can satisfy the system’s demands and thus the construction of candidate centers could benefit the transportation cost. The orders from existing centers reach their capacity when the growth of the minimum requirements is greater than 25%, and thus four centers need to be constructed to meet the demand. Furthermore, if there are more requirements, new candidate centers should be considered. The optimal planning of distribution centers is significant for society’s cost and customer satisfaction.
5.3. Service Quality vs. Traffic Distance
The service quality of the distribution center, also defined as an attractive component in some studies in the literature, dramatically influences the customer’s experience. Suppose there are five potential design features () for the new distribution centers: the number of goods’ type, the state of infrastructure, the surrounding traffic, facility size and support facilities. Assume that the parameter of the basic design is the same for all the distribution centers, for . The following values for the parameters are initially set as , , . is related to the risk degree for customers, and determine sensitivity to transportation distance and service price, controls the sensitivity of the improved designs relative to the basic ones.
The sensitivities of the location decisions to the values of parameters , , and are provided in Figure 5, where one parameter varies while keeping the three others. The following observations can be obtained:
- When the risk degree is highly concerned ( is small), the more improved facility outperforms the others because the customers’ experience is very sensitive to the facility design. On the other hand, when is big, the centers with basic design are optimal—the improvements of the design cannot drive as much additional business as its service quality.
- As the distance sensitivity grows, the value customers place on a nearby distribution center increases and thus the attractiveness of that center would decrease, which is a very natural result. The same applies to price sensitivity .
- When the design sensitivity is high, the distribution center with more improvement performs better than others with less improvement, which is intuitive. The facility term will increase with the design sensitivity parameters, counteracting the influence of considerable distance and price.
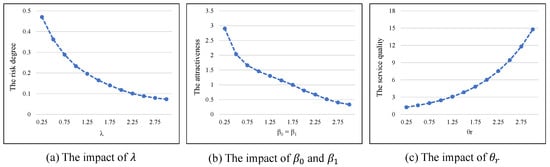
Figure 5.
Sensitivity to the parameters.
5.4. The Carbon-Trading Price
Assume that the minimal demands of current customers are 110% of current needs, and the introductory carbon emission-trading price is 40 USD/ton. This part will consider the impact of carbon-trading prices on relevant variables.
As shown in Table 7 and Figure 6, the social system cost will increase rapidly along with the carbon-trading price when the price is lower than 160 USD/ton. The maximum system cost reaches nearly 378,066 USD/day. Conversely, when the carbon-trading price is equal to or exceeds 200 USD/ton, additional distribution centers are established, leading to less traffic need to obtain the same capacity. The reduction in transportation distance causes a slight decrease in social cost consequently.
Table 7.
Carbon-trading price influence.
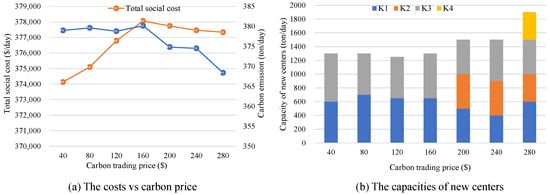
Figure 6.
The impact of carbon trading price.
The carbon emission fluctuates within a certain range as the carbon price increases, which is primarily due to slight variations in distribution center capacities. Notably, the emission decreases within the price range of [200, 280] USD/ton, which may be caused by the increased number of distribution centers and the subsequent reduction in transportation distance. In conclusion, the carbon-trading price significantly impacts the transportation distance, and thus the carbon emission and system cost of the overall logistics system.
Furthermore, the capacities of distribution centers exhibit corresponding changes in relation to the carbon price, influencing the balance between carbon emissions in transportation and the cold storage capacities of the centers, as depicted in Figure 6b. When the carbon-trading price is below 160 USD/ton, only two new centers (K1 and K3) are established, and their capacities undergo minor adjustments. During this stage, the proportion of cold storage remains relatively stable. As the carbon-trading price increases, transportation costs rise, necessitating the construction of additional centers to mitigate these expenses. This is evident from the establishment of centers K2 and K3 when the carbon price exceeds 200 USD/ton.
In conclusion, the carbon-trading price plays a significant role in the planning of distribution centers and the relevant transportation cost. The government can utilize carbon pricing as a means to optimize the system accordingly.
5.5. Sustainability Analysis
5.5.1. Sustainability and Economic Performance Analysis
The FCCP-CCS model effectively bridges theoretical sustainability frameworks with operational economic metrics, enabling practical decision-making for metropolitan cold chain systems. The model’s objective function components (E1–E5) transform sustainability goals into quantifiable measures, with the carbon emission cost (E4) critical in monetizing environmental impacts through carbon-trading mechanisms. Model parameters, including confidence levels ( and ) and satisfaction degrees ( and ), serve as practical tools for decision-makers to balance environmental aspirations with operational constraints, as evidenced by the system cost variations shown in Figure 3.
The empirical results from our case study validate the model’s effectiveness across multiple dimensions. Customer demand analysis (Table 6) demonstrates the model’s capability to optimize network configuration under varying market conditions, while service quality parameter sensitivity (Figure 5) shows how theoretical service concepts translate to measurable metrics. Most significantly, our carbon price sensitivity analysis (Table 7) reveals how specific price thresholds (160–200 USD/ton) can trigger structural changes in distribution center configurations, providing valuable insights for policymakers. At prices below 160 USD/ton, the system maintains fewer distribution centers with longer transportation routes, while prices above 200 USD/ton incentivize additional centers that reduce overall transportation distances and associated emissions.
5.5.2. The Impact of Traffic Congestion
In addition to carbon pricing, metropolitan traffic congestion represents another critical factor influencing system performance. To comprehensively assess model robustness, we conducted sensitivity analysis on traffic congestion coefficients (), which directly impact transportation efficiency in urban environments. Table 8 illustrates how system configuration responds to variations in these coefficients.
Table 8.
Sensitivity analysis of traffic congestion coefficients.
The results demonstrate that congestion coefficients significantly influence system configuration. With lower congestion (−30%), the model favors a more centralized system with fewer distribution centers and longer transportation distances. Conversely, with higher congestion (+30%), the system becomes highly distributed with five centers, reducing transportation distances by approximately 10% despite a 16.6% increase in total cost. At higher congestion levels, the model recommends adding distribution centers to minimize transportation through congested areas, with the threshold for adding additional centers occurring around +20% congestion.
6. Insight of Decision-Makers
With the rapid development of urbanization, the existing cold chain system is unable to meet the growing demand of customers. Therefore, the planning of a new cold chain system becomes significantly important. Due to various factors, the existing distribution centers are primarily located near the main urban area of Beijing, with many of them positioned within the fifth ring road, which leads to long traffic distance for many customers. However, when planning new distribution centers, it is expected that they will be located farther away from the urban center due to the limited availability of land and higher rental costs. Additionally, environmental considerations have become increasingly important in the planning of new distribution centers and transportation during the actual construction phase. Therefore, this study provides several suggestions for decision-makers, which are as follows:
- The development level of the local area is an important factor to consider when planning the system, which is related to the cost and rate of return.
- The subsidies of new centers, including the support facilities, surrounding transportation, etc., should be considered, which can improve the centers’ attraction. On the other hand, the surroundings also require more construction costs, leading to a bigger operational risk. Thus, the centers’ attraction and surroundings should maintain equilibrium.
- The carbon-trading market for the cold chain system should be improved along with the relevant policies and measurements. Moreover, the government can adjust carbon-trading prices appropriately to prevent abnormal fluctuation.
7. Conclusions
This paper aims to research Beijing’s cold chain system based on the overall system cost of centers and transportation. The carbon emission-trading policy is also considered. For planning, the urban cold chain system, the influence of the varying minimal demands from customers, the transportation cost, the service quality of new candidate centers and the carbon-trading price have been discussed in the manuscript. An FCCP-CCS programming model is proposed to solve the complex objective and a series of uncertainties. An experimental analysis is conducted on the actual cold chain system, and several conclusions can be obtained as below:
- The confidence and satisfaction levels could affect the system cost, with higher levels leading to higher consumption.
- The varying minimal demands from customers have a big influence on the transportation and new candidate distribution centers.
- The surroundings of a distribution center reflect its service quality to a certain extent, which indicates that more improved facilities mean more attractiveness to customers.
- The government can optimize the transportation and the the cold chain distribution centers by adjusting the carbon-trading price.
In this paper, the planning of the cold chain system is mainly optimized from the theory side, and there are still some assumptions needing further research, specifically as follows:
- The study only discusses large-scale distribution centers (top 20) as the existing ones, and more detailed information should be considered to optimize a regional cold chain system.
- There should be more surrounding factors affecting the service quality of a center, while only five factors are discussed in this research.
- The carbon emission of the transportation and storage processes in the cold chain logistic system are discussed, while more processes related to carbon emission should be considered in the future.
Author Contributions
Conceptualization, Y.W. (Yanxia Wang) and S.G.; Methodology, Y.W. (Yanxia Wang) and S.G.; Writing—review & editing, Y.W. (Yuchen Wang). All authors have read and agreed to the published version of the manuscript.
Funding
This research was funded by Humanities and Social Sciences Fund of the Ministry of Education of funder grant number 24YJCZH320.
Institutional Review Board Statement
Not applicable.
Informed Consent Statement
Not applicable.
Data Availability Statement
The original contributions presented in the study are included in the article; further inquiries can be directed to the corresponding author.
Conflicts of Interest
The authors declare no conflicts of interest.
References
- Zhang, Y.Y.; Zheng, Q.; Wang, H. Challenges and opportunities facing the Chinese economy in the new decade: Epidemics, food, labor, E-commerce, and trade. Chin. Econ. 2021, 54, 373–375. [Google Scholar] [CrossRef]
- Zhao, K.; Shi, H.; Zhang, Y.Y.; Sheng, J. Fresh produce E-Commerce and online shoppers’ purchase intention. Chin. Econ. 2021, 54, 415–429. [Google Scholar] [CrossRef]
- Jiang, Y.; Lai, P.; Chang, C.H.; Yuen, K.F.; Li, S.; Wang, X. Sustainable management for fresh food E-commerce logistics services. Sustainability 2021, 13, 3456. [Google Scholar] [CrossRef]
- Chen, Q.; Qian, J.; Yang, H.; Wu, W. Sustainable food cold chain logistics: From microenvironmental monitoring to global impact. Compr. Rev. Food Sci. Food Saf. 2022, 21, 4189–4209. [Google Scholar] [CrossRef]
- Han, J.W.; Zuo, M.; Zhu, W.Y.; Zuo, J.H.; Lü, E.L.; Yang, X.T. A comprehensive review of cold chain logistics for fresh agricultural products: Current status, challenges, and future trends. Trends Food Sci. Technol. 2021, 109, 536–551. [Google Scholar] [CrossRef]
- Esteso, A.; Alemany, M.; Ortiz, Á. Impact of product perishability on agri-food supply chains design. Appl. Math. Model. 2021, 96, 20–38. [Google Scholar] [CrossRef]
- Firzli, M.N.J. Investment Governance: The Real Fight Against Emissions Is Being Waged by Markets. Dow Jones Financial News, 20 January 2016. [Google Scholar]
- Li, Y.; Liu, Z.; Sang, Y.; Hu, J.; Li, B.; Zhang, X.; Jurasz, J.; Zheng, W. Optimization of integrated energy system for low-carbon community considering the feasibility and application limitation. Appl. Energy 2023, 348, 121528. [Google Scholar] [CrossRef]
- Lin, R.; Ye, Z.; Guo, Z.; Wu, B. Hydrogen station location optimization based on multiple data sources. Int. J. Hydrogen Energy 2020, 45, 10270–10279. [Google Scholar] [CrossRef]
- Drezner, T.; Drezner, Z.; Kalczynski, P. A leader-follower model for discrete competitive facility location. Comput. Oper. Res. 2015, 64, 51–59. [Google Scholar] [CrossRef]
- Qi, M.; Xia, M.; Zhang, Y.; Miao, L. Competitive facility location problem with foresight considering service distance limitations. Comput. Ind. Eng. 2017, 112, 483–491. [Google Scholar] [CrossRef]
- Ahmadi, Z.; Ghezavati, V. Developing a new model for a competitive facility location problem considering sustainability using Markov chains. J. Clean. Prod. 2020, 273, 122971. [Google Scholar] [CrossRef]
- Ma, H.; Guan, X.; Wang, L. A single-facility competitive location problem in the plane based on customer choice rules. J. Inf. Data Manag. 2020, 2, 323–336. [Google Scholar] [CrossRef]
- Marianov, V.; Eiselt, H.; Lüer-Villagra, A. The follower competitive location problem with comparison-shopping. Netw. Spat. Econ. 2020, 20, 367–393. [Google Scholar] [CrossRef]
- Wang, Y.; Wang, J.; Schuler, J.; Hartley, D.; Volk, T.; Eisenbies, M. Optimization of harvest and logistics for multiple lignocellulosic biomass feedstocks in the northeastern United States. Energy 2020, 197, 117260. [Google Scholar] [CrossRef]
- Wang, S.C.; Lin, C.C.; Chen, T.C.; Hsiao, H.C. Multi-objective competitive location problem with distance-based attractiveness for two facilities. Comput. Electr. Eng. 2018, 71, 237–250. [Google Scholar] [CrossRef]
- Zavadskas, E.K.; Turskis, Z.; Bagočius, V. Multi-criteria selection of a deep-water port in the Eastern Baltic Sea. Appl. Soft Comput. 2015, 26, 180–192. [Google Scholar] [CrossRef]
- Zhang, Y.; Snyder, L.V.; Ralphs, T.K.; Xue, Z. The competitive facility location problem under disruption risks. Transp. Res. E Logist. Transp. 2016, 93, 453–473. [Google Scholar] [CrossRef]
- Ambrosino, D.; Sciomachen, A. Location of mid-range dry ports in multimodal logistic networks. Procedia Soc. Behav. Sci. 2014, 108, 118–128. [Google Scholar] [CrossRef]
- Hu, L.; Zhu, J.X.; Wang, Y.; Lee, L.H. Joint design of fleet size, hub locations, and hub capacities for third-party logistics networks with road congestion constraints. Transp. Res. E Logist. Transp. 2018, 118, 568–588. [Google Scholar] [CrossRef]
- Zhu, H.; Zhang, D.; Goh, H.H.; Wang, S.; Ahmad, T.; Mao, D.; Liu, T.; Zhao, H.; Wu, T. Future data center energy-conservation and emission-reduction technologies in the context of smart and low-carbon city construction. Sustain. Cities Soc. 2022, 89, 104322. [Google Scholar] [CrossRef]
- Oh, H.; Jun, S.; Kim, J.Y.; Chu, H.Y. Korea’s emissions trading system for low-carbon energy and economic transformation: A quantitative study evaluating the impact of phase I of the KETS on energy efficiency and the energy mix. Energy Effic. 2023, 16, 13. [Google Scholar] [CrossRef]
- Xiao, Z.; Sun, J.; Shu, W.; Wang, T. Location-allocation problem of reverse logistics for end-of-life vehicles based on the measurement of carbon emissions. Comput. Ind. Eng. 2019, 127, 169–181. [Google Scholar] [CrossRef]
- Wu, D.; Huo, J.; Zhang, G.; Zhang, W. Minimization of logistics cost and carbon emissions based on quantum particle swarm optimization. Sustainability 2018, 10, 3791. [Google Scholar] [CrossRef]
- Li, K.; Li, D.; Wu, D. Carbon Transaction-Based Location-Routing-Inventory Optimization for Cold Chain Logistics. Alex. Eng. J. 2022, 61, 7979–7986. [Google Scholar] [CrossRef]
- Reddy, K.N.; Kumar, A.; Sarkis, J.; Tiwari, M.K. Effect of carbon tax on reverse logistics network design. Comput. Ind. Eng. 2020, 139, 106184. [Google Scholar] [CrossRef]
- Van Loon, P.; Deketele, L.; Dewaele, J.; McKinnon, A.; Rutherford, C. A comparative analysis of carbon emissions from online retailing of fast moving consumer goods. J. Clean. Prod. 2015, 106, 478–486. [Google Scholar] [CrossRef]
- Li, X.; Zhou, K. Multi-objective cold chain logistic distribution center location based on carbon emission. Environ. Sci. Pollut. Res. 2021, 28, 32396–32404. [Google Scholar] [CrossRef]
- Elhedhli, S.; Merrick, R. Green supply chain network design to reduce carbon emissions. Transp. Res. D Trans. Environ. 2012, 17, 370–379. [Google Scholar] [CrossRef]
- He, Y.; Wang, X.; Lin, Y.; Zhou, F.; Zhou, L. Sustainable decision making for joint distribution center location choice. Transp. Res. D Trans. Environ. 2017, 55, 202–216. [Google Scholar] [CrossRef]
- Zhang, D.; Zhan, Q.; Chen, Y.; Li, S. Joint optimization of logistics infrastructure investments and subsidies in a regional logistics network with CO2 emission reduction targets. Transp. Res. D Trans. Environ. 2018, 60, 174–190. [Google Scholar] [CrossRef]
- Pishvaee, M.S.; Razmi, J.; Torabi, S.A. Robust possibilistic programming for socially responsible supply chain network design: A new approach. Fuzzy Sets. Syst. 2012, 206, 1–20. [Google Scholar] [CrossRef]
- Cadenas, J.M.; Verdegay, J.L. Using fuzzy numbers in linear programming. IEEE Trans. Syst. Man. Cybern. 1997, 27, 1016–1022. [Google Scholar] [CrossRef] [PubMed]
- Peidro, D.; Mula, J.; Poler, R.; Verdegay, J.L. Fuzzy optimization for supply chain planning under supply, demand and process uncertainties. Fuzzy Sets. Syst. 2009, 160, 2640–2657. [Google Scholar] [CrossRef]
- Wang, Y.; Zhao, S.; Zhou, Z.; Botterud, A.; Xu, Y.; Chen, R. Risk Adjustable Day-Ahead Unit Commitment with Wind Power Based on Chance Constrained Goal Programming. IEEE Trans. Sustain. Energy 2017, 8, 530–541. [Google Scholar] [CrossRef]
- Miller, B.L.; Wagner, H.M. Chance Constrained Programming with Joint Constraints; INFORMS: Catonsville, MA, USA, 1965. [Google Scholar]
- Aboolian, R.; Berman, O.; Krass, D. Competitive facility location and design problem. Eur. J. Oper. Res. 2007, 182, 40–62. [Google Scholar] [CrossRef]
- Nieto, P.G.; Fernández, J.A.; Suárez, V.G.; Muñiz, C.D.; García-Gonzalo, E.; Bayón, R.M. A hybrid PSO optimized SVM-based method for predicting of the cyanotoxin content from experimental cyanobacteria concentrations in the Trasona reservoir: A case study in Northern Spain. Appl. Math. Comput. 2015, 260, 170–187. [Google Scholar] [CrossRef]
- BMCDR. Beijing Electric Vehicles Charging Infrastructure Special Plan of 2016–2020. Available online: http://www.evpartner.com/news/12/detail-19416.html (accessed on 1 October 2024).
- NBOSC. National Data. Available online: https://data.stats.gov.cn/easyquery.htm?cn=A01 (accessed on 1 October 2024).
Disclaimer/Publisher’s Note: The statements, opinions and data contained in all publications are solely those of the individual author(s) and contributor(s) and not of MDPI and/or the editor(s). MDPI and/or the editor(s) disclaim responsibility for any injury to people or property resulting from any ideas, methods, instructions or products referred to in the content. |
© 2025 by the authors. Licensee MDPI, Basel, Switzerland. This article is an open access article distributed under the terms and conditions of the Creative Commons Attribution (CC BY) license (https://creativecommons.org/licenses/by/4.0/).