Article

Exploring the Interplay of Stakeholder Pressure, Environmental Awareness, and Environmental Ethics on Perceived Environmental Performance: Insights from the Manufacturing Sector

by
Oluwaleke Micheal Awonaike
* and
Tarik Atan
Department of Business Administration, Faculty of Economics and Administrative Sciences, Cyprus International University, Haspolat, 99258 Nicosia, Cyprus
*
Author to whom correspondence should be addressed.
Sustainability 2025, 17(11), 4870; https://doi.org/10.3390/su17114870
Submission received: 1 April 2025 / Revised: 9 May 2025 / Accepted: 21 May 2025 / Published: 26 May 2025

Abstract

:
This study explores the relationships among stakeholder pressure (SP), environmental awareness (EA), leadership commitment (LC), and environmental ethics (EE) and their influence on perceived environmental performance (PEP) in the manufacturing industry. Partial least squares structural equation modeling (PLS-SEM) was employed to examine the quantitative data collected from 386 managers across selected manufacturing firms in Lagos State, Nigeria. The outcome of the study reveals that stakeholder pressure influences environmental ethics and perceived environmental performance but not leadership commitment, while environmental awareness influences environmental ethics but not perceived environmental performance and leadership commitment, with EE not impacted by LC. Meanwhile, EE mediate the relationship between EA and PEP as well as SP and PEP but not LC and PEP, while LC does not mediate any of the relationship, and innovative climate (IC) does not moderate the relationship between EE and PEP. The study recommends that organizations should focus on enhancing EA and SP to improve environmental ethics and PEP.

1. Introduction

Institutional and stakeholder theories are essential considering the efforts of organizations to moderate the effects of their activities on society. Institutional theory proposes that improving environmental performance requires adopting practices shaped by social, environmental, and organizational factors [1,2]. The growing importance of EE pinpoints the adverse effects of organizational activities, encouraging moral behavior and boosting perceived environmental performance (PEP) as an ethical issue [3]. Frighteningly, over six million people die yearly from air pollution, with more than one million deaths linked to harmful chemicals [4]. The United States, known as one of the top ten nations with pollution-related deaths, has the EPA urging organizations to account for toxic chemical releases and pollution prevention efforts to enhance PEP [5].
Furthermore, Helliwell et al. [6] highlight the importance of environmental ethics for organizational success. Meanwhile, firms are restructuring to enhance accountability and environmental performance, but existing models fail to address personal adoption [7]. The impetus of this study is as a result of the increasing significance of organizational commitment and environmental ethics in attaining sustainable performance. This study builds on the findings of Tsinopoulos et al. [3] by proposing that stakeholder pressure and organizational environmental awareness, both of which may be impacted by environmental factors, also influence how environmental performance is viewed. Additionally, Trizotto et al. [8] point out that innovative climate awareness is a significant moderating element in the relationship between environmental ethics and perceived environmental performance. Therefore, the purpose of this study is to shed light on how these components interact to improve organizational performance and sustainability.
The following are some ways that this study contributes to the existing literature regarding both institutional and stakeholders’ theory: First, this study highlights the indirect pathways through which EA and SP influence PEP by means of LC and EE. Secondly, this study focuses on Nigeria’s manufacturing industry, which has received little attention in the field of environmental studies. Third, this study reveals negligible function of the innovative climate within this framework, which may be ascribed to a number of organizational and environmental contingencies. First, it is possible that in some settings, particularly in developing economies, like Nigeria, the innovative climate is not sufficiently developed or prioritized in organizational culture. This could be due to a variety of factors, including limited resources, less emphasis on cutting-edge technology, and a lack of strong institutional support for fostering an innovation-driven environment [9].
Furthermore, in such environments, firms may be more focused on meeting immediate operational needs rather than fostering an atmosphere conducive to innovation, which could weaken the moderating effect of IC on the relationship between EE and PEP. Third, the study challenges some existing assumptions and offers new perspectives on the factors that truly drive environmental performance in manufacturing industries. By highlighting the limited role of the innovative climate in this context, it encourages a reevaluation of how environmental performance is driven by organizational factors, particularly in developing economies where innovation may not be as deeply ingrained in business practices.
However, these limitations provide particular challenges to the effective conversion of stakeholder pressure and environmental awareness into actual environmental performance in the context of our study, which focuses on industrial companies in Lagos State, Nigeria. This process is made more difficult by the lack of environmental ethical commitment from the leadership as well as the lack of a strong innovative climate, which emphasizes the practical gap between perceived and actual environmental performance. Aligning corporate operations with stakeholder expectations and environmental ethics has been increasingly important globally in recent years regarding sustainability. Due to inadequate infrastructure, gaps in regulatory enforcement, and conflicting operational priorities, putting environmentally conscious policies into practice is still very difficult in developing countries. The discrepancy between perceived and actual environmental performance is one of the major issues this study has faced, affecting some of the outcomes. Specifically, this discrepancy could explain why neither EA nor SP affected LC, why LC did not mediate the relationships between SP and EE, or EA and EE, and why EE did not mediate the relationship between LC and PEP.
In conclusion, the intricate connections between the studied variables emphasize the various obstacles to environmental development. Previous research has indicated that environmental awareness and stakeholder pressure can improve leadership commitment; however, because of the local realities of Nigerian manufacturing industries, the findings of this study differ. The usefulness of these studied variables is diminished by cultural attitudes toward environmental issues, including a lack of external validation systems and insufficient exposure to environmental education. The importance of this study is better understood by acknowledging these limitations, which highlight the urgent need for comprehensive policy and leadership reforms by exposing the contextual and structural obstacles to attaining environmental performance.
The succeeding sections are organized as follows: Section 2 thoroughly assesses the pertinent literature. Section 3 provides a thorough description of the research methodology and data sources. Section 4 provides the empirical findings and analysis, while Section 5 discusses these findings by relating it to existing literature. Section 6 highlights the limitations and proposes suggestions for future research. Finally, Section 7 summarizes the study’s outcome and offers policy implications and recommendations.

2. Literature Review

2.1. Stakeholder Pressure (SP)

Stakeholder theory claims that organizations must satisfy the demands of all parties interested in the success of a business, including the sustainable practices used to meet the expectations of various stakeholders and maintain competitiveness [10]. Therefore, stakeholder pressure can be defined as the impact that different stakeholders have on an organization to adopt particular practices or behaviors [11]. Businesses are frequently compelled by stakeholder pressure to address regional environmental concerns [12].

2.2. Environmental Awareness (EA)

EA can be defined as the awareness of a range of environmental challenges, including pollution, resource depletion, and climate change, as well as being dedicated to implementing actions and policies that lessen these problems [13]. Kohler et al. [14] used a meta-analysis to evaluate the efficacy of environmental programs. However, drawing on UNESCO’s 2022 report, Zancajo et al. [15] emphasized the significance of media and education in raising global EA.

2.3. Leadership Commitment (LC)

Leadership commitment to environmental ethics refers to the dedication of organizational leaders to integrating environmental considerations into their strategic decisions, policies, and practices. It entails actively promoting sustainability and moral environmental behavior within the company, going beyond simple adherence to environmental laws [16]. Aguinis et al. [17] investigated how this commitment influences corporate culture and improves CSR outcomes. According to the research, a culture of responsibility and better perceived environmental performance are facilitated by leadership commitment [16,17].

2.4. Environmental Ethics (EE)

EE can be described as the study of how human activity affects the environment and what defines moral behavior toward it [18]. It is the study of moral relationships between humans and the natural world. Ferris and Fineman [19] broadened the scope of ethical considerations by including ecosystems and animals. Robinson et al. [20] included environmental, social, and economic factors into a paradigm for moral sustainability, while Schroeder [21] promoted an ecocentric viewpoint that puts the inherent worth of nature ahead of humancentric viewpoints. Furthermore, individual duties in minimizing environmental hazards were evaluated by Keller et al. [18]. Thompson [22] investigated how environmental ethics might be incorporated into the creation of policies. In his analysis of environmental justice, Pellow [23] focused on how underprivileged populations are exposed to pollution and how resources are distributed. Above all, these authors highlight how crucial it is to include moral values in sustainable activities in order to create a better future.

2.5. Perceived Environmental Performance (PEP)

PEP is the subjective evaluation of a business’ sustainability and environmental effect by internal and external stakeholders [24]. Delmas and Burbano [25] examine the detrimental impacts of greenwashing and how it skews stakeholders’ perceptions of environmental performance. Their research highlights how stakeholder perceptions have a big influence on business reputation and behavior, highlighting how crucial it is to match perceived and actual environmental performance in order to preserve trust and reputation.

2.6. Innovative Climate (IC)

According to Poveda-Pareja et al. [26], an IC is one that encourages innovation, experimentation, and fresh concepts, especially in relation to environmental sustainability. According to research by Erkmen et al. [27], an IC plays a part in improving environmental performance by fostering leadership commitment and moral behavior, which leads to sustainable results. To tackle difficult problems, this environment encourages critical problem-solving and creative thinking.
Accordingly, the research framework of this study as shown in Figure 1 is presented as follows: stakeholder pressure (SP) and environmental awareness (EA) influence leadership commitment (LC), and, together, these three variables impact environmental ethics (EE) as well as the perceived environmental performance (PEP) of an organization, with an innovative climate (IC) moderating EE’s impact on PEP by using stakeholder and institutional theories to understand how firms adopt environmentally friendly practices [3].

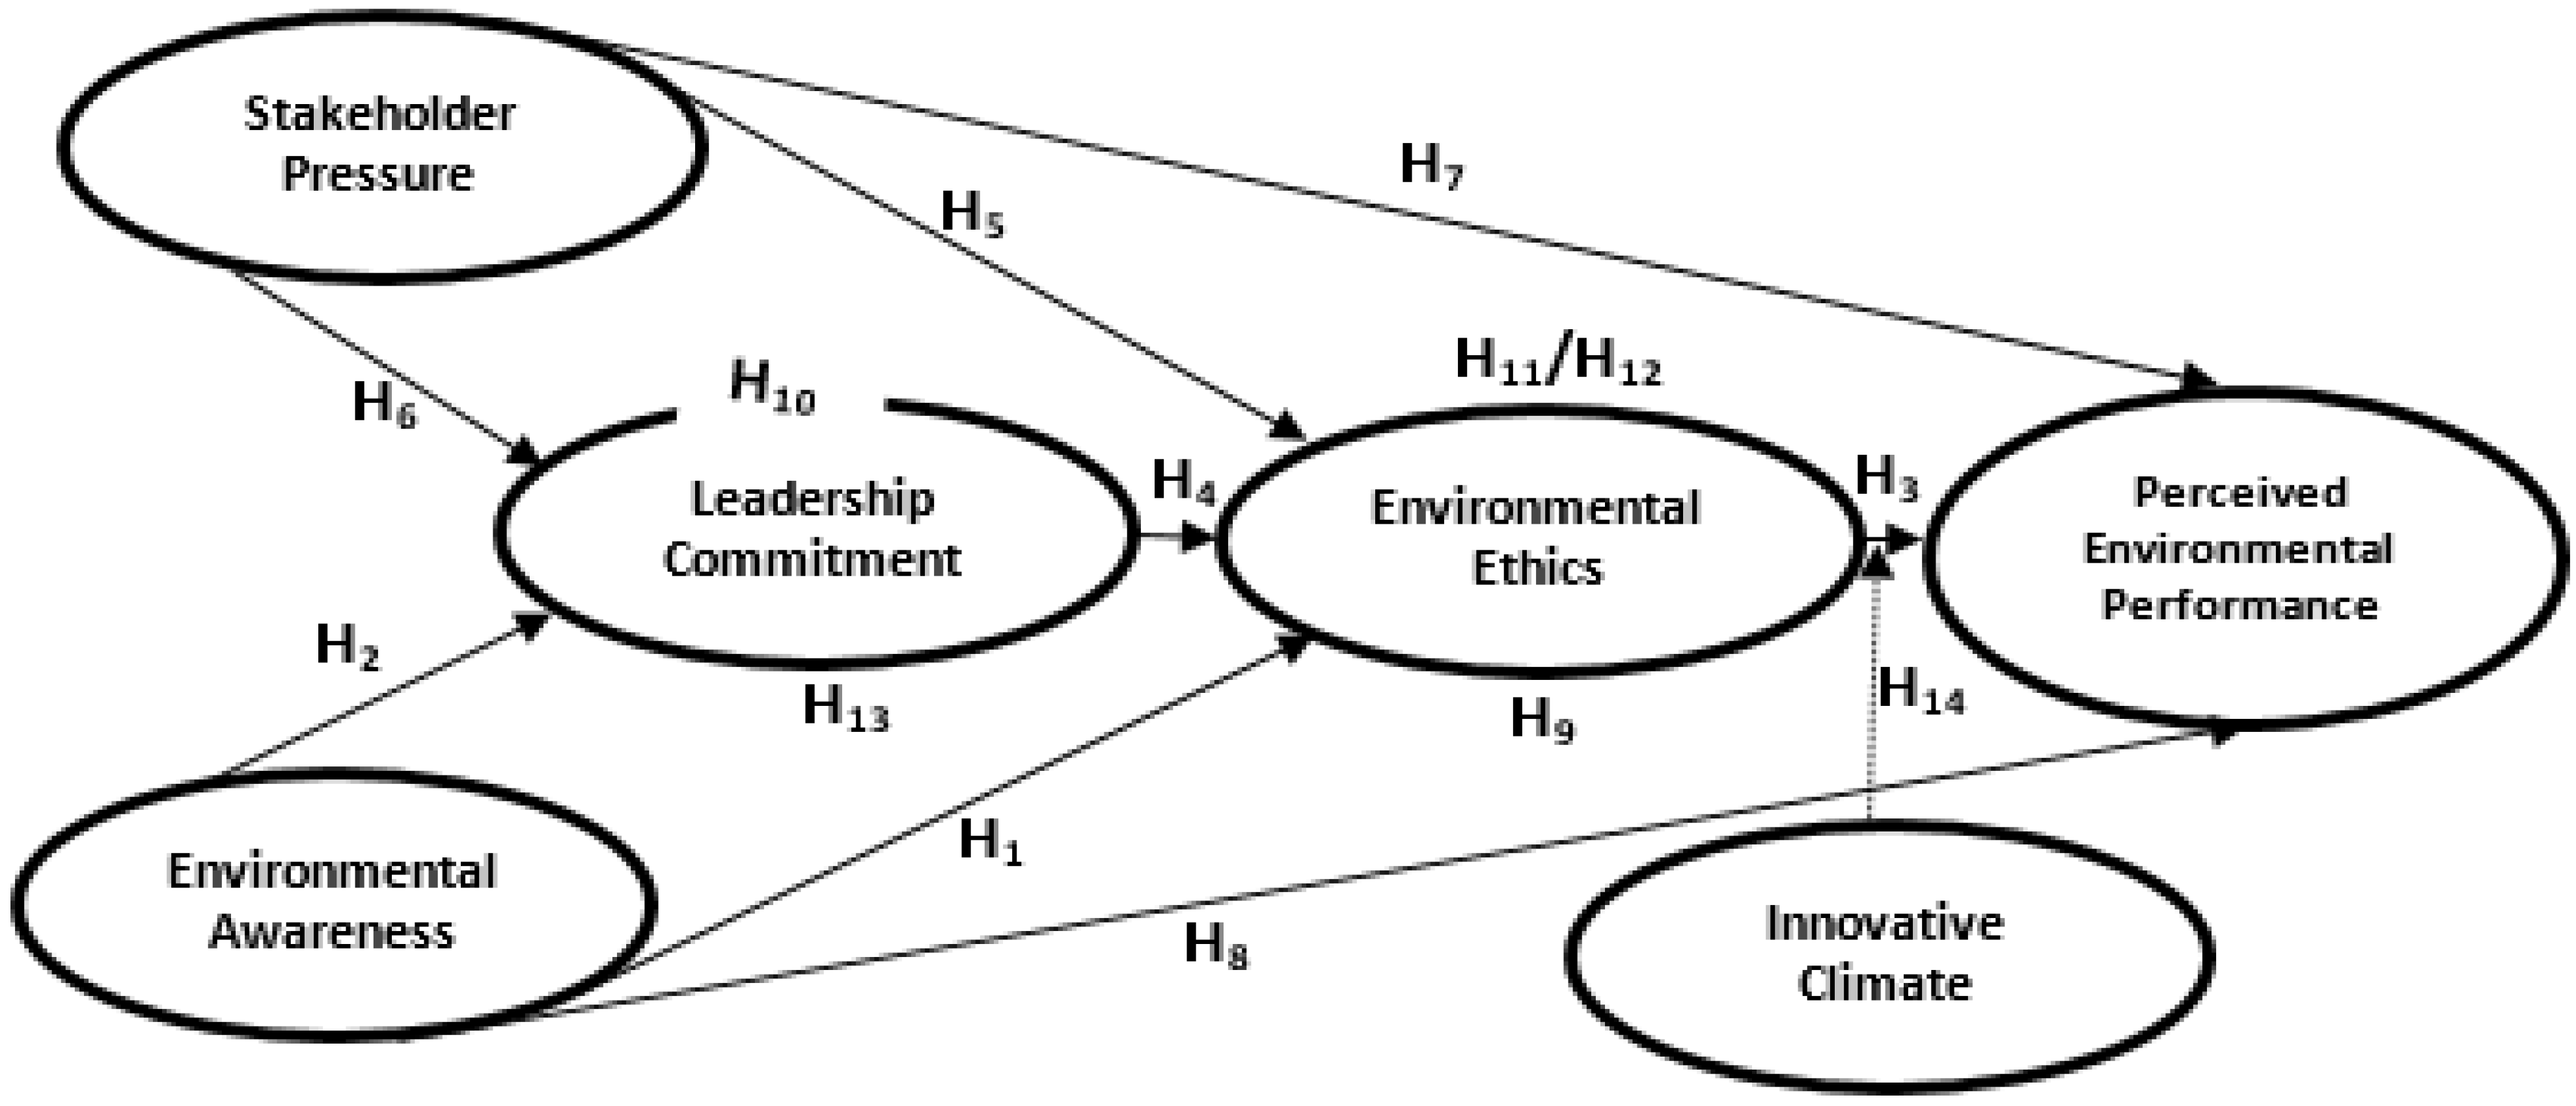
2.7. Theoretical Framework

Institutional theory illustrates how organizational norms, expectations of the public, and regulatory necessities influence the commitment of the leadership to environmental acts [28,29]. Building on the viewpoint of institutional theory, as per Freeman [30], stakeholder theory supports this viewpoint by highlighting the need for companies to take stakeholder interests into account in addition to their own goals. This is to ensure that employee engagement and satisfaction increase when environmental ethics are in line with stakeholder values and institutional demands.

2.8. Empirical Literature Review

Liu et al. [31] and Ak and Kutlu [32] found out in their study that environmental ethics are positively impacted by more environmental awareness in a range of cultural contexts. In Zibo, China, Wang et al. [33] looked at 972 participants from both urban and rural locations. They found a high correlation between leadership commitment and environmental consciousness. Wu et al. [34] confirmed this in the production of medical equipment. Furthermore, Singh et al. [35] studied 364 managers in the UAE, using SEM to show that environmental ethics positively influence perceived environmental performance. Xie et al. [36] confirmed this relationship in Chinese manufacturing firms. Also, Mishra and Tikoria [37] studied 537 doctors in Rajasthan, India, using SEM, finding that leadership commitment positively impacts environmental ethics. Zhang and Zhang [38] confirmed this in 502 insurance agents in China, leading to the following hypotheses:
H1. 
EA positively influences organizational EE.
H2. 
EA positively influences LC as regards environmental sensitivity.
H3. 
EE positively influence PEP.
H4. 
LC positively influences EE.
Furthermore, Rui & Lu [39] studied 278 enterprises in the Yangtze River Delta, using regression analysis, revealing that stakeholder pressure significantly influences environmental ethics. D’Souza et al. [40] confirmed this in 286 social businesses in Bangladesh. Tian et al. [41] conducted two studies in China, finding a positive relationship between stakeholder pressure and leadership commitment. Yong et al. [42] confirmed this in 112 Malaysian manufacturing firms using PLS modelling. Alt et al. [43] examined 170 firms across Europe, finding that stakeholder pressure positively influences perceived environmental performance. Graham [44] confirmed this in 149 U.K. food industry companies, using hierarchical regression analysis. Xie et al. [36] evaluated 410 managers in China and discovered that environmental awareness positively influences perceived environmental performance. Alzghoul et al. [45] confirmed this by using 287 individuals in Jordanian pharmaceutical companies, which led to the following hypotheses:
H5. 
SP has a significant positive influence on EE.
H6. 
SP has a significant positive influence on LC.
H7. 
SP has a significant positive influence on PEP.
H8. 
EA has a significant positive influence on PEP.
In addition, Saifulina et al. [46] studied 331 bank employees across Kazakhstan, Ecuador, and China, finding that EE mediate the relationship between EA and PEP. De Araujo [47] similarly highlighted this mediating role. Also, Zailani et al. [48] considered 252 Malaysian transportation companies, using SEM to examine EE as a mediator between LC and PEP, highlighting its significant influence on environmental performance. In the meantime, Mansour et al. [49] discovered that the relationship between EE and SP is mediated by LC, highlighting the fact that LC guarantees that external pressures result in moral environmental behavior. Using stepwise regression, Rui and Lu [39] examined 278 businesses in the Yangtze River Delta and discovered that stakeholder pressure affects environmental ethics, which, in turn, improves PEP. Furthermore, LC was identified by Wu et al. [34] and Wang [50] as a critical mediator that converts EA into effective EE. LC integrates sustainability into organizational culture and strategies, which leads to the development of the following hypotheses:
H9. 
EE mediate the relationship between EA and PEP.
H10. 
LC mediates the relationship between SP and EE.
H11. 
EE mediate the relationship between LC and PEP.
H12. 
EE mediate the relationship between SP and PEP.
H13. 
LC mediates the relationship between EA and organizational EE.
Finally, Akhtar et al. [51] and Enbaia et al. [52] claimed that an innovative climate, characterized by a culture fostering creativity and the adoption of new technologies, enhances the effect of environmental ethics on perceived environmental performance. This led to the following hypothesis:
H14. 
IC moderates the effects of organizational EE on PEP.

3. Materials and Methods

3.1. Research Design

This study employed a total population sampling technique by using structured questionnaires to collect quantitative data from 421 manufacturing companies in Lagos State, Nigeria. The participants of the study comprised managers of those manufacturing companies in Lagos state. Any organization whose managers declined to complete the questionnaire for any reason was excluded from the study. The responses gathered from the questionnaires were collated and analyzed using SPSS version 26 and SmartPLS 4.
There are 421 manufacturing companies in Lagos State, Nigeria (https://www.dnb.com/business-directory/company-information.manufacturing.ng.na.lagos_state.html?utm_source=chatgpt.com, accessed on 1 January 2025). This study focused on the entire population of manufacturing companies in Lagos State, resulting in the distribution of 421 questionnaires. Of these, 386 were returned and deemed usable, yielding a response rate of approximately 91.7%. Participants in this study included managers from manufacturing companies in Lagos State, recognized as the center of excellence.
Due to constraints, such as time and cost, the study employed non-probability sampling techniques, specifically convenience sampling, for data collection. Non-probability sampling can effectively estimate population characteristics [53]. This research utilized a quantitative approach, employing structured questionnaires as the primary data collection instrument. The study design aimed to objectively examine the formulated hypotheses that elucidate the relationships among the study variables, while also generalizing the findings to a larger population [54].

3.2. Items of Measurements

This study utilized six constructs, each measured by a different number of items, referred to as indicators. These items were designed using a 5-point Likert scale, ranging from 1 to 5, where “1” represents “strongly disagree” and “5” signifies “strongly agree”, as detailed in Appendix A.
Lee et al. [55] created four measures (SP1 to SP4) to measure stakeholder pressure. Five items were also used to evaluate environmental awareness (EA1 to EA5) created by Gadenne et al. [56], with five items used to measure perceived environmental performance (PEP1 to PEP5) adopted from Paillé et al. [57] Specifically, five items were used to measure environmental ethics (EE1 to EE5), as developed by Rui and Lu [39]. Leadership commitment was assessed with three items (LC1 to LC3) created by Banerjee et al. [58]. Finally, four items (IC1 to IC4), developed by Popa et al. [59], were used to measure innovative climate.

4. Results

Measurement models and structural equation modeling were examined and conducted using SmartPLS 4 alongside data cleaning and descriptive analysis using SPSS version 26 to examine the developed hypotheses.

4.1. Demographic Study

The demographic composition of this study was based on 386 participants out of the 421 questionnaires distributed to the target population which were found to be valid, yielding a 91.69% rate of return.
Table 1 presents the demographic characteristics of the managers who participated in the survey, representing their respective organizations. The findings indicate that a majority of participants were female, comprising 54.65% of the sample. Additionally, most respondents fell within the age bracket of 25 to 40 years, accounting for 76.2% of the total. The data also reveal that the majority of the companies represented were privately owned, constituting 77.7% of the sample.
Furthermore, nearly half of the managers (47.4%) reported having less than four years of tenure in their positions, and most participants identified as married, representing 53.1% of the respondents.

4.2. Measurement Model

The assessment of the measurement model enables researchers to make sure that their latent constructs are reliably assessed by laying a strong basis for the structural equation model analysis that follows. It is a crucial part of structural equation modeling (SEM), which establishes the connections among unobserved variables, also known as latent variables, and the associated observed variables. To guarantee that the constructs are appropriately represented and that the observed variables are legitimate reflections of these underlying latent variables, this model outlines how each latent variable is measured by its indicators [60].
This procedure improves the validity and reliability of SEM data producing a more robust and easier-to-understand result. In SEM, the process of building a measurement model guarantees that latent constructs are accurately represented by observed indicators and involves a systematic process based on defining constructs and indicators (the initial stage), followed by model identification (the critical step). It is generally agreed that reflective measurement models should incorporate a minimum of three indicators for each latent variable to ensure identification. The estimation of parameters occurs after identification and entails figuring out the factor loadings by using either maximum likelihood (ML) or partial least squares (PLS) approaches, which are popular estimation methods [61]. Fourth, the model fit is evaluated to see how well the model fits the indicators. This step is followed by validity and reliability tests which are necessary to guarantee the resilience of the measurement model, using “Factor loadings”, “Cronbach’s alpha or Composite Reliability”, “Average Variance Extracted (AVE)”, and “Discriminant validity”, which is typically assessed using the heterotrait–monotrait (HTMT) ratio or the Fornell–Larcker criterion, respectively [62]. Lastly, modification of the model can be required if the model does not show a strong fit at first.
Therefore, the constructs in this study were examined by evaluating the measurement model using PLS-SEM (See Figure 2) to confirm the reliability and validity of the studied variables before proceeding to the structural model.
According to Table 2, all factor loadings exceed 0.7, indicating that each indicator effectively represents its underlying construct [63]. However, the factor loading for environmental awareness (EA4, 0.671) falls below 0.7 but remains above the minimum satisfactory threshold of 0.50 [64]. As noted by Latif et al. [65], many social science studies report factor loadings below 0.70, suggesting that rather than routinely deleting indicators, it is essential to assess the impact of such actions on the composite reliability and convergent validity. Sarstedt et al. [66] indicated that items with factor loadings between 0.40 and 0.70 may be eliminated only if it enhances these metrics.
In this study, removing EA4, which has an outer loading of 0.671, would likely not have significantly improved average variance extracted or composite reliability, as all other indicators already met acceptable thresholds. Consequently, no observed variables were deleted for further analysis. Additionally, Table 2 shows the consistency of the constructs, with reliability tests using Cronbach’s alpha, rho_a (average inter-item correlation), and composite reliability (rho_c) all exceeding the acceptable threshold of 0.70 [67].
To further ensure robust analysis, the multicollinearity among variables was assessed using the variance inflation factor (VIF). As shown in Table 2, all VIF values are below 5, indicating no multicollinearity issues [68]. Furthermore, Table 3 reveals that the heterotrait–monotrait ratio of the correlations is below the acceptable threshold of 0.85 [69] and below 0.90, thus confirming the establishment of discriminant validity.
The square root of the average variance extracted (AVE) was assessed against the correlations among the constructs using the Fornell–Larcker criterion, as presented in Table 4. The results indicate that the square root of AVE for each construct is higher than its correlations with other constructs, whether examined vertically or horizontally in the table. This confirms that the constructs in this study exhibit discriminant validity, indicating that each construct is distinct and there is no overlap among them.

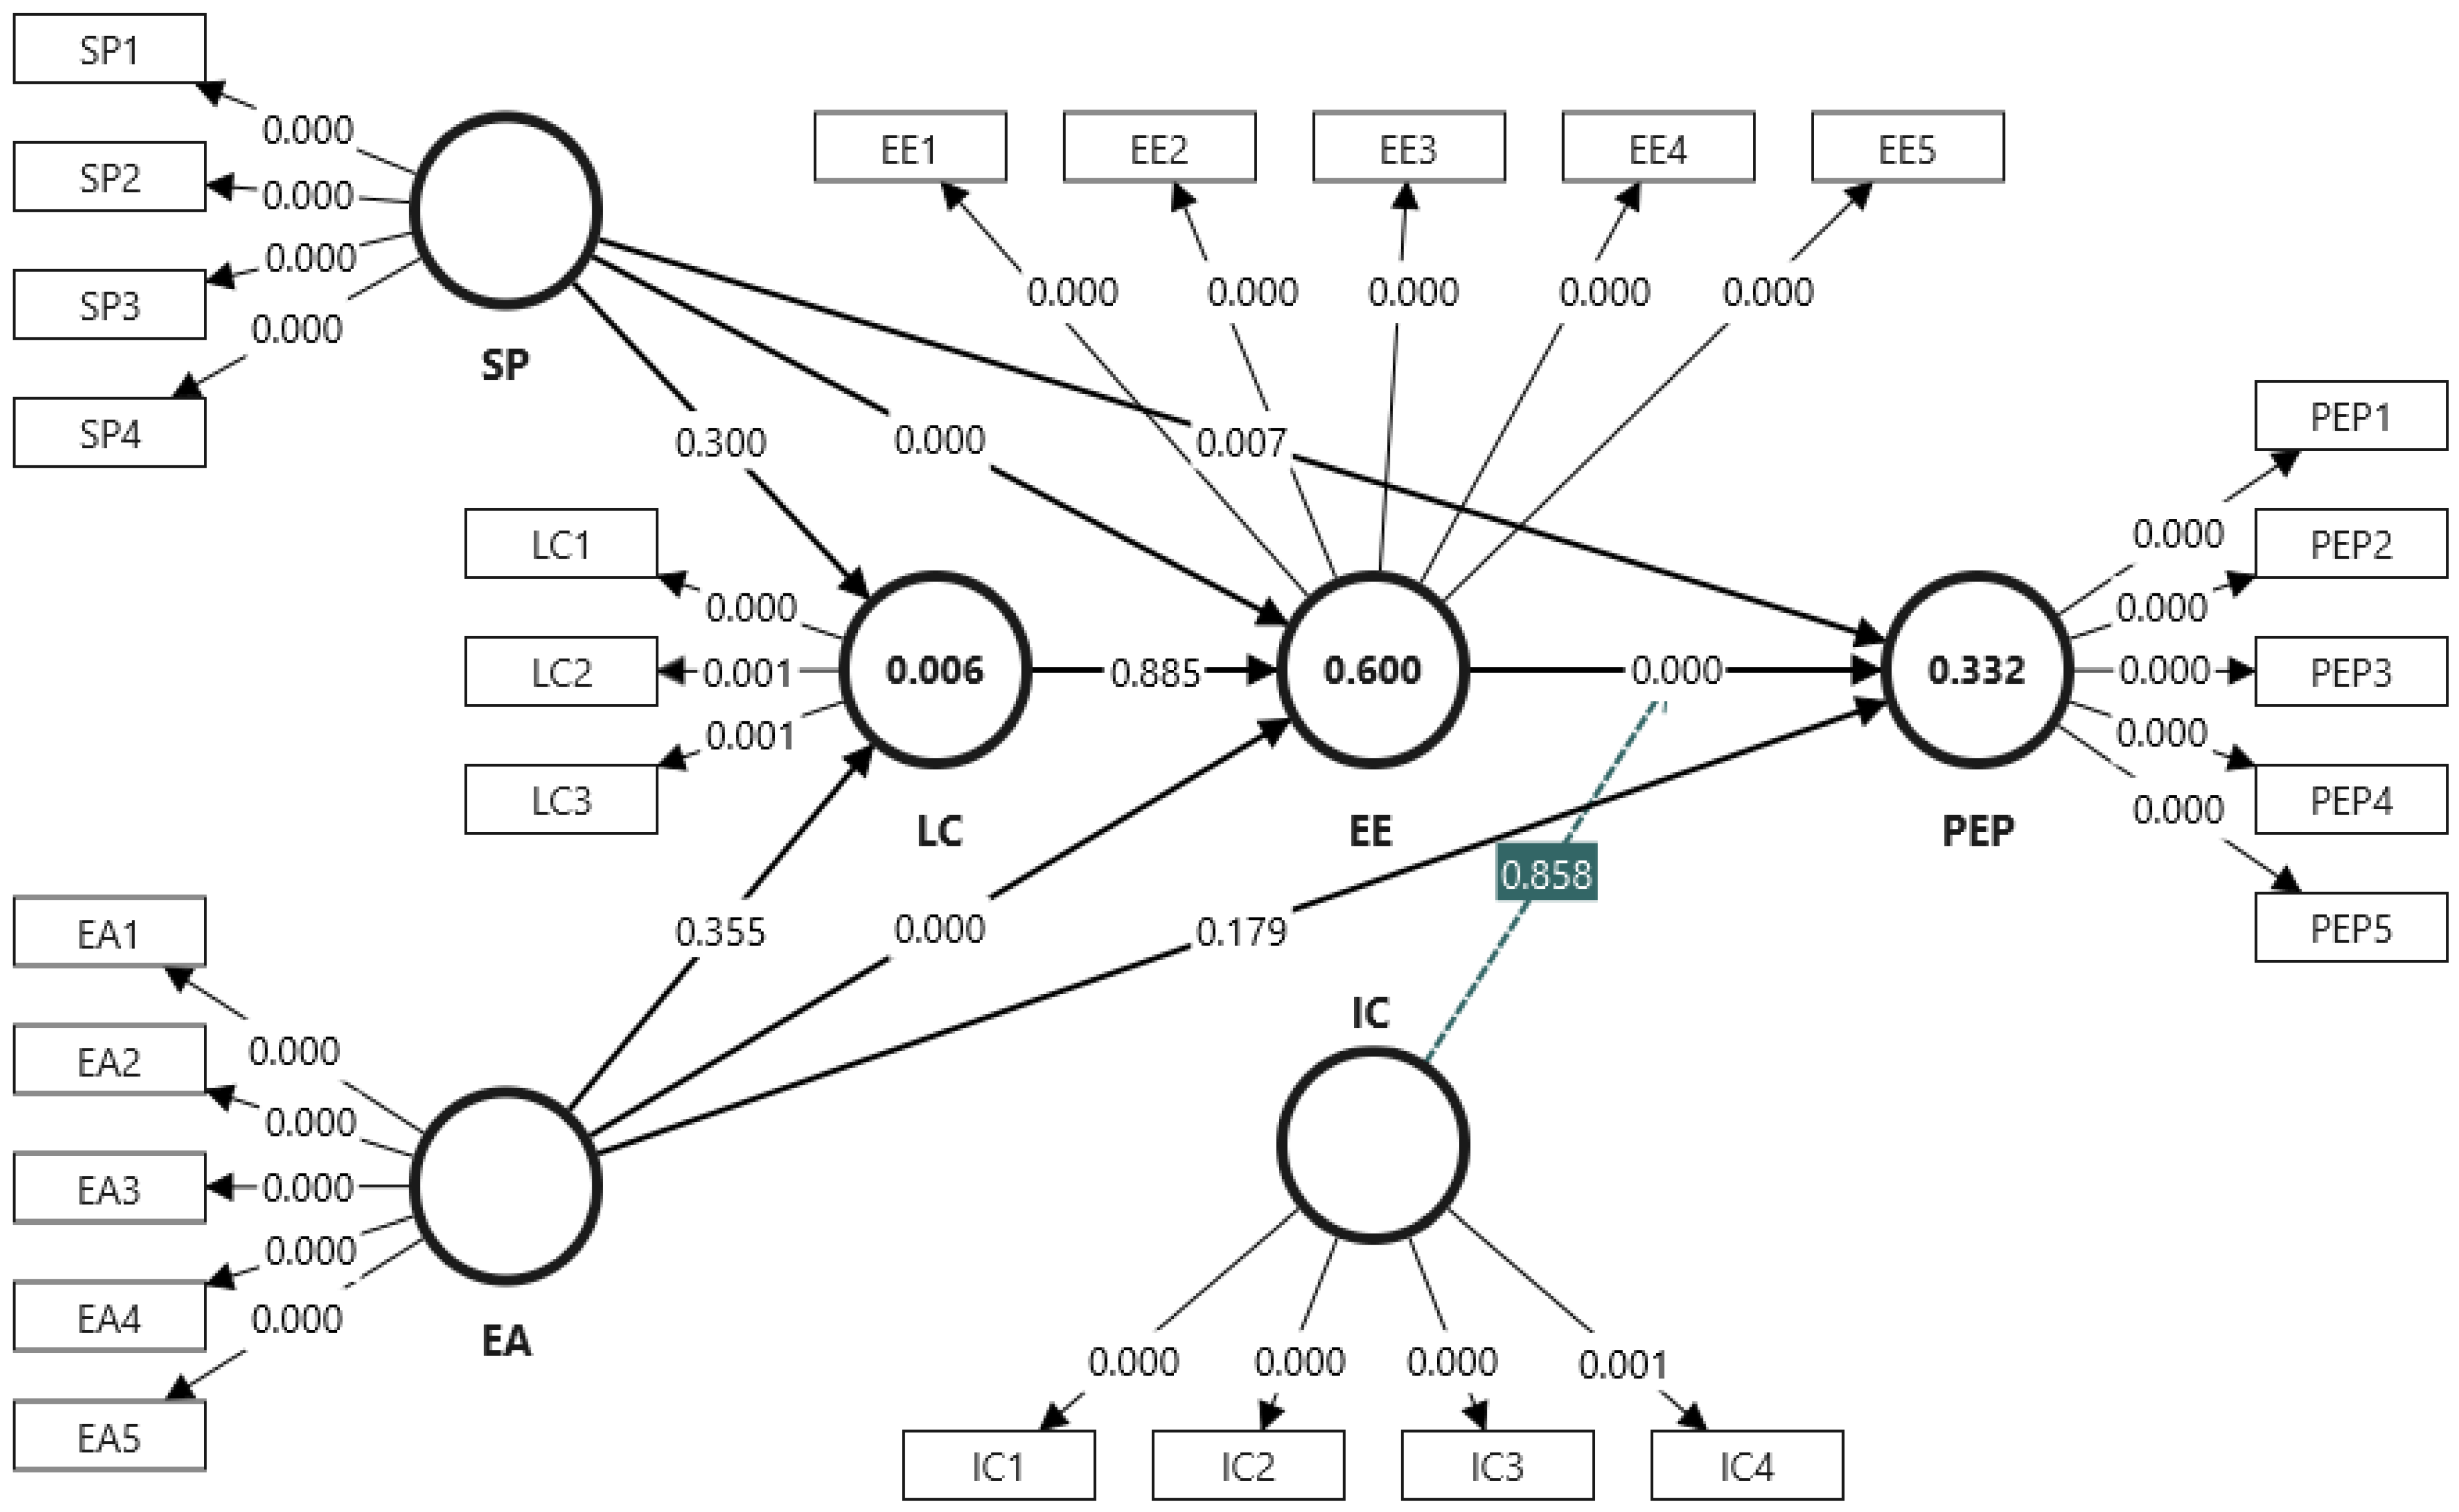
4.3. Structural Model

The first stage in SEM analysis process is the formulation of a conceptual framework based on the extant literature and theoretical foundations. The structural model was developed to investigate the direct, indirect, and moderated relationships among stakeholder pressure (SP), environmental awareness (EA), leadership commitment (LC), environmental ethics (EE), innovative climate (IC), and perceived environmental performance (PEP), which are the main constructs in this study. The direct interactions between the constructs were modeled using the following structural equations formulas:
EE = β1SP + β2EA + β3LC + ς1,
LC = β4SP + β5EA + ς2,
PEP = β6SP + β7EA +β8LC +β9EE + ς2,
where
  • β i represents standardized path coefficients;
  • ς i denotes the error terms for each equation.
Meanwhile, the model further integrated the indirect effects of EE between the following constructs:
  • EA and PEP;
  • LC and PEP;
  • SP and PEP.
These relationships were tested using the bootstrapping method, as follows:
EA → EE → PEP,
LC → EE → PEP,
SP → EE → PEP,
The mediating effect of LC between the following constructs was also considered:
  • SP and EE;
  • EA and EE.
This was tested by using bootstrapping techniques, as follows:
SP → LC → EE,
EA → LC → EE,
Finally, the model also produced an interaction effect by hypothesizing the moderating role of IC on the relationship between EE and PEP, as follows:
PEP = β10EE + β11IC + β12 (EE × IC) + ς3,
where ( E E × I C ) is the product of standardized values of EE and IC, which is known as the interaction term.
The hypothesized paths in the theoretical model are illustrated using a structural model, as shown in Figure 3. To assess this model, three key conditions are evaluated, namely the path significance, R2, and Q2. Table 5 demonstrates that all the R2 values exceed this threshold, indicating predictions, except for leadership commitment (LC), which is below 0.1. This indicates that the two independent variables SP and EA do not significantly predict LC. Conversely, the R2 for EE is 0.600, meaning that 60% of the variance in EE is explained by SP and EA. For PEP, the R2 is 0.332, indicating that 33.2% of the variance in PEP is explained by EE and SP, with their p-values being less than 0.05, as shown in Figure 3.
Furthermore, Q2 establishes the predictive relevance of the dependent variables. Table 5 shows that the Q2 values are above 0 for most variables, indicating predictive significance, except for leadership commitment (LC), which is below 0. Environmental ethics EE has a Q2 of 0.598, and perceived environmental performance (PEP) has a Q2 of 0.265, both demonstrating predictive relevance. Assessing the model’s goodness of fit also leads to examining the proposed hypotheses to confirm the relationship relevance.
Hypothesis 1 (H1) examines whether environmental awareness (EA) positively influences organizational environmental ethics (EE). Table 5 indicates that EA does have a positive effect on EE, with a beta weight of 0.49, exceeding the 0.10 threshold, indicating predictive ability [70]. The t-statistic of 11.204 is greater than 1.645, confirming significance in this one-tailed test, and the p-value is 0.000, which is less than 0.05 [71]. Thus, H1 is supported.
Similarly, the results show that EE positively influence perceived environmental performance (PEP), with β = 0.543, t = 14.586, and p = 0.003 < 0.05, supporting H3. Additionally, EE are moderately influenced by stakeholder pressure (SP), as indicated by β = 0.371, t = 9.396, and p = 0.000 < 0.05, thus supporting H5. Furthermore, SP has a weak positive influence on PEP (β = 0.185, t = 2.784, p = 0.000 < 0.05), supporting H7.
Conversely, the study reveals that EA does not positively influence leadership commitment (LC), as shown by β = 0.093, t = 0.903, and p = 0.176, which is greater than 0.05, indicating that H2 is not supported. Similarly, LC does not influence EE, with β = 0.004, t = 0.126, and p = 0.450, leading to the conclusion that H4 is not supported. Additionally, LC is not influenced by SP, with p = 0.147 > 0.05, meaning that H6 is also unsupported. Lastly, hypothesis eight (H8), stating that EA has a significant positive influence on PEP, is not supported either (β = 0.107, t = 1.281, p = 0.100 > 0.05).

4.4. Mediation Analysis

To examine the mediating roles of environmental ethics (EE) and leadership commitment (LC), a mediation analysis was conducted. Table 6 shows that EE mediate the relationship between environmental awareness (EA) and perceived environmental performance (PEP) (H9: β = 0.159, t = 4.631, p = 0.000). Since EA does not directly influence PEP (as shown in Table 5), EE have a full mediation effect on this relationship, thus supporting H9 (Table 6).
Additionally, EE also mediate the relationship between sustainability practices (SP) and PEP (H12: β = 0.130, t = 4.702, p = 0.000). Since SP directly influences PEP, EE demonstrate a partial mediation effect, supporting H12.
Conversely, LC does not mediate the relationship between SP and EE (H10: β = 0.000, t = 0.106, p = 0.458), indicating that H10 is not supported. Similarly, LC does not mediate the relationship between EA and EE (H13: β = 0.000, t = 0.104, p = 0.459), so H13 is also unsupported. Lastly, EE does not mediate the relationship between LC and PEP (H11: β = 0.002, t = 0.142, p = 0.444), meaning that H11 is not supported either.

4.5. Moderation Analysis

Table 7 indicates that the environmental ethics (EE) variable is not moderated by innovative climate (IC) in its relationship with perceived environmental performance (PEP). This conclusion is based on the p-value of 0.429, which exceeds the threshold of 0.05, and the path coefficient, which is less than 0.1. Additionally, the t-statistic is below 1.645. Consequently, hypothesis H14 is not supported.

5. Discussion

The results of this study indicate that environmental ethics (EE) and stakeholder pressure (SP) significantly influence perceived environmental performance (PEP), thereby supporting hypotheses three and seven (H3 and H7). This aligns with the findings of Xie et al. [36], who reported that both EE and SP positively impact green product and process innovation, which in turn affects PEP. Conversely, environmental awareness (EA) did not influence PEP, contradicting the claims made by those authors.
While EE enhances PEP, the moderating effect of innovative climate (IC) was not significant, failing to support hypothesis fourteen (H14). In comparison, Erkmen et al. [27] proposed that IC lessens the effect of EE on PEP, which is not the case in this study, where IC did not moderate the impact of EE on PEP. This could be attributed to firms focusing on meeting immediate operational needs rather than fostering an atmosphere conducive to innovation. Additionally, the study discovered that EA and SP both predict EE, hence confirming hypotheses 1 and 5 (H1 and H5). This supports the claims made by Rui and Lu [39] and Iqbal et al. [72] that SP and EA have a good impact on organizational EE. The rejection of hypothesis four (H4) which implies that leadership commitment (LC) had no effect on EE, could be explained by the setting of the study, which was Lagos State, Nigeria, a developing nation. The influence of LC on EE may be restricted by a number of variables, such as financial constraints, inadequate enforcement of regulations, and prevalent cultural attitudes on environmental issues [73]. These variables are more likely to affect actual environmental effectiveness, which refers to the real, quantifiable effects that an organization has on the environment and can only be evaluated by measurable data, like carbon (iv) oxide emissions, energy use, waste management, and resource utilization, rather than influencing perceived environmental effectiveness, which refers to the perceptions of people, groups, or stakeholders regarding the sustainability initiatives or environmental impact of an organization.
Additionally, the study found that neither EA nor SP affected LC, which does not support hypotheses two and six (H2 and H6), contradicting Su et al. [74] and Brown & Treviño [75]. However, Schwass et al. [76] discovered that EA enhanced leadership commitment in their study “outdoor journeys as a catalyst for enhanced place connectedness and environmental stewardship”, by interviewing nine respondents from three different outward-bound of Canada travelers to understand how outdoor journeys of at least one week in duration influenced their feelings about environmental awareness and stewardship. Their results revealed a significant link between participants’ exposure to natural areas and an elevated sense of connectedness and stewardship towards nature. Additionally, SP might not be enough, as found in this study, to significantly influence LC in manufacturing sectors with little regulatory monitoring, particularly considering actual environmental performance. For instance, Yu et al. [77] examined the relationship between organizational visibility and business environmental responsiveness by surveying 131 firms in China. The study also examined whether stakeholder pressure mediates this link and whether the type of firm ownership influences how strongly organizational visibility, stakeholder pressures, and corporate environmental responsiveness are related. Although the study indicated a positive correlation, SP did not mediate this link and has no discernible relationship with corporate environmental responsiveness. This means that the findings obtained in prior studies overlap with the results of our study.
Furthermore, the EE construct was found to mediate the relationships between both EA and PEP and SP and PEP, supporting hypotheses nine and twelve (H9 and H12). This is in line with Gadenne et al. [56] and Rui & Lu [39]. However, LC did not mediate the relationships between SP and EE, or EA and EE, rejecting hypotheses ten and thirteen (H10 and H13). This is because the mediating role of LC in the relationships between SP and EE or EA and EE is complex. While some research finds no discernible mediation impact [39] other studies indicate that leadership commitment mediates these relationships [49]. Since external pressure might not result in good environmental ethical practices, LC in such a context may have a limited mediation impact due to the absence of robust institutional frameworks and enforcement mechanisms.
Finally, the study indicated that EE do not mediate the relationship between LC and PEP, failing to support hypothesis eleven (H11) in the context of manufacturing companies in Lagos State, Nigeria. This aligns with the study of Miller et al. [78], who found that this relationship might not always be true, particularly in situations when businesses encounter operational difficulties that make it difficult to apply environmental ethical practices. Due to a lack of external assessments, manufacturing firms in Lagos State may believe that they are environmentally efficient even when their actual environmental performance is below optimal.

6. Limitations and Suggestions for Future Research

This study has its limitations, just like any other. First, the sample of this study is limited to manufacturing firms in Lagos State, Nigeria, which may limit the generalizability of the findings. To improve the external validity and broaden the applicability of this study, future research should expand the sample scope to include more regions and industries, such as construction, services, or agriculture, to enhance the external validity of the results. Future studies could broaden the geographic scope of the sample to include different parts of Nigeria, like the northern and eastern states, which might have various social, economic, and environmental circumstances.
Second, the study considered multiple contributing variables, such as LC, SP, EA, EE, and IC. However, there might be other control variables that could substantially affect PEP. For instance, firm size may affect how people think and act in relation to the environment, and technological level could determine the organizational ability to successfully adopt and oversee sustainable practices. As such, future research should account for these possible control variables to improve the precision and reliability of the research findings.
Thirdly, the finding that the IC does not significantly moderate the relationship between EE and PEP is inconsistent with some existing studies. As such, the lack of a significant moderating effect in this study raises critical questions and calls for additional research. It is recommended that future studies explore the possible impact of sample characteristics, such as industrial type and organizational culture, which may affect how innovation is viewed and operationalized in the Nigerian manufacturing sector.
Fourthly, the cross-sectional nature of this study makes it impossible to establish causal relationships among the studied variables due to the nature of collecting data at a single moment in time. Therefore, it is recommended that experimental or longitudinal methods be used in future studies to more accurately identify the causal relationships among the studied variables in monitoring changes over time, providing a greater understanding of the long-term effects.

7. Conclusions

The conclusions drawn from this study have implications for both practitioners and academics. The findings indicate that EA predicts EE but does not predict LC. Additionally, PEP is predicted by EE and SP, while EA does not have a predictive effect on PEP. It is noteworthy that LC does not predict EE, and SP does not predict LC; however, SP does predict EE. The study further establishes that EE mediate the relationship between EA and PEP, as well as the influence of SP on PEP, but do not mediate the relationship between LC and PEP. Moreover, LC does not mediate the relationship between SP and EE, nor between EA and EE. The results also indicate that innovative climate (IC) does not moderate the influence of EE on PEP.
Empirically, previous research in the field of environmental ethics has often proposed a link between these variables but provided limited empirical support. This study contributes evidence regarding the effects of EA on EE and the influence of EE and SP on PEP. Both academics and practitioners are now increasingly aware of the potential consequences of EE.

7.1. Managerial Recommendations

As a result of this study, managers may cultivate a culture that is driven by sustainability and make environmental ethics a fundamental value that is in line with the organization’s long-term objectives. Furthermore, by putting sustainability first, businesses may establish a reputation as conscientious citizens and draw in investors and customers who care about the environment and corporate social responsibility (CSR). Managers must make sure that all stakeholders understand the company’s commitment to sustainability.

7.2. Practical Policy Recommendations

There should be policies that encourage cooperation across stakeholders, such as communities, suppliers, and consumers. In addition, policies that encourage sustainability in all aspects of an organization’s operations should be put in place, with an emphasis on waste reduction, energy conservation, and ethical material procurement.

Author Contributions

Conceptualization, methodology, validation, formal analysis, investigation, resources, data curation, writing—original draft preparation, visualization, O.M.A.; supervision, T.A. All authors have read and agreed to the published version of the manuscript.

Funding

This research received no external funding.

Institutional Review Board Statement

The study titled “Exploring the Interplay of Stakeholder Pressure, Environmental Awareness, and Environmental Ethics on Perceived Environmental Performance: Insights from the Nigerian Manufacturing Sector”, conducted by PhD student Oluwaleke MICHEAL AWONAIKE (Student ID: 22211020), under the supervision of Prof. Dr. Tarık ATAN, was unanimously approved by the Cyprus International University (CIU) Scientific Research and Publication Ethics Committee during its meeting held on 14 May 2025, with decision number EKK24 25/11/01.

Informed Consent Statement

Informed consent was obtained from all subjects involved in the study.

Data Availability Statement

The data presented in this study are available on request from the corresponding author.

Conflicts of Interest

The authors declare no conflicts of interest.

Abbreviations

The following abbreviations are used in this manuscript:
AVEAverage variance extracted
CSRCorporate social responsibility
EAEnvironmental awareness
EEEnvironmental ethics
EPAEnvironmental protection agency
ICInnovative climate
LCLeadership commitment
PEPPerceived environmental performance
PLS-SEMPartial least squares structural equation modeling
SPStakeholder pressure
SPSSStatistical Package for the Social Sciences
UAEUnited Arab Emirates
UNESCOUnited Nations Educational, Scientific, and Cultural Organization
VIFVariance inflation factor

Appendix A

VariableItemsMeasuresSource
Environmental EthicsEE1Green procurement or investment for the environment is included in the company’s budget planRui and Lu [39]
EE2The company has a clear environmental policy
EE3The corporate culture emphasizes environmentally sustainable development
EE4Employees are encouraged to learn, communicate and share environmental information and ideas
EE5The company implements its environmental vision and mission into its daily business activities
Environmental AwarenessEA1Attach importance to the enterprise’s adverse impact on the natural environmentGadenne et al. [56]
EA2Environmental regulations have a major impact on the company
EA3Advocating environmental protection is good for the development of enterprises
EA4Adopting environmental practices can reduce the cost of enterprises
EA5Adopting environmental practices can improve the production efficiency of enterprises
Perceived Environmental PerformancePEP1Our firm reduced wastes and emissions from operations.Paillé et al. [57]
PEP2Our firm reduced the environmental impacts of its products/service.
PEP3Our firm reduced environmental impact by establishing partnerships.
PEP4Our firm reduced the risk of environmental accidents, spills, and releases.
PEP5Our firm reduced purchases of non-renewable materials, chemicals, and components.
Leadership CommitmentLC1The top management of my company is committed to protecting nature.Banerjee et al. [58]
LC2My company’s environmental efforts receive full support from top management
LC3My company’s environmental strategies are driven by top management.
Stakeholder PressureSP1Environmental groups and organizations require our company to improve our environmental performanceLee et al. [55]
SP2Our customers require our company to improve our environmental performance
SP3The government requires our company to improve our environmental performance
SP4Our supply chains and business partners require our company to improve our environmental performance
Innovative ClimateIC1Our company provides time and resources for employees to generate, share/exchange, and experiment with innovative ideas/solutions.Popa et al. [59]
IC2Our employees are working in diversely skilled work groups where there is free and open communication among the group members.
IC3Our employees frequently encounter non-routine and challenging work that stimulates creativity.
IC4Our employees are recognized and rewarded for their creativity and innovative ideas.

References

  1. Alessa, N.; Akparep, J.Y.; Sulemana, I.; Agyemang, A.O. Does stakeholder pressure influence firms environmental, social and governance (ESG) disclosure? Evidence from Ghana. Cogent Bus. Manag. 2024, 11, 2303790. [Google Scholar] [CrossRef]
  2. Scott, W.R. Institutions and Organizations: Ideas and Interests; SAGE: Thousand Oaks, CA, USA, 2008; 281p. [Google Scholar]
  3. Tsinopoulos, C.; Sousa, C.M.P.; Yan, J. Process Innovation: Open Innovation and the Moderating Role of the Motivation to Achieve Legitimacy. J. Prod. Innov. Manag. 2018, 35, 27–48. [Google Scholar] [CrossRef]
  4. Fuller, R.; Landrigan, P.J.; Balakrishnan, K.; Bathan, G.; Bose-O’Reilly, S.; Brauer, M.; Caravanos, J.; Chiles, T.; Cohen, A.; Corra, L.; et al. Pollution and health: A progress update. Lancet Planet. Health 2022, 6, e535–e547. [Google Scholar] [CrossRef] [PubMed]
  5. United States Environmental Protection Agency. Quality Assurance Guidance Document-Model Quality Assurance Project Plan for the PM Ambient Air; United States Environmental Protection Agency: Washington, DC, USA, 2001. Available online: https://extapps.dec.ny.gov/data/DecDocs/C915279/Work%20Plan.BCP.C915279.2017-11-13.RI_Work_Plan-FINAL-Appendix_B5-USEPA_Compliance_Order-September_2011.pdf (accessed on 1 January 2025).
  6. Helliwell, J.F.; Layard, R.; Sachs, J.; De Neve, J.E. World Happiness Report 2020. 2020. Available online: https://www.wellbeingintlstudiesrepository.org/hw_happiness/1/ (accessed on 4 December 2024).
  7. Elliot, S.; Webster, J. Editorial: Special issue on empirical research on information systems addressing the challenges of environmental sustainability: An imperative for urgent action. Inf. Syst. J. 2017, 27, 367–378. [Google Scholar] [CrossRef]
  8. Trizotto, R.C.A.; Nascimento, L.D.S.; da Silva, J.P.T.; Zawislak, P.A. Sustainability, business strategy and innovation: A thematic literature review. Sustain. Account. Manag. Policy J. 2024, 15, 1338–1377. [Google Scholar] [CrossRef]
  9. Choi, J.N.; Chang, J.Y. Innovation implementation in the public sector: An integration of institutional and collective dynamics. J. Appl. Psychol. 2009, 94, 245–253. [Google Scholar] [CrossRef]
  10. Sun, G.; Sulemana, I.; Agyemang, A.O. Examining the Impact of Stakeholders’ Pressures on Sustainability Practices. Manag. Decis. 2025. [Google Scholar] [CrossRef]
  11. Haleem, F.; Farooq, S.; Cheng, Y.; Waehrens, B.V. Sustainable management practices and stakeholder pressure: A systematic literature review. Sustainability 2022, 14, 1967. [Google Scholar] [CrossRef]
  12. Shahzad, M.; Qu, Y.; Ur Rehman, S.; Ding, X.; Razzaq, A. Impact of stakeholders’ pressure on green management practices of manufacturing organizations under the mediation of organizational motives. J. Environ. Plan. Manag. 2023, 66, 2171–2194. [Google Scholar] [CrossRef]
  13. Ojo, A.O.; Fauzi, M.A. Environmental awareness and leadership commitment as determinants of IT professionals engagement in Green IT practices for environmental performance. Sustain. Prod. Consum. 2020, 24, 298–307. [Google Scholar] [CrossRef]
  14. Kohler, I.V.; Kämpfen, F.; Ciancio, A.; Mwera, J.; Mwapasa, V.; Kohler, H.P. Curtailing COVID-19 on a dollar-a-day in Malawi: Role of community leadership for shaping public health and economic responses to the pandemic. World Dev. 2022, 151, 105753. [Google Scholar] [CrossRef] [PubMed]
  15. Zancajo, A.; Fontdevila, C.; Verger, A.; Bonal, X. Regulating Public-Private Partnerships, Governing Non-State Schools: An Equity Perspective: Background Paper for UNESCO Global Education Monitoring Report; UNESCO: Paris, France, 2021. [Google Scholar]
  16. Muttakin, M.B.; Khan, A. CEO tenure, board monitoring and competitive corporate culture: How do they influence integrated reporting? J. Account. Lit. 2023, 47, 75–99. [Google Scholar] [CrossRef]
  17. Aguinis, H.; Rupp, D.E.; Glavas, A. Corporate social responsibility and individual behaviour. Nat. Hum. Behav. 2024, 8, 219–227. [Google Scholar] [CrossRef] [PubMed]
  18. Keller, R.; Engen, S.; Selvaag, S. Testing Visitor Management Strategies to Reduce Human Waste in a Highly Visited National Park in Norway. Facilitating a New Environmental Norm for Visitors to Lofotodden National Park. Norwegian Institute for Nature Research (NINA). 2023. 53p. Available online: https://brage.nina.no/nina-xmlui/handle/11250/3108279 (accessed on 21 November 2024).
  19. Ferris, G.; Fineman, M.A. Vulnerability and the Organisation of Academic Labour; Taylor & Francis: Oxfordshire, UK, 2024; 165p. [Google Scholar]
  20. Robinson, A.; Corcoran, C.; Waldo, J. New Risks in Ransomware: Supply Chain Attacks and Cryptocurrency. Science, Technology, and Public Policy Program Report. May 2022. Available online: https://dash.harvard.edu/handle/1/37373233 (accessed on 18 January 2025).
  21. Schroeder, K.; The ‘Surplus’ of Siem Reap: A Comparative Study of Cambodia’s Urban Recyclers. Student Theses 2015-Present. 2023. Available online: https://research.library.fordham.edu/environ_2015/158 (accessed on 18 January 2025).
  22. Thompson, P.B. Ethics and Environmental Risk Assessment. In Food and Agricultural Biotechnology in Ethical Perspective; Thompson, P.B., Ed.; Springer International Publishing: Cham, Switzerland, 2020; pp. 137–165. [Google Scholar] [CrossRef]
  23. Pellow, D.N. Chapter 6: Environmental Justice. 2023. Available online: https://www.elgaronline.com/edcollchap/book/9781800881136/book-part-9781800881136-14.xml (accessed on 21 November 2024).
  24. Sullivan, R.; Gouldson, A. The Governance of Corporate Responses to Climate Change: An International Comparison. Bus. Strategy Environ. 2017, 26, 413–425. [Google Scholar] [CrossRef]
  25. Delmas, M.A.; Burbano, V.C. The Drivers of Greenwashing. Calif. Manag. Rev. 2011, 54, 64–87. [Google Scholar] [CrossRef]
  26. Poveda-Pareja, E.; Marco-Lajara, B.; Úbeda-García, M.; Manresa-Marhuenda, E. Innovation as a driving force for the creation of sustainable value derived from CSR: An integrated perspective. Eur. Res. Manag. Bus. Econ. 2024, 30, 100241. [Google Scholar] [CrossRef]
  27. Erkmen, T.; Günsel, A.; Altındağ, E. The Role of Innovative Climate in the Relationship between Sustainable IT Capability and Firm Performance. Sustainability 2020, 12, 4058. [Google Scholar] [CrossRef]
  28. Greenwood, R.; Meyer, R.E.; Lawrence, T.B.; Oliver, C. The SAGE Handbook of Organizational Institutionalism. 2017, pp. 1–928. Available online: https://www.torrossa.com/en/resources/an/5018766 (accessed on 21 November 2024).
  29. Ren, S.; Tang, G.; Jackson, S.E. Green human resource management research in emergence: A review and future directions. Asia Pac. J. Manag. 2018, 35, 769–803. [Google Scholar] [CrossRef]
  30. Freeman, R.E. Strategic Management: A Stakeholder Approach; Cambridge University Press: Cambridge, UK, 2010; 294p. [Google Scholar]
  31. Liu, Q.; Cheng, Z.; Chen, M. Effects of environmental education on environmental ethics and literacy based on virtual reality technology. Electron. Libr. 2019, 37, 860–877. [Google Scholar] [CrossRef]
  32. Ak, O.; Kutlu, B. Comparing 2D and 3D game-based learning environments in terms of learning gains and student perceptions. Br. J. Educ. Technol. 2017, 48, 129–144. [Google Scholar] [CrossRef]
  33. Wang, Y.; Sun, M.; Yang, X.; Yuan, X. Public awareness and willingness to pay for tackling smog pollution in China: A case study. J. Clean. Prod. 2016, 112, 1627–1634. [Google Scholar] [CrossRef]
  34. Wu, Q.; Xie, S.; Wang, S.; Zhou, A.; Abruquah, L.A.; Chen, Z. Effects of environmental awareness training and environmental commitment on firm’s green innovation performance: Empirical insights from medical equipment suppliers. PLoS ONE 2024, 19, e0297960. [Google Scholar] [CrossRef] [PubMed]
  35. Singh, S.K.; Chen, J.; Del Giudice, M.; El-Kassar, A.N. Environmental ethics, environmental performance, and competitive advantage: Role of environmental training. Technol. Forecast. Soc. Change 2019, 146, 203–211. [Google Scholar] [CrossRef]
  36. Xie, J.; Abbass, K.; Li, D. Advancing eco-excellence: Integrating stakeholders’ pressures, environmental awareness, and ethics for green innovation and performance. J. Environ. Manag. 2024, 352, 120027. [Google Scholar] [CrossRef]
  37. Mishra, B.; Tikoria, J. Impact of ethical leadership on organizational climate and its subsequent influence on job commitment: A study in hospital context. J. Manag. Dev. 2021, 40, 438–452. [Google Scholar] [CrossRef]
  38. Zhang, N.; Zhang, J. Chinese insurance agents in “bad barrels”: A multilevel analysis of the relationship between ethical leadership, ethical climate and business ethical sensitivity. SpringerPlus 2016, 5, 2078. [Google Scholar] [CrossRef]
  39. Rui, Z.; Lu, Y. Stakeholder pressure, corporate environmental ethics and green innovation. Asian J. Technol. Innov. 2021, 29, 70–86. [Google Scholar] [CrossRef]
  40. D’Souza, C.; Ahmed, T.; Khashru, M.A.; Ahmed, R.; Ratten, V.; Jayaratne, M. The complexity of stakeholder pressures and their influence on social and environmental responsibilities. J. Clean. Prod. 2022, 358, 132038. [Google Scholar] [CrossRef]
  41. Tian, Q.; Liu, Y.; Fan, J. The effects of external stakeholder pressure and ethical leadership on corporate social responsibility in China. J. Manag. Organ. 2015, 21, 388–410. [Google Scholar] [CrossRef]
  42. Yong, J.Y.; Yusliza, M.Y.; Ramayah, T.; Seles, B.M.R.P. Testing the stakeholder pressure, relative advantage, top management commitment and green human resource management linkage. Corp. Soc. Responsib. Environ. Manag. 2022, 29, 1283–1299. [Google Scholar] [CrossRef]
  43. Alt, E.; Díez-de-Castro, E.P.; Lloréns-Montes, F.J. Linking Employee Stakeholders to Environmental Performance: The Role of Proactive Environmental Strategies and Shared Vision. J. Bus. Ethics 2015, 128, 167–181. [Google Scholar] [CrossRef]
  44. Graham, S. The Influence of External and Internal Stakeholder Pressures on the Implementation of Upstream Environmental Supply Chain Practices. Bus. Soc. 2020, 59, 351–383. [Google Scholar] [CrossRef]
  45. Alzghoul, A.; Aboalganam, K.M.; Al-Kasasbeh, O. Nexus among green marketing practice, leadership commitment, environmental consciousness, and environmental performance in Jordanian pharmaceutical sector. Cogent Bus. Manag. 2023, 11, 2292308. [Google Scholar] [CrossRef]
  46. Saifulina, N.; Carballo-Penela, A.; Ruzo-Sanmartín, E. Effects of personal environmental awareness and environmental concern on employees’ voluntary pro-environmental behavior: A mediation analysis in emerging countries. Balt. J. Manag. 2022, 18, 1–18. [Google Scholar] [CrossRef]
  47. de Araujo, F. Do I Look Good In Green? A Conceptual Framework Integrating Employee Green Behavior, Impression Management, and Social Norms. Amaz. Organ. Sustentabilidade 2014, 3, 7–23. [Google Scholar] [CrossRef]
  48. Zailani, S.; Iranmanesh, M.; Nikbin, D.; Jumadi, H.B. Determinants and environmental outcome of green technology innovation adoption in the transportation industry in Malaysia. Asian J. Technol. Innov. 2014, 22, 286–301. [Google Scholar] [CrossRef]
  49. Mansour, M.; Aman, N.; Al-Ghazali, B.M.; Shah, S.H.A. Perceived corporate social responsibility, ethical leadership, and moral reflectiveness impact on pro-environmental behavior among employees of small and medium enterprises: A double-mediation model. Front. Psychol. 2022, 13, 967859. [Google Scholar] [CrossRef]
  50. Wang, C.-H. How organizational green culture influences green performance and competitive advantage: The mediating role of green innovation. J. Manuf. Technol. Manag. 2019, 30, 666–683. [Google Scholar] [CrossRef]
  51. Akhtar, S.; Li, C.; Sohu, J.M.; Rasool, Y.; Hassan, M.I.U.; Bilal, M. Unlocking green innovation and environmental performance: The mediated moderation of green absorptive capacity and green innovation climate. Environ. Sci. Pollut. Res. 2024, 31, 4547–4562. [Google Scholar] [CrossRef]
  52. Enbaia, E.; Alzubi, A.; Iyiola, K.; Aljuhmani, H. The Interplay Between Environmental Ethics and Sustainable Performance: Does Organizational Green Culture and Green Innovation Really Matter? Sustainability 2024, 16, 10230. [Google Scholar] [CrossRef]
  53. Malhotra, N.K. Marketing Research: An Applied Prientation; Pearson: Harlow, UK; New York, NY, USA, 2020; Available online: https://www.pearson.com/en-us/subject-catalog/p/marketing-research-an-applied-orientation/P200000005969/9780137504879?srsltid=AfmBOooqMIvImz1uzx2BbdwSbNNQtPvsiJHctPSp7wvYhnbvEkx84uL8 (accessed on 21 November 2024).
  54. Sarstedt, M.; Ringle, C.M.; Hair, J.F. Partial Least Squares Structural Equation Modeling. In Handbook of Market Research; Homburg, C., Klarmann, M., Vomberg, A., Eds.; Springer International Publishing: Cham, Switzerland, 2022; pp. 587–632. [Google Scholar] [CrossRef]
  55. Lee, J.W.; Kim, Y.M.; Kim, Y.E. Antecedents of Adopting Corporate Environmental Responsibility and Green Practices. J. Bus. Ethics 2018, 148, 397–409. [Google Scholar] [CrossRef]
  56. Gadenne, D.L.; Kennedy, J.; McKeiver, C. An Empirical Study of Environmental Awareness and Practices in SMEs. J. Bus. Ethics 2009, 84, 45–63. [Google Scholar] [CrossRef]
  57. Paillé, P.; Chen, Y.; Boiral, O.; Jin, J. The Impact of Human Resource Management on Environmental Performance: An Employee-Level Study. J. Bus. Ethics 2014, 121, 451–466. [Google Scholar] [CrossRef]
  58. Banerjee, S.B.; Iyer, E.S.; Kashyap, R.K. Corporate Environmentalism: Antecedents and Influence of Industry Type. J. Mark. 2003, 67, 106–122. [Google Scholar] [CrossRef]
  59. Popa, S.; Soto-Acosta, P.; Martinez-Conesa, I. Antecedents, moderators, and outcomes of innovation climate and open innovation: An empirical study in SMEs. Technol. Forecast. Soc. Change 2017, 118, 134–142. [Google Scholar] [CrossRef]
  60. Hair, J.; Sarstedt, M.; Ringle, C.; Gudergan, S. Advanced Issues in Partial Least Squares Structural Equation Modeling; Sage Publications: Thousand Oaks, CA, USA, 2017. [Google Scholar]
  61. Petter, S. “Haters Gonna Hate”: PLS and Information Systems Research. ACM SIGMIS Database DATABASE Adv. Inf. Syst. 2018, 49, 10–13. [Google Scholar] [CrossRef]
  62. Dijkstra, T.K.; Henseler, J. Consistent partial least squares path modeling. MIS Q. 2015, 39, 297–316. [Google Scholar] [CrossRef]
  63. Vinzi, V.E.; Trinchera, L.; Amato, S. PLS Path Modeling: From Foundations to Recent Developments and Open Issues for Model Assessment and Improvement. In Handbook of Partial Least Squares: Concepts, Methods and Applications; Esposito Vinzi, V., Chin, W.W., Henseler, J., Wang, H., Eds.; Springer: Berlin/Heidelberg, Germany, 2010; pp. 47–82. [Google Scholar] [CrossRef]
  64. Hair, J.F.; Anderson, R.E.; Tatham, R.L.; Black, W.C. Multivariate Data Analysis; Prentice Hall: Englewood Cliff, NJ, USA, 1998; Volume 5, pp. 207–2019. [Google Scholar]
  65. Latif, K.F.; Sajjad, A.; Bashir, R.; Shaukat, M.B.; Khan, M.B.; Sahibzada, U.F. Revisiting the relationship between corporate social responsibility and organizational performance: The mediating role of team outcomes. Corp. Soc. Responsib. Environ. Manag. 2020, 27, 1630–1641. [Google Scholar] [CrossRef]
  66. Sarstedt, M.; Hair, J.F.; Ringle, C.M.; Thiele, K.O.; Gudergan, S.P. Estimation issues with PLS and CBSEM: Where the bias lies! J. Bus. Res. 2016, 69, 3998–4010. [Google Scholar] [CrossRef]
  67. Wasko, M.M.; Faraj, S. Why Should I Share? Examining Social Capital and Knowledge Contribution in Electronic Networks of Practice. MIS Q. 2005, 29, 35–57. [Google Scholar] [CrossRef]
  68. Hair, J.F., Jr.; Black, W.C.; Babin, B.J.; Anderson, R.E. Multivariate Data Analysis; Cengage Learning: London, UK, 2018. [Google Scholar]
  69. Henseler, J.; Ringle, C.M.; Sarstedt, M. A new criterion for assessing discriminant validity in variance-based structural equation modeling. J. Acad. Mark. Sci. 2015, 43, 115–135. [Google Scholar] [CrossRef]
  70. Hair, J.F.; Matthews, L.M.; Matthews, R.L.; Sarstedt, M. PLS-SEM or CB-SEM: Updated guidelines on which method to use. Int. J. Multivar. Data Anal. 2017, 1, 107–123. [Google Scholar] [CrossRef]
  71. Byrne, B.M. Structural Equation Modeling with Mplus: Basic Concepts, Applications, and Programming; Routledge: New York, NY, USA, 2011; 432p. [Google Scholar]
  72. Iqbal, K.; Fatima, T.; Naveed, M. The Impact of Transformational Leadership on Nurses’ Organizational Commitment: A Multiple Mediation Model. Eur. J. Investig. Health Psychol. Educ. 2020, 10, 262–275. [Google Scholar] [CrossRef]
  73. Ren, S.; Tang, G.; Jackson, S.E. Effects of Green HRM and CEO ethical leadership on organizations’ environmental performance. Int. J. Manpow. 2021, 42, 961–983. [Google Scholar] [CrossRef]
  74. Su, X.; Lin, W.; Wu, J.; Zheng, Q.; Chen, X.; Jiang, X. Ethical Leadership and Knowledge Sharing: The Effects of Positive Reciprocity and Moral Efficacy. Sage Open 2021, 11, 21582440211021823. [Google Scholar] [CrossRef]
  75. Brown, M.E.; Treviño, L.K. Ethical leadership: A review and future directions. Leadersh. Q. 2006, 17, 595–616. [Google Scholar] [CrossRef]
  76. Schwass, N.R.; Potter, S.E.; O’Connell, T.S.; Potter, T.G. Outdoor journeys as a catalyst for enhanced place connectedness and environmental stewardship. J. Outdoor Environ. Educ. 2021, 24, 215–231. [Google Scholar] [CrossRef]
  77. Yu, J.; Lo, C.W.-H.; Li, P.H.Y. Organizational Visibility, Stakeholder Environmental Pressure and Corporate Environmental Responsiveness in China. Bus. Strategy Environ. 2017, 26, 371–384. [Google Scholar] [CrossRef]
  78. Miller, J.; Balthrop, A.; Davis-Sramek, B.; Richey, R.G. Unobserved variables in archival research: Achieving both theoretical and statistical identification. J. Bus. Logist. 2023, 44, 292. [Google Scholar] [CrossRef]
Figure 1. Research framework. Source: survey data (2025).
Sustainability 17 04870 g001
Figure 2. Measurement model. Source: survey data (2025).
Sustainability 17 04870 g002
Figure 3. Structural equation model. Source: survey data (2025).
Sustainability 17 04870 g003
Table 1. Frequency distribution of the demographic variables. Source: survey data (2025).
FrequencyPercentage
Gender
    Male17645.6
    Female21054.4
Age
    Under 25 years143.6
    25–40 years29476.2
    Over 40 years7820.2
Ownership
    Government-owned92.3
    Private-owned29177.7
    Other8620.0
Tenure
    Less than 4 years18347.4
    4–6 years9725.1
    6–8 years6115.8
    8–10 years266.7
    Over 10 years194.9
Marital Status
    Married20553.1
    Single16041.5
    Divorced or widowed215.4
Table 2. Validity and reliability test. Source: survey data (2025).
ConstructOuter
Loadings
Cronbach’s
Alpha
(rho_a)CR
(rho_c)
AVEVIF
SP10.7630.8130.8240.8760.6401.704
SP20.836 1.864
SP30.796 1.914
SP40.802 1.871
EA10.7990.8410.8570.8860.6092.005
EA20.808 2.121
EA30.831 2.391
EA40.671 1.816
EA50.782 2.124
LC10.8630.7790.8300.8610.6751.636
LC20.735 1.686
LC30.861 1.534
EE10.8510.8970.9030.9240.7072.421
EE20.871 2.700
EE30.859 2.540
EE40.783 1.984
EE50.838 2.283
IC10.9010.8800.9140.9130.7253.674
IC20.890 2.419
IC30.862 2.063
IC40.746 2.529
PEP10.8110.8960.9100.9240.7082.196
PEP20.913 4.191
PEP30.839 2.915
PEP40.872 2.506
PEP50.765 1.946
Table 3. Heterotrait–monotrait ratio (HTMT) discriminant validity results. Source: survey data (2025).
EAEEICLCPEPSP
EA
EE0.800
IC0.1130.054
LC0.0580.0320.305
PEP0.5390.5940.0820.052
SP0.7630.7920.0540.0610.560
Table 4. Fornell–Larcker criterion discriminant validity results. Source: survey data (2025).
EAEEICLCPEPSP
EA0.780
EE0.7190.841
IC0.0890.0520.852
LC0.0340.0100.2310.822
PEP0.4800.5480.0800.0020.842
SP0.6590.6900.030−0.0280.4900.800
Table 5. Direct relationship analysis results. Source: survey data (2025).
Path CoefficientsStandard DeviationT-Statisticsp-Values
H1: EA → EE0.4790.04311.2040.000
H2: EA → LC0.0930.0990.9330.176
H3: EE → PEP0.5430.03714.5860.000
H4: LC → EE0.0040.0330.1260.450
H5: SP → EE0.3710.0399.3960.000
H6: SP → LC−0.0900.0861.0490.147
H7: SP → PEP0.1850.0662.7840.003
H8: EA → PEP0.1070.0841.2810.100
R2 EE = 0.600Q2 EE = 0.594
R2 LC = 0.006Q2 LC = −0.017
R2 PEP = 0.332Q2 PEP = 0.271
Table 6. Mediation analysis result. Source: survey data (2025).
Path CoefficientsStandard DeviationT-Statistics p-Values
H9: EA → EE → PEP0.1590.0344.6310.000
H10: SP → LC → EE0.0000.0040.1060.458
H11: LC → EE → PEP0.0020.0120.1420.444
H12: SP → EE → PEP0.1300.0284.7020.000
H13: EA → LC → EE0.0000.0040.1040.459
Table 7. Moderation Analysis Result. Source: Survey Data (2025).
Path CoefficientsStandard DeviationT-Statisticsp-Values
H14: IC × EE → PEP0.0080.0430.1790.429
Disclaimer/Publisher’s Note: The statements, opinions and data contained in all publications are solely those of the individual author(s) and contributor(s) and not of MDPI and/or the editor(s). MDPI and/or the editor(s) disclaim responsibility for any injury to people or property resulting from any ideas, methods, instructions or products referred to in the content.

