


Assessing Supply and Demand Discrepancies of Urban Green Space in High-Density Built-Up Areas Based on Vitality Impacts: Evidence from Beijing’s Central Districts, China


Abstract
1. Introduction
2. Materials and Methods
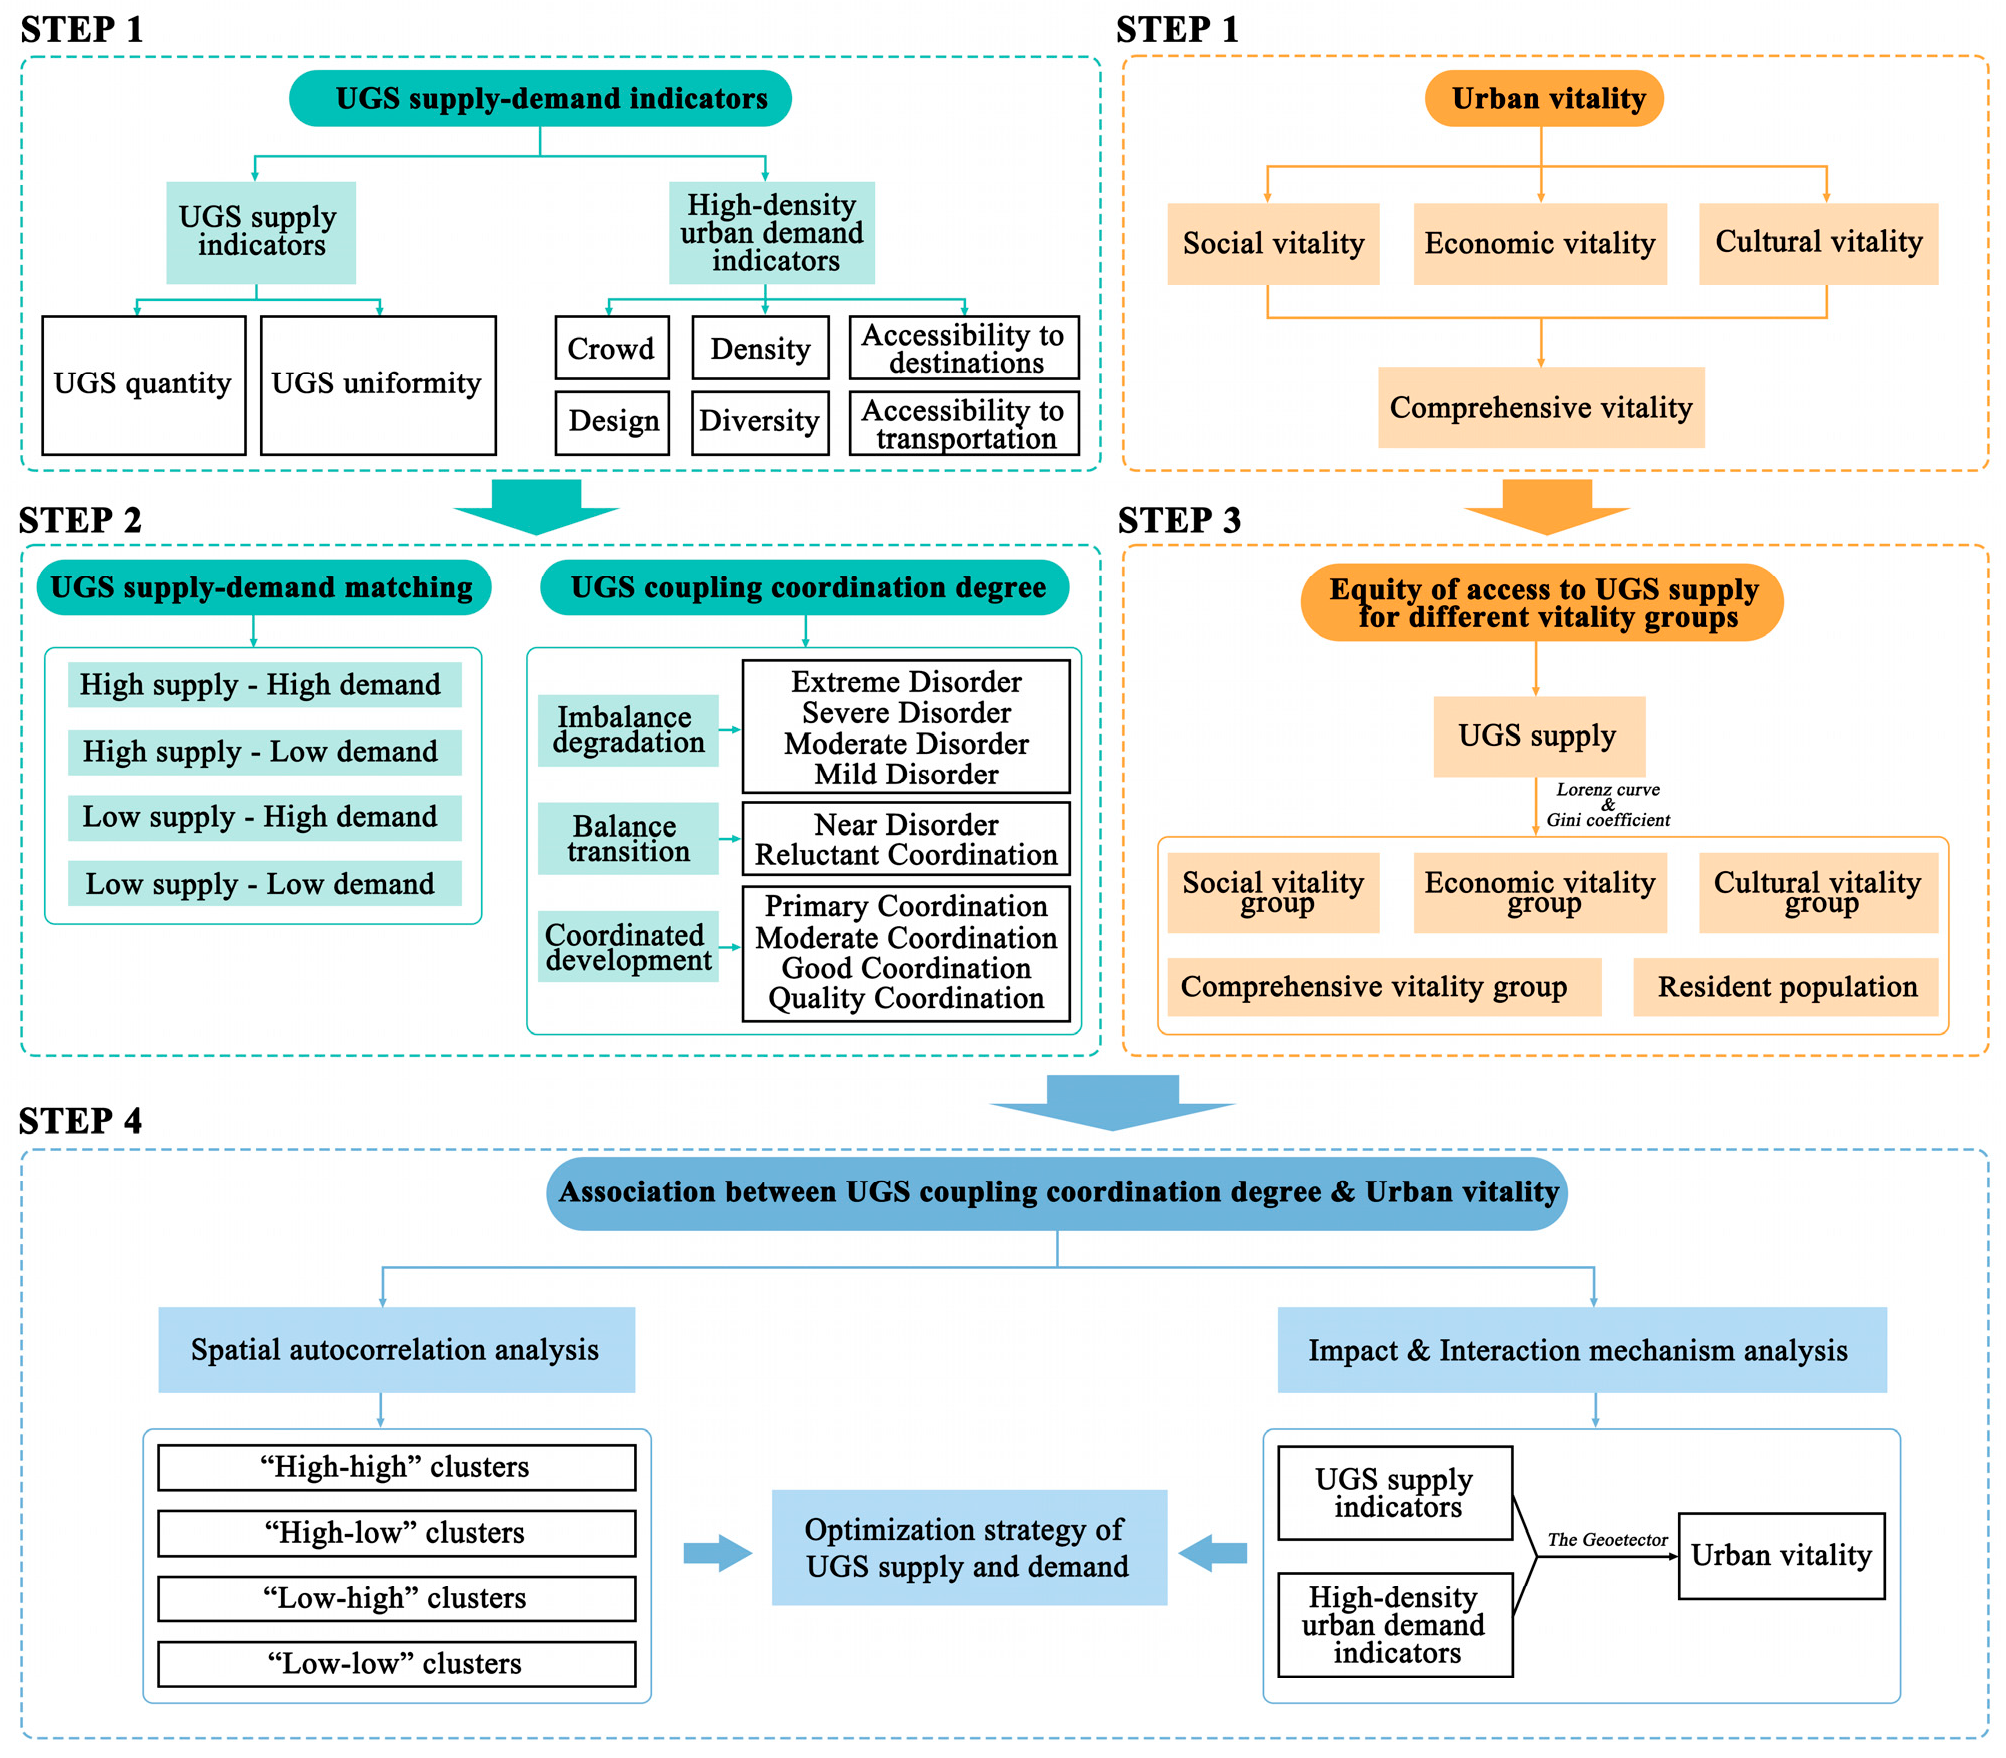
2.1. Methodological Framework
2.2. Study Area
2.3. Data Source and Pre-Processing
2.4. Methods
2.4.1. Construction of UGS Supply and Demand Indicators System
2.4.2. UGS Supply-Demand Matching and Coupling-Coordination Degree
2.4.3. The Lorenz Curve and the Gini Coefficient
2.4.4. Spatial Autocorrelation Analysis
2.4.5. The Geodetector
3. Results
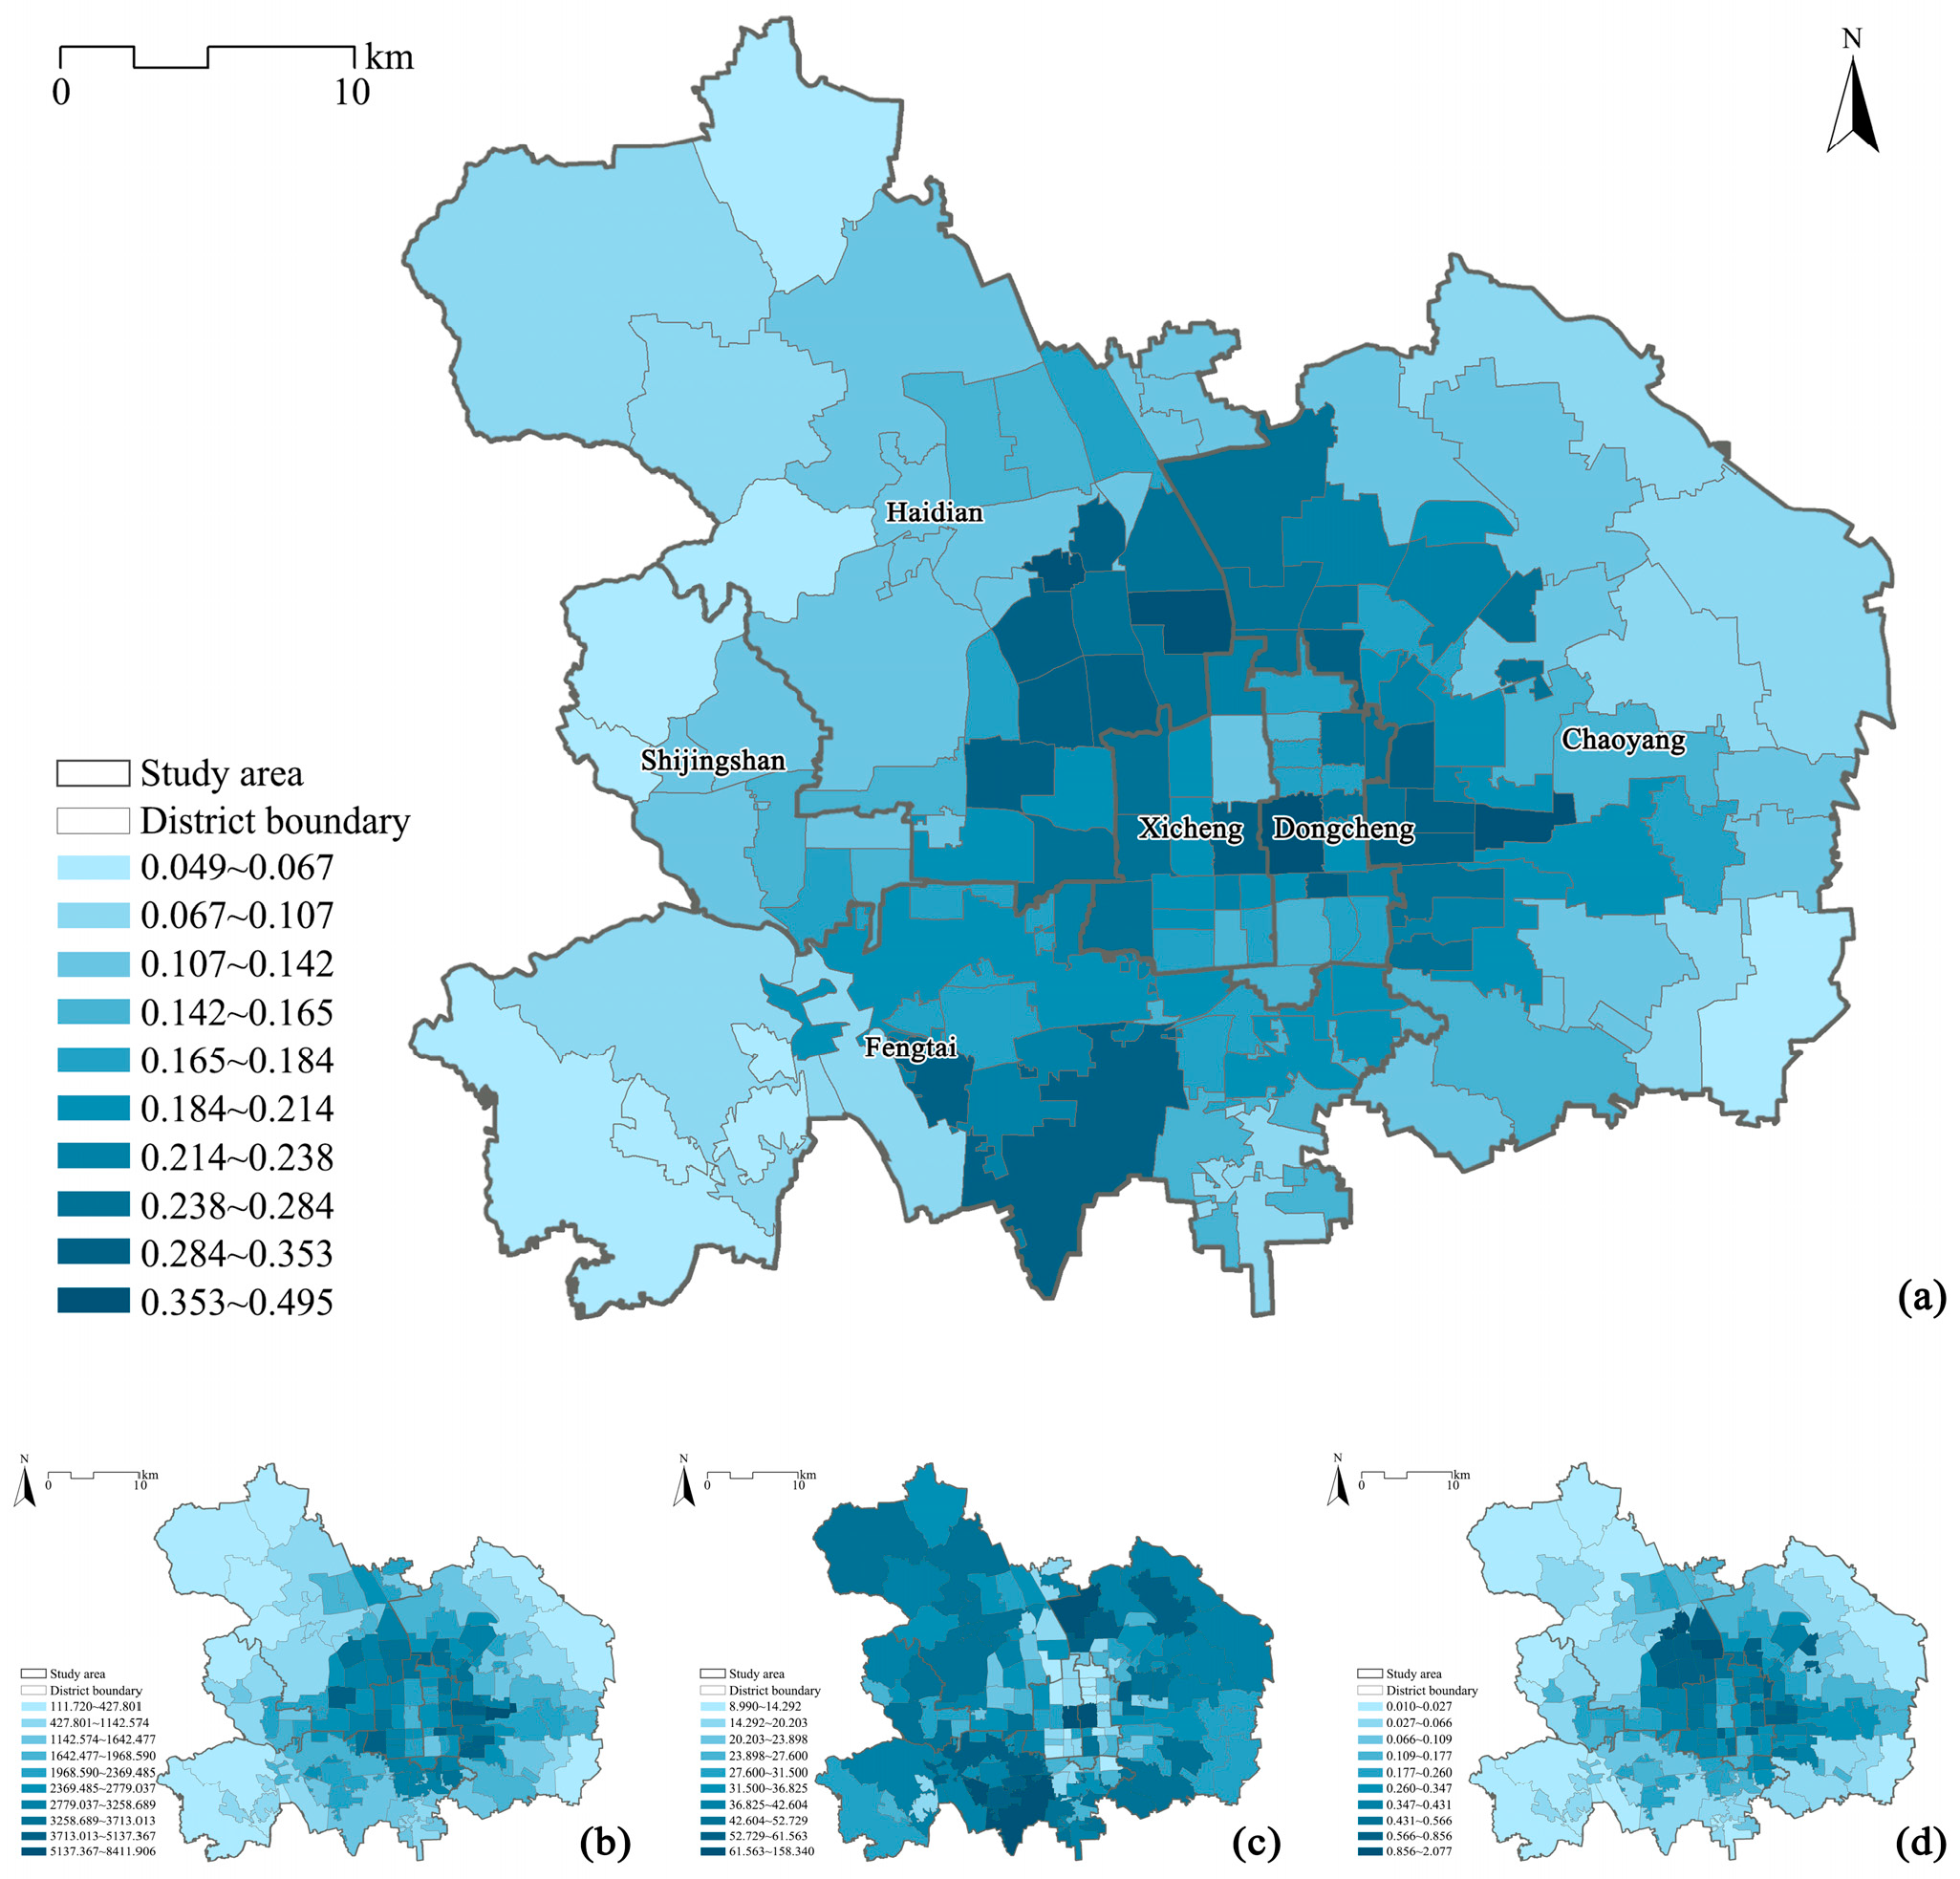
3.1. Spatial Patterns of UGS Supply and High-Density Urban Demand
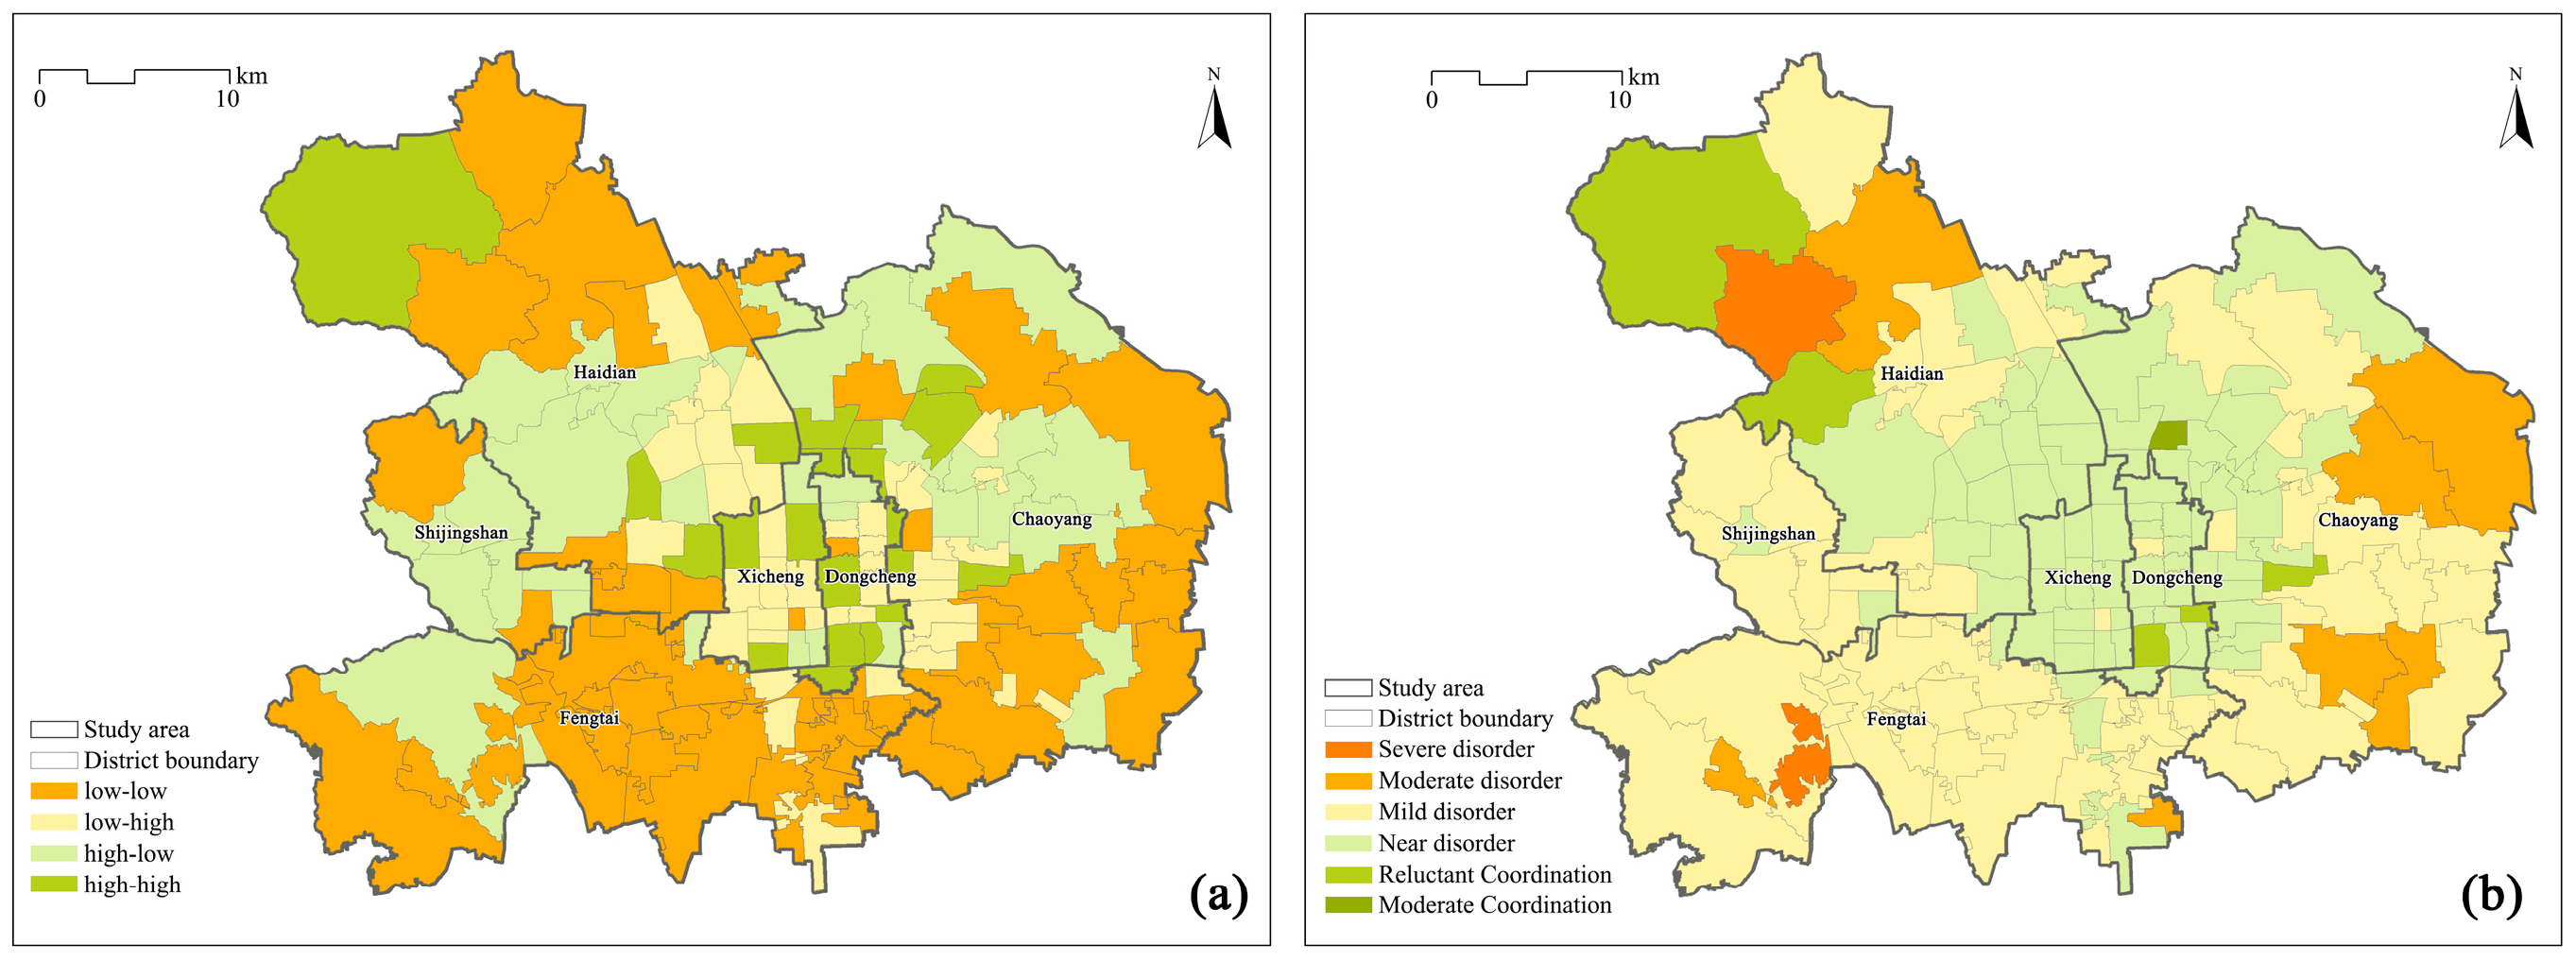
3.2. Coupling Coordination and Spatial Matching Characteristics of UGS Supply and Demand
3.3. Distribution of Vitality in High-Density Built-Up Areas
3.4. Balance-of-Differences Analysis of UGS Supply
3.5. Spatial Autocorrelation Analysis of the UGS Supply-Demand Coupling-Coordination Degree
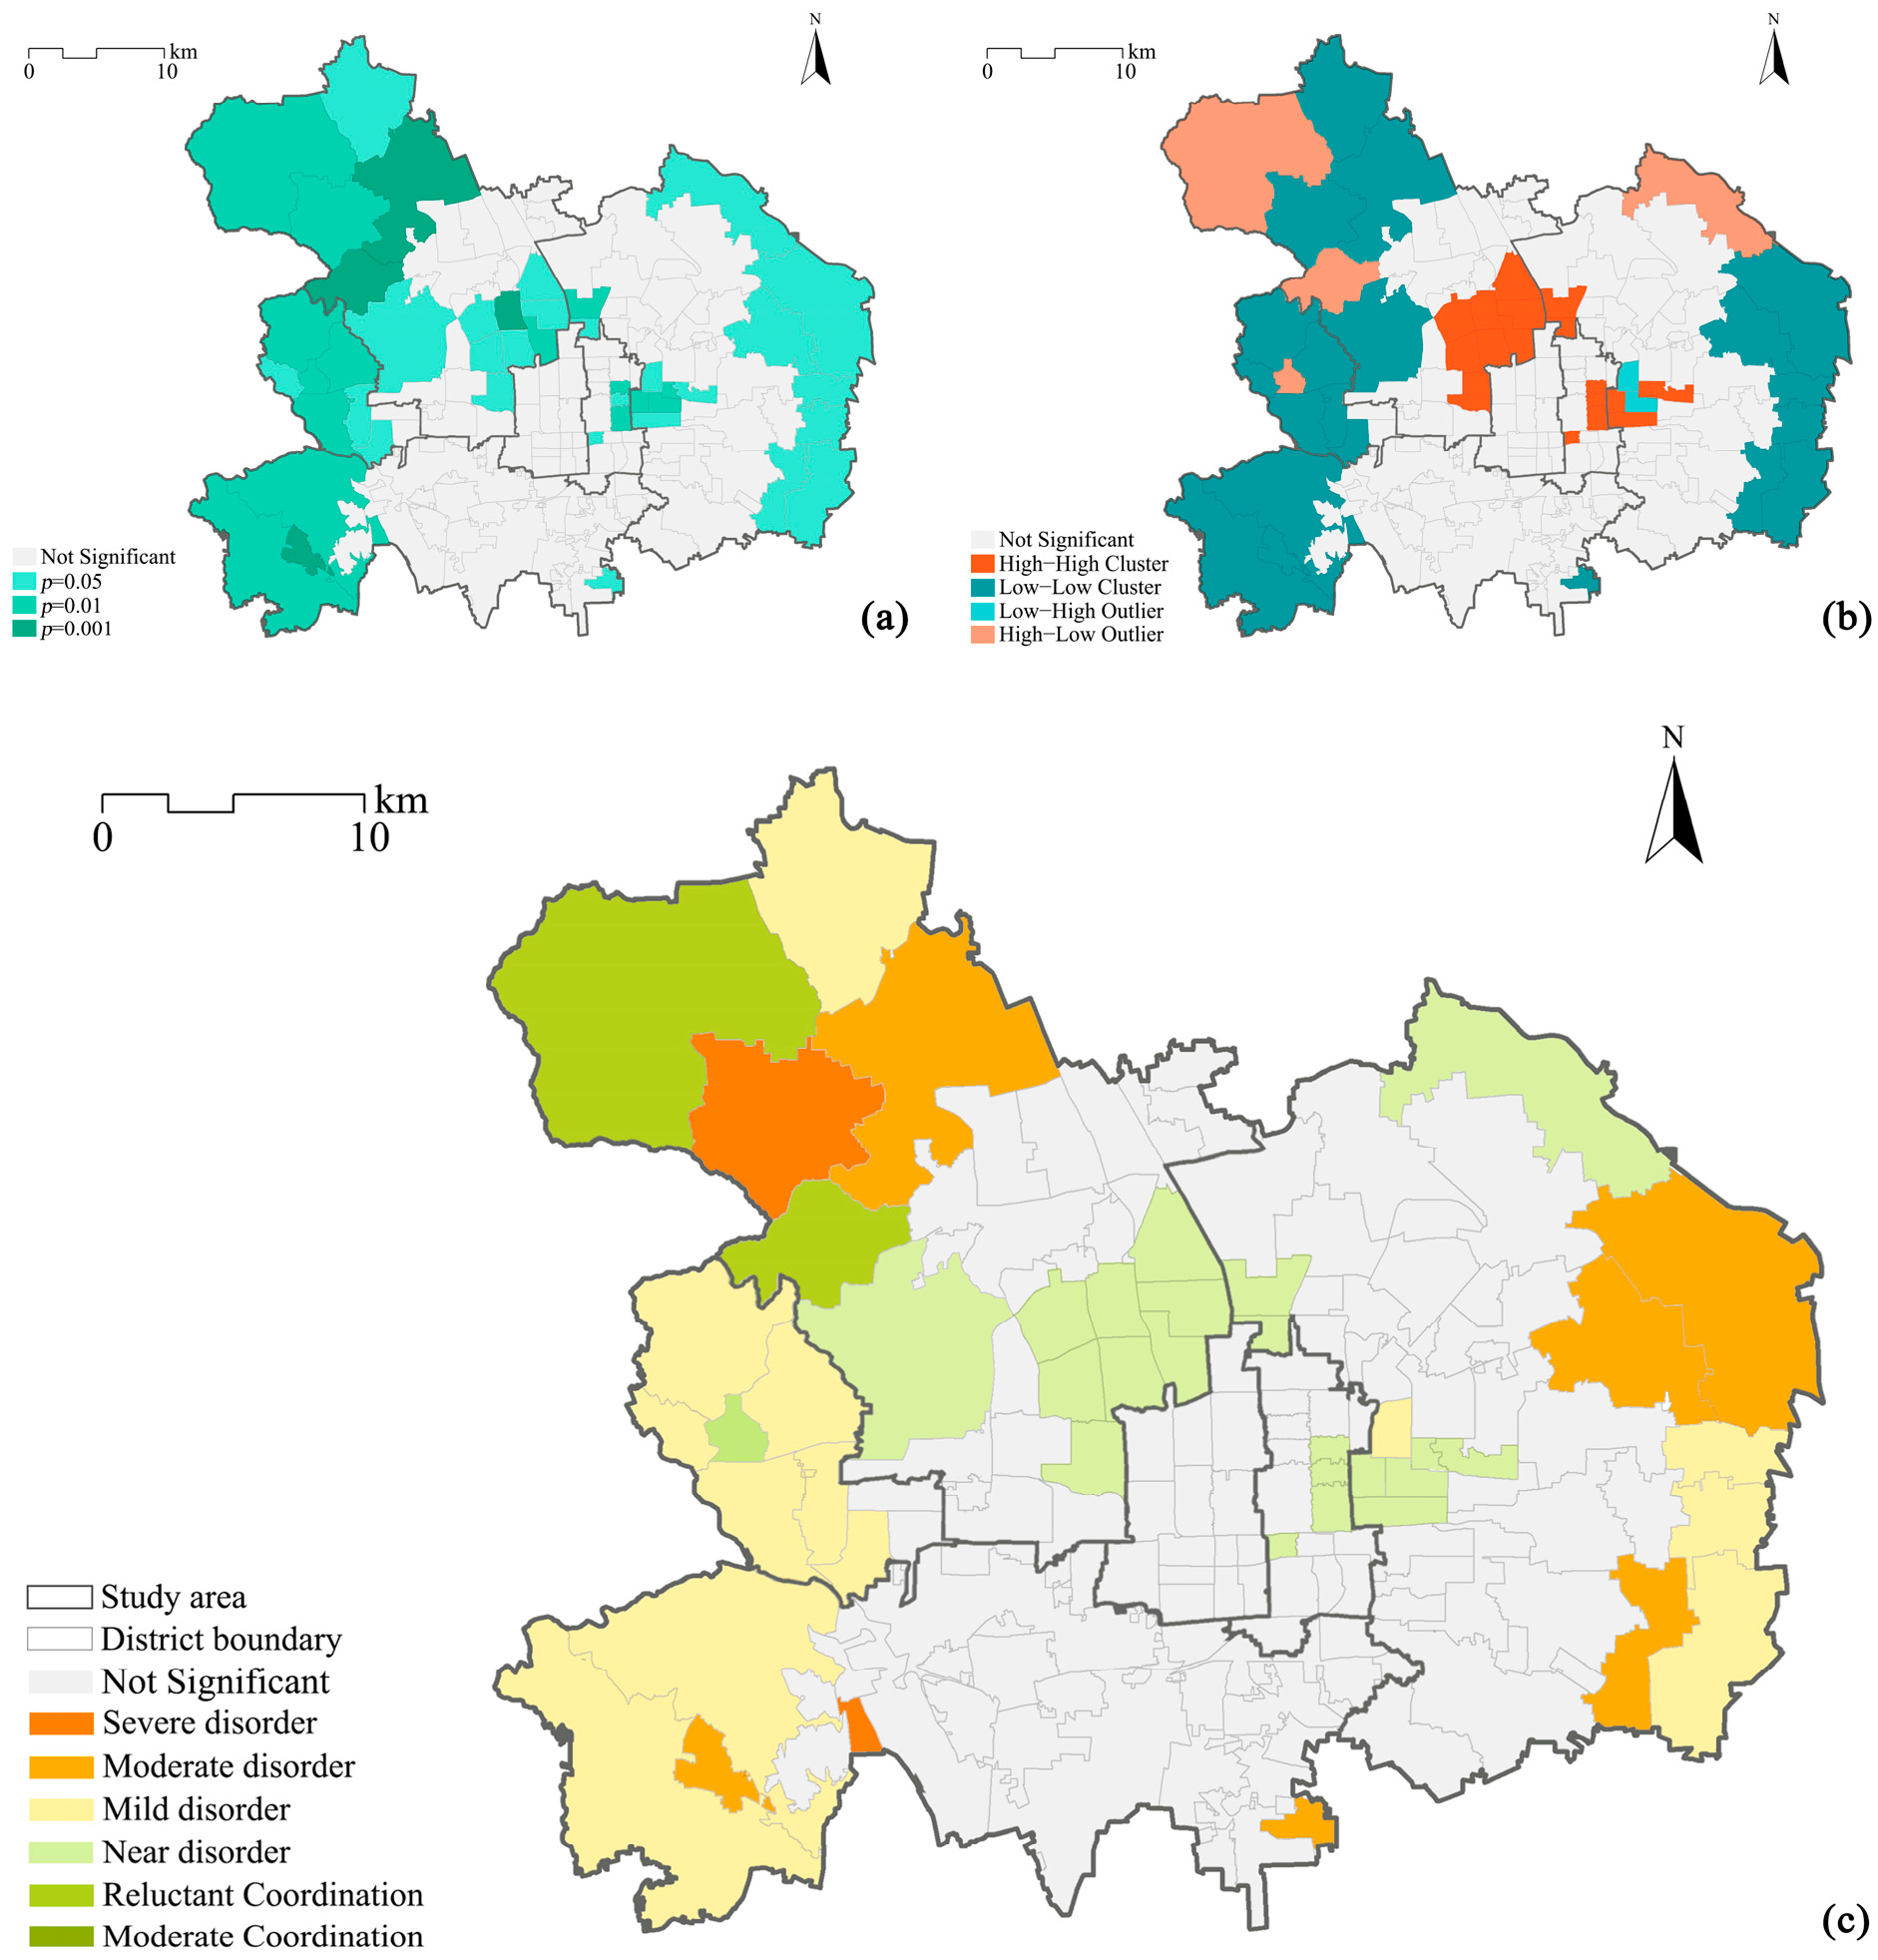
3.6. Spatial Autocorrelation Characteristics of UGS Supply-Demand Coupling Coordination and Urban Vitality
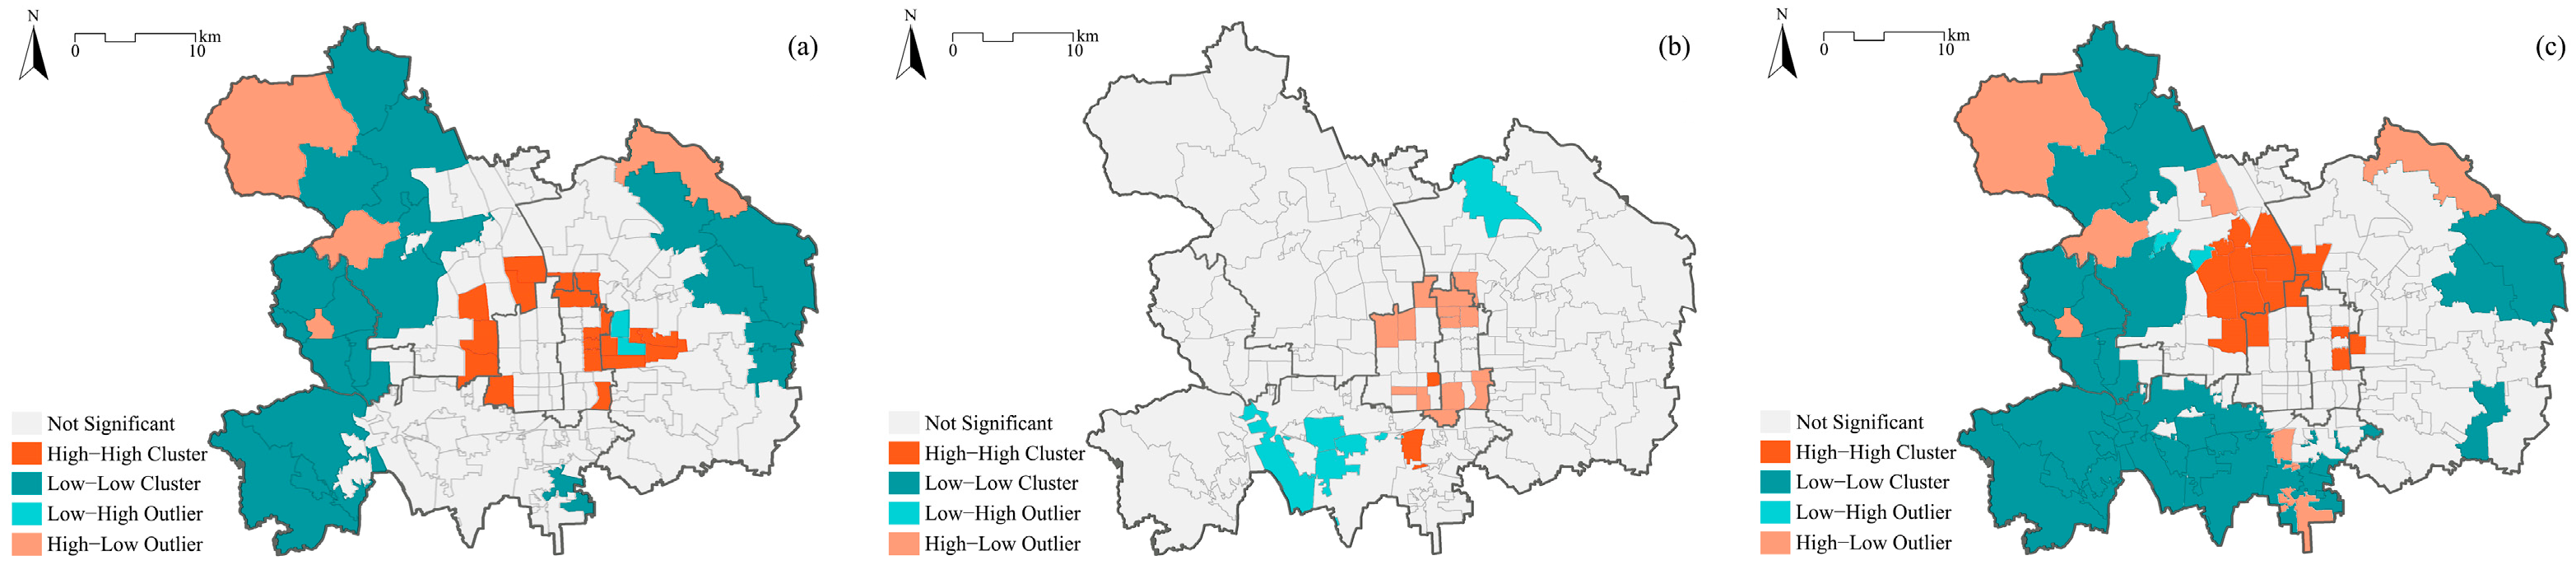
- (1)
- The “High-High” clusters accounted for a relatively small proportion and were mainly distributed in the central areas of the study region. In Haidian District, they were found in subdistricts like Xueyuan Road, Zhongguancun, Huayuan Road, and Beixiaguan, characterized by a dense and diverse UGS layout. These areas, focused on ecological protection and quality improvement, also feature a high level of UGS supply-demand coordination, with abundant educational and cultural facilities, such as universities and science parks. In Chaoyang District, “High-High” clusters were found in subdistricts like Dongsi, Chaowai, and Hujialou, where UGS are well-distributed and economic activities are active. These areas prioritize street-level greening and quality improvement of UGS.
- (2)
- The “Low-Low” clusters comprised the largest proportion and were located on the east and west sides of the study area, including some subdistricts in Chaoyang, Haidian, Shijingshan, and Fengtai Districts. On the western side, although large-scale forest and waterfront parks exist, their limited accessibility and proximity to the ecological control zone result in lower urban development and vitality. On the eastern side, UGSs are fewer and mostly located within restricted or ecological control zones, contributing to lower urban infrastructure development and vitality compared to the central areas.
- (3)
- The “Low-High” clusters represented the smallest proportion, only found in the central part adjacent to the study area in the Sanlitun and Hujialou subdistricts of Chaoyang District. This is due to their location within the centers of important commercial and economic activities, with strong economic activities within the subdistricts, resulting in an imbalance between supply and demand of UGS in the area, and the supply level of UGS is extremely low, while the high-density urban demand is extremely high.
- (4)
- The “High-Low” clusters were characterized by a concentration in the northwest of the study area, including Sujiatuo and Xiangshan subdistricts in Haidian District, Sunhe subdistrict in Chaoyang District, and Jinding Road subdistrict in Shijingshan District. These areas offer abundant high-quality forest parks, scenic spots, and suburban parks, offering a good UGS supply. Their proximity to major science and technology and industrial zones contributes to moderate urban demand, resulting in a relatively balanced supply-demand situation. However, their distance from central urban areas leads to lower overall vitality, forming the “High-Low” aggregation pattern.
3.7. Factor Detection of UGS Supply and Demand Indicators for Urban Vitality
4. Discussion
4.1. Selection of Model and Indicators
4.2. UGS Supply and Demand and Its Association with Urban Vitality
- (1)
- In central Beijing, UGS supply showed a spatial pattern with higher availability in the central, western, and northern regions, while demand was highest in the central area, decreasing towards the periphery. This finding aligns with previous studies [57].
- (2)
- (3)
- Specifically, 60.77% of areas achieved balanced UGS supply-demand coordination, while 28.42% experienced oversupply and 10.81% faced undersupply. Central areas, with higher construction density, featured smaller and more fragmented UGS, while northern areas tended to feature larger and more contiguous UGS, leading to oversupply in those zones.
- (4)
- Compared to groups defined by static demographic data, those identified through composite vitality metrics—reflecting dynamic behavior patterns—tended to experience more equitable access to UGS resources. Among the single-dimension vitality groups, cultural vitality showed the greatest equity in UGS access, followed by social vitality, with economic vitality exhibiting the least access. These groups, influenced by vitality, were better able to select spatial environments suited to their needs [60]. Moreover, disparities in UGS quality highlight the need to consider the specific modes of access and usage preferences of different vitality groups [61,62].
- (5)
- The UGS supply-demand system exhibited a positive agglomeration effect, with high-high clusters concentrated in subdistricts in central Haidian, Chaoyang, Dongcheng, Xicheng, and Fengtai Districts. These subdistricts and adjacent areas exhibited high coupling-coordination values, underscoring the influence of spatial proximity.
- (6)
- A significant correlation was found between UGS supply-demand coupling coordination and urban vitality. In central districts like Haidian, Chaoyang, and Fengtai, high-high clusters of UGS coordination were associated with comprehensive vitality, while low-low clusters predominated in peripheral areas. Social and cultural vitality appeared to increase with better UGS supply-demand coordination, whereas economic vitality showed a potential negative correlation [63]. Despite the indication of this possibility, further discussion is warranted regarding the balance between UGS supply and demand and economic vitality [64]. Economically prosperous areas often prioritize economic gains over the provision of green spaces. In such areas, urban green spaces (UGS) typically face a trade-off between economic returns and social equity, leading to disparities in availability and accessibility [65]. Despite better access to parks for high-income groups, the overall quality and equitable distribution of UGS in these areas may still lag, exacerbating spatial inequality [66]. These findings highlight the need for urban policies that balance economic development with equitable UGS provision to promote both environmental and social sustainability.
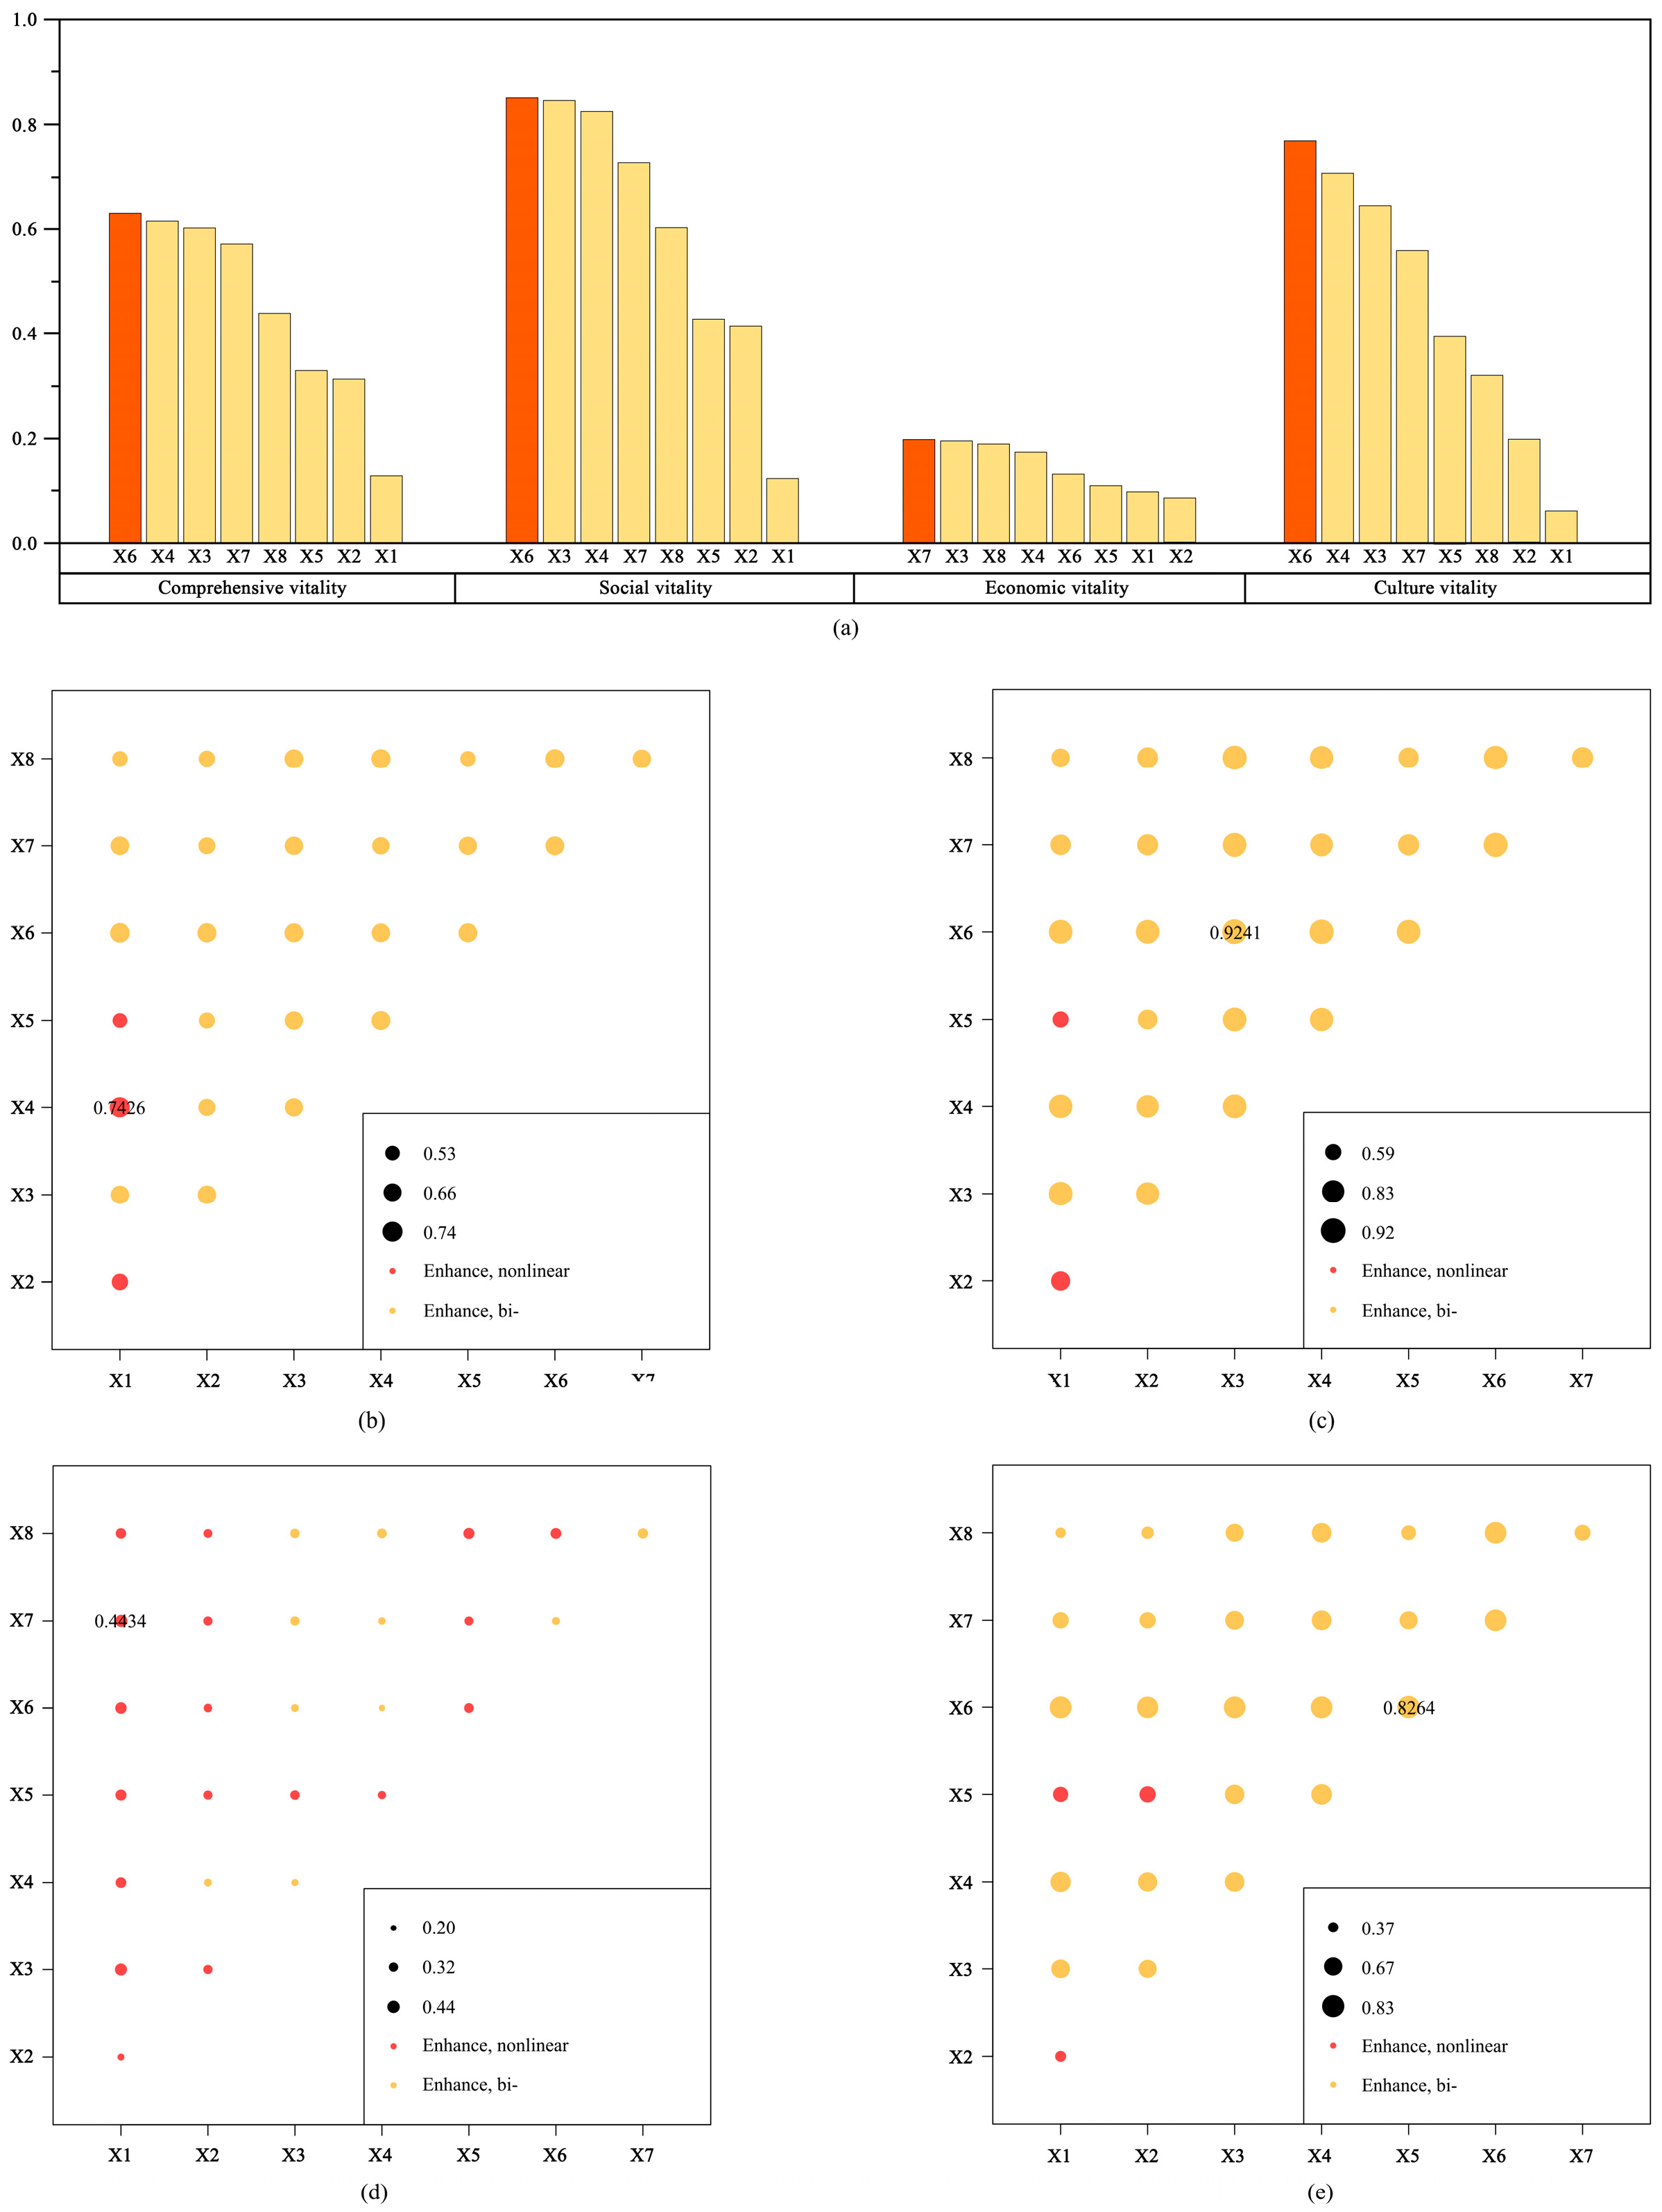
- (7)
- Concerning the strength of the influence of UGS supply and demand on urban vitality, the demand for high-density built-up areas was higher than the UGS supply. Factors such as diversity, density, population, and UGS uniformity exert strong influences on the spatial differentiation of urban comprehensive vitality at both the supply and demand levels. At the same time, UGS quantity and UGS uniformity demonstrated significant effects on vitality when combined with factors such as the diversity of the built environment, whereas their impacts as single factors were weak. This highlights the synergistic gain effect of UGS supply-demand has a more obvious impact on the role of urban vitality.
4.3. Optimization Strategy of UGS Supply and Demand Based on Vitality Guidance
- (1)
- Expanding the coverage of UGS services to the public from both UGS quantity and UGS uniformity. The study showed that the comprehensive supply capacity of UGS in most subdistricts in downtown Beijing is lower than the urban comprehensive demand, indicating insufficient UGS service supply (Figure 4). In the Xueyuan Road subdistrict, Haidian District, for example, a UGS coverage increase of 5% would increase the coupling-coordination degree by 0.4%, assuming the other indicators remain unchanged. The Beijing Major Infrastructure Development Plan for the 14th Five-Year Plan (2016–2035) proposes the establishment of a more comprehensive infrastructure system, which includes advancements in both green ecology and urban public transportation networks.
- (2)
- Urban planners should balance UGS supply and demand by focusing on supply and demand layer factors that affect different dimensions of vitality. In areas where both UGS coordination and overall vitality are low, or where UGS coordination is relatively high but vitality remains weak, the core challenge lies in effectively stimulating local vibrancy and enhancing the actual utility of green spaces. One key strategy is to encourage population mobility. Planners and policymakers should integrate population scale, demographic structure, and activity needs of potential UGS users into spatial planning. For instance, in the Jinzhan subdistrict, an increase in population by 50,000 can improve the coupling-coordination level by 0.01%, assuming other indicators remain unchanged. Furthermore, regional development strategies should drive population concentration and economic prosperity by attracting employment, optimizing land functions, and introducing green facilities. For example, research has shown that installing rooftop gardens can raise nearby property values by approximately 11% [76]. Such improvements can enhance land value, expand the local tax base, and support small business development. In addition, UGS projects generate employment opportunities in the design, construction, and maintenance sectors. Therefore, local governments are encouraged to integrate parks with commercial and tourism functions, leveraging the synergy between ecological investment and urban vitality to strengthen regional attractiveness [77].
- (3)
- The spatial layout of UGS should follow a multi-scalar strategy to enhance adaptability and align with the specific usage demands of different vitality zones. Existing studies have shown that variations in socioeconomic status, cultural background, life stage, and activity patterns across urban regions shape residents’ preferences for UGS types and functions, which in turn influence the form and quality of UGS provision [81,82].
4.4. Contributions, Limitations, and Future Perspectives
5. Conclusions
Author Contributions
Funding
Institutional Review Board Statement
Informed Consent Statement
Data Availability Statement
Conflicts of Interest
Appendix A
Appendix A.1
Appendix A.2

Appendix A.3

Appendix B

| Major | Medium | Minor |
|---|---|---|
| Residence | Business residential | Commercial office buildings, residential areas, industrial parks, commercial and residential buildings, etc. |
| Business service | Catering services | Chinese restaurant, foreign restaurant, snack fast food store, cake and dessert store, coffee shop, tea house, bar |
| Life services | Communication business hall, post office, logistics company, ticket office, laundromat, graphic and printing store, photo studio, real estate agency, public utility, maintenance point, housekeeping service, funeral service, lottery ticket sales outlet, pet service, newsstand, public restroom | |
| Shopping services | Shopping center, department store, supermarket, convenience store, home building material, home appliance and digital appliance, store and bazaar | |
| Financial and insurance services | Bank, ATM, credit unions, investment banking, pawn shops | |
| Motorcycle services | — | |
| Automotive services | Automobile sale, automobile repair, automobile beauty, automobile parts, automobile leasing, automobile testing field | |
| Sports and leisure services | Stadium, extreme sports venue, fitness center, resort, farm house, movie theater, KTV, theater, dance hall, Internet cafe, game venue, baths and massage, leisure plaza | |
| Accommodation services | Hotel Guest House, Star Hotel, Express Hotel, Apartment Hotel | |
| Public administration and public service | Public facilities | Public restroom, newsstand, public telephone, emergency shelter |
| Science, education, and cultural services | Higher education institution, middle school, elementary school, kindergarten, adult education, parent-child education, special education school, study abroad agency, scientific research institute, training institution, library, science and technology museum, museum, science education and cultural venue, arts and cultural organization, media organization, cultural palace, exhibition center, exhibition hall, planetarium, archive | |
| Health care services | General hospital, specialty hospital, clinic, pharmacy, medical checkup, nursing home, emergency center, CDC | |
| Government agencies and social organizations | Central agency, government at all levels, administrative unit, public prosecutor and law enforcement agency, foreign-related agency, political party and organization, welfare agency, and political education institution. | |
| Industries | Company enterprise | Company, park, agriculture, forestry and horticulture, factory and min |
| Green space and open space | Scenic spots | Park, square, zoo, botanical garden, amusement park, aquarium, heritage estimate, seaside bathing beach, church, scenic spot |
| Transportation | Transportation facilities services | Airport, railway station, subway station, long-distance bus station, bus stop, port, parking lot, gas station, service area, toll station, bridge, charging station, on-street parking space, road accessory facility, etc. |
| Goal Level | Criteria Level | Indicator | Description of Indicator | Nature of Indicator | Weight |
|---|---|---|---|---|---|
| Indicators of supply | Quantity Configuration | UGS distribution density | Number of UGS per subdistrict unit area | + | 0.2789 |
| UGS coverage | UGS area per subdistrict unit area | + | 0.2969 | ||
| UGS Recreation Opportunity Index | UGS service radius coverage area (with overlapping areas counted multiple times) per subdistrict unit area | + | 0.1960 | ||
| Spatial uniformity | UGS Service coverage overlap ratio | [UGS service radius coverage area (with overlapping areas counted multiple times)—the total UGS service area (with overlapping areas counted only once)] per subdistrict unit area | + | 0.0236 | |
| Location entropy of UGS service per capita | Per capita effective UGS service area within the subdistrict unit/Per capita effective UGS service area in the study area | + | 0.2046 | ||
| Location entropy of UGS per capita | Per capita UGS area within the subdistrict unit/Per capita UGS area in the study area | ||||
| Indicators of demand | Crowd | population density | Total population per subdistrict unit area | + | 0.0159 |
| Density | POI density | Total number of POI per subdistrict unit area | + | 0.0418 | |
| building density | Building footprint area per subdistrict unit area | + | 0.62468 | ||
| Design | Average number of building stories | Total number of building floors per subdistrict unit area/Total number of buildings per subdistrict unit area | + | 0.02521 | |
| Intersection density | Number of intersections per subdistrict unit area | + | 0.03885 | ||
| Diversity | land use mix degree | Shannon entropy index of POIs within the subdistrict unit | + | 0.02284 | |
| Transportation accessibility | road density | Total street network length per subdistrict unit area | + | 0.02573 | |
| Bus stop density | Total number of bus stops per subdistrict unit area | + | 0.03099 | ||
| Metro station density | Total number of metro stations per subdistrict unit area | + | 0.05902 | ||
| Destination accessibility | Distances to administrative centers | The shortest distance from the center point of the subdistrict unit to the subdistrict government | − | 0.05534 | |
| Distance to CBD | The shortest distance from the center point of the subdistrict unit to the CBD | − | 0.05964 |
Appendix B.1
| Dimension | Data Sources | Description |
|---|---|---|
| Social Vitality | Baidu (https://lbsyun.baidu.com/, accessed on 20–21 May 2023) | Location-based service data. Contains numerical points with an accuracy of 500 m. Describes real-time population distribution. |
| Economic Vitality | Earth Observation Group (https://eogdata.mines.edu/nighttime_light/monthly/v10/, accessed on 4 May 2024) | Remote sensing data. Raster data with a resolution of 500 m, used to describe the light intensity in the area. |
| Cultural Vitality | Gaode (https://lbs.amap.com/, accessed on 22 March 2024) | Point of Interest (POI), point data containing geographic location, category, and other information. |
References
- Jacobs, J.M. The Death and Life of Great American Cities; Random House Digital, Inc.: New York, NY, USA, 1961. [Google Scholar]
- Wang, Z.; Wang, X.; Liu, Y.; Zhu, L. Identification of 71 factors influencing urban vitality and examination of their spatial dependence: A comprehensive validation applying multiple machine-learning models. Sustain. Cities Soc. 2024, 108, 105491. [Google Scholar] [CrossRef]
- Liu, H.; Gou, P.; Xiong, J. Vital triangle: A new concept to evaluate urban vitality. Comput. Environ. Urban Syst. 2022, 98, 101886. [Google Scholar] [CrossRef]
- Landry, C. Uban vitality: A new source of urban competitiveness. Archis 2000, 12, 8–13. [Google Scholar]
- Lan, F.; Gong, X.; Da, H.; Wen, H. How do population inflow and social infrastructure affect urban vitality? Evidence from 35 large- and medium-sized cities in China. Cities 2020, 100, 102454. [Google Scholar] [CrossRef]
- Yue, Y.; Yan, Z.; Yeh, A.G.; Xie, J.; Ma, C.; Li, Q. Measurements of POI-based mixed use and their relationships with neighbourhood vibrancy. Int. J. Geogr. Inf. Sci. 2017, 31, 658–675. [Google Scholar] [CrossRef]
- Zeng, C.; Song, Y.; He, Q.; Shen, F. Spatially explicit assessment on urban vitality: Case studies in Chicago and Wuhan. Sustain. Cities Soc. 2018, 40, 296–306. [Google Scholar] [CrossRef]
- Pan, H.; Yang, C.; Quan, L.; Liao, L. A new insight into understanding urban vitality: A case study in the Chengdu-Chongqing Area Twin-City Economic Circle, China. Sustainability 2021, 13, 10068. [Google Scholar] [CrossRef]
- Wu, W.; Niu, X. Influence of built environment on urban vitality: Case study of Shanghai using mobile phone location data. J. Urban Plan. Dev. 2019, 145, 04019007. [Google Scholar] [CrossRef]
- Ding, Z.; Wang, H. What are the key and catalytic external factors affecting the vitality of urban blue-green space? a case study of Nanjing Main Districts, China. Ecol. Indic 2024, 158, 111478. [Google Scholar] [CrossRef]
- Lang, W.; Lang, H.; Hui, E.C.M.; Chen, T.; Wu, J.; Jahre, M. Measuring urban vibrancy of neighborhood performance using social media data in Oslo, Norway. Cities 2022, 131, 103908. [Google Scholar] [CrossRef]
- Jaroszewicz, J.; Denis, M.; Fijałkowska, A.; Graszka, O.; Pluto-Kossakowska, J.; Krzysztofowicz, S. Spatially explicit mixed-use indicators to measure life quality across the city—A conceptual framework and case study: Piaseczno—A medium sized city in the peri-urban zone of Warsaw, Poland. Cities 2023, 137, 104296. [Google Scholar] [CrossRef]
- James, P.; Tzoulas, K.; Adams, M.; Barber, A.; Breuste, J.H.; Elmqvist, T.; Frith, M.; Gordon, C.; Greening, K.; Handley, J.; et al. Towards an integrated understanding of green space in the European built environment. Urban For. Urban Green. 2009, 8, 65–75. [Google Scholar] [CrossRef]
- Chen, Z.; Huang, B. Achieving urban vibrancy through effective city planning: A spatial and temporal perspective. Cities 2024, 152, 105230. [Google Scholar] [CrossRef]
- Tzoulas, K.; Korpela, K.M.; Venn, S.J.; Yli-Pelkonen, V.; Kaźmierczak, A.; Niemelä, J.; James, P. Promoting ecosystem and human health in urban areas using Green Infrastructure: A literature review. Landsc. Urban Plan. 2007, 81, 167–178. [Google Scholar] [CrossRef]
- Aram, F.; Higueras García, E.; Solgi, E.; Mansournia, S. Urban green space cooling effect in cities. Heliyon 2019, 5, e01339. [Google Scholar] [CrossRef]
- Strohbach, M.W.; Arnold, E.; Haase, D. The carbon footprint of urban green space—A life cycle approach. Landsc. Urban Plan. 2012, 104, 220–229. [Google Scholar] [CrossRef]
- Han, L.; Zhang, R.; Wang, J.; Cao, S.-J. Spatial synergistic effect of urban green space ecosystem on air pollution and heat island effect. Urban Clim. 2024, 55, 101940. [Google Scholar] [CrossRef]
- Dzhambov, A.M.; Dimitrova, D.D. Green spaces and environmental noise perception. Urban For. Urban Green. 2015, 14, 1000–1008. [Google Scholar] [CrossRef]
- Lepczyk, C.A.; Aronson, M.F.J.; Evans, K.L.; Goddard, M.A.; Lerman, S.B.; MacIvor, J.S. Biodiversity in the city: Fundamental questions for understanding the ecology of urban green spaces for biodiversity conservation. BioScience 2017, 67, 799–807. [Google Scholar] [CrossRef]
- Reyes-Riveros, R.; Altamirano, A.; de la Barrera, F.; Rozas-Vásquez, D.; Vieli, L.; Meli, P. Linking public urban green spaces and human well-being: A systematic review. Urban For. Urban Green. 2021, 61, 127105. [Google Scholar] [CrossRef]
- Zhou, X.; Rana, M.M. Social benefits of urban green space. Manag. Environ. Qual. 2012, 23, 173–189. [Google Scholar] [CrossRef]
- Jennings, V.; Larson, L.; Yun, J. Advancing sustainability through urban green space: Cultural ecosystem services, equity, and social determinants of health. Int. J. Environ. Res. Public Health 2016, 13, 196. [Google Scholar] [CrossRef]
- Hong, W.; Wang, W.; Guo, R. Policies for optimizing land-use layouts in highly urbanized areas: An analysis framework based on construction land clearance. Habitat Int. 2022, 130, 102697. [Google Scholar] [CrossRef]
- Hu, J.; Zhang, F.; Qiu, B.; Zhang, X.; Yu, Z.; Mao, Y.; Wang, C.; Zhang, J. Green-gray imbalance: Rapid urbanization reduces the probability of green space exposure in early 21st century China. Sci. Total Environ. 2024, 933, 173168. [Google Scholar] [CrossRef]
- Liu, X.; Cao, G.; Liu, T.; Liu, H. Semi-urbanization and evolving patterns of urbanization in China: Insights from the 2000 to 2010 national censuses. J. Geogr. Sci. 2016, 26, 1626–1642. [Google Scholar] [CrossRef]
- Liu, D.; Kwan, M.-P.; Kan, Z. Analysis of urban green space accessibility and distribution inequity in the City of Chicago. Urban For. Urban Green. 2021, 59, 127029. [Google Scholar] [CrossRef]
- Dai, D. Racial/ethnic and socioeconomic disparities in urban green space accessibility: Where to intervene? Landsc. Urban Plan. 2011, 102, 234–244. [Google Scholar] [CrossRef]
- Liu, B.; Tian, Y.; Guo, M.; Tran, D.; Alwah, A.A.Q.; Xu, D. Evaluating the disparity between supply and demand of park green space using a multi-dimensional spatial equity evaluation framework. Cities 2022, 121, 103484. [Google Scholar] [CrossRef]
- Liang, H.; Yan, Q.; Yan, Y. Evaluating green space provision development in Shanghai (2012–2021): A focus on accessibility and service efficiency. Sustain. Cities Soc. 2024, 103, 105269. [Google Scholar] [CrossRef]
- Phillips, A.; Canters, F.; Khan, A.Z. Analyzing spatial inequalities in use and experience of urban green spaces. Urban For. Urban Green. 2022, 74, 127674. [Google Scholar] [CrossRef]
- Chen, Z.; Liu, Q.; Li, M.; Xu, D. A New Strategy for Planning Urban Park Green Spaces by Considering Their Spatial Accessibility and Distributional Equity. Forests 2024, 15, 570. [Google Scholar] [CrossRef]
- Lu, W.; Jiang, W.; Qiao, D.; Liu, Q.; Chen, G.; Huang, Q.; Xu, C. Embracing green spaces: Exploring spatiotemporal changes in urban green space accessibility and its equity in Guangzhou, China for sustainable urban greening. Environ. Sustain. Ind. 2023, 19, 100290. [Google Scholar] [CrossRef]
- Lu, Y.; Chen, R.; Chen, B.; Wu, J. Inclusive green environment for all? An investigation of spatial access equity of urban green space and associated socioeconomic drivers in China. Landsc. Urban Plan. 2024, 241, 104926. [Google Scholar] [CrossRef]
- Calderón-Argelich, A.; Anguelovski, I.; Connolly, J.J.T.; Baró, F. Greening plans as (re)presentation of the city: Toward an inclusive and gender-sensitive approach to urban greenspaces. Urban For. Urban Green. 2023, 86, 127984. [Google Scholar] [CrossRef]
- Enssle, F.; Kabisch, N. Urban green spaces for the social interaction, health and well-being of older people—An integrated view of urban ecosystem services and socio-environmental justice. Environ. Sci. Policy 2020, 109, 36–44. [Google Scholar] [CrossRef]
- Xiao, Y.; Piao, Y.; Wei, W.; Pan, C.; Lee, D.; Zhao, B. A comprehensive framework of cooling effect-accessibility-urban development to assessing and planning park cooling services. Sustain. Cities Soc. 2023, 98, 104817. [Google Scholar] [CrossRef]
- Cheng, P.; Min, M.; Hu, W.; Zhang, A. A framework for fairness evaluation and improvement of urban green space: A Case of wuhan metropolitan area in China. Forests 2021, 12, 890. [Google Scholar] [CrossRef]
- Dong, Q.; Cai, J.; Chen, S.; He, P.; Chen, X. Spatiotemporal analysis of urban green spatial vitality and the corresponding influencing factors: A case study of Chengdu, China. Land 2022, 11, 1820. [Google Scholar] [CrossRef]
- Qin, L.; Zong, W.; Peng, K.; Zhang, R. Assessing spatial heterogeneity in urban park vitality for a sustainable built environment: A case study of Changsha. Land 2024, 13, 480. [Google Scholar] [CrossRef]
- Tang, J.; Long, Y. Measuring visual quality of street space and its temporal variation: Methodology and its application in the Hutong area in Beijing. Landsc. Urban Plan. 2019, 191, 103436. [Google Scholar] [CrossRef]
- Kruize, H.; van der Vliet, N.; Staatsen, B.; Bell, R.; Chiabai, A.; Muiños, G.; Higgins, S.; Quiroga, S.; Martinez-Juarez, P.; Aberg Yngwe, M.; et al. Urban green space: Creating a triple win for environmental sustainability, health, and health equity through behavior change. Int. J. Environ. Res. Public Health 2019, 16, 4403. [Google Scholar] [CrossRef] [PubMed]
- Zhang, S.; Liu, J.; Song, C.; Chan, C.; Pei, T.; Wenting, Y.; Xin, Z. Spatial-temporal distribution characteristics and evolution mechanism of urban parks in Beijing, China. Urban For. Urban Green. 2021, 64, 127265. [Google Scholar] [CrossRef]
- Shi, Q.; Liu, M.; Marinoni, A.; Liu, X. UGS-1m: Fine-grained urban green space mapping of 31 major cities in China based on the deep learning framework. Earth Syst. Sci. Data 2023, 15, 555–577. [Google Scholar] [CrossRef]
- Li, J.; Yuan, W.; Qin, X.; Qi, X.; Meng, L. Coupling coordination degree for urban green growth between public demand and government supply in urban agglomeration: A case study from China. J. Environ. Manag. 2022, 304, 114209. [Google Scholar] [CrossRef]
- Ewing, R.; and Cervero, R. Travel and the built environment. J. Am. Plann. Asssoc. 2010, 76, 265–294. [Google Scholar] [CrossRef]
- Han, S.; Kwan, M.-P.; Miao, C.; Sun, B. Exploring the effects of urban spatial structure on green space in Chinese cities proper. Urban For. Urban Green. 2023, 87, 128059. [Google Scholar] [CrossRef]
- Zhang, J.; Yu, Z.; Cheng, Y.; Chen, C.; Wan, Y.; Zhao, B.; Vejre, H. Evaluating the disparities in urban green space provision in communities with diverse built environments: The case of a rapidly urbanizing Chinese city. Build. Environ. 2020, 183, 107170. [Google Scholar] [CrossRef]
- Anselin, L.; Syabri, I.; Kho, Y. GeoDa: An Introduction to Spatial Data Analysis. Geogr. Anal. 2006, 38, 5–22. [Google Scholar] [CrossRef]
- Zhang, J.; Zhang, K.; Zhao, F. Research on the regional spatial effects of green development and environmental governance in China based on a spatial autocorrelation model. Struct. Change Econ. Dyn. 2020, 55, 1–11. [Google Scholar] [CrossRef]
- Anselin, L.; Sridharan, S.; Gholston, S.E. Using exploratory spatial data analysis to leverage social indicator databases: The discovery of interesting patterns. Soc. Indic. Res. 2006, 82, 287–309. [Google Scholar] [CrossRef]
- Wang, J.; Zhang, T.; Fu, B. A measure of spatial stratified heterogeneity. Ecol. Indic 2016, 67, 250–256. [Google Scholar] [CrossRef]
- Wang, J.; Xu, C. Geodetector: Principle and prospective. Acta Geogr. Sin. 2017, 72, 116–134. [Google Scholar] [CrossRef]
- Hami, A.; Moula, F.F.; Maulan, S. Public preferences toward shopping mall interior landscape design in Kuala Lumpur, Malaysia. Urban For. Urban Green. 2018, 30, 1–7. [Google Scholar] [CrossRef]
- Liang, H.; Yan, Q.; Yan, Y.; Zhang, Q. Using an improved 3SFCA method to assess inequities associated with multimodal accessibility to green spaces based on mismatches between supply and demand in the metropolitan of Shanghai, China. Sustain. Cities Soc. 2023, 91, 104456. [Google Scholar] [CrossRef]
- Luo, C.; Yu, H.; Liu, Y.; Yang, W. Supply and demand assessment of physical activity services provided by urban green spaces: A case study of Chongqing, China. Urban For. Urban Green. 2024, 95, 128315. [Google Scholar] [CrossRef]
- Wang, X.; Meng, Q.; Liu, X.; Allam, M.; Zhang, L.; Hu, X.; Bi, Y.; Jancsó, T. Evaluation of fairness of urban park green space based on an improved supply model of green space: A case study of Beijing Central City. Remote Sens. 2023, 15, 244. [Google Scholar] [CrossRef]
- Chen, Z.; Huang, G. Greenspace to meet people’s demand: A Case study of Beijing in 2005 and 2015. Remote Sens. 2021, 13, 4310. [Google Scholar] [CrossRef]
- Wolff, M.; Haase, D. Mediating sustainability and liveability—Turning points of green space supply in European cities. Front. Environ. Sci. 2019, 7, 61. [Google Scholar] [CrossRef]
- Li, Q.; Cui, C.; Liu, F.; Wu, Q.; Run, Y.; Han, Z. Multidimensional urban vitality on streets: Spatial patterns and influence factor identification using multisource urban data. ISPRS Int. J. Geo-Inf. 2022, 11, 2. [Google Scholar] [CrossRef]
- Barbosa, O.; Tratalos, J.A.; Armsworth, P.R.; Davies, R.G.; Fuller, R.A.; Johnson, P.; Gaston, K.J. Who benefits from access to green space? A case study from Sheffield, UK. Landsc. Urban Plan. 2007, 83, 187–195. [Google Scholar] [CrossRef]
- Sikorska, D.; Wojnowska-Heciak, M.; Heciak, J.; Bukowska, J.; Łaszkiewicz, E.; Hopkins, R.J.; Sikorski, P. Rethinking urban green spaces for urban resilience. Do green spaces need adaptation to meet public post-covid expectations? Urban For. Urban Green. 2023, 80, 127838. [Google Scholar] [CrossRef]
- Jiang, Y.; Huang, Z.; Zhou, X.; Chen, X. Evaluating the impact of urban morphology on urban vitality: An exploratory study using big geo-data. Int. J. Digit. Earth 2024, 17, 2327571. [Google Scholar] [CrossRef]
- Lopes, M.N.; Camanho, A.S. Public green space use and consequences on urban vitality: An assessment of European cities. Soc. Indic. Res. 2013, 113, 751–767. [Google Scholar] [CrossRef]
- Chen, Y.; Ge, Y.; Yang, G.; Wu, Z.; Du, Y.; Mao, F.; Liu, S.; Xu, R.; Qu, Z.; Xu, B.; et al. Inequalities of urban green space area and ecosystem services along urban center-edge gradients. Landsc. Urban Plan. 2022, 217, 104266. [Google Scholar] [CrossRef]
- Wu, L.; Rowe, P.G. Green space progress or paradox: Identifying green space associated gentrification in Beijing. Landsc. Urban Plan. 2022, 219, 104321. [Google Scholar] [CrossRef]
- Li, L.; Yilin, Z.; Shaojun, M.; and Li, M. Environmental infrastructure and urban residents’ well-being: A system dynamics approach. J. Environ. Plann. Man. 2023, 66, 2576–2602. [Google Scholar] [CrossRef]
- Elmqvist, T.; Setälä, H.; Handel, S.N.; van der Ploeg, S.; Aronson, J.; Blignaut, J.N.; Gómez-Baggethun, E.; Nowak, D.J.; Kronenberg, J.; de Groot, R. Benefits of restoring ecosystem services in urban areas. Curr. Opin. Environ. Sustain. 2015, 14, 101–108. [Google Scholar] [CrossRef]
- Martins, B. Where to construct new urban green spaces to be at the recommended distance from users and to complement existing ones? A study in five cities of northern Portugal. Urban For. Urban Green. 2022, 72, 127571. [Google Scholar] [CrossRef]
- Zhang, H.; Han, M. Pocket parks in English and Chinese literature: A review. Urban For. Urban Green. 2021, 61, 127080. [Google Scholar] [CrossRef]
- Tang, G.; Du, X.; Wang, S. Impact mechanisms of 2D and 3D spatial morphologies on urban thermal environment in high-density urban blocks: A case study of Beijing’s Core Area. Sustain. Cities Soc. 2025, 123, 106285. [Google Scholar] [CrossRef]
- Mata, L.; Garrard, G.; Fidler, F.; Ives, C.; Maller, C.; Wilson, J.; Thomas, F.; Bekessy, S. Punching above their weight: The ecological and social benefits of pop-up parks. Front. Ecol. Environ. 2019, 17, 341–347. [Google Scholar] [CrossRef]
- Li, L.; Zheng, Y.; Ma, S. Links of urban green space on environmental satisfaction: A spatial and temporarily varying approach. Environ. Dev. Sustain. 2023, 25, 3469–3501. [Google Scholar] [CrossRef]
- Liu, T.; Yu, L.; Chen, X.; Chen, Y.; Li, X.; Liu, X.; Cao, Y.; Zhang, F.; Zhang, C.; Gong, P. Identifying potential urban greenways by considering green space exposure levels and maximizing recreational flows: A case study in Beijing’s built-up areas. Land 2024, 13, 1793. [Google Scholar] [CrossRef]
- Dang, Y.; Wang, C.; Chen, P. Identification and optimization strategy of urban park service areas based on accessibility by public transport: Beijing as a case study. Sustainability 2022, 14, 7112. [Google Scholar] [CrossRef]
- Zalejska-Jonsson, A.; Wilkinson, S.J.; Wahlund, R. Willingness to pay for green infrastructure in residential development—A consumer perspective. Atmosphere 2020, 11, 152. [Google Scholar] [CrossRef]
- Li, L.; Ma, X.; Ma, S.; Gao, F. Role of green finance in regional heterogeneous green innovation: Evidence from China. Humanit. Soc. Sci. Commun. 2024, 11, 1011. [Google Scholar] [CrossRef]
- Intergovernmental Panel on Climate Change. Climate Change 2022—Impacts, Adaptation and Vulnerability: Working Group II Contribution to the Sixth Assessment Report of the Intergovernmental Panel on Climate Change; Cambridge University Press: Cambridge, UK, 2023. [Google Scholar]
- Li, L.; Zheng, Y.; Ma, S.; Ma, X.; Zuo, J.; Goodsite, M. Unfavorable weather, favorable insights: Exploring the impact of extreme climate on green total factor productivity. Econ. Anal. Policy 2025, 85, 626–640. [Google Scholar] [CrossRef]
- Chen, W.Y.; Wang, D.T. Urban forest development in China: Natural endowment or socioeconomic product? Cities 2013, 35, 62–68. [Google Scholar] [CrossRef]
- Schrammeijer, E.A.; Malek, Ž.; Verburg, P.H. Mapping demand and supply of functional niches of urban green space. Ecol. Indic 2022, 140, 109031. [Google Scholar] [CrossRef]
- Vidal, D.G.; Teixeira, C.P.; Fernandes, C.O.; Olszewska-guizzo, A.; Dias, R.C.; Vilaça, H.; Barros, N.; Maia, R.L. Patterns of human behaviour in public urban green spaces: On the influence of users’profiles, surrounding environment, and space design. Urban For. Urban Green. 2022, 74, 127668. [Google Scholar] [CrossRef]
- Wei, J.; Chen, M.; Chu, C.; Zhao, C.; Xia, X.; Li, Y. Assessing cultural ecosystem services supply–demand balance of urban parks in the context of old and new urban districts. Ecol. Indic 2024, 159, 111688. [Google Scholar] [CrossRef]
- Chen, J.; Zhou, C.; Li, F. Quantifying the green view indicator for assessing urban greening quality: An analysis based on Internet-crawling street view data. Ecol. Indic 2020, 113, 106192. [Google Scholar] [CrossRef]
- Yuen, J.W.M.; Chang, K.K.P.; Wong, F.K.Y.; Wong, F.Y.; Siu, J.Y.M.; Ho, H.C.; Wong, M.S.; Ho, J.Y.S.; Chan, K.L.; Yang, L. Influence of urban green space and facility accessibility on exercise and healthy diet in Hong Kong. Int. J. Environ. Res. Public Health 2019, 16, 1514. [Google Scholar] [CrossRef]
- Wolff, M.; Scheuer, S.; Haase, D. Looking beyond boundaries: Revisiting the rural-urban interface of Green Space Accessibility in Europe. Ecol. Indic 2020, 113, 106245. [Google Scholar] [CrossRef]
- Zhang, S.; Zhou, W. Recreational visits to urban parks and factors affecting park visits: Evidence from geotagged social media data. Landsc. Urban Plan. 2018, 180, 27–35. [Google Scholar] [CrossRef]
- Fan, Z.; Duan, J.; Luo, M.; Zhan, H.; Liu, M.; Peng, W. How did built environment affect urban vitality in urban waterfronts? A case study in Nanjing Reach of Yangtze River. ISPRS Int. J. Geo-Inf. 2021, 10, 611. [Google Scholar] [CrossRef]
- Richards, D.R.; Passy, P.; Oh, R.R.Y. Impacts of population density and wealth on the quantity and structure of urban green space in tropical Southeast Asia. Landsc. Urban Plan. 2017, 157, 553–560. [Google Scholar] [CrossRef]
- de la Barrera, F.; Reyes-Paecke, S.; Banzhaf, E. Indicators for green spaces in contrasting urban settings. Ecol. Indic 2016, 62, 212–219. [Google Scholar] [CrossRef]


| UGS Category | Numbers | Area (hm2) | Area Ratio (%) | Suitable Size (hm2) | Service Radius (m) |
|---|---|---|---|---|---|
| Micro-scale green spaces | 237 | 110.75 | 0.75 | 0.04~1.0 | 300 |
| Small-scale green spaces | 310 | 772.59 | 5.27 | 1.0~5.0 | 500 |
| Community-level green Spaces | 97 | 688.86 | 4.69 | 5.0~10.0 | 1000 |
| District-level green Spaces | 95 | 1548.06 | 10.55 | 10.0~25.0 | 2000 |
| City-level green spaces | 110 | 11,553.11 | 78.74 | ≥25.0 | 3000 |
| Total | 849 | 14,673.37 | 100 | — | — |
| Supply and Demand Matching Type | Quadrant | Percentage |
|---|---|---|
| High-high balance | First quadrant | 12.42% |
| High-low override | Second quadrant | 28.42% |
| Low-low balance | Third quadrant | 48.35% |
| Low-high lag | Forth quadrant | 10.81% |
| Coupling-Coordination Types | Coupling-Coordination Degree | Numerical Interval | Percentage | |
|---|---|---|---|---|
| Single | Total | |||
| Imbalance degradation | Extreme Disorder | [0.0, 0.1) | 0 | 63.29% |
| Severe Disorder | [0.1, 0.2) | 3.09% | ||
| Moderate Disorder | [0.2, 0.3) | 12.07% | ||
| Mild Disorder | [0.3, 0.4) | 48.13% | ||
| Balance transition | Near Disorder | [0.4, 0.5) | 28.18% | 36.57% |
| Reluctant Coordination | [0.5, 0.6) | 8.39% | ||
| Coordinated development | Primary Coordination | [0.6, 0.7) | 0 | 0.14% |
| Moderate Coordination | [0.7, 0.8) | 0.14% | ||
| Good Coordination | [0.8, 0.9) | 0 | ||
| Quality Coordination | [0.9, 1.0) | 0 | ||
| Supply and Demand Indicator Layer Factors | Social Vitality | Economic Vitality | Cultural Vitality | Integrated Vitality |
|---|---|---|---|---|
| UGS distribution density | 0.45 *** | 0.12 *** | 0.28 *** | 0.34 *** |
| UGS coverage | 0.06 *** | 0.15 *** | 0.08 *** | 0.05 *** |
| UGS Recreation Opportunity Index | 0.34 *** | 0.04 *** | 0.27 *** | 0.40 *** |
| UGS Service coverage overlap ratio | 0.29 *** | 0.03 *** | 0.17 *** | 0.31 *** |
| Location entropy of UGS service per capita | 0.03 *** | 0.05 *** | 0.03 *** | 0.04 *** |
| Entropy of UGS location per capita | 0.47 *** | 0.15 *** | 0.39 *** | 0.32 *** |
| population density | 0.84 *** | 0.21 *** | 0.62 *** | 0.58 *** |
| POI density | 0.81 *** | 0.22 *** | 0.77 *** | 0.63 *** |
| Building density | 0.74 *** | 0.16 *** | 0.56 *** | 0.55 *** |
| Average number of building stories | 0.48 *** | 0.13 *** | 0.41 *** | 0.29 *** |
| Intersection density | 0.25 *** | 0.02 *** | 0.23 *** | 0.29 *** |
| Land use mix degree | 0.79 *** | 0.13 *** | 0.76 *** | 0.54 *** |
| Road density | 0.41 *** | 0.05 *** | 0.39 *** | 0.35 *** |
| Bus stop density | 0.74 *** | 0.31 *** | 0.63 *** | 0.47 *** |
| Metro station density | 0.60 *** | 0.14 *** | 0.50 *** | 0.51 *** |
| Distance to administrative centers | 0.46 *** | 0.07 *** | 0.26 *** | 0.36 *** |
| Distance to CBD | 0.38 *** | 0.02 *** | 0.18 *** | 0.37 *** |
Disclaimer/Publisher’s Note: The statements, opinions and data contained in all publications are solely those of the individual author(s) and contributor(s) and not of MDPI and/or the editor(s). MDPI and/or the editor(s) disclaim responsibility for any injury to people or property resulting from any ideas, methods, instructions or products referred to in the content. |
© 2025 by the authors. Licensee MDPI, Basel, Switzerland. This article is an open access article distributed under the terms and conditions of the Creative Commons Attribution (CC BY) license (https://creativecommons.org/licenses/by/4.0/).
Share and Cite
Han, J.; Huang, S.; Zhang, S.; Lin, Q.; Wang, X. Assessing Supply and Demand Discrepancies of Urban Green Space in High-Density Built-Up Areas Based on Vitality Impacts: Evidence from Beijing’s Central Districts, China. Sustainability 2025, 17, 4828. https://doi.org/10.3390/su17114828
Han J, Huang S, Zhang S, Lin Q, Wang X. Assessing Supply and Demand Discrepancies of Urban Green Space in High-Density Built-Up Areas Based on Vitality Impacts: Evidence from Beijing’s Central Districts, China. Sustainability. 2025; 17(11):4828. https://doi.org/10.3390/su17114828
Chicago/Turabian StyleHan, Jingyi, Shoubang Huang, Shiyang Zhang, Qing Lin, and Xiangrong Wang. 2025. "Assessing Supply and Demand Discrepancies of Urban Green Space in High-Density Built-Up Areas Based on Vitality Impacts: Evidence from Beijing’s Central Districts, China" Sustainability 17, no. 11: 4828. https://doi.org/10.3390/su17114828
APA StyleHan, J., Huang, S., Zhang, S., Lin, Q., & Wang, X. (2025). Assessing Supply and Demand Discrepancies of Urban Green Space in High-Density Built-Up Areas Based on Vitality Impacts: Evidence from Beijing’s Central Districts, China. Sustainability, 17(11), 4828. https://doi.org/10.3390/su17114828