1. Introduction
Food production is inherently dependent on environmental factors. Increasing frequency of extreme weather events (spring frost, drought, and rainfall), changes in temperature and carbon dioxide concentrations have a major impact on crop yields and metabolic processes [
1]. Similarly to other industries, the agriculture and food production industries also contribute to negative impact on the environment through the use of raw materials, energy needs, waste generation, or by less obvious processes where the impact on the environment is not immediately apparent.
Large enterprises operating in the energy sector, the transport sector, and in the chemical industry are one of the most environmentally regulated sectors due to the stringent permits required to operate; consequently, they are not the biggest polluters of natural environment. Other industries, such as food and agriculture, take a more moderate approach to environmental responsibility as there are currently limited recommendations, regulations, or directives that need to be implemented specifically for these sectors [
2]. Directive 2024/1785 [
3] on industrial emissions lays down the rules for the integrated prevention and pollution control resulting from industrial activities in intensive poultry and pig farming, waste industry, metal production and processing, chemical industry, slaughterhouses, food production and dairy, energy, minerals industry, surface treatment, and pulp, paper or wood products [
3].
There is a large number of small enterprises often operating on the assumption that their impact is negligible because of their size. However, these enterprises can be considered ‘silent destroyers’ as their overall environmental impact is significant. For example, in 2022, there were a total of 119,130 registered enterprises in Slovenia. Among them 110,838 were micro-, 6755 small-, and 1299 medium-sized enterprises, which represented 99% of all enterprises in Slovenia [
4]. This underlines the importance of considering environmental impacts at all levels of business rather than focusing on large enterprises only. The cumulative impact of these smaller enterprises’ activities must be recognised and integrated into a broader environmental policy in order to bring out effective and sustainable change. Small enterprises are often engaged as subcontractors supporting main production facilities of large food production companies. The reduction in small enterprises’ emissions can thus improve the overall environmental image of the whole product’s life cycle.
While the world population continues to grow, the available resources remain unchanged. Currently, the world population has been growing at a rate of around 0.87% per year. According to global statistics, this means about 363 thousand people are born every day, resulting in an increased population for about 192 thousand people every day [
5]. It is estimated that nine billion people will need three times more resources in 2050 in comparison to the resources extracted in 2013, namely 140 billion tonnes per year. In addition, the two billion middle-income beneficiaries in the developing world were expected to triple their consumption by 2020. By 2020, the demand for food, feed, and fibre increased by 70%, while in 2013, the ecosystems which these resources rely on were already 60% degraded [
6]. The latest world population projections indicate that world population will reach 10 billion in the 2060 and 10.2 billion in 2100 [
5]. According to Leahy [
7], in 2018, 75% of Earth’s land was degraded, and if this trend continues, 95% of Earth’s land areas could become degraded by 2050. This projection highlights the urgent need for sustainable land management practices to prevent further environmental degradation.
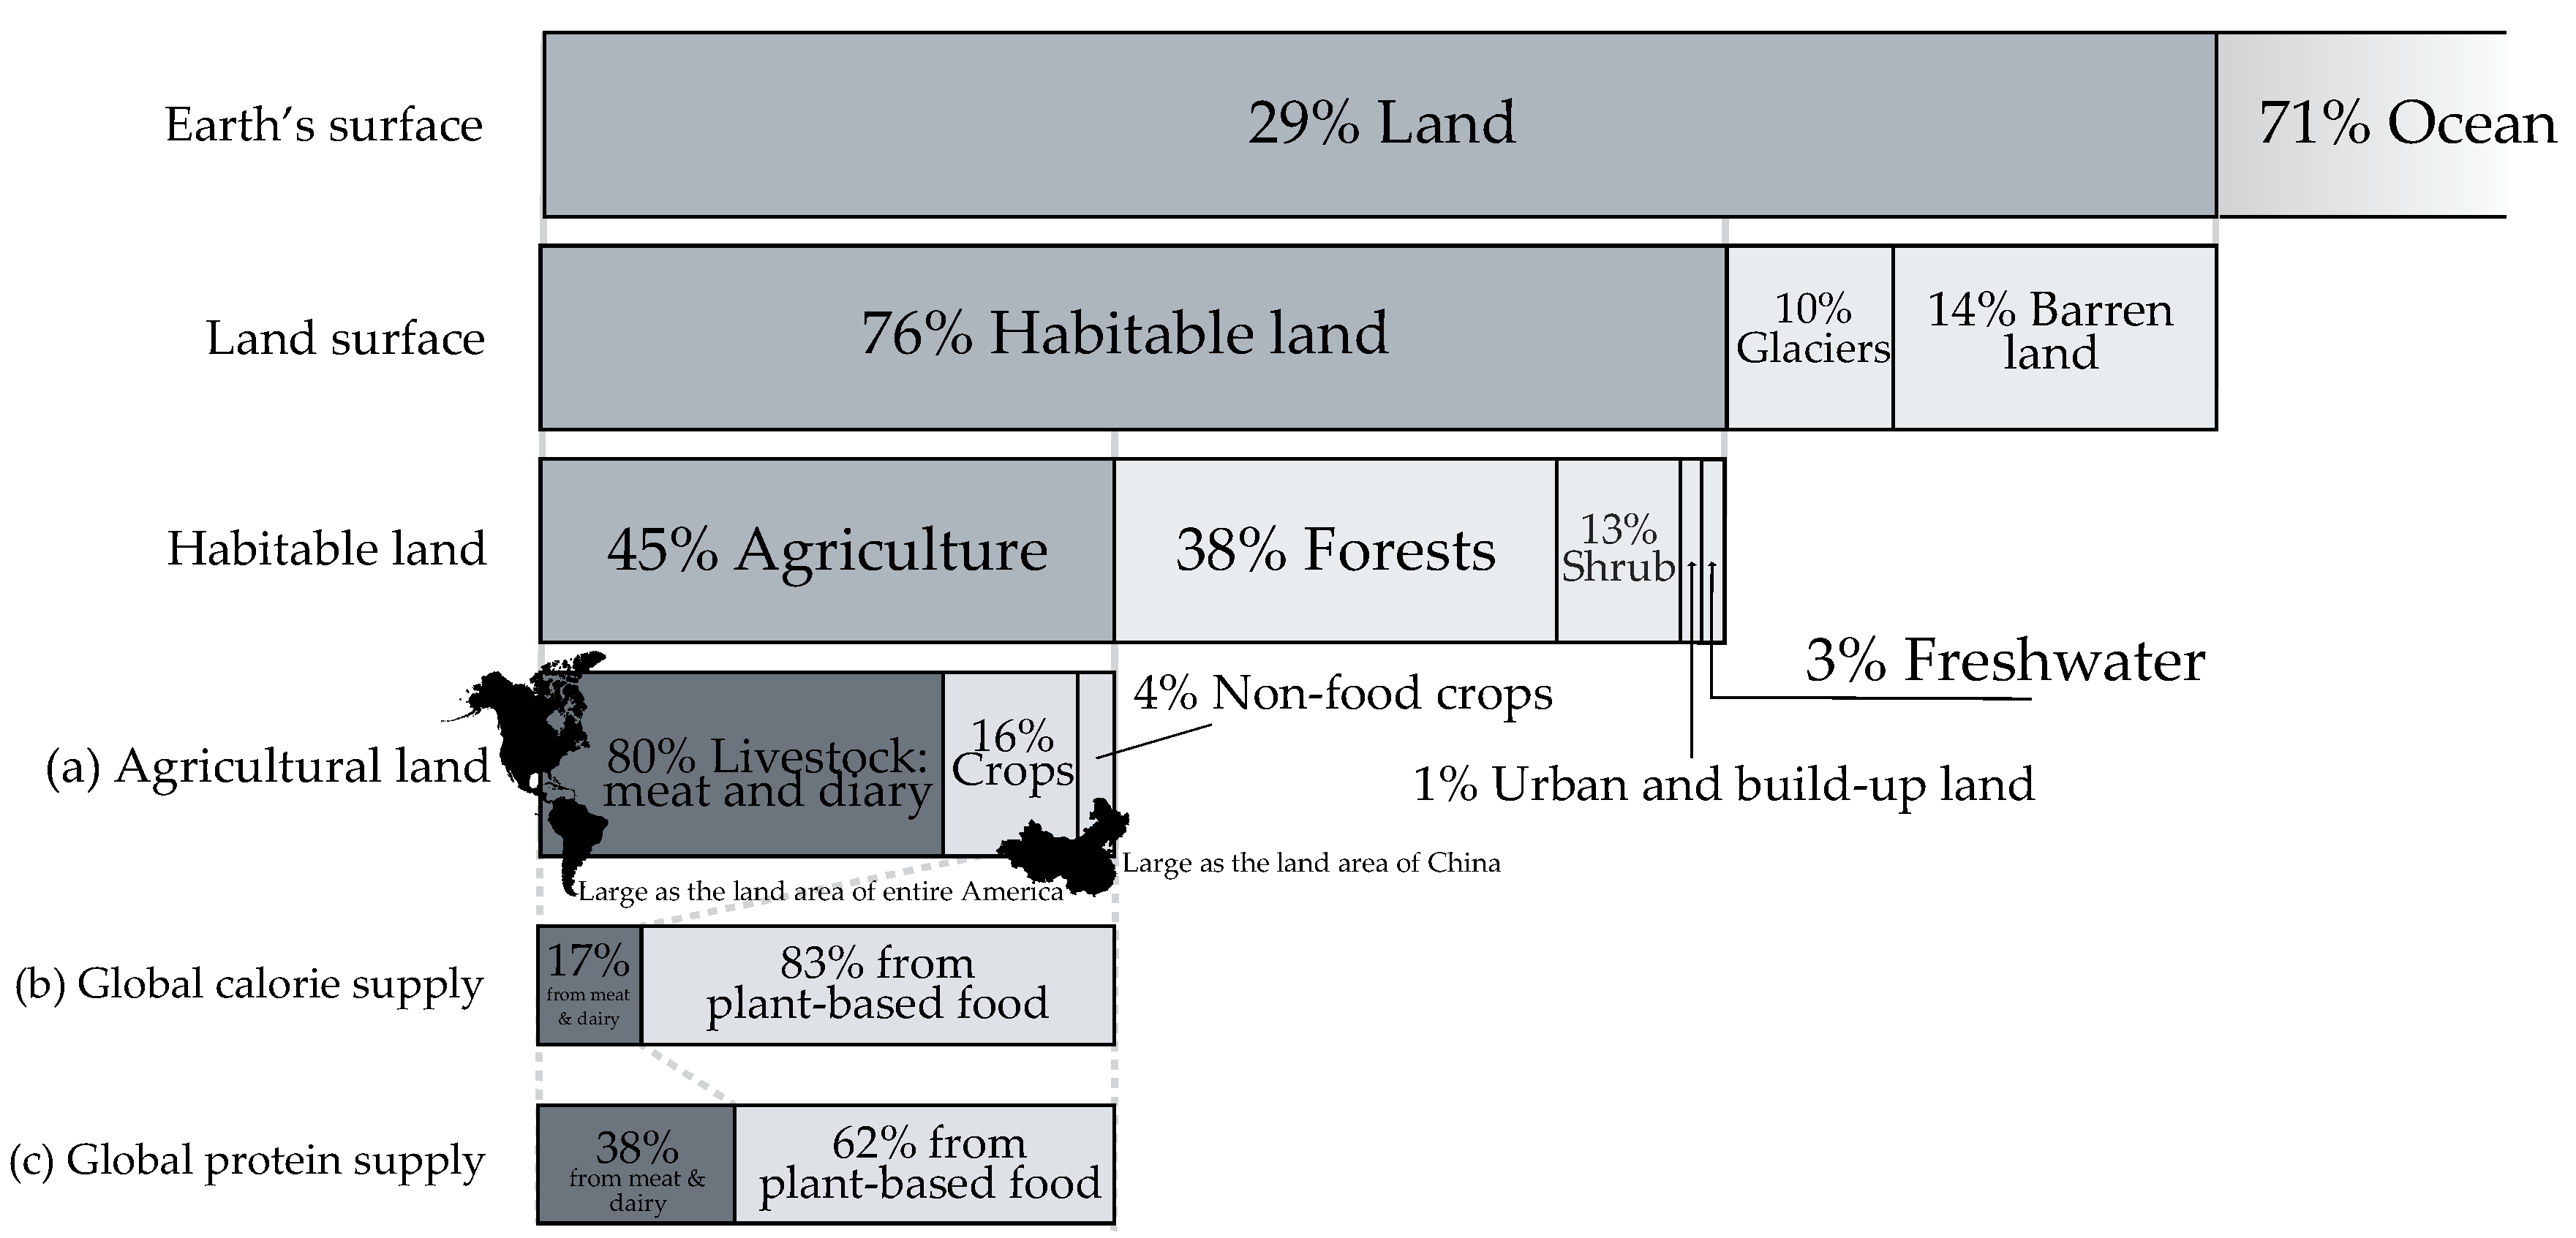
The Earth’s surface area consists of water (71%; equivalent to 361 million km
2) and land (29%; equivalent to 149 million km
2), but not all land is suitable to be used for agriculture. Among this 29% of land, only 76% (equivalent to 113 million km
2) is considered habitable, while the rest of it are glaciers (10%; equivalent to 15 million km
2) and barren land (14%; equivalent to 21 million km
2) not suitable for food production. Habitable land is further divided into agricultural land (45%; equivalent to 51 million km
2), forests (38%; equivalent to 43 million km
2), scrubland (13%, equivalent to 15 million km
2), urban areas (1%; equivalent to 1 million km
2), and freshwater areas (3%; equivalent to 3 million km
2). This means that only 9.9% (equivalent to 51 million km
2) of the Earth’s total surface area is suitable for food production. About 80% (equivalent to 41 million km
2) of agricultural land is devoted to livestock, which provides only 17% of the world’s calories supply and 38% of world’s protein supply. Only 16% (equivalent to 8 million km
2) of agricultural land is dedicated to crop production for food, which produces 83% of calorie supply and 62% of protein supply that are plant-based (see
Figure 1) [
8].
Even when arable land is identified, its effective size is often smaller due to additional influencing factors, such as terrain configuration and freshwater availability. The area of land suitable for food production continues to shrink, mainly as a result of past human activities. Three of the most important factors are urbanisation, deforestation, and unsustainable agricultural practices, including overgrazing. Urbanisation leads to the expansion of cities, which often convert agricultural land into urban areas, leaving less space for agriculture [
9]. Deforestation is driven by the clearing of forests for timber, agriculture, and other development, leading to soil erosion, loss of biodiversity, and a decline in agricultural productivity [
10]. In 2023, 3.7 million hectares of tropical primary forest were lost, which is equivalent to almost 10 football fields being lost per minute [
11]. Unsustainable agriculture and overgrazing deplete soil nutrients, contribute to desertification, and further reduce soil quality and productivity [
9].
Roughly 80% of the world’s arable land is affected by at least one form of degradation, such as aridity, vegetation decline, soil salinization, and loss of soil carbon [
12]. Aridity (affecting 54.7% of the world’s arable land) and soil erosion (affecting 26.9% of the world’s arable land) are the most common forms of degradation [
13]. Land degradation is severely limiting the land’s potential for agricultural use [
14]. Based on the data in
Figure 1, the amount of undegradable (arable) land for food production can be easily estimated. Multiplying the land share of the Earth (29%) with the shares of habitable land (76%), the land suitable for agriculture (45%) and the undegraded land (20%) results in only about 2% (equivalent to 10.2 million km
2) of the total Earth’s surface which remains undegraded and suitable for food production. With the projected population growth, it is essential to increase food production on the same area or even smaller area of land to adequately feed the world’s population [
15].
An essential part of food production is agriculture, where additional problems can occur, such as the excessive use of fertilisers and pesticides, intensive agriculture with biodiversity loss, and many others. In addition, in Central and Eastern Europe, for example, compaction became the dominant cause of soil degradation in intensive agriculture [
16]. By 2008, about 50 million hectares of arable land had been damaged due to the usage of powerful and heavy agricultural machinery, and nowadays, the damage is still increasing [
6]. Soil compaction changes soil structure by increasing the bulk density and decreasing the total porosity of soil, resulting in penetration resistance for nutrients and water. In such compacted soils, it is very difficult for plants to take roots.
With agriculture, the biodiversity of species is reduced due to deforestation and intensive agriculture. Agriculture and aquaculture threaten about 58% of the world’s 28.000 endangered species, which cannot live in modified ecosystems [
17].
In 2016, the energy sector was the largest contributor to global greenhouse gas (GHG) emissions with 73.2%, followed by agriculture, forestry, and land use (18.4%), industry (5.3%), and the waste management sector (3.2%) [
18]. GHG emissions, consisting mainly of carbon dioxide, methane, nitrous oxide, and fluorinated gases accumulate heat in the atmosphere. The amounts of GHG emitted in agriculture and food production largely depend on what is being farmed and how the land in question is being managed [
19]. In agriculture, carbon dioxide can be released from lime, which is used to reduce soil acidity [
17], fossil fuels consumption, and decomposition of plant matter [
20]; however, it is also used in photosynthesis. Carbon dioxide is essential for oxygen production and for normal plant growth. If the content of carbon dioxide falls under 0.02 vol%, a problem with photosynthesis occurs [
1]. In 2019, the net emissions of carbon dioxide at the Earth’s surface were 2.5 ppm per year [
21]. Food production also releases other important greenhouse gases, including methane, ammonia, and nitrous oxide. Methane is mainly released by enteric fermentation in ruminants, ammonia is produced using fertilisers, and nitrous oxide is produced by various agricultural processes, including the use of fertilisers and manure management [
17]. It is important to distinguish between carbon dioxide and carbon dioxide equivalent emissions, which include other GHG emissions, too. For example, during the production of 1 kg of Emmental cheese, 25% of GHG emissions is carbon dioxide, 62% is methane, and 13% are other GHGs [
22].
Less obvious environmental impacts in agriculture and food production are related to the nutrition runoff caused by excessive fertilisation, eutrophication, which can cause algal blooms [
23], soil degradation caused by intensive farming [
24], and altered microclimates as a side effect of large scale deforestation [
25]. Globally, agriculture is a leading contributor to eutrophication [
17]. During algae blooming, cyanobacteria produce an array of toxins [
26] which are dangerous for all living organisms, with significant impacts on a human’s lungs, liver, and kidneys [
27].
The usage of pesticides affects air, soil, and water quality, while some chemicals present in pesticides are persistent and can bioaccumulate in the food chain [
28]. Each pesticide has different impacts on ecosystems. They can: (a) be toxic to aquatic life and can affect aquatic biodiversity [
29] (e.g., glyphosate); (b) affect the nervous system of target and non-target organisms and possess a significant risk to wildlife and human health [
30] (e.g., chlorpyrifos); (c) be associated with endocrine disruption, which can affect the reproductive health of wildlife and humans [
31] (e.g., atrazine); and (d) cause respiratory problems and neurological effects in humans and other mammals [
32] (e.g., methomyl).
Airborne pollutants PM2.5 and PM10 are problematic since they can be inhaled deep into the lungs, leading to respiratory and cardiovascular issues [
33]. Research has shown that, for example, the PM10 emissions for agriculture in the USA correspond to approximately 4032 million tons per year [
34]. These agriculture emissions consist of approximately 3751 thousand tons PM10 from crop tilling and livestock dust emissions, 265 thousand tons for agricultural field burning, and 15 thousand tons from livestock waste and fertiliser application in 2002.
The environmental impacts of food production exceed planting and harvesting and occur directly and indirectly at various stages of the value chain. Indirect impacts arise from the fuel consumption during transport, while direct impacts arise from energy-intensive processes, such as pasteurisation and drying to extend shelf-life by eliminating micro-organisms.
Preventing natural disasters usually requires action before there is firm evidence of damage, especially if the damage would be delayed and irreversible; this approach to scientific evidence and policymaking is part of the precautionary principle [
28]. Even if the use of pesticides appears to be within acceptable limits, cumulative effects can occur if pesticides are used consistently. Once these substances exceed the established thresholds, they can cause changes in biological systems. Holden and Erlich [
35] were first addressing the equation to assess the potential harm to environment, where three factors need to be considered to assess the potential harm to environment: population (
P), per capita affluence (
A), and technology factor (
T) [
36]. The procedure for how the environmental impact (
I) is calculated is presented in Equation (1).
Considering all these aspects, it is evident that environmental impacts are increasing steadily. From 1950 to 2010, the global population (
P) has tripled [
36], while projections for 2050 indicate the potential of a further tripling of the global population [
6]. Affluence (
A), which can be simply addressed as gross world product per capita and which represents the market value of all goods and services produced within a year, is also expected to increase over time [
36]. Conversely, the technology factor (
T) should be reduced in order to ensure that environmental impact remains at its present level. Life cycle assessment (LCA) can therefore be considered as a methodology that can guide technological decisions toward eco-efficiency solutions [
36]. The precautionary principle is inevitable for maintaining the current level of environmental impact. A key element of the precautionary principle was the general rule of public policy action in the face of potentially serious or irreversible threats to health or the environment, whereby action should be taken against potential threats before there is strong evidence of harm, taking into account the possibly costs and benefits of action and inaction [
28]. Current scientific research focuses on eco-conscious consumption. Lin et al. [
37] investigated the relationship between health literacy, food safety, and environmental concerns related to take-out food consumption in China. Gathy et al. [
38] considered environmental and health awareness regarding food of students at university, finding low health and environmental awareness in students’ food choices. Industry practices, e.g., Barilla company, focus narrowly on carbon and water scarcity footprints, omitting damage to human health with the predefined LCIA method [
39].
To this day, there is only one standardised method for a comprehensive evaluation of environmental burdens of products and processes, i.e., environmental life cycle assessment (LCA). LCA results can be evaluated based on environmental impacts and/or environmental damage. All these aspects can be quantified using different life cycle impact assessment (LCIA) methods, where more than 20 different midpoint impacts categories and more than three damage categories can be evaluated, depending on the LCIA method used. Environmental targets in the EU are supported by policy frameworks and LCIA methods such as the European Commission’s Environmental Footprint (EF) 3.1 method, which prioritises climate change over other impact categories (acidification, ecotoxicity, particulate matter, eutrophication, human toxicity, etc.), assigning climate change the highest weight (21.06%) [
40]. LCA plays a crucial role in sustainability reporting in the food sector and in the preparation of environmental product declarations (EPDs). Modern LCIA methods now establish a direct link between environmental impacts and the damage to human health, ecosystems, and the economic costs associated with resource depletion. Recent methodological advances emphasise the quantification of damage to human health, reflecting a shift towards holistic sustainability assessments in the food industry.
In view of a perceived lack of communication regarding the food products’ impact on human health, this paper presents an overview of the LCIA methodologies that include impacts on human health within LCA results. For that reason, 27 different LCIA methods were reviewed and analysed. LCA results are the basis for optimisation of environmental performance in food production and promoting sustainable food systems. By enabling comparative assessments, LCA identifies products with lower environmental impacts compared to alternatives. Directive (EU) 2024/825 [
41], which empowers consumers for better protection from greenwashing, suggests evidence-based justification for sustainability claims, positioning LCA as an important compliance tool.
In addition, the paper provides examples of practical application of all LCIA methods that are currently available for evaluating damage to human health in relation to the production of selected food products. LCA results provide food producers with the ability to prioritise more environmentally sustainable food suppliers within the supply chain. Consumers can also use LCA results to select food products in restaurants and shops that have a lower environmental impact. To support informed sustainable choices, there is a need for the implementation of standardised sustainability labelling schemes for all food products. It is imperative that stakeholders, food producers, and consumers receive education to correctly interpret LCA results, ensuring sustainability claims align with scientific evidence and avoid misinterpretation. This study aims to improve the understanding of sustainable food systems and promote evidence-based decision-making among stakeholders along the entire food supply chain, from field to fork.
3. Results and Discussion
There are 27 up-to-date LCIA methods that can be used for assessing the environmental impacts, but only 5 of them cover human health impacts: (a) Impact World+; (b) ReCiPe 2016; (c) LC-IMPACT; (d) EPS2015d; and (e) Environmental prices.
The Impact World+ method presents the results using 27 midpoint indicators, 11 of which are related to harm to human health. ReCiPe 2016 looks at 22 midpoint indicators, 8 of which are related to human health impacts. The LC-IMPACT LCIA method for an average preference for all impacts for 100 years reports the results through 20 midpoint indicators, with 8 indicators focusing on human health impacts. All three methods (Impact World+, ReCiPe 2016, and LC-IMPACT) quantify the damage to human health in terms of DALY [
44].
The Environmental Prices method uses 18 midpoint indicators, 8 of which are associated with human health impacts. The EPS 2015d method presents the environmental impact through 24 midpoint indicators, with 12 indicators related to human health. In both methods, environmental damage is expressed in monetary units. The EPS 2015d method uses the Environmental Load Unit (ELU), where one ELU represents an externality equivalent to one euro of environmental damage costs. In later versions, conventional currencies such as the euro or the US dollar are used [
45]. In addition, the Environmental Prices method uses the 2015 euro as the standard unit (EURO2015), which represents the economic welfare loss caused by the release of an additional kg of pollutant into the environment [
43].
Table 1 summarises the above breakdown of impact categories for each of the LCIA methods, with the special focus on midpoint indicators combined into human health endpoint indicator. In
Table 1, the impact categories’ names are simplified and aggregated to ease the understanding of which impact categories describe similar environmental aspects. These impact categories do not have the same input parameters and weighting factors and are not calculated in the same way.
As can be seen in
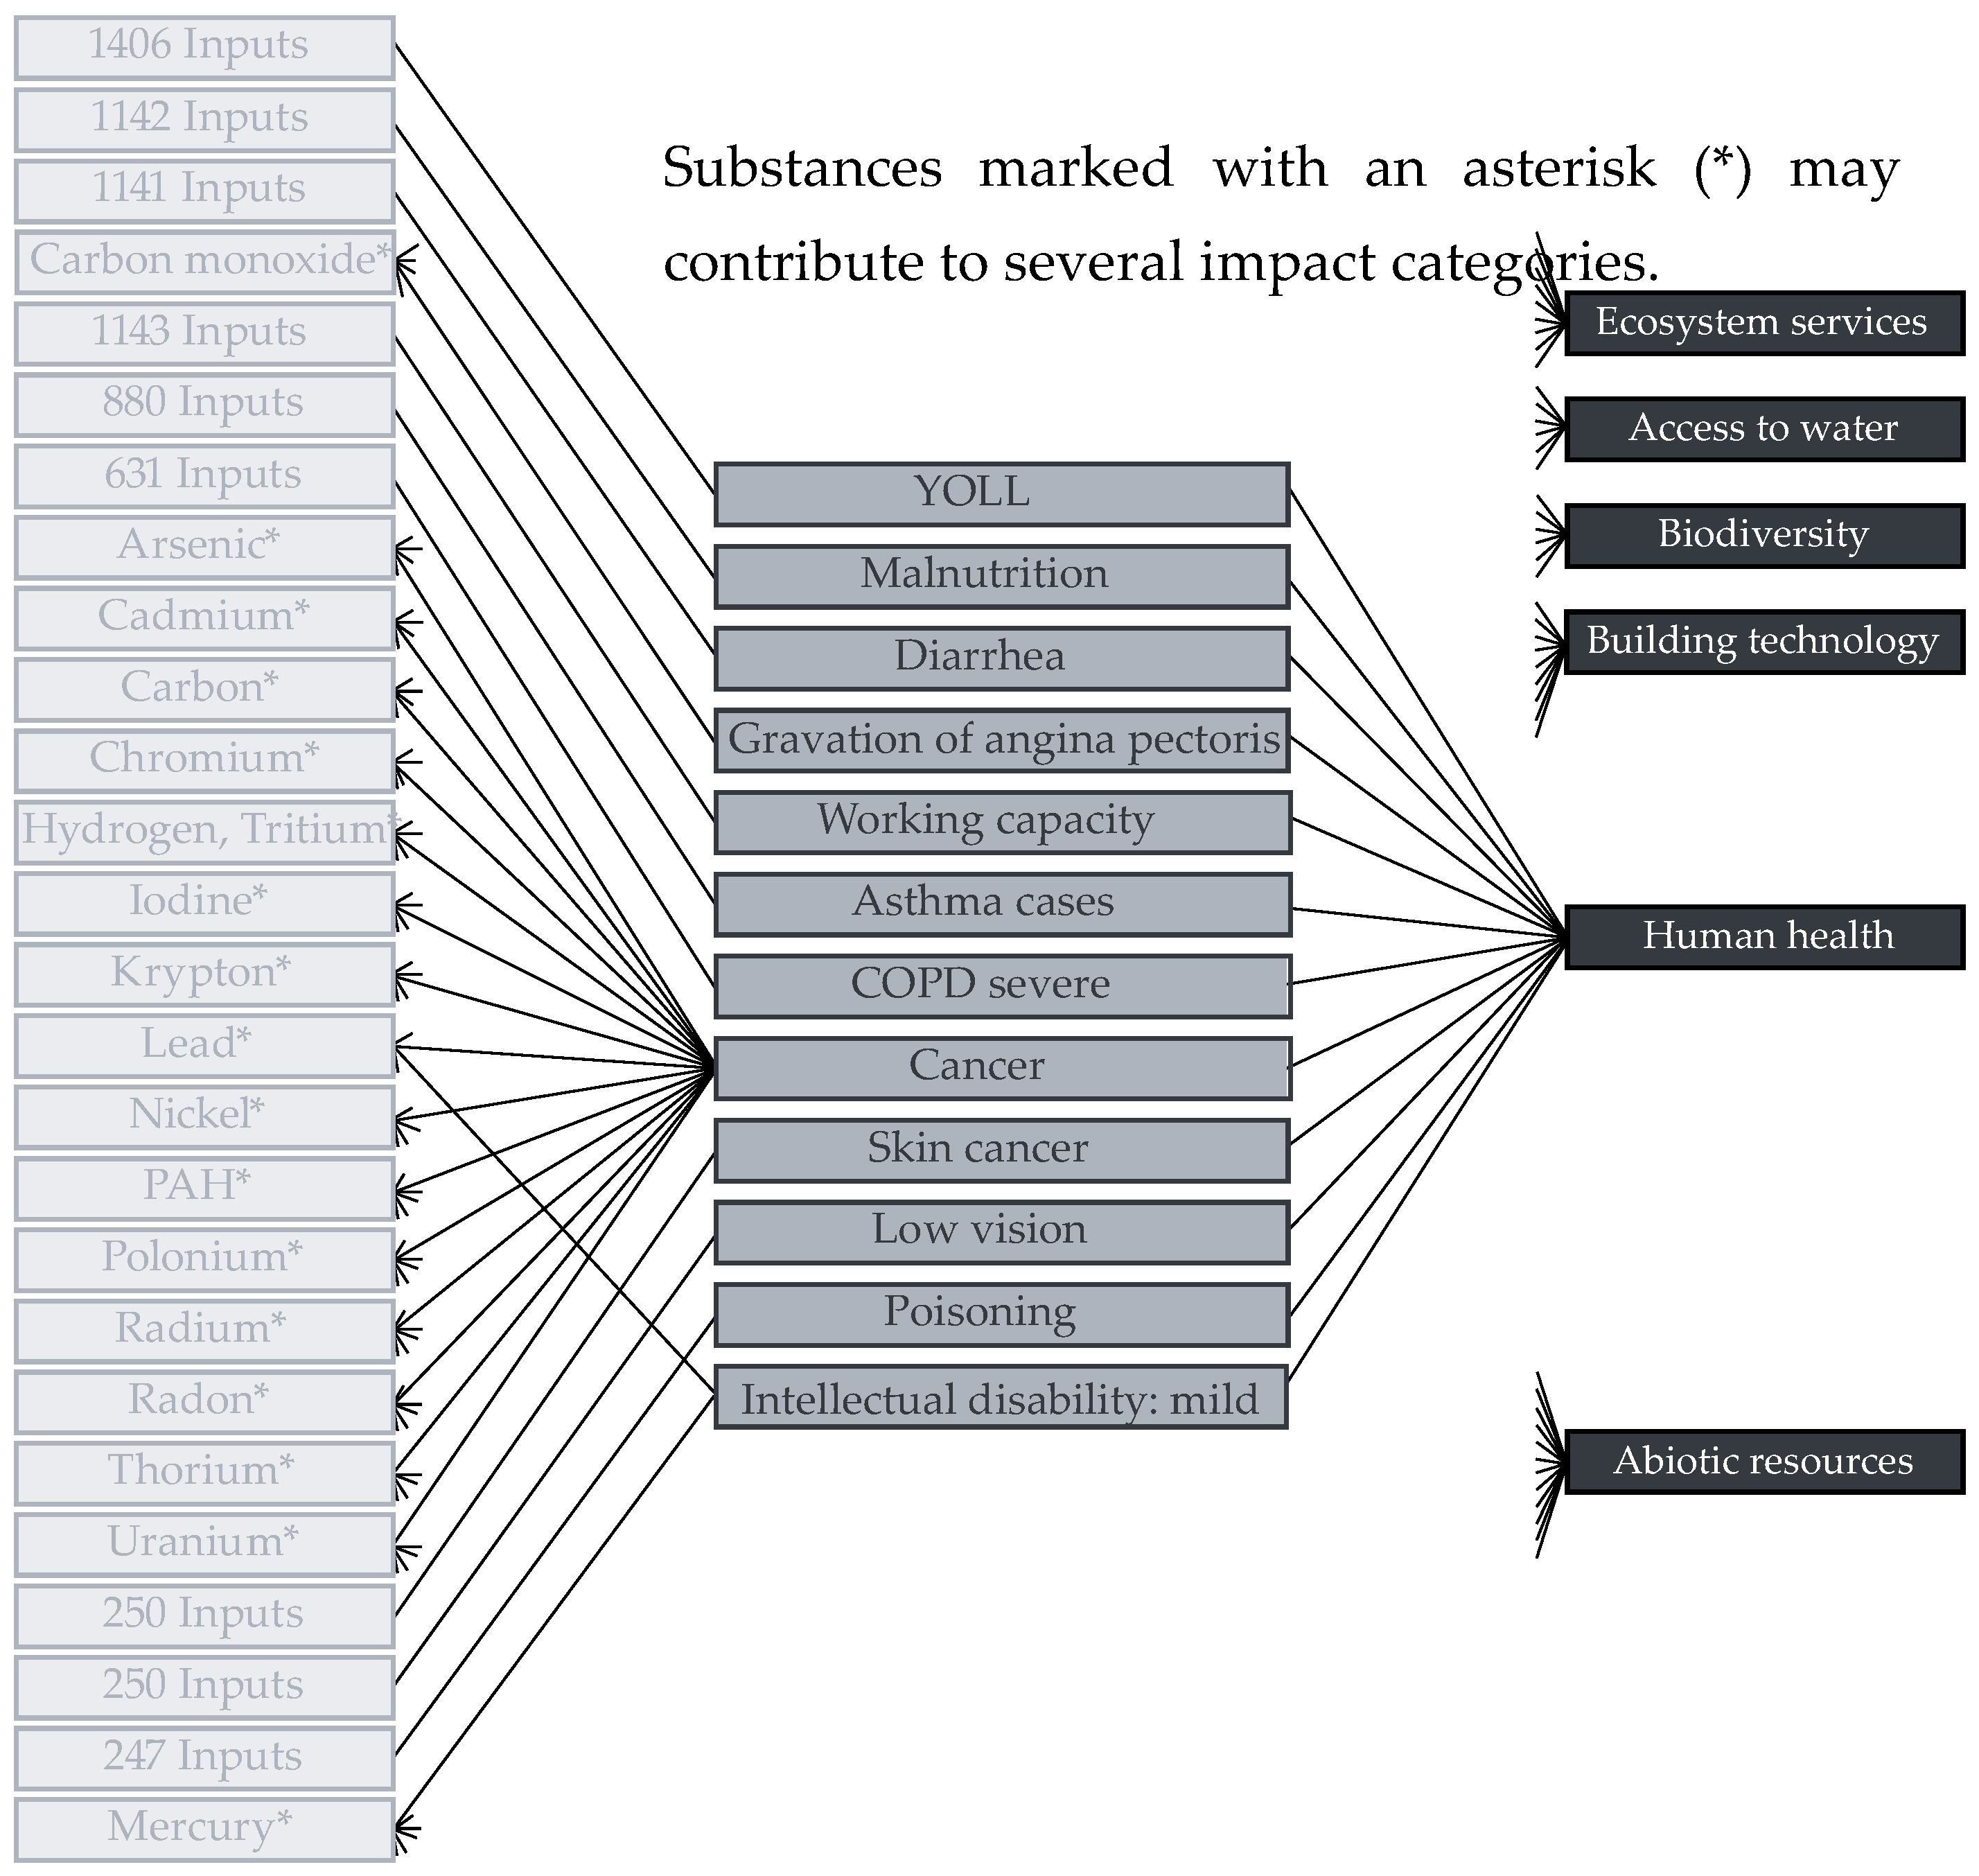
Table 1, four of five impact assessment methods have similar names for their impact categories, while EPS 2015d stands out with a significantly different concept and terminology. In EPS 2015d, the midpoint indicators are linked to 12 specific diseases, such as asthma cases, cancer, and low vision (
Figure 2). These indicators are more intuitive and allow users to associate them easily with human health damage compared to abstract indicators such as acidification or particulate matter formation. In addition, these disease-related indicators are linked to the substances responsible for causing the specific diseases. The midpoint indicators are further aggregated into five different endpoint damage categories: (a) ecosystem services, (b) access to water, (c) biodiversity, (d) building technology, (e) human health, and (f) abiotic resources (
Figure 2).
As seen from
Table 1, three out of five LCIA methods use DALY as a unit to measure the impact on human health. To interpret the results expressed in DALY, a clear understanding of this unit is essential. The DALY combines time lost due to premature death and time lived in less than good health, loosely referred to as ‘disability’. To calculate DALY, it is important to know the life expectancy at birth. Life expectancy is influenced by socio-economic status, disease prevention approaches, life style, region, and health financing systems [
46]. For the specific case,
DALY is calculated as the sum of the years lived with a specific disease in less than good health (
YLD), and the years of life lost (
YLL) resulting from the specific disease (c), at specific age (a), gender (s), and year when disease was diagnosed (t) (Equation (2)) [
44].
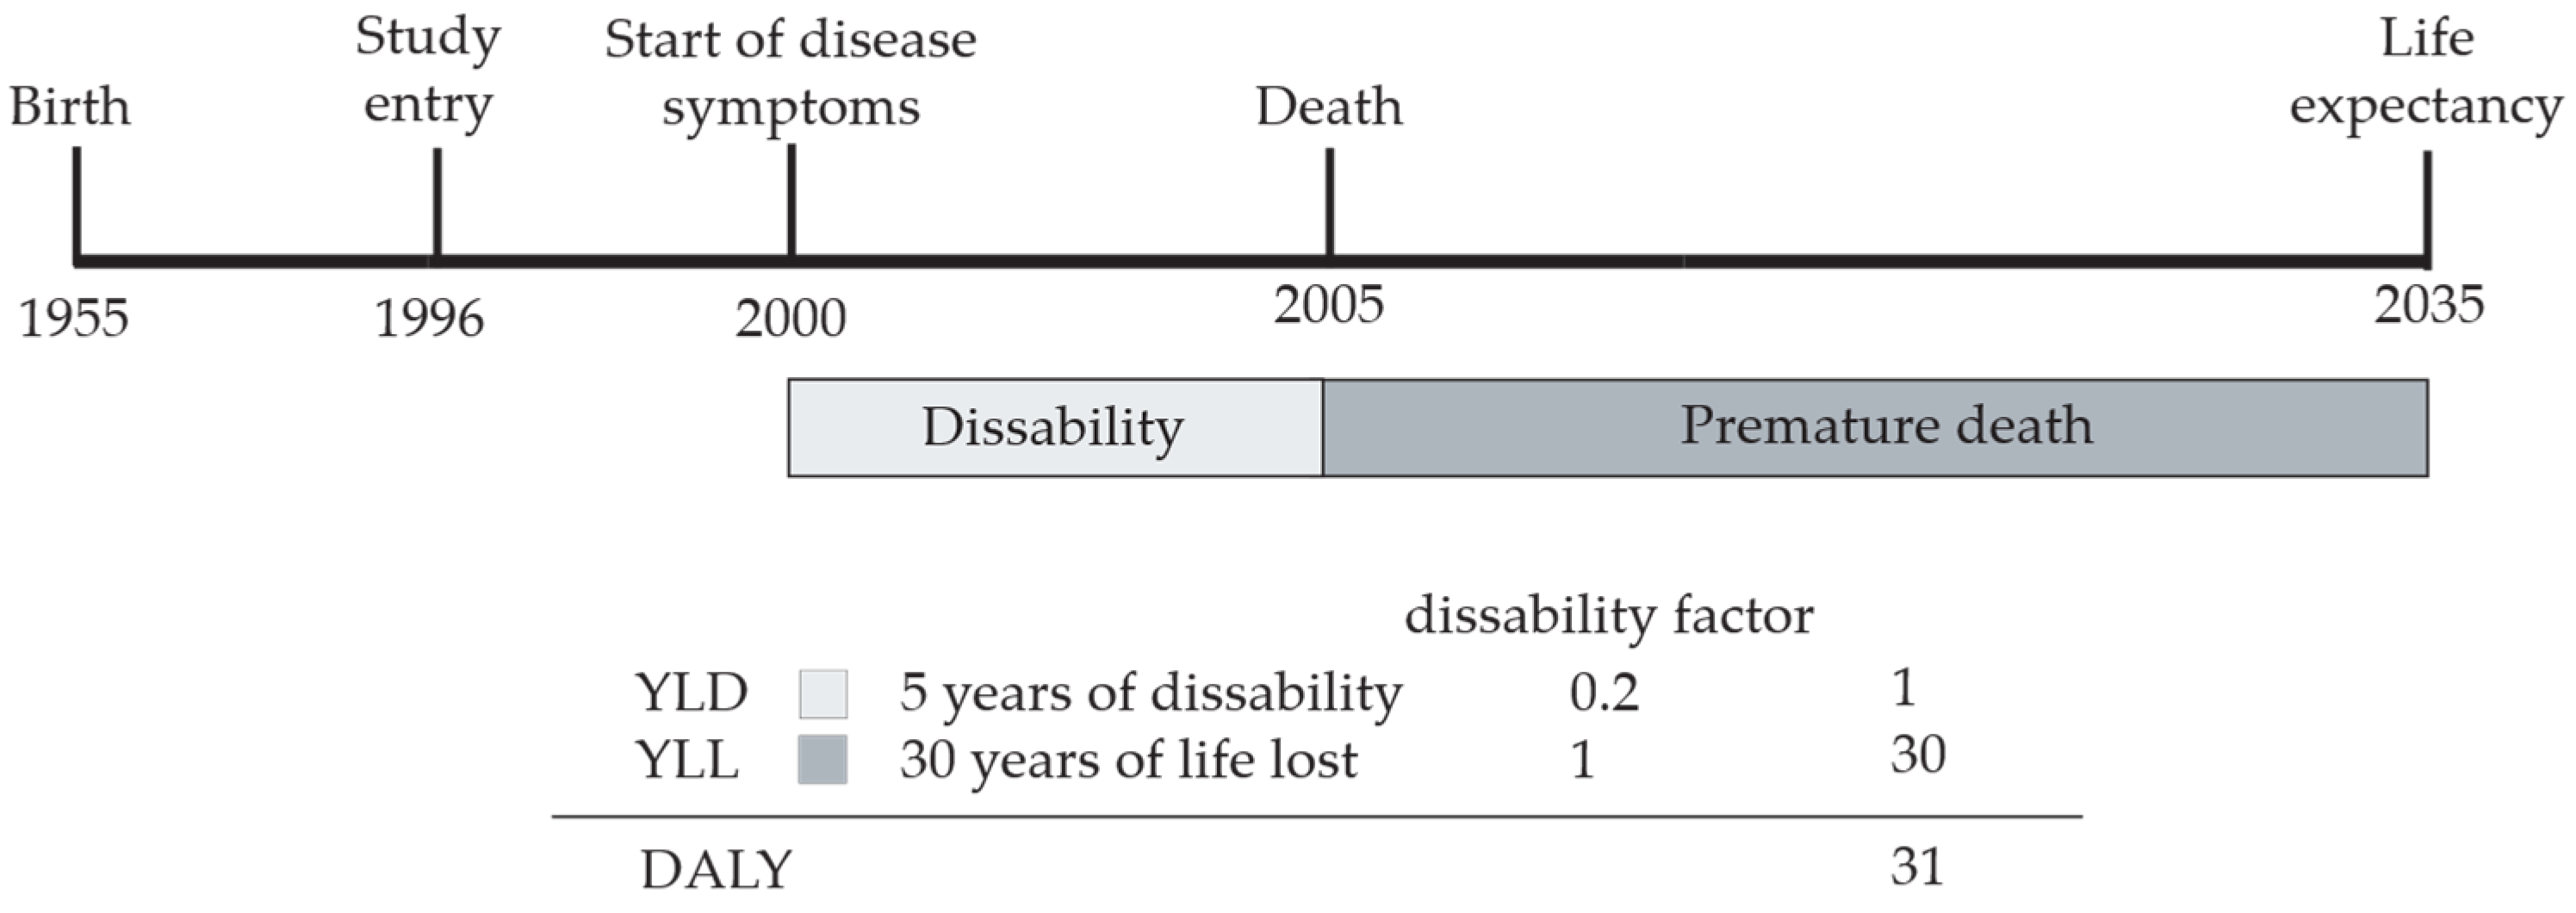
A study published in 2013 showed the calculation procedure of DALYs for 12 different diseases, including cancer, asthma, and Parkinson’s disease [
47].
Figure 3 shows the DALY calculation using diabetes as an example. YLD corresponds to five years of life with diabetes with a disability weight factor of 0.2, resulting in one DALY. For the assessment of the YLL, it is assumed that the person was born in 1955 and that life expectancy at birth in the Netherlands at that time was 80 years. If the disease occurs in 2000 and the person dies in 2005, the YLL would be 30 years. The total DALY value would therefore be 31 years. These results are further visualised in
Figure 3.
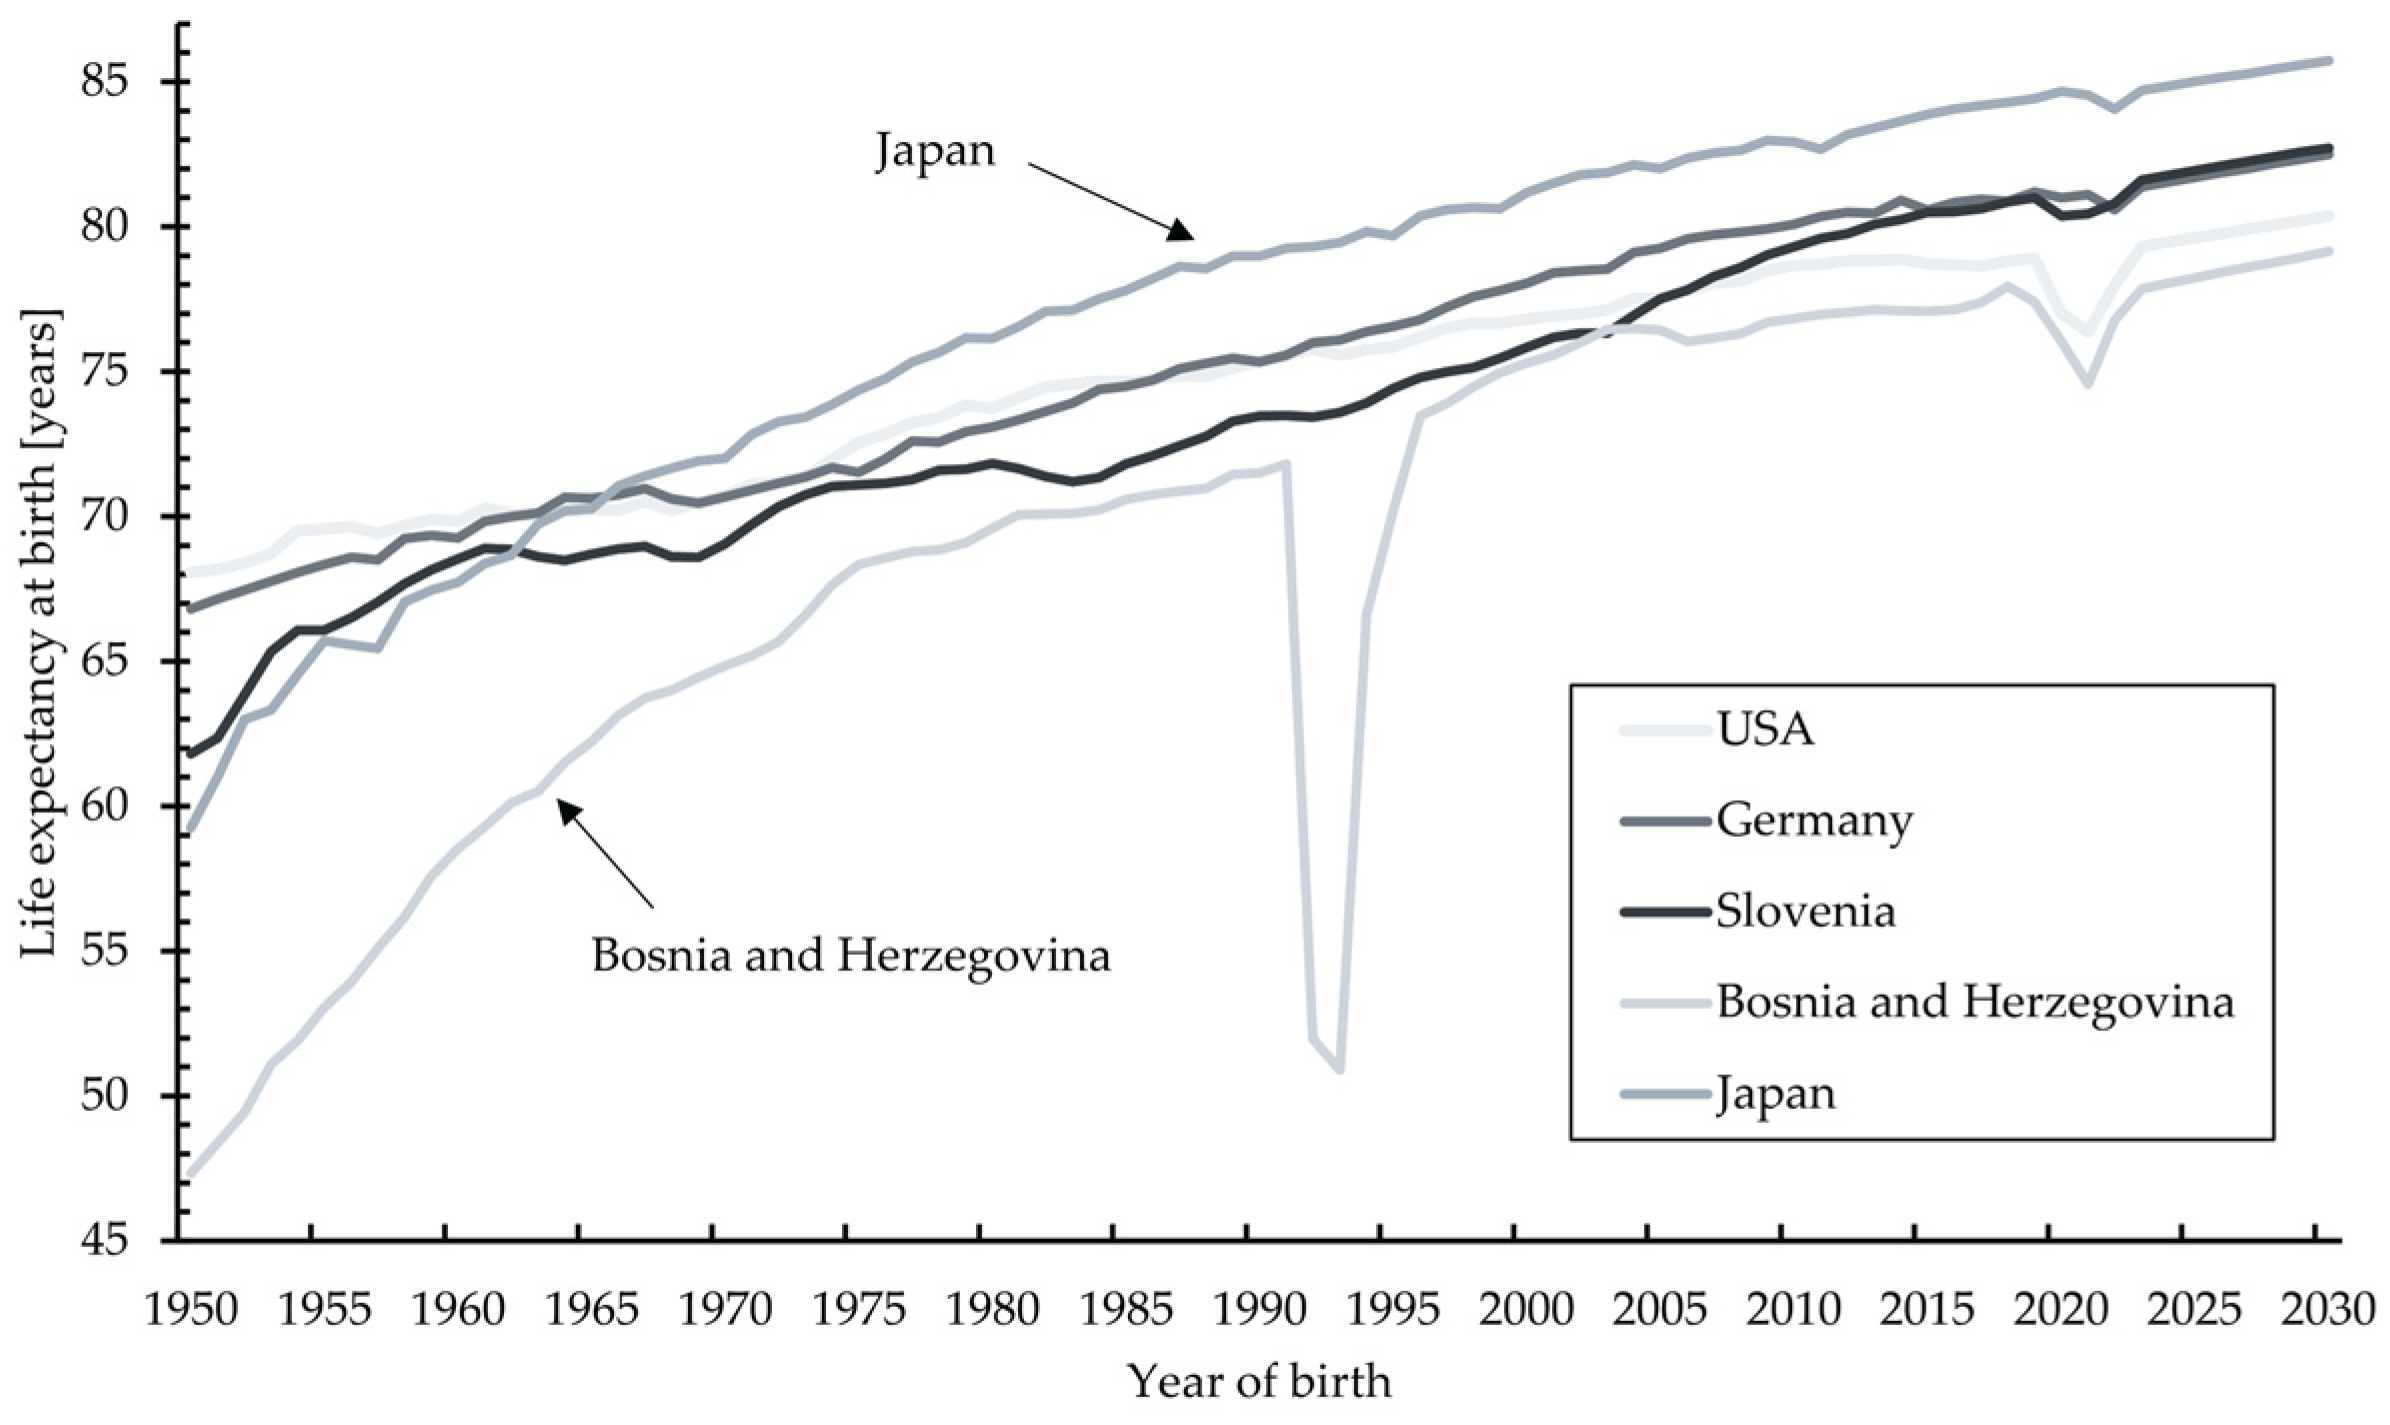
Figure 4 shows the life expectancy at birth for the period from 1950 to 2030 for the USA, Japan, Bosnia and Herzegovina, Germany, and Slovenia. It can be observed that life expectancy is steadily increasing, with a slight decrease between 2020 and 2022 due to the unexpectedly high mortality from COVID-19 [
48]. In addition, Bosnia and Herzegovina shows the largest increase in life expectancy with an increase of 30.52 years from 1950 to 2023, although there was a sharp decline in the early 1990s due to the war in the Balkans during the secession from Yugoslavia [
49].
To support the differences in the LCIA methods that include human health endpoint indicators (
Table 1), LCAs for tomato production were determined using all five LCIA methods. Many LCA studies of tomatoes were already published in the literature, but authors were mainly focused on midpoint indicators. Torrellas et al. [
51] studied tomato produced in an unheated greenhouse in Spain, within the system boundaries cradle-to-farm gate. The environmental impacts were calculated for six categories and flow indicators: cumulative energy demand, abiotic depletion, acidification, eutrophication, global warming, and photochemical oxidation. The results showed that the structure of the greenhouse, the steel in the frame, and the plastic of the cover, were the main hotspots in all of the categories. Another study by Torrellas et al. [
52] that assessed different geographical greenhouse tomato scenarios showed that the most important contributor was the greenhouse heating, highlighting the need to reduce energy consumption and use renewable energy sources where greenhouse heating is necessitated [
52]. Since the study by Torrellas et al. [
51] was a cradle-to-farm gate LCA, the role of transport in the life cycle of tomato is not highlighted. For the assessment of the production of tomatoes by the LCIA methods that include human health endpoint indicator (
Table 1), secondary data for conventionally produced tomatoes in unheated greenhouses in France were taken from LCA based database Agribalyse 3.0, which provides reference on 2500 food products. The functional unit for tomato production was defined as 1 kg of produced tomatoes.
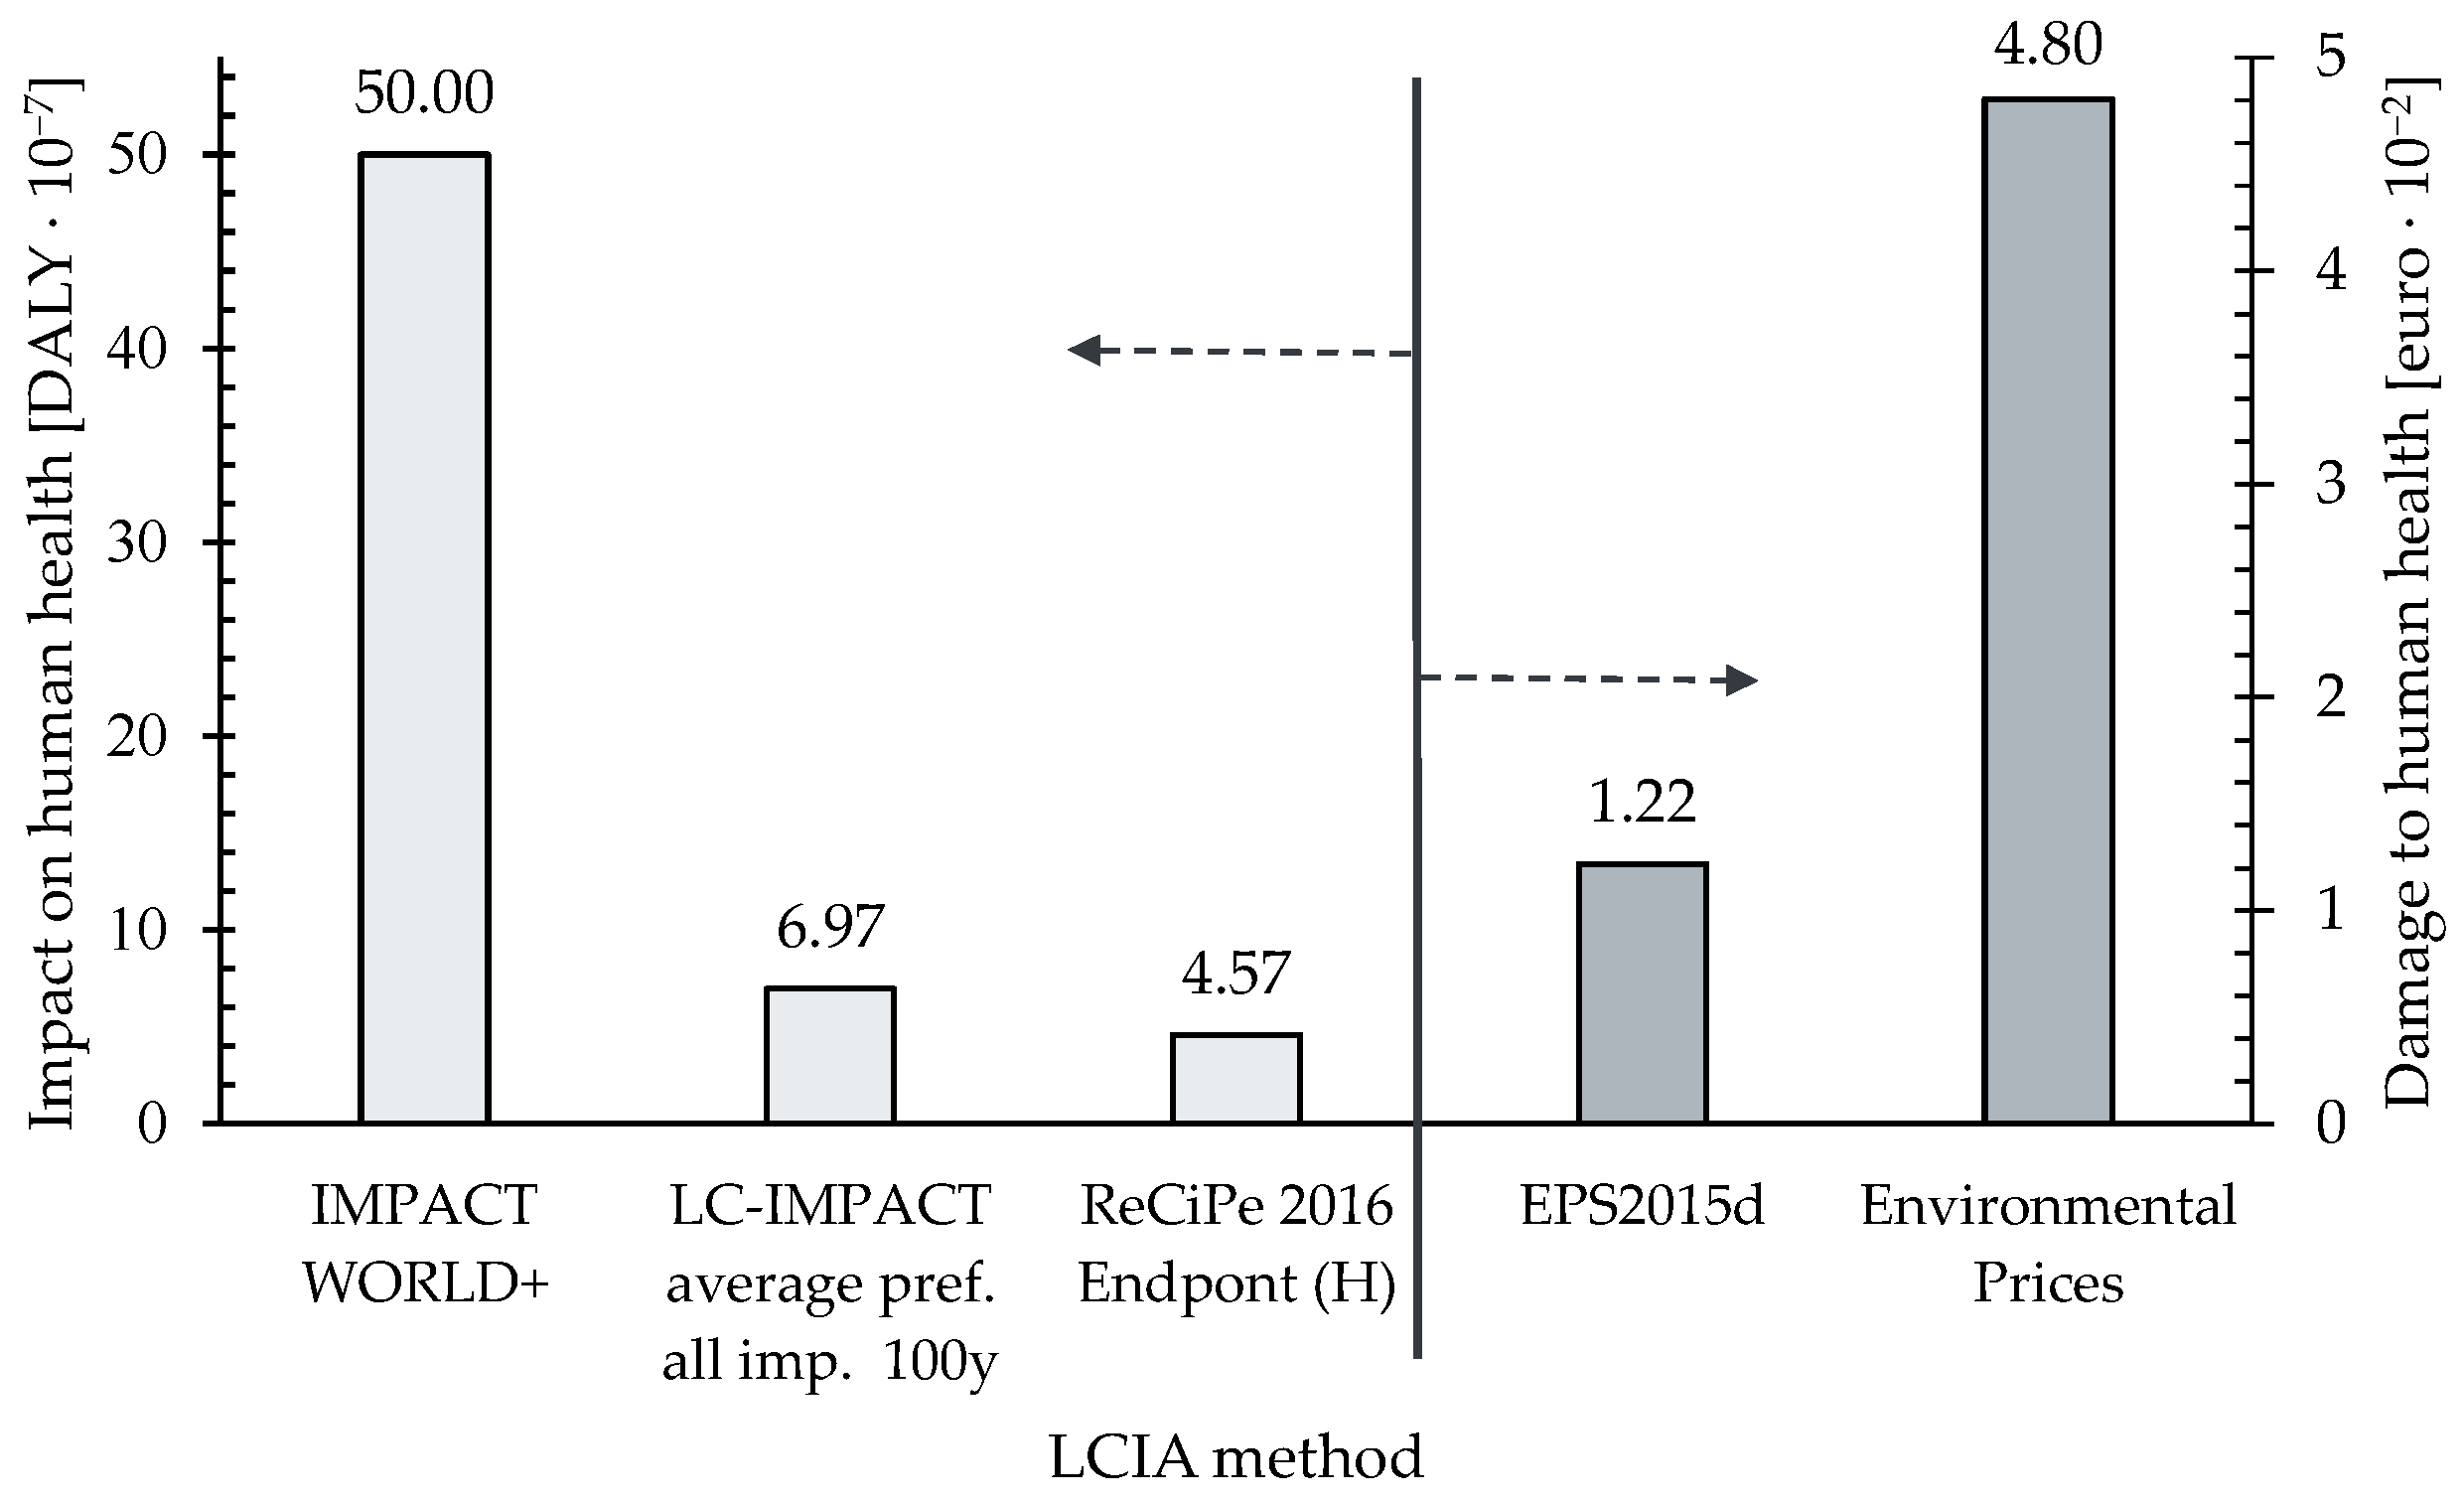
In the LCAs of tomato production conducted with different LCIA methods, the differences in human health damage are substantial, even when the standardised unit DALY was used (
Figure 5). The results of the Impact World+ method deviate the most and they show that damage is approximately six-times higher than the results obtained by the LC-IMPACT and ReCiPe 2016 methods. Although one might initially assume that the values for human health in DALY should be comparable due to the use of the same unit, this is not possible due to the different concepts of human health calculation. The same is also valid for human health results expressed in monetary units, where the damage to human health differs for about four-times (
Figure 5).
The results regarding the damage to human health obtained by the LC-IMPACT method are similar to the results obtained by ReCiPe 2016; therefore, additional comparison was made including other damage categories.
Table 2 shows that other damage categories do not follow this pattern. Ecosystem quality results differ by a million-times due to the different structure of damage category and units. Both units refer to the year, where the first unit is related to species while the other is related to the potential of disappeared fraction.
Findings shown in
Figure 5 and
Table 2 additionally express the necessity to indicate the LCIA method in the LCA reports. Without the knowledge which method was used, it is impossible to understand the given results properly. This is also the reason why the combining some partial results from different studies is not acceptable.
Additionally, the EU has set itself the goal of standardising the modelling of LCA assessments and the reporting of the LCA results using the new Product Environmental Footprint (PEF) method. This method includes 16 midpoint indicators, which are also considered as endpoint indicators by incorporation weighting factors, but does not include a single score indicator that specifically shows the impact on human health [
53]. This suggests that the EU is not keen to emphasise the impact of products or services on human health. As a result, consumers are limited in their ability to decide for themselves what is acceptable to them and what is not.
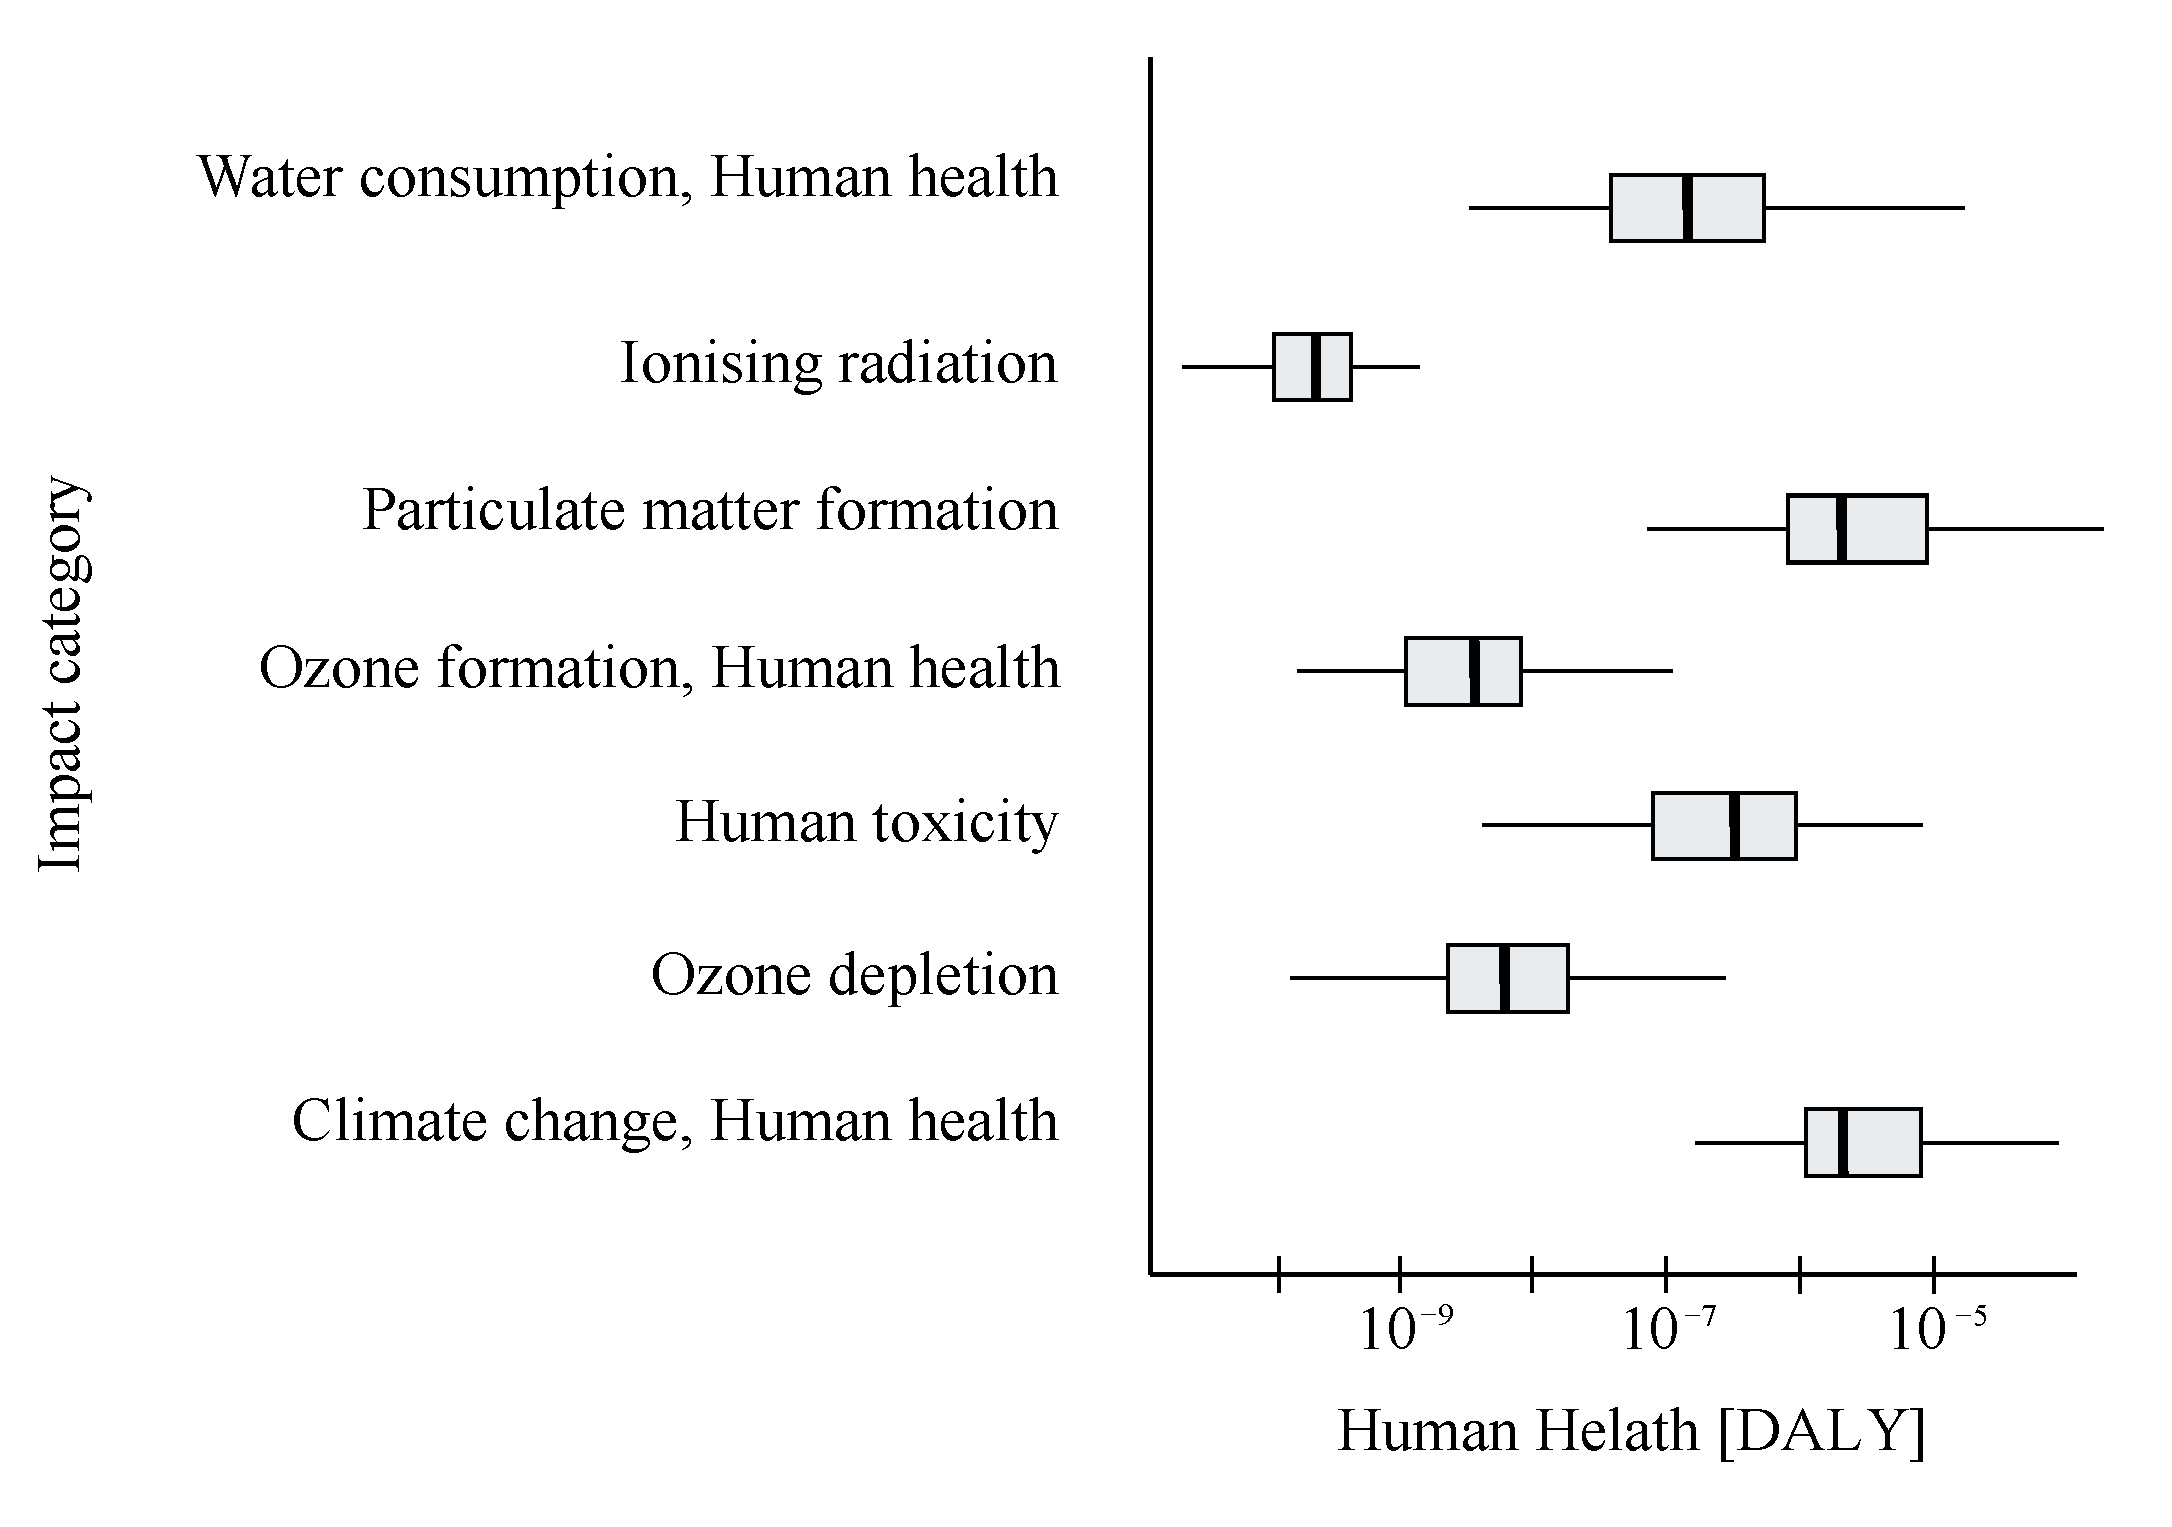
In a study based on food consumption in the Netherlands, the average impact of foods consumed in the Netherlands, expressed as the damage to human health and ecosystems, was calculated for 152 food products using ReCiPe 2016 Endpoint (H) [
54].
Figure 6 shows that the midpoint impact categories that contribute most to human health are particulate matter formation, climate change, human toxicity, and water consumption. The midpoint impact category with the lowest impact on human health is ionising radiation.
In the agriculture and food production sector, many different conclusions have been drawn in recent years whether a particular dietary choice is more harmful to the environment and/or to human health. To highlight the importance of a transparent presentation of environmental impact, especially when talking about impacts on human health, LCAs were carried out for five pizza types and one pizza dough. To model the production of different pizzas, a secondary data from Agribalyse 3.0 database was used, containing all processes to the point where raw pizza is made in a mass production facility.
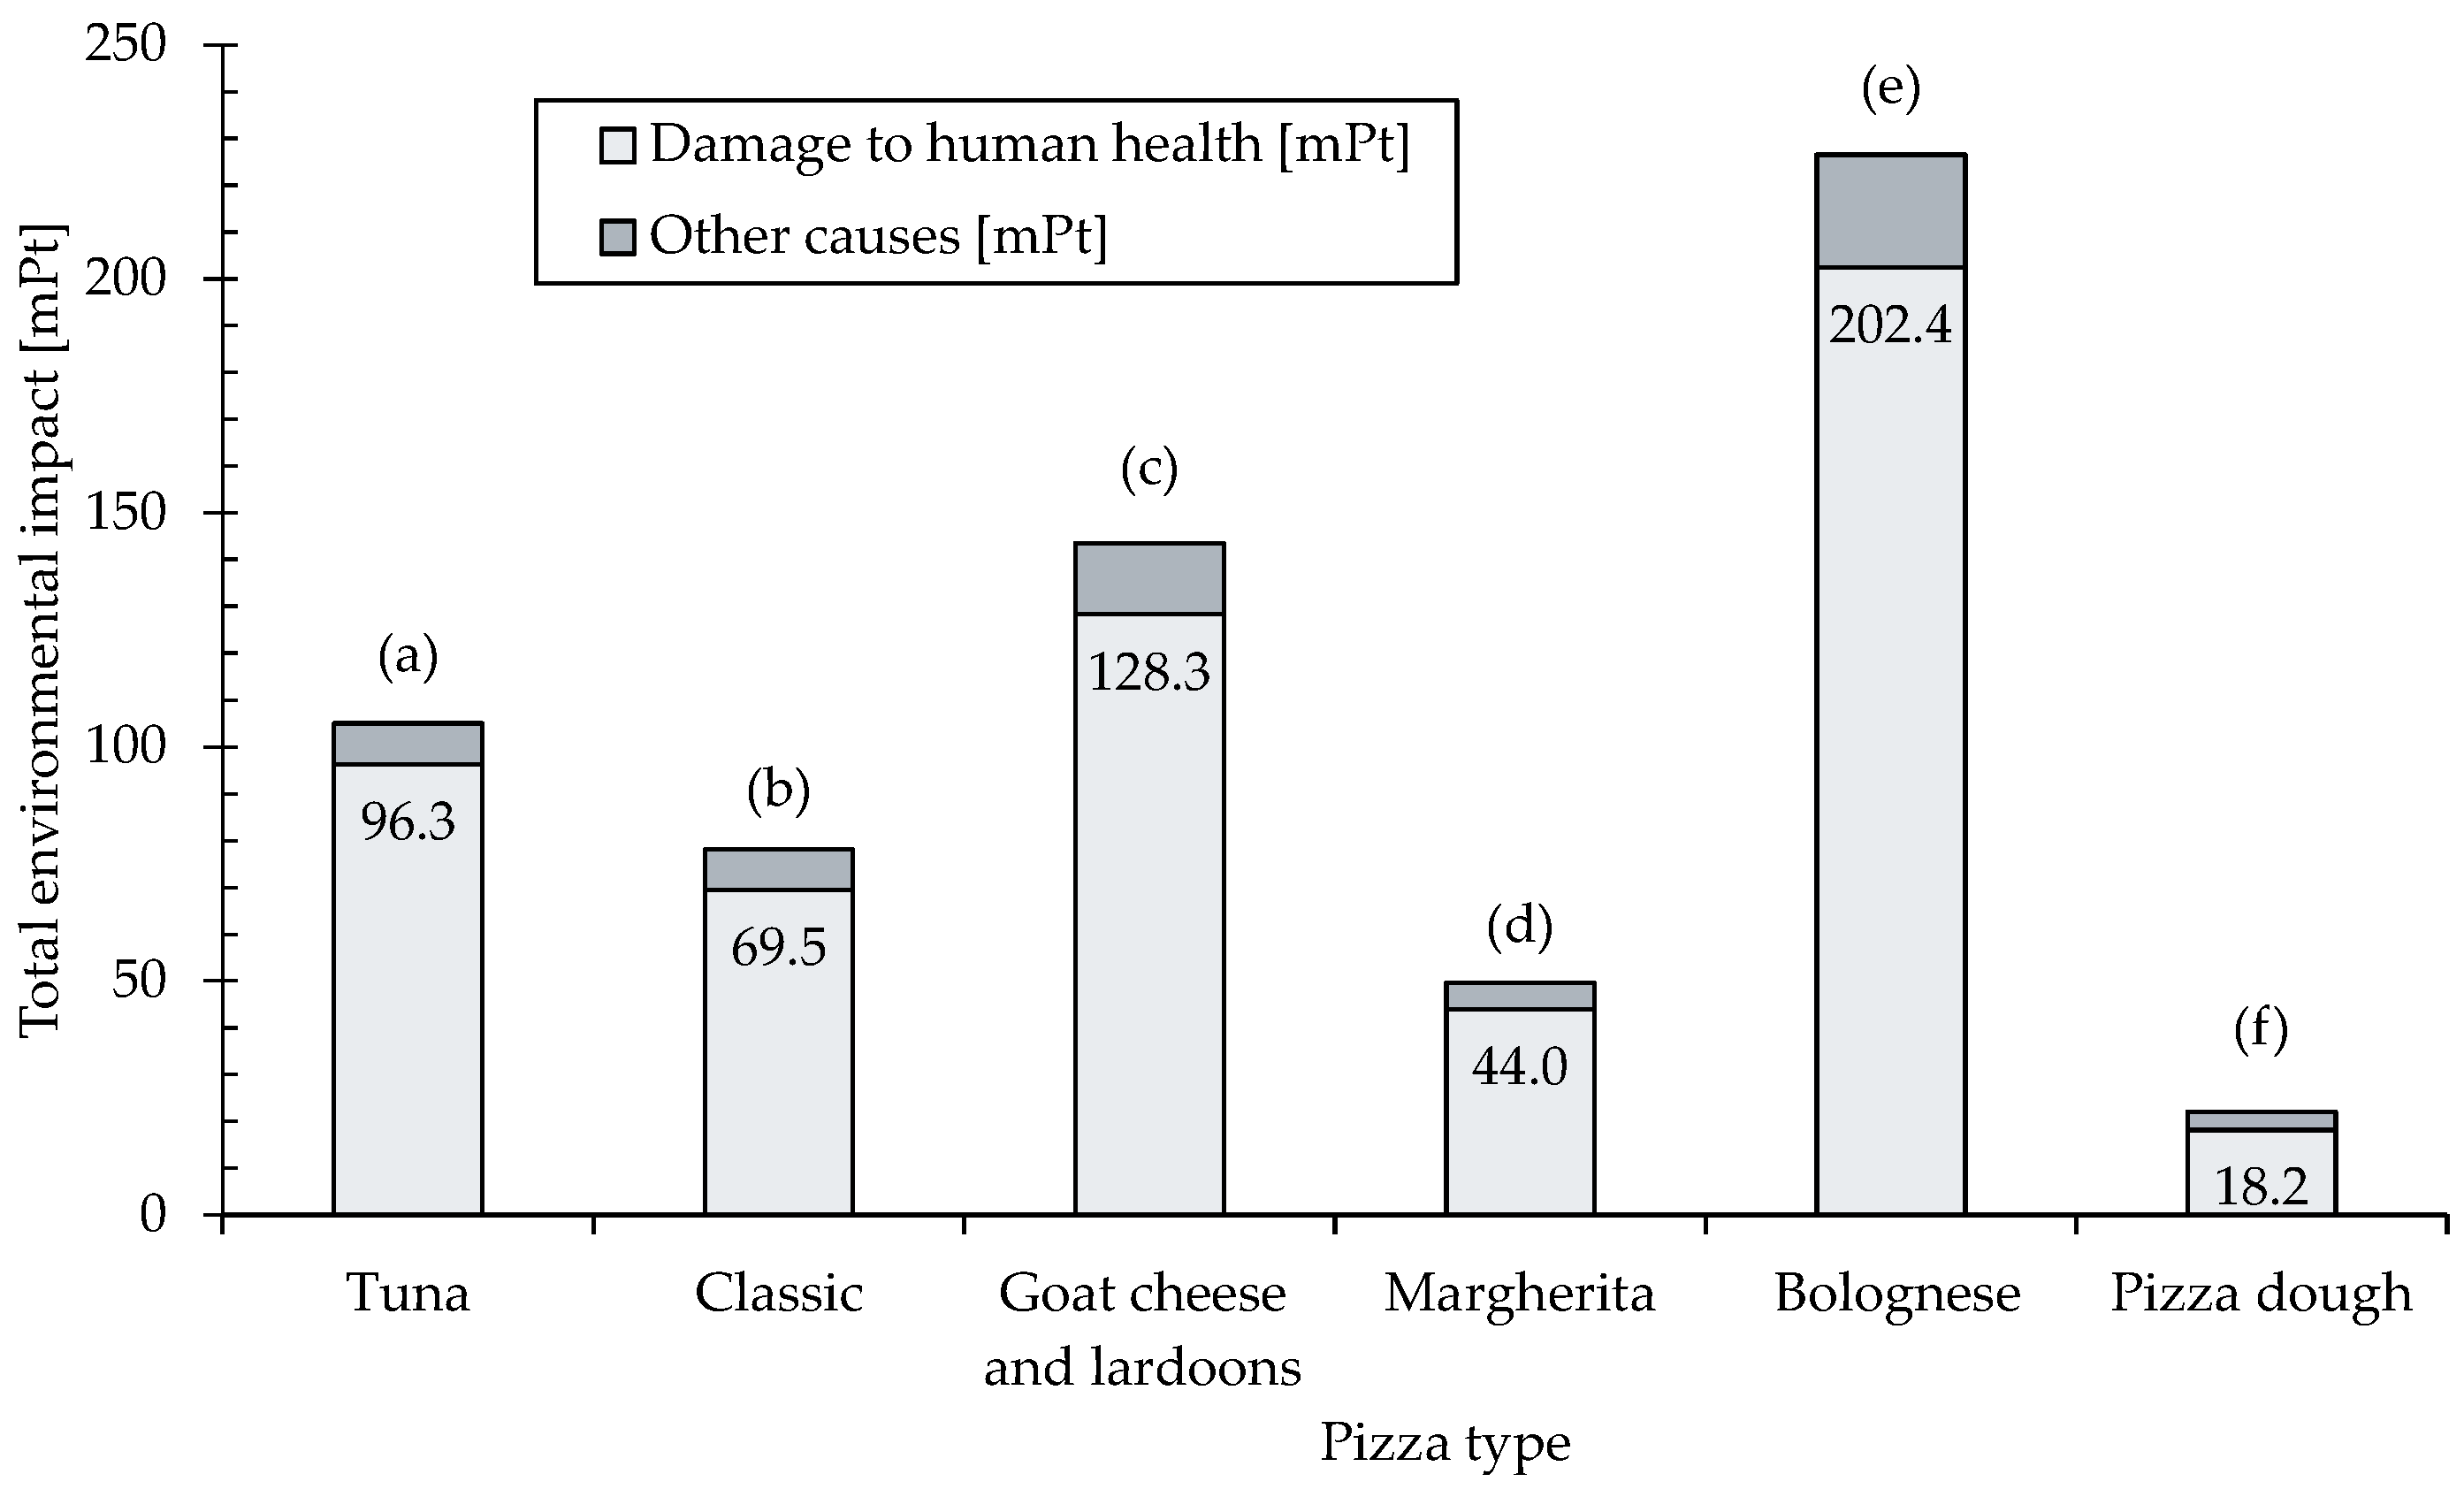
In
Figure 7, the impact on human health as total environmental impact, calculated with ReCiPe 2016 Endpoint (H) method, was presented for (a) pizza with tuna; (b) classic pizza; (c) pizza with goat cheese and lardoons; (d) pizza Margherita; (e) pizza Bolognese; and (f) pizza dough. The pizza example was chosen for three important reasons: (i) as an example of widely known product with several varieties, containing different ingredients, it effectively illustrates how consumer food choices indirectly influence environmental impacts and human health, (ii) there are reliable data for both pizza recipes and ingredient-level environmental impacts in LCA databases, and (iii) it provides thematic consistency with the tomato example discussed earlier.
The selection of pizza toppings has a major impact on human health. If no toppings are added, the raw pizza dough alone contributes 18.16 mPt to the human health impact. Pizza Bolognese, which contains the most toppings (tomato sauce, cheese, minced pork and beef, onions, peppers, tomatoes, and carrots), has eleven-times greater impact on human health than plain pizza dough and 4.6-times higher than pizza Margherita, which contains the fewest toppings.
Figure 7 shows that all pizza choices have a significantly higher impact on human health than they have on the ecosystem and the availability of resources, combined in other causes in
Figure 7.
Conducting an LCA in the food industry can provide valuable insights for both enterprises and consumers, enabling a better understanding of the environmental impacts associated with product selection and production. The application of LCA can support decision-making by quantifying the environmental impacts over the entire life cycle of food, thus leading to sustainable choices. However, the results of an LCA can be misleading or inappropriate if the appropriate LCIA method is not chosen, as different LCIA methods use different sets of impact indicators. Each LCIA method may prioritise different environmental aspects, such as climate change, human health, or resource depletion, which may lead to different results depending on the method chosen. Therefore, careful selection of the LCIA method and corresponding indicators is essential to ensure that the results are both accurate and relevant to the specific objectives of the study.
The authors indicate the importance of comprehensive disclosure of the whole set of environmental indicators, and not limiting it to the midpoint indicators only. The authors recommended that companies and farmers initiate this process of labelling on a voluntary basis, employing a comprehensive LCIA method that includes human health indicators, as outlined in this paper. Drawing upon the past experience from the book Late Lessons from Early Warnings: The Precautionary Principle (the book on examples of the application of the precautionary principle over the last 100 years) [
28], it is clearly evident that numerous corporations, companies, and agricultural entities have chosen to pursue autonomous remedial measures rather than waiting for regulatory inventions. The implementation of legal regulations occurred with a delay.


