Article

Real Estate Industry Sustainable Solution (Environmental, Social, and Governance) Significance Assessment—AI-Powered Algorithm Implementation

Institute of Spatial Management and Geography, University of Warmia and Mazury in Olsztyn, 10-720 Olsztyn, Poland
*
Author to whom correspondence should be addressed.
Sustainability 2024, 16(3), 1079; https://doi.org/10.3390/su16031079
Submission received: 9 January 2024 / Revised: 20 January 2024 / Accepted: 23 January 2024 / Published: 26 January 2024
(This article belongs to the Special Issue Analysis on Real-Estate Marketing and Sustainable Civil Engineering)

Abstract

:
As the global imperative for sustainable development intensifies, the real estate industry stands at the intersection of environmental responsibility and economic viability. This paper presents a comprehensive exploration of the significance of sustainable solutions within the real estate sector, employing advanced artificial intelligence (AI) algorithms to assess their impact. This study focuses on the integration of AI-powered tools in a decision-making process analysis. The research methodology involves the development and implementation of AI algorithms capable of analyzing vast datasets related to real estate attributes. By leveraging machine learning techniques, the algorithm assesses the significance of energy efficiency solutions along with other intrinsic and extrinsic attributes. This paper examines the effectiveness of these solutions in relation to the influence on property prices with a framework based on an AI-driven algorithm. The findings aim to inform real estate professionals and investors about the tangible advantages of integrating AI technologies into sustainable solutions, promoting a more informed and responsible approach to industry practices. This research contributes to the growing interest in the connection of the real estate sector, sustainability, and AI, offering insights that can guide strategic decision making. By implementing the random forest method in the real estate feature significance assessment original methodology, it has been shown that AI-powered algorithms can be a useful tool from the perspective of real estate price prediction. The methodology’s ability to handle non-linear relationships and provide insights into feature importance proved advantageous in comparison to the multiple regression analysis.

1. Introduction

The global real estate industry, one of the most carbon-intensive sectors in the world, stands at the intersection of economic prosperity, social well-being, and environmental stewardship, playing a fundamental role in shaping the sustainable development landscape. In recent years, the concept of Environmental, Social, and Governance (ESG) principles has emerged as a guiding framework for businesses across diverse sectors, with the real estate industry being no exception. No wonder the issue has been a subject of detailed investigations and heated discussions amongst a variety of internationally recognized organizations [1,2,3,4]. While the organizations focused on articulating the ESG long-term goals and programs on their monitoring and evaluation, little has been done, in the authors’ opinion, in terms of particular solution provision, which could support the real estate industry’s sustainable solution decision-making procedures. The same conclusion, amongst others, has been drawn by Bedford Consulting [5], according to which one of the main challenges of ESG best practices involves understanding the impact of ESG initiatives. Real estate markets, constituting the area of real estate industry activities, including ESG initiative implementation, are challenging modern analyses that require both new analytical approaches and new sources of data and information. For that reason, in order to enhance the development of systems and solutions that support analyses in the real estate market, it is necessary to understand the reality. Understanding this complexity requires creating models that are a simplified picture of the reality being analyzed. In the case of the real estate market, the market object is real estate, which is a specific commodity. This specificity is due to the following factors:
  • the individual nature of the transactions;
  • the heterogeneity of the market;
  • the volatility of prices and costs;
  • the demand and supply of the commodity.
The study of the real estate market is particularly important to achieve greater transparency of analyses, which currently cannot be realized without effective and efficient systems for collecting and processing up-to-date information reflecting ESG solution implementation, which is increasingly being incorporated in the real estate industry. From the environmental perspective, the most visible ways of the implementation of a solution involve, amongst others, green building certification (e.g., LEED—Leadership in Energy and Environment Design), energy efficient technologies (e.g., HVAC systems), or sustainable design application [6]. Social aspects that answer the EGS principles can be perceived in community engagement initiatives, a so-called “affordable housing” program or social impact investing [7], while the governance ones usually include a so-called “corporate governance”, risk management, or diversity and inclusion issues [8].
Even though the solutions contribute to environmental development and offer cost-effective opportunities to reduce energy, the current state-of-the-art analysis indicates that property market participants are unwilling to include sustainability issues in property-related decision-making processes unless the features and related performance are integrated into property valuation [9,10,11,12]. For that reason, the main motivation of this work was to propose a solution, answering both conclusions drawn in the aforementioned current state of art and the market need for methods and techniques tailored to the specifics of the market analysis. Aiming at providing a real estate decision-making support algorithm implementing AI technology, this paper not only presents these technologies as indispensable tools in real estate sustainable solution analyses but also underscores their role in advancing a technical, data-driven approach to market research, building upon existing research in the field, described in detail in the proceeding section. Considering the problem, the following hypothesis was formulated: algorithms implementing AI-driven solutions can offer a better reflection of real estate market dependencies than classical analytical methods in terms of real estate attribute inclusion. The hypothesis, if proven, would also confirm the following thesis: the analysis of the impact of property features on their value, with the use of random forest, as a representative of embedded AI methods, enables the incorporation of a broader set of attributes, including the ones reflecting ESG sustainable solutions. For the purpose of the hypothesis/thesis confirmation and verification, the analysis was executed based on data acquired from three sources: a public register of real estate prices (PRREPs), open street map (OSM), and central register of energy performance of buildings (CREPBs).
This paper is structured in the following way: Section 2 provides an overview of recent research focusing on the analysis of features influencing real estate prices in international contexts. It also outlines key methodologies employed in the feature significance assessment. Section 3 introduces an AI-driven algorithm of recursive feature elimination, which has not been implemented for the scientific problem that the paper concentrates on and provides substantial justification for its utilization. Section 4 covers the materials and methods, and generally outlines the methodological architecture of the research assumed by the authors, with special respect to particular phases of data collection and processing, the data analysis and classification, and recursive feature algorithm implementation. Section 5 provides a description of the obtained results that leads to a discussion, which is presented in the following Section 6. Finally, Section 7 describes conclusions made by the authors based on the executed research.

2. The Problem of Real Estate Feature Significance Assessment

One of the key problems in real estate market analyses is the identification of real estate characteristics (their occurrence, extent, and relevance) affecting the reasoning [13,14,15,16,17]. The accurate identification of problems and limitations in the area of real estate information analyses determines the direction of the search for solutions that better reflect market reality. From an analytical point of view, problem solving also requires the selection of appropriate methods for analyzing available information and research procedures.
Heterogeneous goods such as real estate have a number of built-in characteristics and, as a commodity, constitute a set of them. When selecting methods and inference procedures for analyzing the relevance of real estate characteristics, it is necessary to keep in mind the specifics of the subject of research and the possible difficulties arising from these specifics, among others [18]:
  • significant differences in the amount of information available are determined with the type of market analyzed;
  • ambiguous and unclear assumptions and principles of the relevant methods in the analysis of the relevance of real estate features (e.g., differences in the scale of the description of real estate features, description of real estate features fully dependent on the expert performing the analysis);
  • lack of comprehensive (complete) information;
  • imprecise nature of real estate data;
  • lack of homogeneous functional relationships between real estate features;
  • non-linear nature of real estate data.
Research on the solutions used for selecting and assessing the significance of real estate features shows the need to look for methods and techniques tailored to the specifics of the real estate market and to changes in it, as commonly used solutions may not fully capture the essence and nature of real estate market decisions.
The variety of properties accepted for analyses or insufficient data often does not allow a classical determination of the impact of individual characteristics on property value. The literature often cites sets of real estate characteristics most often used in analyses, but due to the dynamically changing market reality, they are often inadequate or do not fully correspond to the realities of the market. The legitimacy of the search for new solutions in this area, which are an extension of currently used methods and techniques, has been repeatedly addressed in scientific studies by many researchers involved in the analysis of information in the real estate market [19,20,21,22,23,24,25,26,27,28,29].
Real estate in its essence is not just a commodity, but a kind of integration of the needs met by it (social, economic, environmental) due to its position in space. An appropriate selection of characteristics (also called or expressed as intrinsic and extrinsic ones) and analytical methods and tools is necessary to reflect in the value of a property the extremely important influence of the environment and surroundings in which the property is located. This approach is key to maintaining sustainability and reflecting the essence of integrating the environment into the real estate market.
In practice, the strength of the impact of market features on the differentiation of transaction prices and the scale of assessment of a given feature can be determined depending on the conditions, especially taking into account the following:
  • results of the analysis of data on prices and market characteristics of similar properties traded on the real estate market specified for valuation purposes;
  • analogy to local markets similar in terms of type and area;
  • research and/or observation of the preferences of potential real estate buyers.
The list of aforementioned methods is not limited. Other solutions can also be used as long as their use is justified appropriately.
The problem of explanatory (independent) variable selection and the determination of their impact on the exploratory (dependent) variable is a common issue encountered in many areas of science and practice. There are many ways of variable selection that can be divided into the following main categories [30]:
  • filter methods—the final set of features is selected based on the method adopted, for example, by assessing the size of the correlation coefficient of the analyzed feature with the explanatory variable. These methods are based on data features and do not use machine learning algorithms;
  • embedded methods—use algorithms that have built-in iterative feature selection methods; the iterative learning process extracts those features that most affect the learning of the model in a given iteration;
  • wrapper methods—the selection of variables is treated as a selection search and is based on fitting a specific algorithm to a given set of data while looking for an optimal set of features;
  • hybrid methods—these methods combine elements of the aforementioned methods.
From the explanatory and exploratory variable perspective, it must be underlined that the real estate market analysis usually deals with three-dimensional sustainability problems: the economic, the social, and (physical) environmental ones [31]. All three dimensions are interconnected and interact and therefore must be considered cooperatively to provide a comprehensive understanding of the real estate market dynamics. The economic dimension in real estate analyses includes factors such as market demand, rental rates, property values, and economic indicators affecting the local and regional economies. For that reason, the economic success of a real estate project may depend on its ability to attract tenants, which, in turn, can be influenced by the project’s environmental and social features. Social dimensions encompass aspects such as community demographics, lifestyle trends, and housing preferences. Properties that contribute positively to the well-being of the community, provide affordable housing, or support local social initiatives may attract more interest and support from tenants and investors (interconnection with economic dimension). Environmental dimensions include factors like energy efficiency or green certifications, which may interact with, e.g., the economic dimension through property price determination.
On the other hand, price is a handy indicator as it includes plenty of market information and thereby already tells us something about the sustainability of the particular case. What is key in this aspect is the adoption of a holistic approach to determine the value of real estate.
Real estate market analyses consistently noted the scarcity of universal algorithms or procedures that could be used to study the significance of real estate features under different market conditions. Existing solutions were often described as ambiguous, inflexible, subjective, or even mismatched to the specifics of the subject of an analysis, and their assumptions were not defined precisely enough or introduced too much generalization of the adopted model. Classically applied analytical methods for studying the significance of real estate characteristics were often adopted intuitively or were determined with the scope and type of information available.
The approach to real estate as an economic and public good directly related to and intersecting with environmental goods through the use of AI-powered tools could allow the processing of data that was often imprecise and uncertain, making it possible to reflect the actual and current nature of the real estate market. For that reason, the investigation of AI-driven algorithms in the real estate industry was executed and potential solutions are indicated.

3. AI-Driven Algorithms in Real Estate Industry Solution Analysis

Traditionally, real estate industry analyses relied profoundly on manual processes, often constrained by limited data processing capabilities [32]. The introduction of AI technologies though has brought a revolutionary change to [33], enabling the industry to employ the power of algorithms for more sophisticated and data-driven decision making [34,35] to give them a “far-reaching impact on individuals and society” [36]. One of the key applications of AI in sustainable real estate development lies in property valuation and is strongly connected with Automated Valuation Modeling (AVM), Mass Appraisal (MA), or computer-assisted Mass Appraisal (CAMA) [37,38]. The simultaneous utilization of Geographic Information Systems and machine learning for that purpose has also been thoroughly investigated in [39] and found its application. AI-driven algorithms adeptly analyze a multidimensional variable describing market trends. AI-driven algorithms introduce a dynamic pricing paradigm, allowing for real-time adjustments in rental properties and listing prices based on market fluctuations. Additionally, these algorithms aid investors in portfolio management by assessing property performance, recommending diversification strategies, and optimizing resource allocation. Predictive analytics further empower stakeholders by offering insights into future market trends and optimizing investment strategies [40]. AI algorithms play a crucial role in dissecting the complexities of demand and supply in the real estate market (Figure 1). By processing vast datasets, these algorithms uncover patterns, identify emerging trends, and contribute to a comprehensive understanding of market dynamics, thereby assisting in strategic decision making [41,42,43].
Real estate investments inherently carry a variety of risks, and AI algorithms surpass in assessing and mitigating these risks [44,45]. Through the analysis of economic indicators, market volatility, and historical performance, the algorithms provide invaluable insights. Moreover, AI contributes to fraud detection, ensuring the security and legitimacy of property transactions [46]. The implementation of AI in real estate extends beyond analyses, streamlining operational workflows. The automation of routine tasks, such as a document analysis and contract review, not only accelerates processes but also minimizes the likelihood of errors, enhancing overall efficiency [47]. Natural Language Processing (NLP) integrated into AI systems assists in improved, amongst others, real estate industry and customer interactions. Chatbots and virtual assistants powered by AI respond to customer inquiries, deliver information, and enhance overall customer experience, fostering increased engagement [48]. The most frequently utilized algorithms in real estate industry solutions are presented in Figure 1.
The real estate market is shaped via processes and connections that we can predict with a certain probability, as well as via little-known, difficult-to-predict, random events. Such events include, among others, instability of property attributes, lack of information coherence, uneven access to information, deficiencies in the cognitive abilities of real estate market entities, uncertainty of systemic structures and functions, and emotional attitudes of entities toward transactions [49,50]. Traditional computational methods require a precise understanding of the problem and dependencies between variables, which, in the case of complex and discontinuous spaces, makes it impossible to conduct reliable analyses. Numerous solutions based on machine learning tools are proposed for problem solving in the real estate market across various domains to reduce the impact of uncertainty on its analyses. One of the valuable proposals involves rating market classifications based on decision-making theory, leveraging data mining technologies such as Rough Set Theory (RST), Value Tolerance Relation fuzzy theory (VTR), and a rating scoring analysis [51,52]. In the field of tax policy, Stokey [53] illustrates a scenario where uncertainty about future tax rates affects the profitability of investments. Stokey introduces a universal model that utilizes investment technology to generate an option value. Additionally, Giudice et al. [54] proposed a procedure involving numerical integration on the weights’ space using the Markov Chain Hybrid Monte Carlo Method (MCHMCM), a neural network (NN) model, a traditional multiple regression analysis (MRA), and the Penalized Spline Semiparametric Method (PSSM). Zavadskas et al. [55] highlight that the consequences of alternative courses of action in many decisions cannot be predicted with certainty in real estate investment. To address this uncertainty, they propose a methodology based on Grey’s theory, suggesting the use of the Complex Proportional Assessment of Alternatives with Grey Relations (COPRAS-G) for defining the utility of alternatives. In a normative view, decision problems can be translated into mathematical models when future processes are stable and determinable with appropriate probability. However, in the real world, current problems involve complex information—both accurate and objective, as well as subjective and error-prone. Computer systems within the area of artificial intelligence are employed to support decision-making processes by combining information from various sources, organizing and analyzing information, and facilitating the assessment of specific model assumptions [56,57].
Increasingly, promising results are being achieved in studies of the potential of machine learning tools, and also in the scope of assessing the significance and impact of features on prices, value, or the attractiveness rating of real estate. Many researchers have emphasized that, despite the multitude of applications, a statistical data analysis has theoretical weaknesses [58,59,60,61]. The results obtained often oversimplify the problem and may not be effective in markets where uncertainty is high. This is due to the challenges in quantifying features and their numerical definition, particularly regarding the behavioral and emotional aspects of market participants that contribute to the formation of real estate prices and values. Consequently, many authors have explored alternative approaches in many fields of a real estate market analysis including those of a feature significance assessment, such as Artificial Neural Network (ANN) utilization [59,62] or a Genetic Algorithm (GA) [63,64,65,66].
Implementing deterministic models in the real estate market can be challenging due to the intricate nature of the processes involved [67]. It is crucial to recognize that globalization processes, increasingly evident in the real estate market in recent years, contribute to the market’s acceleration. The integration of real estate markets with global processes opens up substantial opportunities for growth. Given the complexity of real estate market processes and the influence of global conditions on local factors, it is essential to employ suitable methods for effective analyses. AI solutions allow for the solving of inaccurate, complex, and multivariate tasks when the objective function is not defined using an exact mathematical formula or is disturbed and imprecise. AI methods take into account the randomness of processes occurring in the real estate market analysis. Artificial intelligence methods such as learning systems find application in supporting decision-making processes thanks to the ability to predict future events. They can be used to solve dynamic tasks (variables in time), which are characterized by a large number of variables and the complexity of space. Due to the multitude of factors affecting the real estate market and the complexity of processes occurring in it, the use of deterministic models is often difficult. AI methods have become a useful tool for finding optimal solutions through the use of probabilistic selection rules. Awareness of the possibilities and limitations of these methods as well as a thorough knowledge of the problem under examination allow for proper adjustment of the algorithm’s parameters, which makes it a universal and effective tool. However, due to its specificity, it is still relatively infrequently applied in the real estate market domain.
The combination of AI algorithms allows real estate professionals to extract valuable insights, automate repetitive tasks, and make data-driven decisions in various aspects of the industry. For that reason, the random forest method, belonging to the group of embedded feature selection methods, has been gaining increasing interest in different scientific areas. The main advantages of the random forest method underlined in current state-of-the-art scientific publications include the following [68,69,70,71,72]:
  • resistance to a variety of data problems (e.g., missing data, explanatory variables without significance, a large number of explanatory variables or outliers);
  • the ability to reproduce complex relationships more accurately than decision trees, even though the predictive power of a random forest is usually somewhat lower, but still comparable to neural networks;
  • resistance to overfitting;
  • stability;
  • possibility of interaction between variables;
  • the ability to determine various misclassification costs.
Random forest methods’ operations involve classification using a group of decision trees and the final decisions are made as a result of majority voting on the classes indicated via the individual decision trees. Considering the advantages, the authors investigated the possibility of the method implementation in the original algorithm real estate industry sustainable solution significance assessment.

4. Materials and Methods

In the aforementioned scientific problem, the objective of this study was to propose a methodological algorithm that enables real estate industry sustainable solution (ESG) significance assessment that benefits from the advantages given via the random forest method. The proposed methodology architecture, with all its procedural steps’ justification, is presented in Figure 2.
The proposed particular stages of the methodology had to be executed in a particular order.

4.1. Data Acquisition and Preprocessing

The initial point for the description of the assumed investigated area required particular real estate characteristics’ selection, providing information on the subject of the analysis—structural attributes on real estate including the ones describing sustainable solution implementation and the real estate location (locational attributes). The selection of attributes was based on an extensive literature review [73,74,75,76]. One frequently highlighted aspect in the literature pertains to the proximity and accessibility of facilities and services, encompassing educational institutions, healthcare facilities, and commercial centers. The significance of these factors is often associated with the suitability of the neighborhood, the demand for and frequency of their utilization, as well as the time required for access. Another emphasized characteristic involves environmental conditions and the quality of elements reflecting them. Notable influences on residential property purchase decisions include considerations of water, air, or noise pollution, and the accessibility of green spaces. Environmental factors such as the likelihood of natural hazards are also considered. Property communication is another factor in the decision-making process related to property purchases, especially residential ones. This aspect is typically construed as spatial accessibility, determined with the existence of public transport elements. The distance from central business districts or public facilities is also a relevant factor, often measured in terms of travel time or cost. The last predominant location characteristics discussed in the literature encompass neighborhood aesthetics and the social and economic background. Despite the apparent diversity of these factors, they are frequently found to be strongly correlated. Demographic attributes such as dominant ethnicity, language, religion, family size, and education level tend to exert an influence on the surrounding aesthetics.
The aforementioned location attributes have been acquired and form the open street map (OSM) (OSM is a digital map that is freely accessible, editable, and distributable by the public. Built on open-source mapping platforms and collaborative contributions, these maps allow users to view, edit, and share geographic information. Open-source maps are often created and maintained by a community of volunteers, developers, and organizations, fostering transparency, accessibility, and the collective improvement in geographical data and feature statistics.) source and processed in a way presented by Renigier-Biłozor et al. [77]. Considering the fact that real estate is characterized based on its surroundings and its distinct technical and functional characteristics, the investigated property transactions located in an area being analyzed are described with data provided in public registers for real estate transactions (PRREP) (PRREP is a centralized and accessible database (or platform) maintained by government authorities. It provides transparent and publicly available information on the transaction prices of real estate properties. This register typically includes details such as the purchase or sale price, property location, date of transaction, and relevant property characteristics.). The data given in the register included the following characteristics described in either a numeric or descriptive way: the usable area, stories, rooms, basement, building stories, technology, lift, and unit price. The listed-above real estate characteristics, because of this paper’s objective, had to be extended using the data provided in the central register of the energy performance of buildings (CREPB) (CREPB is a centralized database or system established by government authorities to collect and store information about the energy efficiency of buildings. This register typically includes data on energy performance certifications, which assess and rate the energy efficiency of buildings based on factors such as insulation, heating, ventilation, and lighting systems. The purpose of the central register is to promote transparency, support energy efficiency initiatives, and provide stakeholders, including property owners and tenants, with information to make informed decisions regarding energy consumption and sustainability in the built environment).
The register contains the following 5 characteristics:
  • the annual usable energy demand index (EU) (the EU index provides information on the amount of energy required to supply each square meter of a house. It is the most important parameter in calculating the energy costs of a house already at the stage of project formulation for its construction).
  • the annual final energy demand index (EK) (the EK index provides information on the amount of energy required to supply the building to guarantee the right temperature and considering any losses in the generation and transmission of heat inside the entire building. The amount of this indicator is mainly affected by the efficiency of the heat source).
  • the index of annual demand for non-renewable primary energy (EP) (the EP index is an indicator that is important for a formal reason, since it considers the entity’s need to adapt to changes in construction law. European and Polish law constantly emphasize the need to reduce energy from non-renewable sources at the expense of promoting energy from renewable sources).
  • the share of renewable energy sources in annual final energy demand (UOZE) (the UOZE index constitutes a ratio of renewable energy sources in annual final energy demand) (%).
  • the unit volume of emissions (CO2ECO2) (the CO2ECO2 index provides information on the volume of CO2 emission) (t CO2/(1 m2·year)).
All the data used and processed in the research are presented in Figure 3. The data acquisition and processing enabled modified HO-MAR algorithm utilization.

4.2. HO-MAR Algorithm Utilization

The overall complexity and multi-criteria nature of the real estate market make it significantly difficult to characterize/describe it with a single representative property value/price model. In such a situation, dividing space into submarkets with internal similarity consistent with the assumed criteria can minimize the difficulty. Each submarket should be defined by the maximum similarity of spatial characteristics (location) and physical characteristics of the property (transactions). A submarket (homogeneous area) extracted according to the principle of maximum similarity can be the basis for the real estate attribute significance.
In order to extract from the property features only the ones that are strictly connected to its structural and functional characteristics (intrinsic variables), and subsequently minimize the distortion made in that kind of an analysis with spatial interactions and constraints of an urban environment, the modified HO-MAR methodology was utilized (the algorithm modification consisted of imitating its work only to homogenous geo-market area selection).
The basis for analyzing the scope and relevance of real estate attributes is a homogeneous area in terms of locational characteristics. The procedure for determining HO-MAR homogeneous areas is described in detail by Renigier-Bilozor et al., 2022 [77]. The elaborated methodology is based on entropy theory, Rough Set Theory, fuzzy logic, and geoprocessing activities (Gauss filter, geocoding and reverse geocoding, tessellation model with mutual spatial overlapping).

4.3. RE Method Utilization and ESG Solution Significance Assessment

In order to assess the significance of real estate attributes in the selected homogeneous area, an algorithm in the form of a random forest was used. It is a popular machine learning technique used for both classification and regression problems. Random forests were proposed by Breimana [78] and can be perceived as a generalization of the idea of decision trees. The random forest method is classified as one of the so-called aggregation procedures and involves constructing multiple decision trees during learning and generating a class that is the dominant of the classes (classification) or the predicted average (regression) of the individual trees [79,80]. Random forest belongs to the group of embedded methods. Their main idea is to reduce the prediction error when taking into account the decision trees that make up the forest and the correlation between their predictions [30]. Through its ability to solve non-linear and multivariate problems, it is also a useful tool for assessing the relevance of individual variables in the process of training the model. Tree training is robust to the scaling and transformation of feature values, as well as to the presence of irrelevant features. However, individual trees tend to learn highly irregular patterns: they over-fit the training sets—they have low loadings but very high variance. Random forests are a way of averaging multiple deep decision trees, trained on different parts of the same training set, in order to reduce variance [81]. In this case, the goal of modeling is to achieve the lowest possible model error, assuming the minimization of load and variance. For this purpose, ensembles of complex trees are created to obtain the lowest possible load. To reduce variance, the resulting trees should be as independent of each other as possible.
A random forest is obtained by using the following procedure [30]:
  • Drawing with a replacement from a subset (cases), D’, from the available training sample D (bootstrap aggregating)—the observations that did not enter it are called out-of-bag (OOB) data and are later used to estimate the classification error.
  • Creating a tree for the drawn subset:
    • checking whether the divided set is homogeneous or too small to divide;
    • drawing a number of explanatory variables;
    • finding the best division using the drawn subset of variables;
    • dividing the set into two parts and repeating the procedure for each part.
  • The termination of training, if the number of trees reached the set maximum or the test sampling error stopped decreasing (otherwise, the procedure repeats).
Individual trees are built on random samples drawn from a database representing a set of explanatory variables X (predictors) and the explanatory variable Y. The modeled quantity Y is a function of the X variables including random fluctuations (Equation (1)):
Y = φ X + ε ,
As a measure of error, the squared error is taken. Then, at the point x0, the expected value of the model error M is as follows (Equation (2)):
B x 0 = Y M ( x 0 ) 2 ,
M denotes the model fitted to a given learning sample and can change as the learning data change. As a result of the above, an expression for the error was obtained (Equation (3)):
B ( x 0 ) = σ ε 2 + [ M x 0 φ x 0 ] 2 + M x 0 M x 0 2 ,
where:
  • σ ε 2 —random error;
  • M x 0 φ x 0 2 0 —the square of the difference between the expected value of the predictions of models (created for different samples) regarding the true value, the so-called bias;
  • M x 0 M x 0 2 —variance.
When building a single decision tree, not all attributes are taken into account in determining the decision rule at a node. M attributes are drawn, where m < M, based on which the decision rule at a node is determined (feature subspace)—in this way, each division in the trees is made with the same criterion, but different features are considered. As a result, features that might never affect the shape of the tree at this point have a chance to appear. Both bootstrap aggregating and feature subspace techniques are used to increase the stability of the algorithm’s response and protect it from over-fitting to learning data, resulting in better performance of the classifier on new data. Multiple trees training on a single training set would produce highly correlated trees (or even the same tree multiple times if the training algorithm is deterministic)—bootstrap is a way to de-correlate trees by showing them different training sets [82].
The evaluation of the significance of variables in the random forest was carried out on the basis of information on what changes in a given variable affect the quality of the model’s prediction. The procedure for determining the importance of individual attributes is as follows [83]:
  • for each ith tree:
    1.1.
    determining the number of correct ki classifications on its OOB set;
    1.2.
    for each attribute:
    • random reordering of the values of the attribute under consideration, j;
    • the determination of the number of correctly classified samples k j i on the set with a changed order of values in the jth attribute;
    • restore the original order of values in the kth attribute.
  • For each attribute j, determine the average difference between the number of correct classifications on the original set and on the set that rearranged the order of values in the attribute, averaging the result after all T trees (Equation (4)):
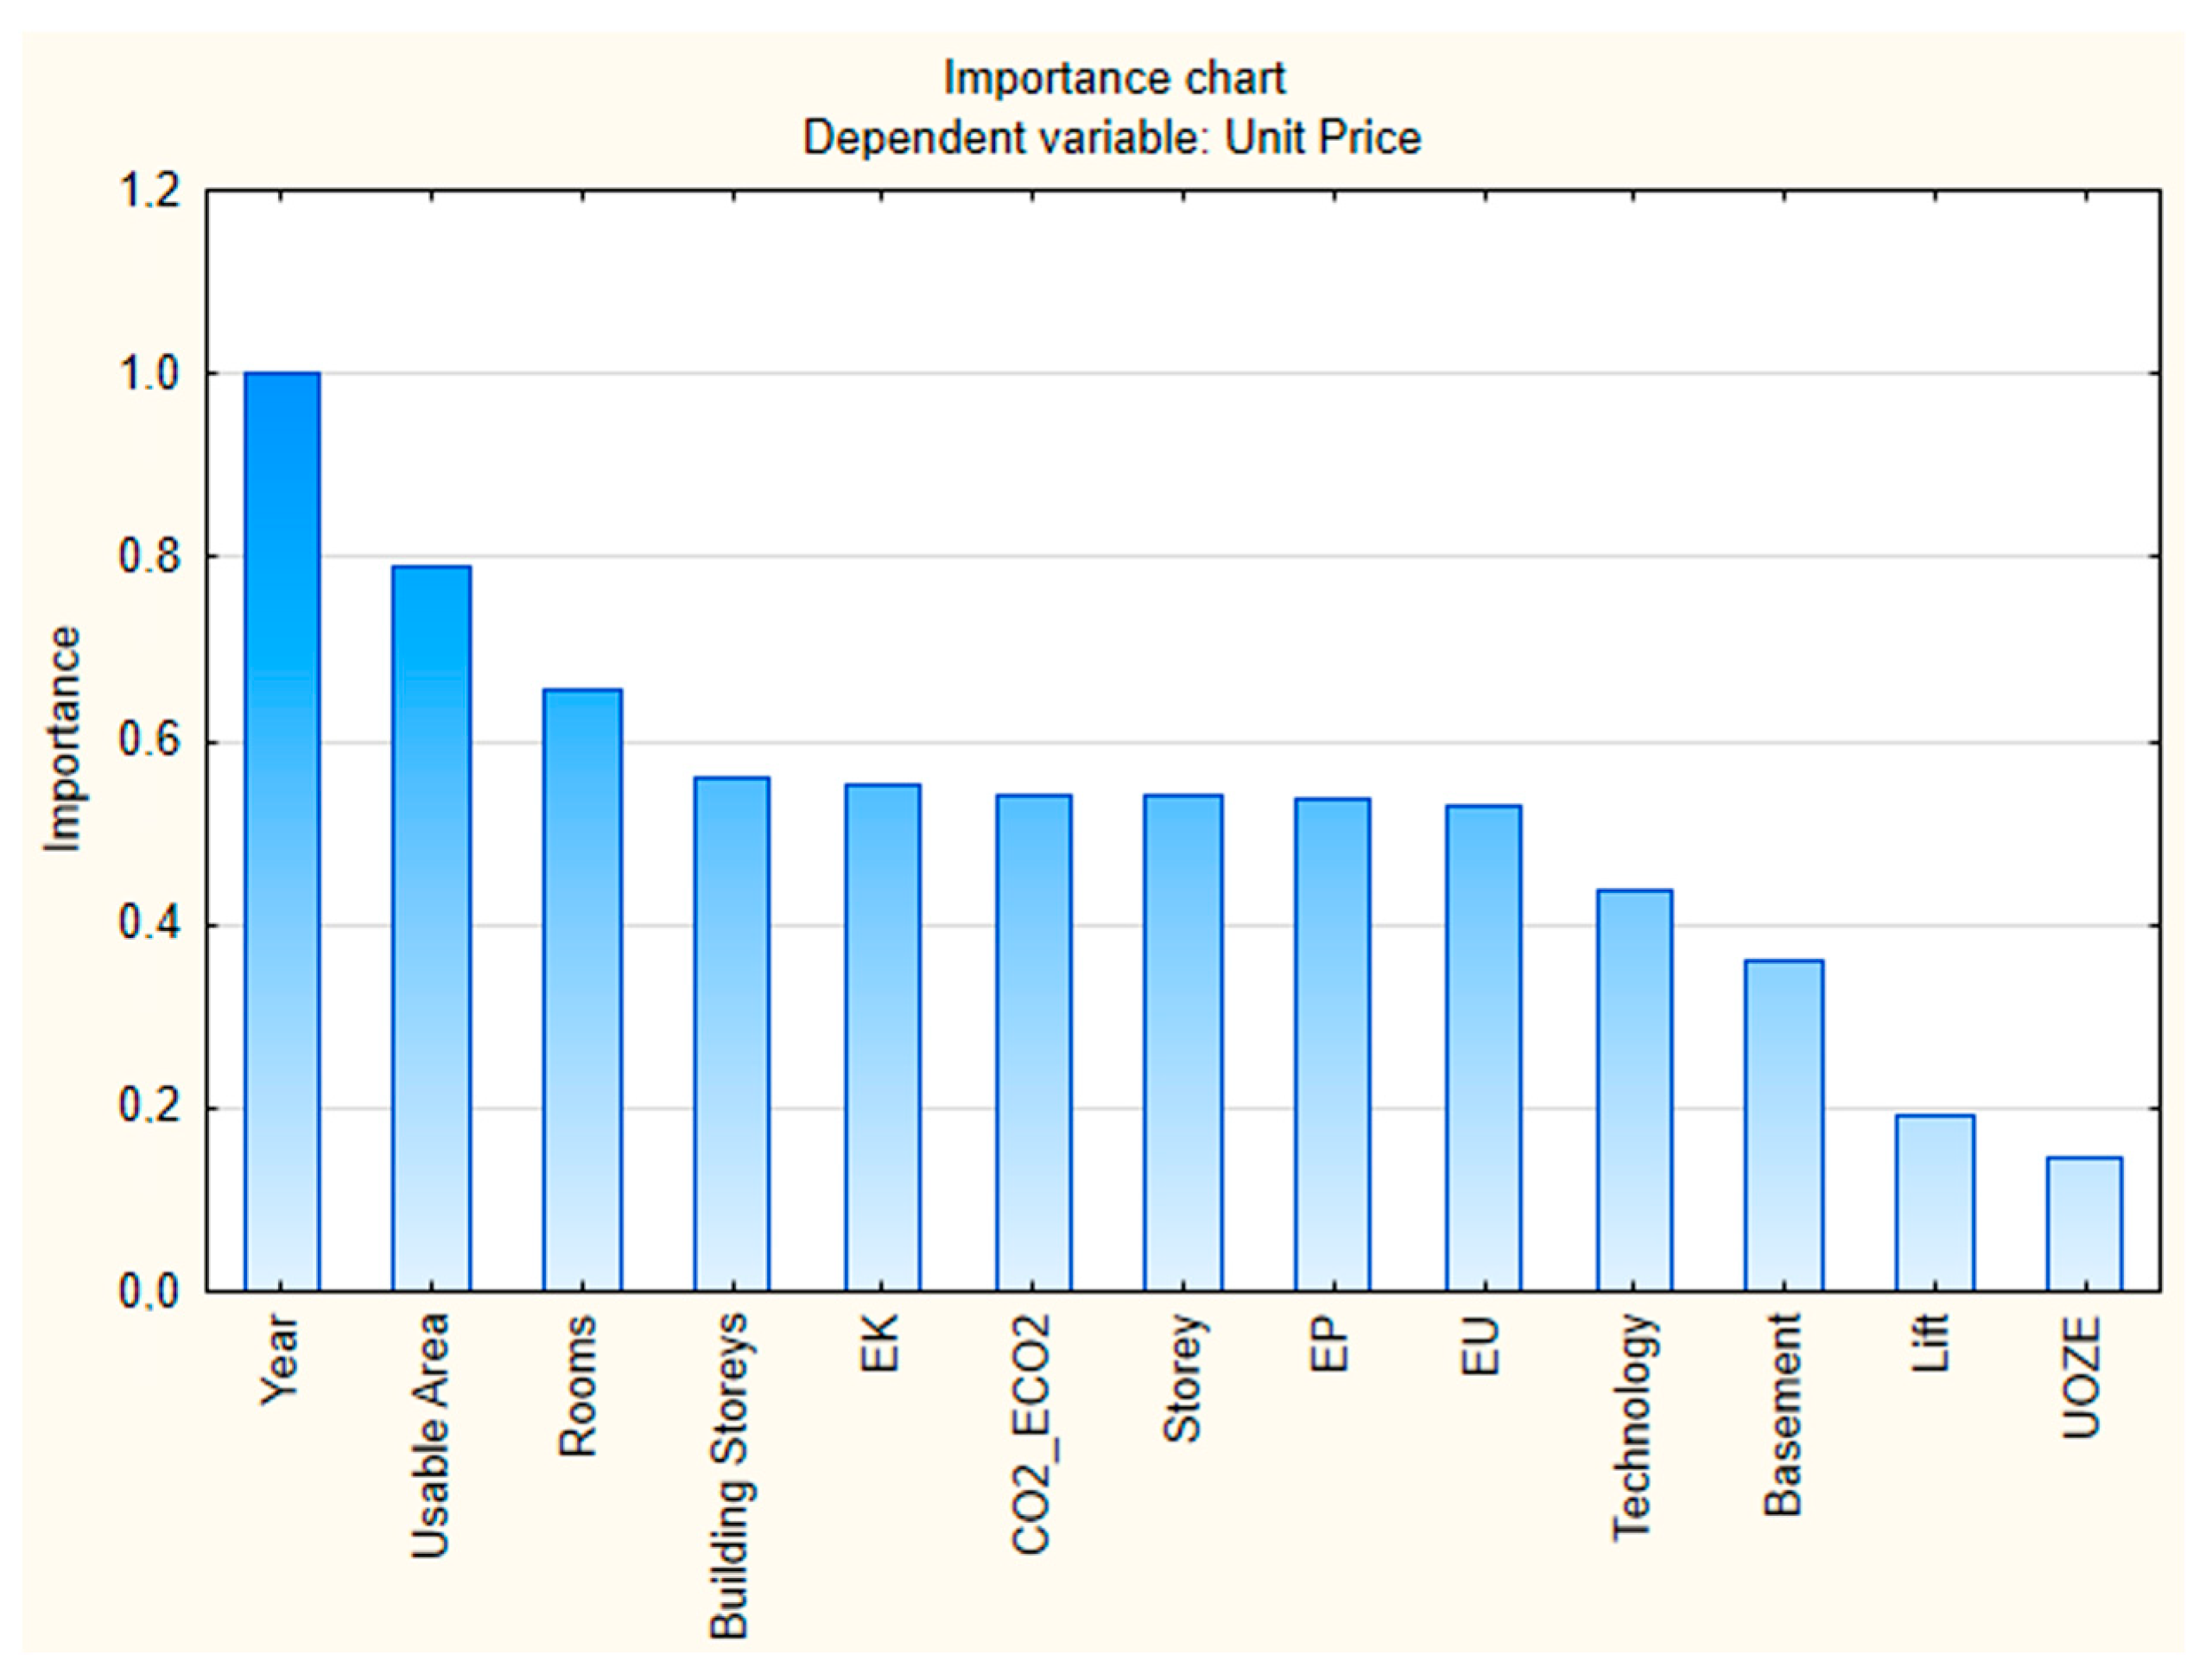
r j = 1 T i = 1 T k i k j i
The average determines the importance of the jth attribute—the higher the value, the more important the attribute. The utilization of the presented algorithm enabled ESG solution significance assessment.

5. Results

The structured methodological framework imposed the implementation of an experimental approach, leading to empirical research of the selected case study area. The study was conducted in the area of an Olsztyn municipality, one of the biggest cities located in northeast Poland, belonging to Warmia and Mazury Voivodship. In the authors’ opinion, the selected case study area was representative for the research purposes due to the fact that the analyzed residential property market is considered mature and well established (over 1000 free market transactions in the year 2023), and characterized by a high demand-to-supply ratio.
At the initial stage of the proposed methodology implementation, the investigated case study area was described with location attributes presented in Section 4.1. All the data were acquired from the OSM. Simultaneously, the data from the public register of real estate prices and central register of the energy performance of buildings were acquired, analyzed, and preprocessed in the following way of description: the usable area (1 m2), story (numeric), rooms (numeric), basement (1—if it exists, 0—if it does not exist), building stories (numeric), technology (1—if traditional, 0—if industrialized), lift (1—if it exists, 0—if it does not exist), unit price (pln/1 square meter), annual usable energy demand index (kWh/(1 m2·year)), annual final energy demand index (kWh/(1 m2·year)), index of annual demand for non-renewable primary energy (kWh/(1 m2·year)), share of renewable energy sources in annual final energy demand (%), unit volume of emissions (t CO2/(1 m2·year)).
Having prepared the assumed variables, the HO-MAR modified algorithm could be utilized for the purpose of homogenous geo-market area selection. The application of the mentioned procedures enabled us to obtain 198 homogenous geo-market areas. The geolocation of the 10 most voluminous groups is presented in Figure 4.
The extracted homogenous geo-market areas formed predominately by units belonging to the same group were transformed into continuous areas, with the use of the grouping function, if applicable. One of the selected geo-market areas (G1) indicated the scope of the property transaction analysis and random forest method utilization. The investigated area was located in two Olsztyn City neighborhoods called Jaroty and Nagórki (covering cadastral registration districts 106, 112, 114, 118, 125, 126, 127, 160, 161). Within the analyzed period of time (the year 2023), 265 residential real estate and free secondary market transactions took place there—see Figure 5.
From the selected set of 265 property transactions, the authors selected 49 that were fully described in terms of the assumed attributes. What was noticed was that the data completeness in the central register of the energy performance of buildings was a significant problem. Only 18% of the registered transactions were filled with data. The normalized diversity of acquired explanatory variables for the 49 investigated property transactions is presented in a box and whisker chart—see Figure 5.
The analysis of the acquired variables describing property transactions enables random forest method utilization. The analysis involved data processing with the use of the random forest method for the purpose of property feature significance determination. The model parameters were determined using iterative processing. Appropriately prepared data were randomly assigned to training sets and subjected to learning while considering the size of the model (number of trees), the initial value of the random number generator, and the stopping parameters of the process. The processing was carried out to predict the value of the real estate (the target variable) by identifying the impact of individual characteristics on their changes. Performing an analysis of the obtained results of the predicted property values and their differences from the observed values, it turned out that the optimal solution for the dataset we have is to set a random forest with a size of 200 trees, the initial value of the random number generator as equal to 0, and the number of predictors at 12 (one variable was excluded from each processing). The training graph of the random forest model based on the aforementioned parameters is shown in Figure 6:
The residuals of the model have a normal distribution, which confirms the correctness of the model’s estimates and predictions. The random forest model was evaluated for the quality of the prediction of real estate prices. The quality of the prediction was determined using the average value of the distance—the differences between the predicted values of properties and the observed values. The use of optimal model parameters produced an average distance value of 752.70 PLN. As a result of the processing, the importance values of each property feature in the process of the prediction of property value were obtained. Importance coefficients were determined based on the impact of each feature on the quality of the model’s prediction—see Figure 7.
An analysis of the importance of the features indicates the existence of several key determinants in terms of influence on property values. With the parameters used, features such as year, usable area, and rooms proved to have a significant impact on the real estate value model—as indicated by their highest importance values. Among the features whose importance in terms of property value formation is at a comparable level were the building story, EK, CO2_ECO2, story, EP, and EU. On the other hand, the features whose influence on the value of the property was found to be the lowest were the technology, basement, lift, and UOZE.

6. Verification of the Results

In order to verify the utilitarian character and validity of the obtained results, a comparison was made between the values obtained with the use of random forests and the results of a multiple regression analysis representing filter methods—a classically used approach based on the correlation matrix of variables. Multivariate regression is a classic statistical technique commonly used to analyze the relationship between an exploratory (dependent) variable and a set of explanatory (independent) variables. If one wants to use multiple regression effectively, the principle of non-collinearity of characteristics must be preserved, meaning that the explanatory variables should not be highly correlated with each other. This is because collinearity can lead to difficulties in estimating the effects of individual variables and makes it difficult to interpret the model. Therefore, at the outset, an analysis of the interrelationships between variables was conducted. Pearson’s correlation of all the variables accepted for the analysis at the outset was used—see Figure 8.
As a result of the identification of a high correlation of variables (above the value of the correlation coefficient equaling 0.7), the elimination of real estate features that showed a strong relationship with other features and at the same time a lower (for the analyzed pair of features) relationship with the transaction price was carried out. As a result of such assumptions, the following features were excluded from the further analysis: the EU, EP, usable area, and technology. The results of the multivariate regression analysis are presented in Table 1.
The results of model quality based on the adjusted Coefficient of Determination R2 (0.50) indicated poor predictive capabilities of the model. Additionally, only three variables showed a significant impact on the property value model (p-value less than 0.05): rooms and year, which also showed the highest correlation with property price (0.56 and 0.64, respectively). Statistical significance, F, reached a value below 0.05, indicating that the model is statistically significant. The residuals of the model follow a normal distribution, indicating that the model’s estimates and predictions are correct. The multiple regression model was evaluated for the quality of the prediction of real estate prices. The quality of prediction was determined using the average value of distance—the differences between the predicted values of real estate and the observed values, which amounted to 752.90 PLN. Figure 9 shows a scatter plot of the residuals obtained by processing the data in the random forest method and multiple regression against real estate prices.
Plots of the dependence of the residuals on observed prices indicate common trends in the context of the magnitude of predicted prices—the convergence of outliers when using both methods. The obtained results revealed several noteworthy findings from a variety of perspectives:
  • predictive accuracy: the identified optimal parameters of the random forest model enabled us to reach the prediction quality measured using the average distance between predicted and observed property values, at a level of 752.70 PLN compared to the multiple regression analysis—752.90 PLN;
  • variable importance: the random forest method provided valuable insights into the importance of all the individual features in the assumed set, allowing for a more nuanced understanding of factors influencing property values in contrast to multiple regression that limited the range of included features (that results from the basic assumptions of the method utilization). The random forest can deal more effectively with a large number of features, considering their impact on prediction;
  • handling non-linearity: random forests are well suited for capturing complex, non-linear relationships between variables, providing a more flexible modeling approach compared to linear regression;
  • robustness: the normal distribution of residuals in the random forest model indicates the robustness of the predictions, enhancing confidence in the model’s reliability. The random forest is relatively robust to the presence of independent variables (i.e., variables irrelevant to the prediction) because it focuses on the most informative variables when building decision trees;
  • interpretability: while the random forest model offers satisfactory predictive accuracy, it may lack interpretability compared to traditional linear regression, making it challenging to explain the rationale behind specific predictions;
The executed research enabled the formulation of the following conclusions:

7. Discussion and Conclusions

The executed research aimed at providing a real estate decision-making support algorithm implementing AI technology. The analysis involved careful processing of acquired variables, with a focus on determining the significance of individual characteristics, including the ones reflecting real estate industry sustainable solutions (ESG), through the utilization of the random forest method.
The obtained results confirmed the thesis and proved the hypothesis from a mathematical point of view. In conclusion, the implemented random forest method in the proposed real estate feature significance assessment methodology proved to be a useful tool from the perspective of real estate price prediction based on assumed criteria. Its ability to handle non-linear relationships and provide insights into feature importance proved advantageous in comparison to the multiple regression analysis. Despite some trade-offs in interpretability, the random forest model demonstrated satisfactory predictive performance, making it a viable and valuable approach for a real estate market analysis on the example of ESG sustainable solutions. The findings underscore the importance of considering advanced machine learning techniques for complex tasks in the field of a property market analysis and provide a foundation for the further exploration and refinement of predictive models in real estate. The potential areas of further exploration that one could benefit from based on the conclusions might involve the following:
  • expanding the set of ESG criteria used in the analysis, such as with water efficiency, waste management practices, or social impact metrics (adjusting the ESG criteria could enhance the model’s ability to capture the multifaceted nature of sustainability in real estate);
  • exploring the integration of dynamic and real-time ESG data (sustainability factors can evolve over time and incorporating up-to-date information into the model may improve its predictive accuracy);
  • investigating the long-term impact of ESG features on real estate values (assessing how sustainable practices influence property values over extended periods could provide insights into the resilience and lasting value of ESG investments).
The aforementioned directions of further investigation are just examples of areas that one could benefit from. This ongoing research can deepen one’s understanding of the complex relationships between sustainability and real estate values, ultimately informing more effective and informed decision making in the industry.

Author Contributions

The authors contributed equally to the research. All authors have read and agreed to the published version of the manuscript.

Funding

This research was funded by the Development Program at the University of Warmia and Mazury in Olsztyn (internship in the School of Government at the University of North Carolina, USA, co-financed by the European Union under the European Social Fund) (POWR.03.05. 00-00-Z310/17).

Institutional Review Board Statement

Not applicable.

Informed Consent Statement

Not applicable.

Data Availability Statement

The data presented are available on request from the corresponding author.

Conflicts of Interest

The authors declare no conflicts of interest.

References

  1. The World Bank. Global Program on Sustainability Annual Report FY22. 2022. Available online: https://thedocs.worldbank.org/en/doc/d3294f3f7a7aefa874c4cd794d098711-0320052023/original/global-program-on-sustainability-FY22-annual-report.pdf (accessed on 27 December 2023).
  2. FIG. Geospatial Data in the 2020s: Transformative Power and Pathways to Sustainability; FIG Publication: Copenhagen, Denmark, 2022. [Google Scholar]
  3. OECD. Better Policies for 2030 an OECD Action Plan on the Sustainable Development Goals; OECD Publishing: Paris, France, 2016. [Google Scholar]
  4. FAO. FAO’s Blue Growth Initiative: Blue finance Guidance Notes. Blue Bonds; FAO: Rome, Italy, 2020. [Google Scholar]
  5. The 5 Main Challenges of ESG Reporting|Blog. Available online: https://bedfordconsulting.com/the-5-main-challenges-of-esg-reporting-and-best-practice/ (accessed on 6 January 2024).
  6. Mazur, Ł.; Resler, M.; Koda, E.; Walasek, D.; Daria Vaverková, M. Energy saving and Green building Certification: Case study of commercial buildings in Warsaw, Poland. Sustain. Energy Technol. Assess. 2023, 60, 103520. [Google Scholar] [CrossRef]
  7. Moghayedi, A.; Awuzie, B. Towards a net-zero carbon economy: A sustainability performance assessment of innovative prefabricated construction methods for affordable housing in Southern Africa. Sustain. Cities Soc. 2023, 99, 104907. [Google Scholar] [CrossRef]
  8. Basse, T.; Desmyter, S.; Saft, D.; Wegener, C. Leading indicators for the US housing market: New empirical evidence and thoughts about implications for risk managers and ESG investors. Int. Rev. Financ. Anal. 2023, 89, 102765. [Google Scholar] [CrossRef]
  9. Lorenz, D.; Dent, P.; Kauko, T. Value in a Changing Built Environment; John Wiley & Sons, Ltd.: New York, NY, USA, 2017; pp. 1–234. [Google Scholar] [CrossRef]
  10. Lorenz, D.; Lützkendorf, T.; d’Amato, M.; Des Rosiers, F.; Elder, B.; van Genne, F.; Hartenberger, U.; Hill, S.; Jones, K.; Kauko, T.; et al. Sustainable Property Investment & Management—Key Issues & Major Challenges; RICS (Royal Institution of Chartered Surveyors): London, UK, 2008. [Google Scholar]
  11. Lorenz, D.P.; Lützkendorf, T.; Trück, S. Exploring the relationship between the sustainability of construction and market value: Theoretical basics and initial empirical results from the residential property sector. Prop. Manag. 2007, 25, 119–149. [Google Scholar] [CrossRef]
  12. Walacik, M.; Renigier-Biłozor, M.; Chmielewska, A.; Janowski, A. Property sustainable value versus highest and best use analyzes. Sustain. Dev. 2020, 28, 1755–1772. [Google Scholar] [CrossRef]
  13. Chmielewska, A.; Renigier-Biłozor, M.; Janowski, A. Representative Residential Property Model—Soft Computing Solution. Int. J. Environ. Res. Public Health 2022, 19, 15114. [Google Scholar] [CrossRef]
  14. Kauškale, L.; Geipele, I. Integrated Approach of Real Estate Market Analysis in Sustainable Development Context for Decision Making. Procedia Eng. 2017, 172, 505–512. [Google Scholar] [CrossRef]
  15. Kobylińska, K.; Cellmer, R. Modelling and Simulation of Selected Real Estate Market Spatial Phenomena. ISPRS Int. J. Geo-Inf. 2019, 8, 446. [Google Scholar] [CrossRef]
  16. Zhou, W.X.; Sornette, D. Analysis of the real estate market in Las Vegas: Bubble, seasonal patterns, and prediction of the CSW indices. Phys. A Stat. Mech. Its Appl. 2008, 387, 243–260. [Google Scholar] [CrossRef]
  17. Wisniewski, R.; Brzezicka, J. Translocality on the real estate market: A new extended approach. Land Use Policy 2020, 97, 104731. [Google Scholar] [CrossRef]
  18. McCluskey, W.J.; McCord, M.; Davis, P.T.; Haran, M.; McIlhatton, D. Prediction accuracy in mass appraisal: A comparison of modern approaches. J. Prop. Res. 2013, 30, 239–265. [Google Scholar] [CrossRef]
  19. Abidoye, R.B.; Chan, A.P.C. Critical determinants of residential property value: Professionals’ perspective. J. Facil. Manag. 2016, 14, 283–300. [Google Scholar] [CrossRef]
  20. Foryś, I.; Kokot, S. Preferencje potencjalnych nabywców w określaniu wag cech rynkowych nieruchomości. Stud. Mater. Tow. Nauk. Nieruchom. 2008, 16, 45–61. [Google Scholar]
  21. Tan, T. Locational, neighborhood, structural and socio-cultural attributes of housing in homeownership decisions. In Proceedings of the International Real Estate Symposium (IRERS) 2012: Globalization of Real Estate: Transforming and Opportunities (6th), Putrajaya, Malaysia, 24–25 April 2012. [Google Scholar]
  22. García, J.L.; Alvarado, A.; Blanco, J.; Jiménez, E.; Maldonado, A.A.; Cortés, G. Multi-attribute evaluation and selection of sites for agricultural product warehouses based on an Analytic Hierarchy Process. Comput. Electron. Agric. 2014, 100, 60–69. [Google Scholar] [CrossRef]
  23. Ghumare, P.N.; Chauhan, K.A.; Yadav, S.K.M. Housing attributes affecting buyers in India: Analysis of perceptions in the context of EWS/LIG consumers view. Int. J. Hous. Mark. Anal. 2020, 13, 533–552. [Google Scholar] [CrossRef]
  24. Głuszak, M.; Małkowska, A. Preferencje mieszkaniowe młodych najemców lokali mieszkalnych w Krakowie. Świat Nieruchom. 2017, 100/6, 39–44. [Google Scholar] [CrossRef]
  25. Hurtubia, R.; Gallay, O.; Bierlaire, M. Attributes of Households, Locations and Real-Estate Markets for Land Use Modeling. 2010. Available online: https://transp-or.epfl.ch/documents/technicalReports/sustaincity_WP2_7.pdf (accessed on 27 December 2023).
  26. Kokot, S.; Bas, M. Postrzeganie cech rynkowych przez rzeczoznawców majątkowych, pośredników w obrocie i nabywców nieruchomości—Wyniki badań ankietowych. Stud. Pr. WNEiZ US 2016, 1, 355–369. [Google Scholar] [CrossRef]
  27. Nilsson, P. Prediction of residential real estate selling prices using neural networks. Comput. Inf. Sci. 2019, 70, 37. [Google Scholar]
  28. Sarif, S.M.; Mohamed, S.F.P.; Khalid, M.S. Assessing Decision Factors for House Purchasing (Needs vs. Preferences) from Case Study of First-Time Potential Homebuyers in Klang Valley: Towards Technology-Mediated Individual Decision Aid. In Proceedings of the Knowledge Management International Conference, Turin, Italy, 22–26 October 2018. [Google Scholar]
  29. Sean, S.L.; Hong, T.T. Factors Affecting the Purchase Decision of Investors in the Residential Property Market in Malaysia. J. Surv. Constr. Prop. 2014, 5, 1–13. [Google Scholar] [CrossRef]
  30. Izquierdo-Verdiguier, E.; Zurita-Milla, R. An evaluation of Guided Regularized Random Forest for classification and regression tasks in remote sensing. Int. J. Appl. Earth Obs. Geoinf. 2020, 88, 102051. [Google Scholar] [CrossRef]
  31. Zurada, J.M.; Levitan, A.S.; Guan, J. Non-conventional approaches to property value assessment. J. Appl. Bus. Res. 2006, 22, 1–14. [Google Scholar] [CrossRef]
  32. Adomatis, S.K.; Molitor-Gennrich, D. Understanding Desktop (Bifurcated or Hybrid) Appraisals. Appraisal J. 2022, 90, 99. [Google Scholar]
  33. Starr, C.W.; Saginor, J.; Worzala, E. The rise of PropTech: Emerging industrial technologies and their impact on real estate. J. Prop. Invest. Financ. 2021, 39, 157–169. [Google Scholar] [CrossRef]
  34. Duan, Y.; Edwards, J.S.; Dwivedi, Y.K. Artificial intelligence for decision making in the era of Big Data—Evolution, challenges and research agenda. Int. J. Inf. Manag. 2019, 48, 63–71. [Google Scholar] [CrossRef]
  35. Shrestha, Y.R.; Ben-Menahem, S.M.; von Krogh, G. Organizational Decision-Making Structures in the Age of Artificial Intelligence. Calif. Manag. Rev. 2019, 61. [Google Scholar] [CrossRef]
  36. Ntoutsi, E.; Fafalios, P.; Gadiraju, U.; Iosifidis, V.; Nejdl, W.; Vidal, M.E.; Ruggieri, S.; Turini, F.; Papadopoulos, S.; Krasanakis, E.; et al. Bias in data-driven artificial intelligence systems—An introductory survey. Wiley Interdiscip. Rev. Data Min. Knowl. Discov. 2020, 10, e1356. [Google Scholar] [CrossRef]
  37. Renigier-Biłozor, M.; Źróbek, S.; Walacik, M.; Borst, R.; Grover, R.; d’Amato, M. International acceptance of automated modern tools use must-have for sustainable real estate market development. Land Use Policy 2022, 113, 105876. [Google Scholar] [CrossRef]
  38. Walacik, M.; Cellmer, R.; Źróbek, S. Mass Appraisal—International Background, Polish Solutions and Proposal of new Methods Application. Geod. List 2013, 67, 255–269. [Google Scholar]
  39. Mete, M.O.; Yomralioglu, T. A Hybrid Approach for Mass Valuation of Residential Properties through Geographic Information Systems and Machine Learning Integration. Geogr. Anal. 2023, 55, 535–559. [Google Scholar] [CrossRef]
  40. Abioye, S.O.; Oyedele, L.O.; Akanbi, L.; Ajayi, A.; Davila Delgado, J.M.; Bilal, M.; Akinade, O.O.; Ahmed, A. Artificial intelligence in the construction industry: A review of present status, opportunities and future challenges. J. Build. Eng. 2021, 44, 103299. [Google Scholar] [CrossRef]
  41. Latifi, S.; Zhang, Y.; Cheng, L.C. Blockchain-Based Real Estate Market: One Method for Applying Blockchain Technology in Commercial Real Estate Market. In Proceedings of the IEEE International Conference on Blockchain (Blockchain), Atlanta, GA, USA, 14–17 July 2019; pp. 528–535. [Google Scholar] [CrossRef]
  42. Al-Refaie, A.; Al-Hawadi, A.; Lepkova, N.; Abbasi, G. Blockchain of optimal multiple construction projects planning under probabilistic arrival and stochastic durations. J. Civ. Eng. Manag. 2023, 29, 15–34. [Google Scholar] [CrossRef]
  43. Golestanizadeh, M.; Sarvari, H.; Chan, D.W.M.; Banaitienė, N.; Banaitis, A. Managerial opportunities in application of business intelligence in construction companies. J. Civ. Eng. Manag. 2023, 29, 487–500. [Google Scholar] [CrossRef]
  44. Pham, B.T.; Luu, C.; Phong, T.V.; Nguyen, H.D.; Le, H.V.; Tran, T.Q.; Ta, H.T.; Prakash, I. Flood risk assessment using hybrid artificial intelligence models integrated with multi-criteria decision analysis in Quang Nam Province, Vietnam. J. Hydrol. 2021, 592, 125815. [Google Scholar] [CrossRef]
  45. Ziolkowski, P.; Niedostatkiewicz, M.; Kang, S.-B. Model-Based Adaptive Machine Learning Approach in Concrete Mix Design. Materials 2021, 14, 1661. [Google Scholar] [CrossRef] [PubMed]
  46. Bao, Y.; Hilary, G.; Ke, B. Artificial Intelligence and Fraud Detection. SSRN Electron. J. 2020. [Google Scholar] [CrossRef]
  47. Mcgrath, P.; Desai, K.; Junquera, P. Resistance is futile: How corporate real estate companies can deploy artificial intelligence as a competitive advantage. Corp. Real Estate J. 2019, 9, 121–129. [Google Scholar]
  48. Danilevsky, M.; Qian, K.; Aharonov, R.; Katsis, Y.; Kawas, B.; Sen, P. A Survey of the State of Explainable AI for Natural Language Processing. Comput. Lang. 2020. [Google Scholar] [CrossRef]
  49. Radzewicz, A.; Wiśniewski, R. Niepewność rynku nieruchomości. Stud. Mater. Tow. Nauk. Nieruchom. 2011, 19, 47–57. [Google Scholar]
  50. Chmielewska, A.; Adamiczka, J.; Romanowski, M. Genetic Algorithm as Automated Valuation Model Component in Real Estate Investment Decisions System. Real Estate Manag. Valuat. 2020, 28, 1–14. [Google Scholar] [CrossRef]
  51. Polkowski, L. Reductive Reasoning Rough and Fuzzy Sets as Frameworks for Reductive Reasoning. Intell. Syst. Ref. Libr. 2011, 20, 145–190. [Google Scholar] [CrossRef]
  52. Zhang, Z. A rough set approach to intuitionistic fuzzy soft set based decision making. Appl. Math. Model. 2012, 36, 4605–4633. [Google Scholar] [CrossRef]
  53. Stokey, N.L. Wait-and-see: Investment options under policy uncertainty. Rev. Econ. Dyn. 2016, 21, 246–265. [Google Scholar] [CrossRef]
  54. Del Giudice, V.; De Paola, P. Spatial analysis of residential real estate rental market with geoadditive models. In Advances in Automated Valuation Modeling; Springer: Cham, Switzerland, 2017; Volume 86, pp. 155–162. [Google Scholar]
  55. Zavadskas, E.K.; Kaklauskas, A.; Turskis, Z.; Tamošaitiene, J. Selection of the effective dwelling house walls by applying attributes values determined at intervals. J. Civ. Eng. Manag. 2010, 14, 85–93. [Google Scholar] [CrossRef]
  56. Kaklauskas, A.; Zavadskas, E.K.; Bardauskienė, D.; Dargis, R. Sustainable Development of Real Estate. Sustain. Dev. Real Estate 2015. [Google Scholar] [CrossRef]
  57. Zavadskas, E.K.; Turskis, Z. Multiple criteria decision making (MCDM) methods in economics: An overview. Technol. Econ. Dev. Econ. 2011, 17, 397–427. [Google Scholar] [CrossRef]
  58. D’Amato, M.; Kauko, T. (Eds.) Advances in Automated Valuation Modeling; Studies in Systems, Decision and Control; Springer: Cham, Switzerland, 2017; Volume 86, ISBN 978-3-319-49744-0. [Google Scholar]
  59. Yakubovsky, V.; Bychkov, O.; Scherba, A. Combined Neural Approach to Deterministic and Probabilistic Assets Cost Valuation. In Proceedings of the 2018 Baltic Geodetic Congress (BGC Geomatics), Olsztyn, Poland, 21–23 June 2018; pp. 132–137. [Google Scholar] [CrossRef]
  60. Fletcher, R. Practical Methods of Optimization; Wiley: New York, NY, USA, 2000. [Google Scholar]
  61. Helbich, M.; Brunauer, W.; Hagenauer, J.; Leitner, M. Data-Driven Regionalization of Housing Markets. Ann. Assoc. Am. Geogr. 2013, 103, 871–889. [Google Scholar] [CrossRef]
  62. Renigier-Biłozor, M.; Janowski, A.; Walacik, M.; Chmielewska, A. Human emotion recognition in the significance assessment of property attributes. J. Hous. Built Environ. 2022, 37, 23–56. [Google Scholar] [CrossRef]
  63. Giudice, V.D.; De Paola, P.; Forte, F. Using genetic algorithms for real estate appraisals. Buildings 2017, 7, 31. [Google Scholar] [CrossRef]
  64. Cheng, X.; Sun, Z.; Bao, W. Study on credit risk of real estate industry based on genetic algorithm KMV model. J. Phys. Conf. Ser. 2020, 1629, 012072. [Google Scholar] [CrossRef]
  65. Dubinskas, P.; Dubinskas, P.; Urbšienė, L. Investment Portfolio Optimization by Applying a Genetic Algorithm-based Approach. Ekonomika 2017, 96, 66–78. [Google Scholar] [CrossRef]
  66. Lin, C.S.; Lee, I.L.; Wu, M.C. Merits of using chromosome representations and shadow chromosomes in genetic algorithms for solving scheduling problems. Robot. Comput. Integr. Manuf. 2019, 58, 196–207. [Google Scholar] [CrossRef]
  67. Pereira, R. Genetic Algorithm Optimisation for Finance and Investments; MPRA Paper 8610; University Library of Munich, Germany: Munich, Germany, 2000. [Google Scholar]
  68. Ao, Y.; Li, H.; Zhu, L.; Ali, S.; Yang, Z. The linear random forest algorithm and its advantages in machine learning assisted logging regression modeling. J. Pet. Sci. Eng. 2019, 174, 776–789. [Google Scholar] [CrossRef]
  69. Sun, Z.; Wang, G.; Li, P.; Wang, H.; Zhang, M.; Liang, X. An improved random forest based on the classification accuracy and correlation measurement of decision trees. Expert Syst. Appl. 2024, 237, 121549. [Google Scholar] [CrossRef]
  70. Jiang, M.; Wang, J.; Hu, L.; He, Z. Random forest clustering for discrete sequences. Pattern Recognit. Lett. 2023, 174, 145–151. [Google Scholar] [CrossRef]
  71. Cai, C.; Yang, C.; Lu, S.; Gao, G.; Na, J.; Cai, C.; Yang, C.; Lu, S.; Gao, G.; Na, J. Human motion pattern recognition based on the fused random forest algorithm. Measurement 2023, 222, 113540. [Google Scholar] [CrossRef]
  72. Darst, B.F.; Malecki, K.C.; Engelman, C.D. Using recursive feature elimination in random forest to account for correlated variables in high dimensional data. BMC Genet. 2018, 19, 65. [Google Scholar] [CrossRef]
  73. Gabrielli, L.; Giuffrida, S.; Trovato, M.R. Gaps and overlaps of urban housing sub-market: Hard clustering and fuzzy clustering approaches. In Appraisal: From Theory to Practice: Results of SIEV 2015; Springer: Berlin/Heidelberg, Germany, 2017; pp. 203–219. [Google Scholar] [CrossRef]
  74. Warren, C.M.J.; Elliott, P.; Staines, J. The impacts of historic districts on residential property land values in Australia. Int. J. Hous. Mark. Anal. 2017, 10, 66–80. [Google Scholar] [CrossRef]
  75. Usman, H.; Lizam, M.; Adekunle, M.U. Property price modelling, market segmentation and submarket classifications: A review. Real Estate Manag. Valuat. 2020, 28, 24–35. [Google Scholar] [CrossRef]
  76. Dawidowicz, A.; Nowak, M.; Gross, M. Land administration system and geoportal service for the need of a fit-for-purpose national urban greenery management system (UGMS). The concept for the EU member state of Poland. Acta Sci. Pol. Adm. Locorum 2022, 21, 53–81. [Google Scholar] [CrossRef]
  77. Renigier-Biłozor, M.; Janowski, A.; Walacik, M.; Chmielewska, A. Modern challenges of property market analysis-homogeneous areas determination. Land Use Policy 2022, 119, 106209. [Google Scholar] [CrossRef]
  78. Breiman, L. Random forests. Mach. Learn. 2001, 45, 5–32. [Google Scholar] [CrossRef]
  79. Ho, T.K. Random decision forests. In Proceedings of the 3rd International Conference on Document Analysis and Recognition, Montreal, QC, Canada, 14–16 August 1995; Volume 1, pp. 278–282. [Google Scholar] [CrossRef]
  80. Ho, T.K. The random subspace method for constructing decision forests. IEEE Trans. Pattern Anal. Mach. Intell. 1998, 20, 832–844. [Google Scholar] [CrossRef]
  81. Hastie, T.; Tibshirani, R.; Friedman, J.H.; Friedman, J.H. The Elements of Statistical Learning Data Mining, Inference, and Prediction; Springer: New York, NY, USA, 2009. [Google Scholar]
  82. Dembski, T. Od Pojedynczych Drzew do Losowego Lasu; StatSoft Polska: Kraków, Poland, 2011. [Google Scholar]
  83. Piotr, P. Zastosowanie Wybranych Metod Przekształcania i Selekcji Danych Oraz Konstrukcji Cech w Zadaniach Klasyfikacji i Klasteryzacji. 2016. Available online: https://repo.pw.edu.pl/info/phd/WUT638dedcf8af24ac694525aac84d795ec/Zastosowanie%2Bwybranych%2Bmetod%2Bprzekszta%25C5%2582cania%2Bi%2Bselekcji%2Bdanych%2Boraz%2Bkonstrukcji%2Bcech%2Bw%2Bzadaniach%2Bklasyfikacji%2Bi%2Bklasteryzacji?r=phd&tab=&lang=pl (accessed on 27 December 2023).
Figure 1. AI solution examples utilized in real estate industry areas (source: author’s own elaboration).
Sustainability 16 01079 g001
Figure 2. The methodological architecture of the research (source: authors’ own elaboration).
Sustainability 16 01079 g002
Figure 3. Data acquisition and processing (source: authors’ own elaboration.
Sustainability 16 01079 g003
Figure 4. (a) Geolocation of the 10 most voluminous groups of geo-market areas (source: authors’ own elaboration); (b) geolocation of the G1 unit property transactions (source: authors’ own elaboration).
Sustainability 16 01079 g004
Figure 5. Box and whisker chart of the normalized property attributes (source: authors’ own elaboration).
Sustainability 16 01079 g005
Figure 6. The training graph of the random forest model (source: authors’ own elaboration).
Sustainability 16 01079 g006
Figure 7. Property feature importance chart (source: authors’ own elaboration).
Sustainability 16 01079 g007
Figure 8. Property feature correlation matrix (source: authors’ own elaboration).
Sustainability 16 01079 g008
Figure 9. Scatter plot of the residuals and real estate prices (source: authors’ own elaboration).
Sustainability 16 01079 g009
Table 1. Multivariate regression analysis results.
N = 49Regression Summary:
R2 = 0.5934; Adjusted R2 = 0.4996
F = 6.3241; p = 0.000018; Standard Error of the Estimate: 1148.91
bSt. Errort Statp
EK−10.805.85−1.840.07
UOZE10.4724.010.440.67
CO2_ECO27238.5214,092.140.510.61
Story−130.38130.64−0.990.32
Rooms−669.64213.77−3.130.00
Basement−156.45506.61−0.310.76
Year60.9928.202.160.04
Building Stories−95.52346.45−0.280.78
Lift287.28790.980.360.72
Disclaimer/Publisher’s Note: The statements, opinions and data contained in all publications are solely those of the individual author(s) and contributor(s) and not of MDPI and/or the editor(s). MDPI and/or the editor(s) disclaim responsibility for any injury to people or property resulting from any ideas, methods, instructions or products referred to in the content.

