Article

Photovoltaic System Performance Under Partial Shading Conditions: Insight into the Roles of Bypass Diode Numbers and Inverter Efficiency Curve

by
Hatice Gül Sezgin-Ugranlı
Electrical-Electronics Engineering, İzmir Bakırçay University, İzmir 35665, Türkiye
Sustainability 2025, 17(10), 4626; https://doi.org/10.3390/su17104626
Submission received: 13 April 2025 / Revised: 11 May 2025 / Accepted: 14 May 2025 / Published: 18 May 2025

Abstract

:
Partial shading is a common challenge influencing the performance of photovoltaic (PV) systems, particularly in urban and residential applications. A practical solution to mitigate hotspot formation due to shading is the use of bypass diodes. Increasing the number of bypass diodes further enhances PV system performance but alters the global maximum power points (MPPs), shifting their voltage locations and power magnitudes, consequently resulting in a change in the operating points in the efficiency curve of the inverters. This study investigates the impact of bypass diode numbers and inverter efficiency curves on PV system performance under various partial shading conditions. The analysis systematically deals with three inverters with different efficiency characteristics in terms of loading and input voltage, as well as module configurations with different numbers of bypass diodes. Additionally, three more factors—ambient temperature, inverter loading ratio by varying the number of series-connected PV modules, and shading intensity—are considered in the context of bypass diodes and inverter characteristics through the efficiency curve. The global MPPs of PV modules under different cases are simulated using a Simscape/Simulink-based circuit model with random irradiance samples. The results indicate the formation of bands according to the voltage that vary with bypass diode configurations. In this manner, utilizing the probabilities of these bands and inverter efficiency curves, the average PV system performance is determined for each case. The findings reveal the effects of the relationship between bypass diode configurations and inverter efficiency on PV system performance. As partial shading is especially common in dense urban areas, the results are of interest for the development of resilient and sustainable PV installations.

1. Introduction

The development in photovoltaic (PV) systems has been triggered mainly by the technological advancement in PV modules and PV inverters. Driven by this development, the decline in module prices and the renewable energy policies of countries have greatly increased investments in solar energy, as stated in the IEA report of March 2024 [1]. The flexibility and scalability of PV systems make them particularly valuable for decentralized energy generation in remote or off-grid areas where conventional grid extension is economically unfeasible [2,3]. Moreover, PV systems are increasingly integrated into hybrid renewable energy configurations—combined with wind, bioenergy, or diesel generators—to enhance system reliability and ensure continuous power supply in regions with variable solar irradiance [4,5]. In the PV market where these advances are taking place, there are hundreds of module and inverter models belonging to many brands. Therefore, it is inevitable that overall system performance must be improved through careful PV system design in order to achieve net-zero emission targets and to comply with the economic incentives optimally [6,7].
One of the main criteria for evaluating PV system performance is the DC/AC conversion efficiency, which depends on the climatic conditions of the region, the module and inverter characteristics, and the relationship between the PV string and the inverter [8,9]. Depending on the climatic characteristics of the PV site, the annual irradiance and temperature distribution determines how often and at what power the inverter operates, which is an important factor affecting the annual efficiency. At this point, some of the equations have been set as a reference for comparing commercial inverters and have started to be included in the catalogs of inverters. European (Euro) efficiency is used for average annual yield values for central European irradiance conditions, while California Energy Commission (CEC) efficiency is a weighted efficiency value used for higher irradiance climates such as the southwestern US, and they are utilized for comparison purposes in some studies [10,11,12]. However, the efficiency of the system should be evaluated under those specific PV plant site conditions to optimally determine the inverter size [13,14,15,16,17,18]. In a related study, a 125 kWp grid-connected PV system at the University of Brasília demonstrates a stable performance ratio of 78% using a 50 kW inverter [13]. A case study for the northern regions of Thailand reports that the selected inverter can operate at maximum efficiency for irradiances greater than 350 W/m2 for three different PV module types [14]. In another study conducted in five different regions in Corsica and seven different regions in Bulgaria, it is emphasized that the PV array should be oversized by 30% or undersized by 30% depending on the selected inverter, and that the effect of regional differences is more pronounced in Bulgaria [15]. In a study conducted in Poland, the impact of the nominal power ratio (NPR) and environmental conditions on the efficiency of a photovoltaic (PV) system was analyzed, showing that increasing the NPR from 82% to 98% resulted in a 446.2 kWh annual rise in energy yield [16]. For this reason, it can be said that the efficiency characteristics of the inverters are also one of the important factors determining the inverter sizing. This issue is also investigated for three different inverters classified as low, medium, and high efficiency in several European locations considering both a technical and economic point of view [17,18]. In another study carried out with two commercial inverters, the effect of sizing ratio on annual yields is examined using 10 years of data with 10 min resolution in a region with high irradiance conditions such as Mexico [9]. It allows for a better evaluation of the performance of PV systems over a wider range of irradiance and temperature levels. The resolution of the data used is also one of the parameters affecting the optimal sizing, and it is observed that the calculated losses increase with increasing resolution and the undersizing can be reduced by increasing the data resolution [19,20].
The fact that different modules are used in the market is another issue examined in terms of system efficiency and inverter sizing [9,13,21]. In [21], the effect of using different module technologies on the optimal inverter sizing for a grid-connected PV plant is investigated and it is observed that the best performance is obtained with amorphous silicon modules. In another study comparing crystalline silicon and cadmium telluride (CdTe) modules in terms of optimal inverter sizing, it is shown that CdTe modules cause more losses due to the clipping [9]. At this point, clipping is considered as a factor masking the actual performance problems and has been addressed in terms of quantifying such masking effects to better calculate the actual performance [22]. It is a well-known fact that choosing the size of the inverter smaller than the module size rapidly increases the losses due to clipping and, as mentioned before, data resolution also affects these losses [23]. Although these studies address system efficiency from different perspectives, there is no enough study in the literature that sufficiently addresses the effect of partial shading on PV system DC/AC efficiency. However, it is known that partial shading is a dominant factor in PV system efficiency, especially in building integrated PVs [24,25]. In [26], the effect of partial shading is investigated in different types of inverters in terms of efficiency, and the advantages and disadvantages of each inverter topology are presented in different PV applications.
Although the influence of partial shading on overall power generation has been widely discussed using numerical and analytical methods [27,28], its detrimental effect on DC/AC conversion efficiency under irradiance fluctuations has also been modeled and validated in several studies [29,30,31]. To mitigate the adverse effects of partial shading, various technologies and methodologies have been developed in the literature, among which the use of bypass diodes stands out as a significant and widely adopted solution in the market [32]. Furthermore, the overlapping connection of bypass diodes in the module is also proposed to avoid the local maximum power points (MPPs) under partial shading conditions [33,34]. As an alternative to traditional bypass diodes, smart bypass diode circuits are being developed using MOSFET technology to reduce shading-induced hot spot temperatures because of the fact that traditional bypass diodes are dissipating power [35,36]. On the other hand, increasing the number of bypass diodes per module is also one of the methods proposed to improve performance under partial shading conditions [32,37,38]. For this reason, it is clear that a study examining the effect of the number of bypass diodes in each module in terms of system efficiency will be important, because the change in the number of bypass diodes will affect not only the power to be obtained under partial shading but also the operating global MPP voltage [39].
This study employs a comprehensive simulation framework to evaluate the interaction between bypass diode configurations of modules and inverter efficiency curve characteristics. For this purpose, a Simscape/Simulink-based model is used in order to simulate partial shading conditions using a large number of random irradiance samples, and global MPP voltages and powers are obtained. The results show that voltage bands occur according to the bypass diode numbers. Through a comprehensive simulation framework, the effects of shading intensity, number of bypass diode, ambient temperature, inverter loading ratio (ILR), and inverter input voltage are evaluated to provide insights into PV system performance. In doing so, this study contributes to addressing changing energy production patterns by promoting more efficient and context-sensitive PV system designs. The contributions of the study are summarized as follows:
-
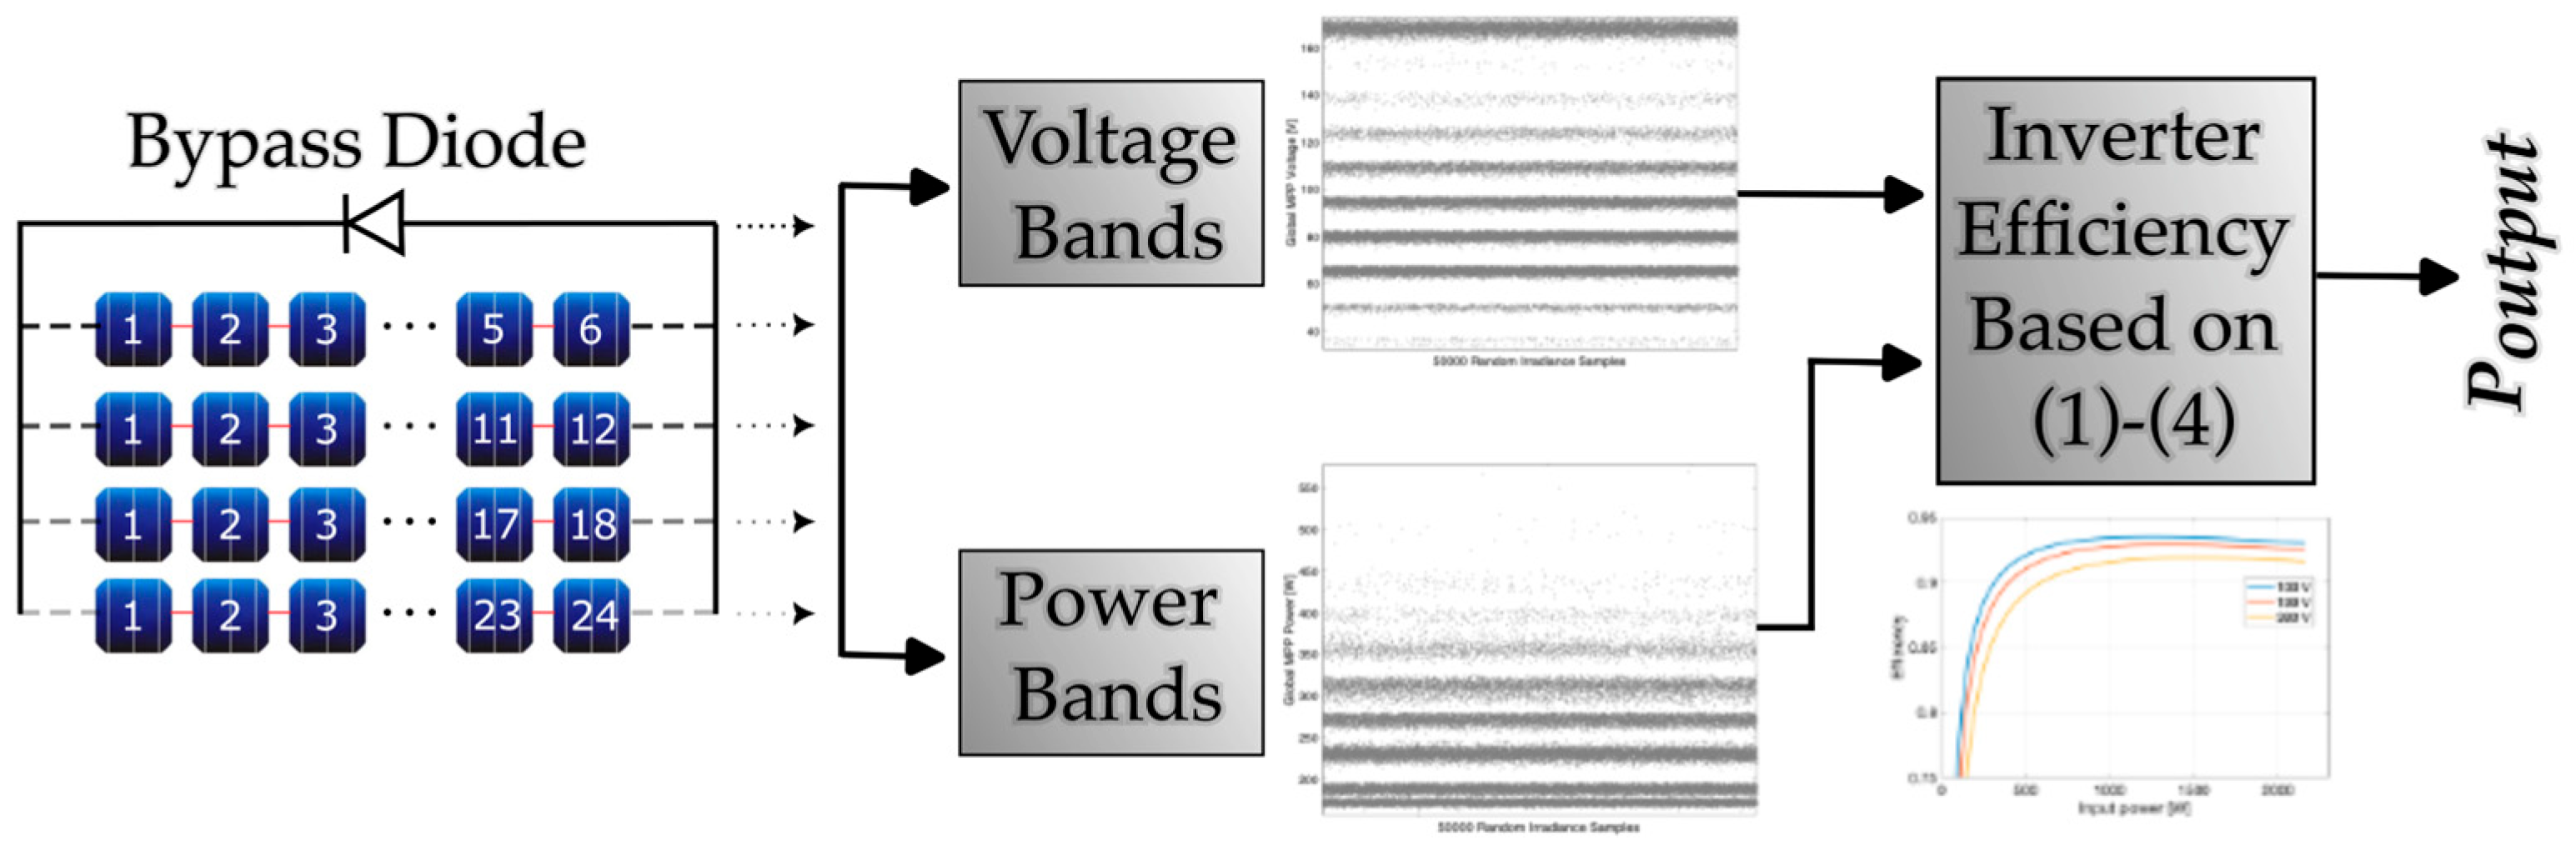
Bypass diode configuration is systematically analyzed not only for its influence on global MPP power but also for how it shifts operating voltage into different regions of the inverter efficiency curve.
-
Three commercial inverters with distinct voltage-dependent efficiency characteristics are modeled to reflect real-world behavior beyond idealized efficiency assumptions.
-
A probabilistic framework is used to simulate partial shading scenarios and voltage-band formation, which provides more detailed and comprehensive insight into global MPP distributions.
-
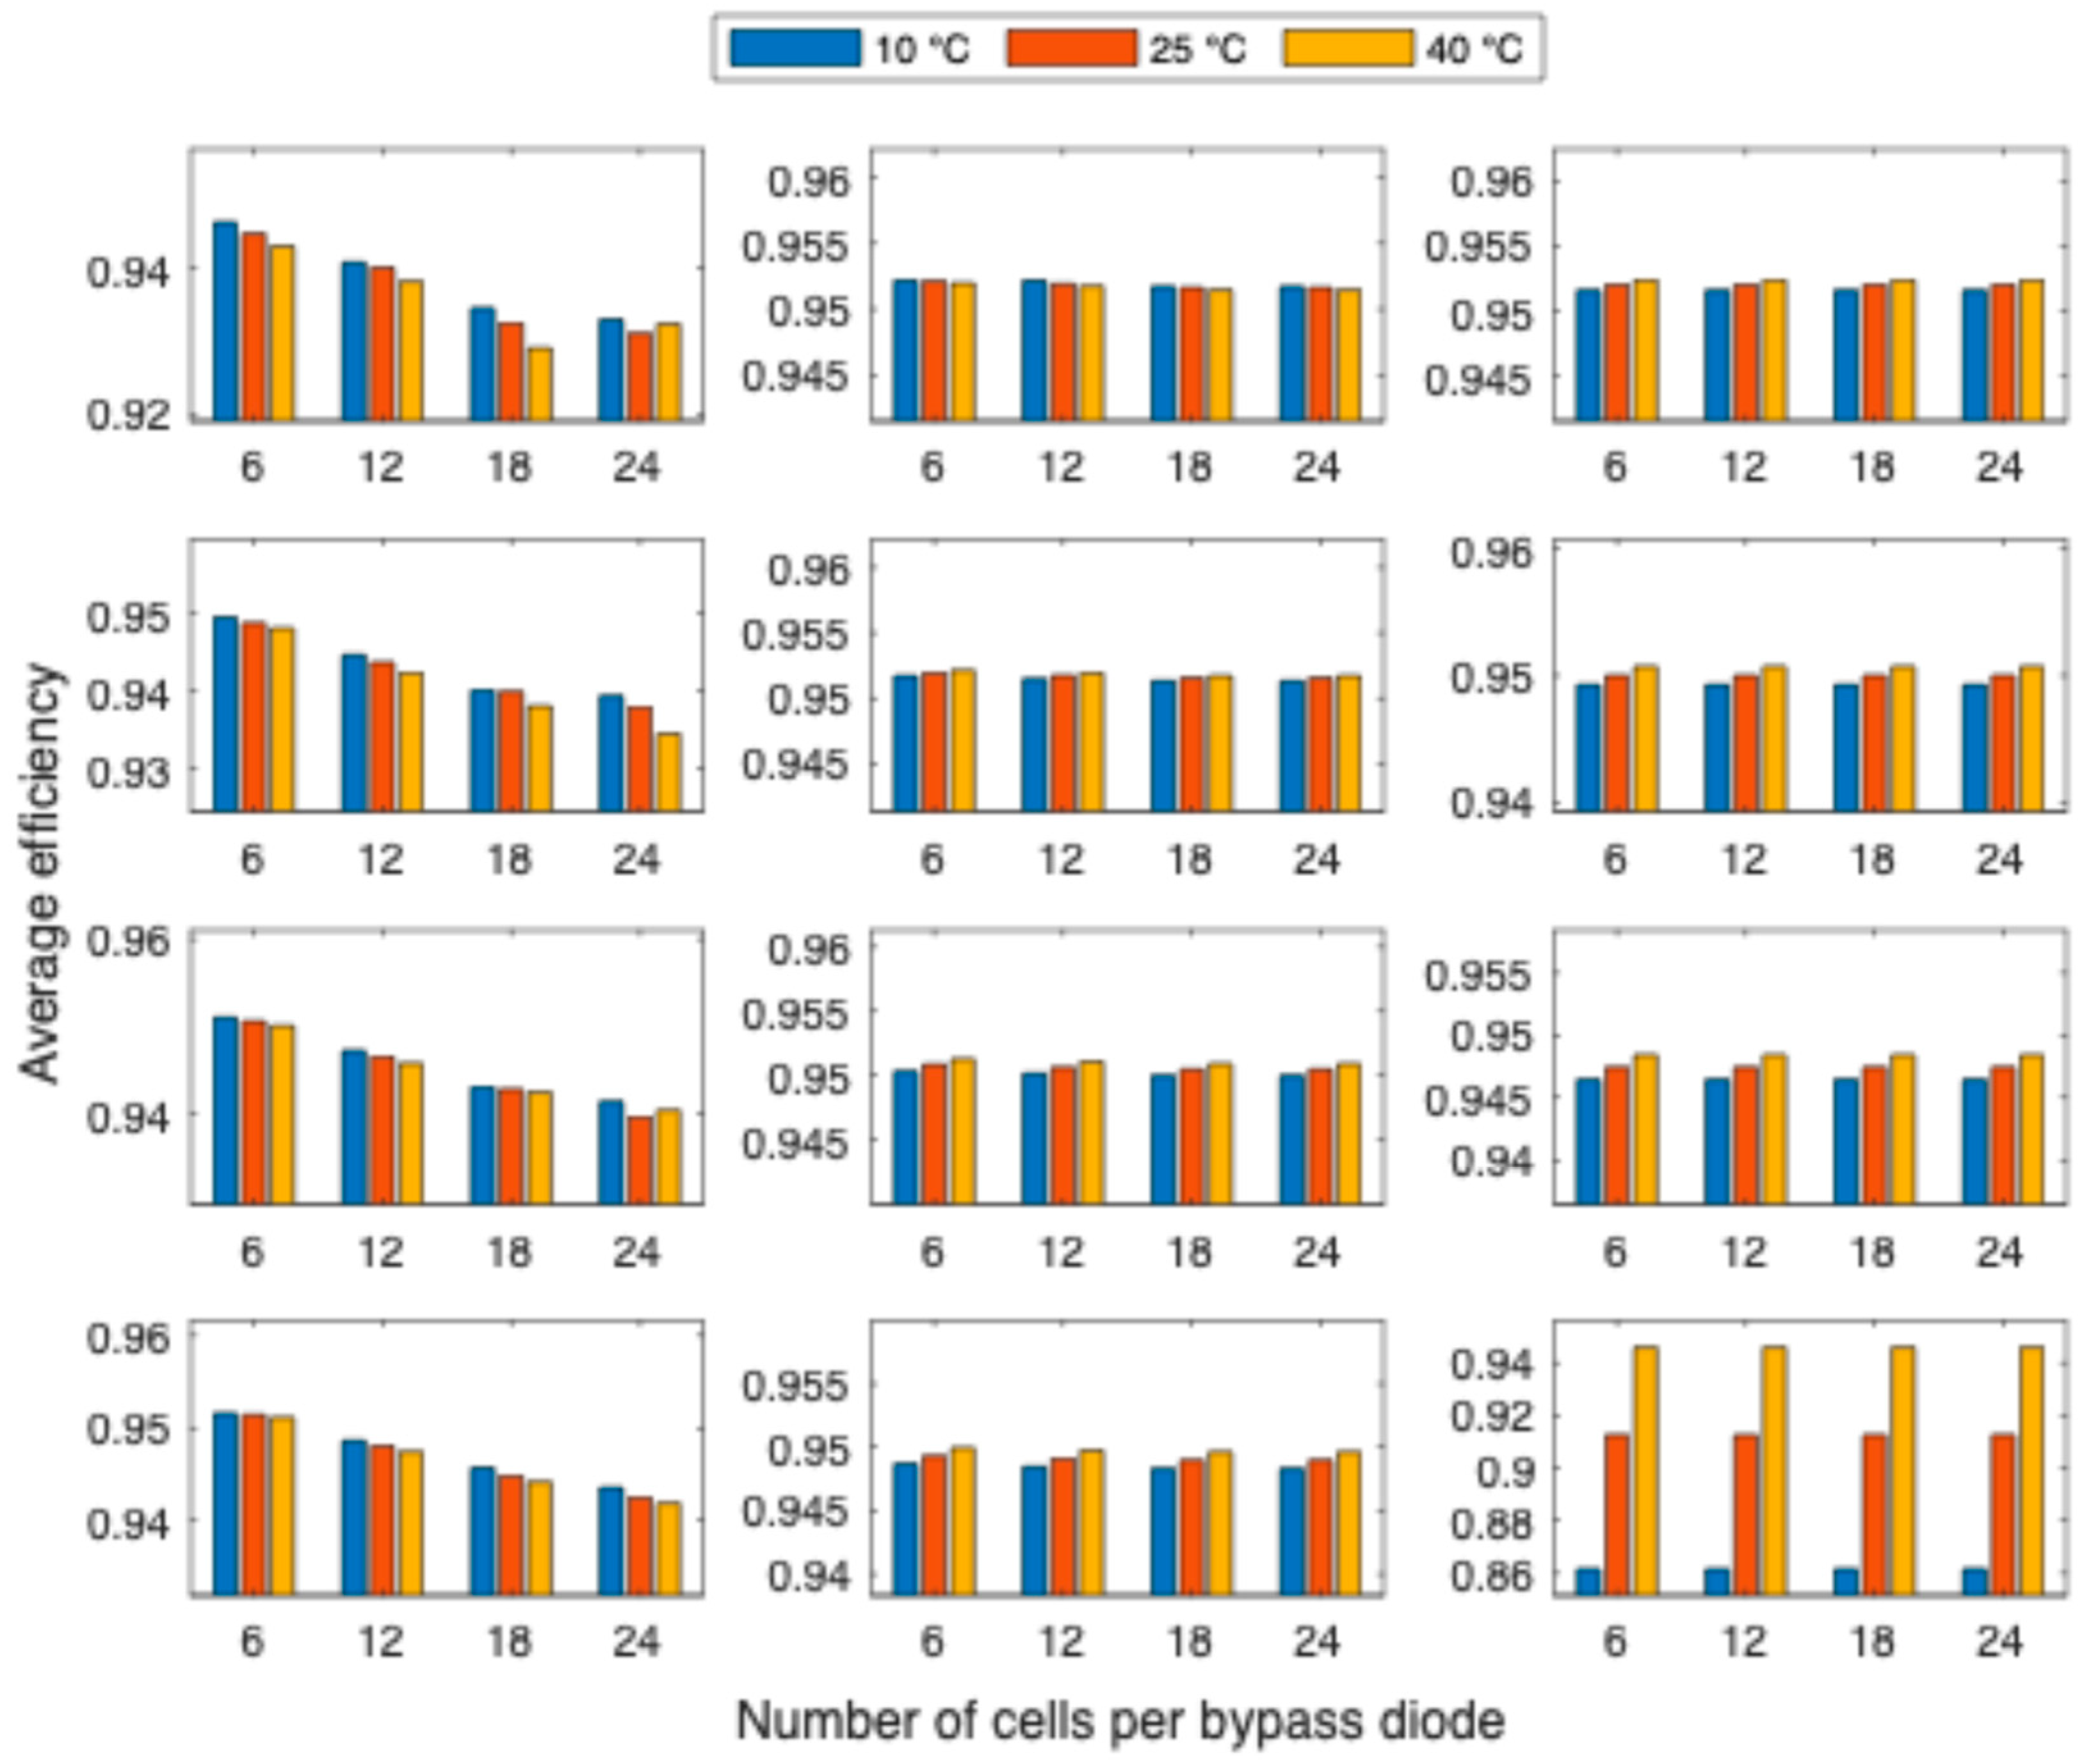
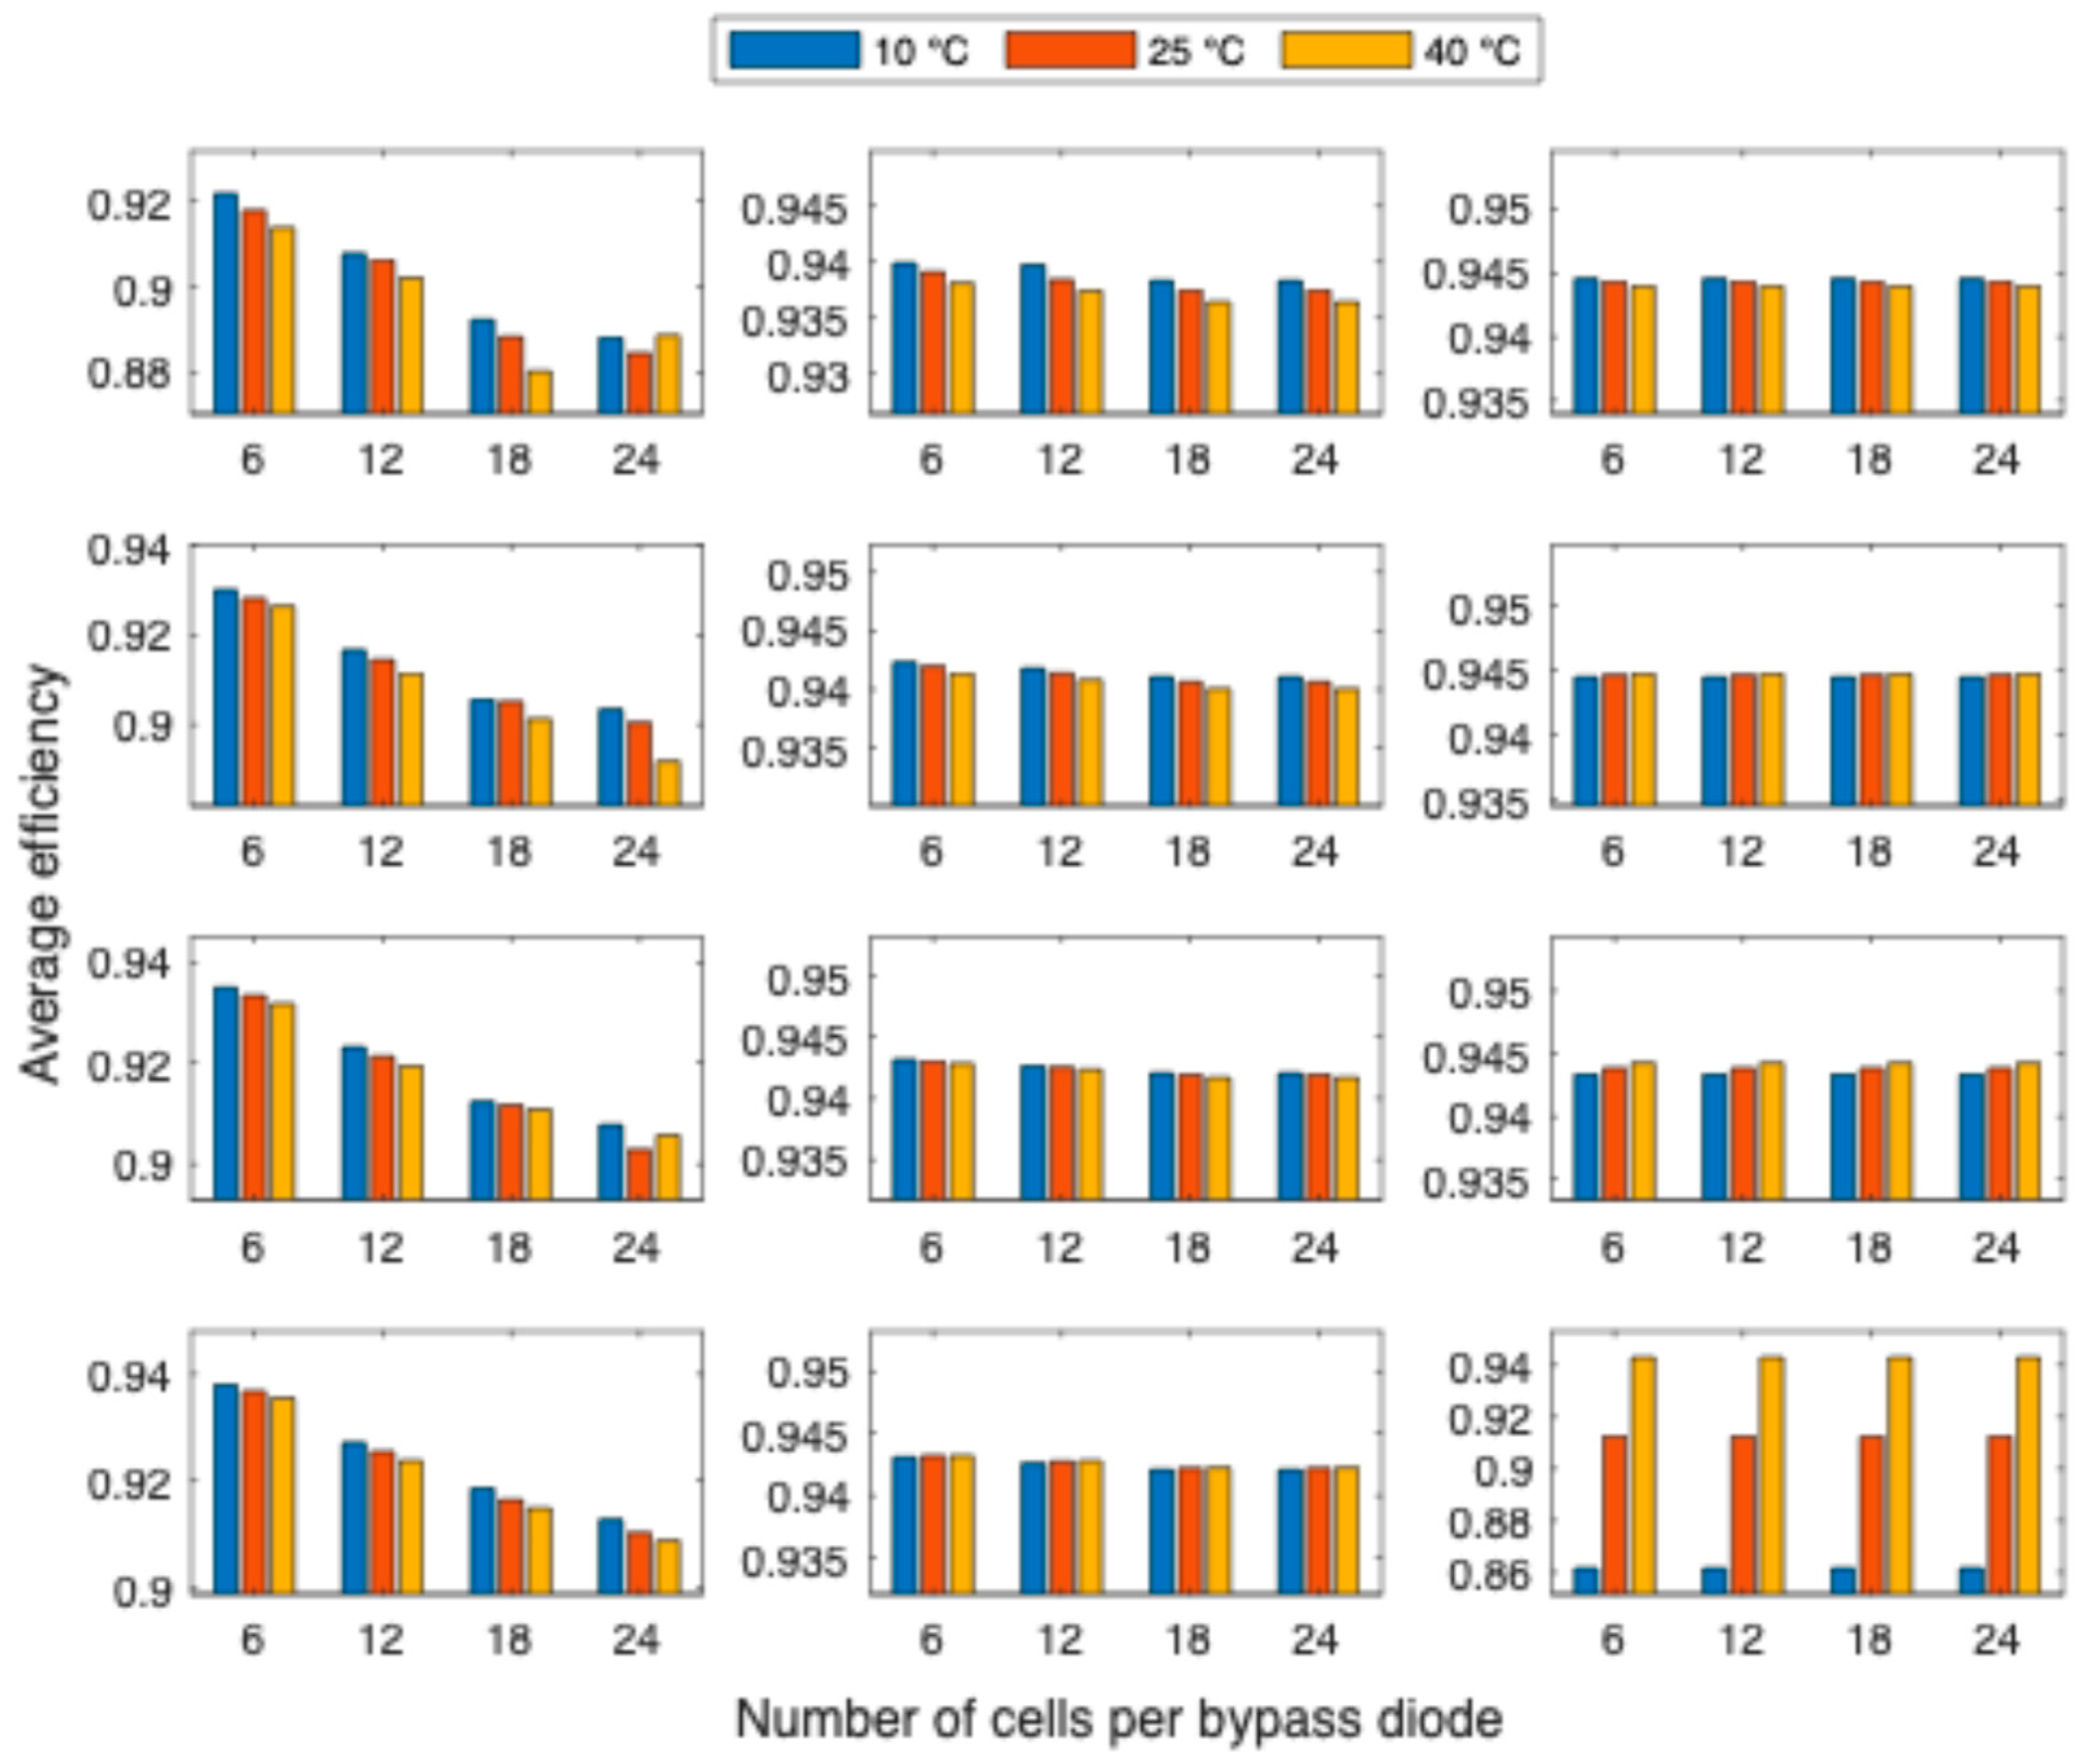
The interaction between inverter loading ratio (ILR), ambient temperature, and bypass diode number is jointly considered to evaluate how these parameters influence average DC/AC efficiency.
-
Voltage-band formation is linked directly to inverter efficiency performance, highlighting the critical importance of considering voltage-dependent efficiency curves in shading-prone environments.
The rest of this paper is organized as follows: Section 2 provides an overview of DC/AC inverter efficiency, discussing key factors affecting performance and reviewing existing efficiency models. Section 3 presents a flexible PV system modeling including the number of modules in terms of ILR, number of bypass diodes, ambient temperature, and various shading conditions. Section 4 analyzes the impact of bypass diode numbers and inverter efficiency characteristics, detailing how shading intensity and temperature variations influence system performance. Finally, Section 5 summarizes the key findings of the study.

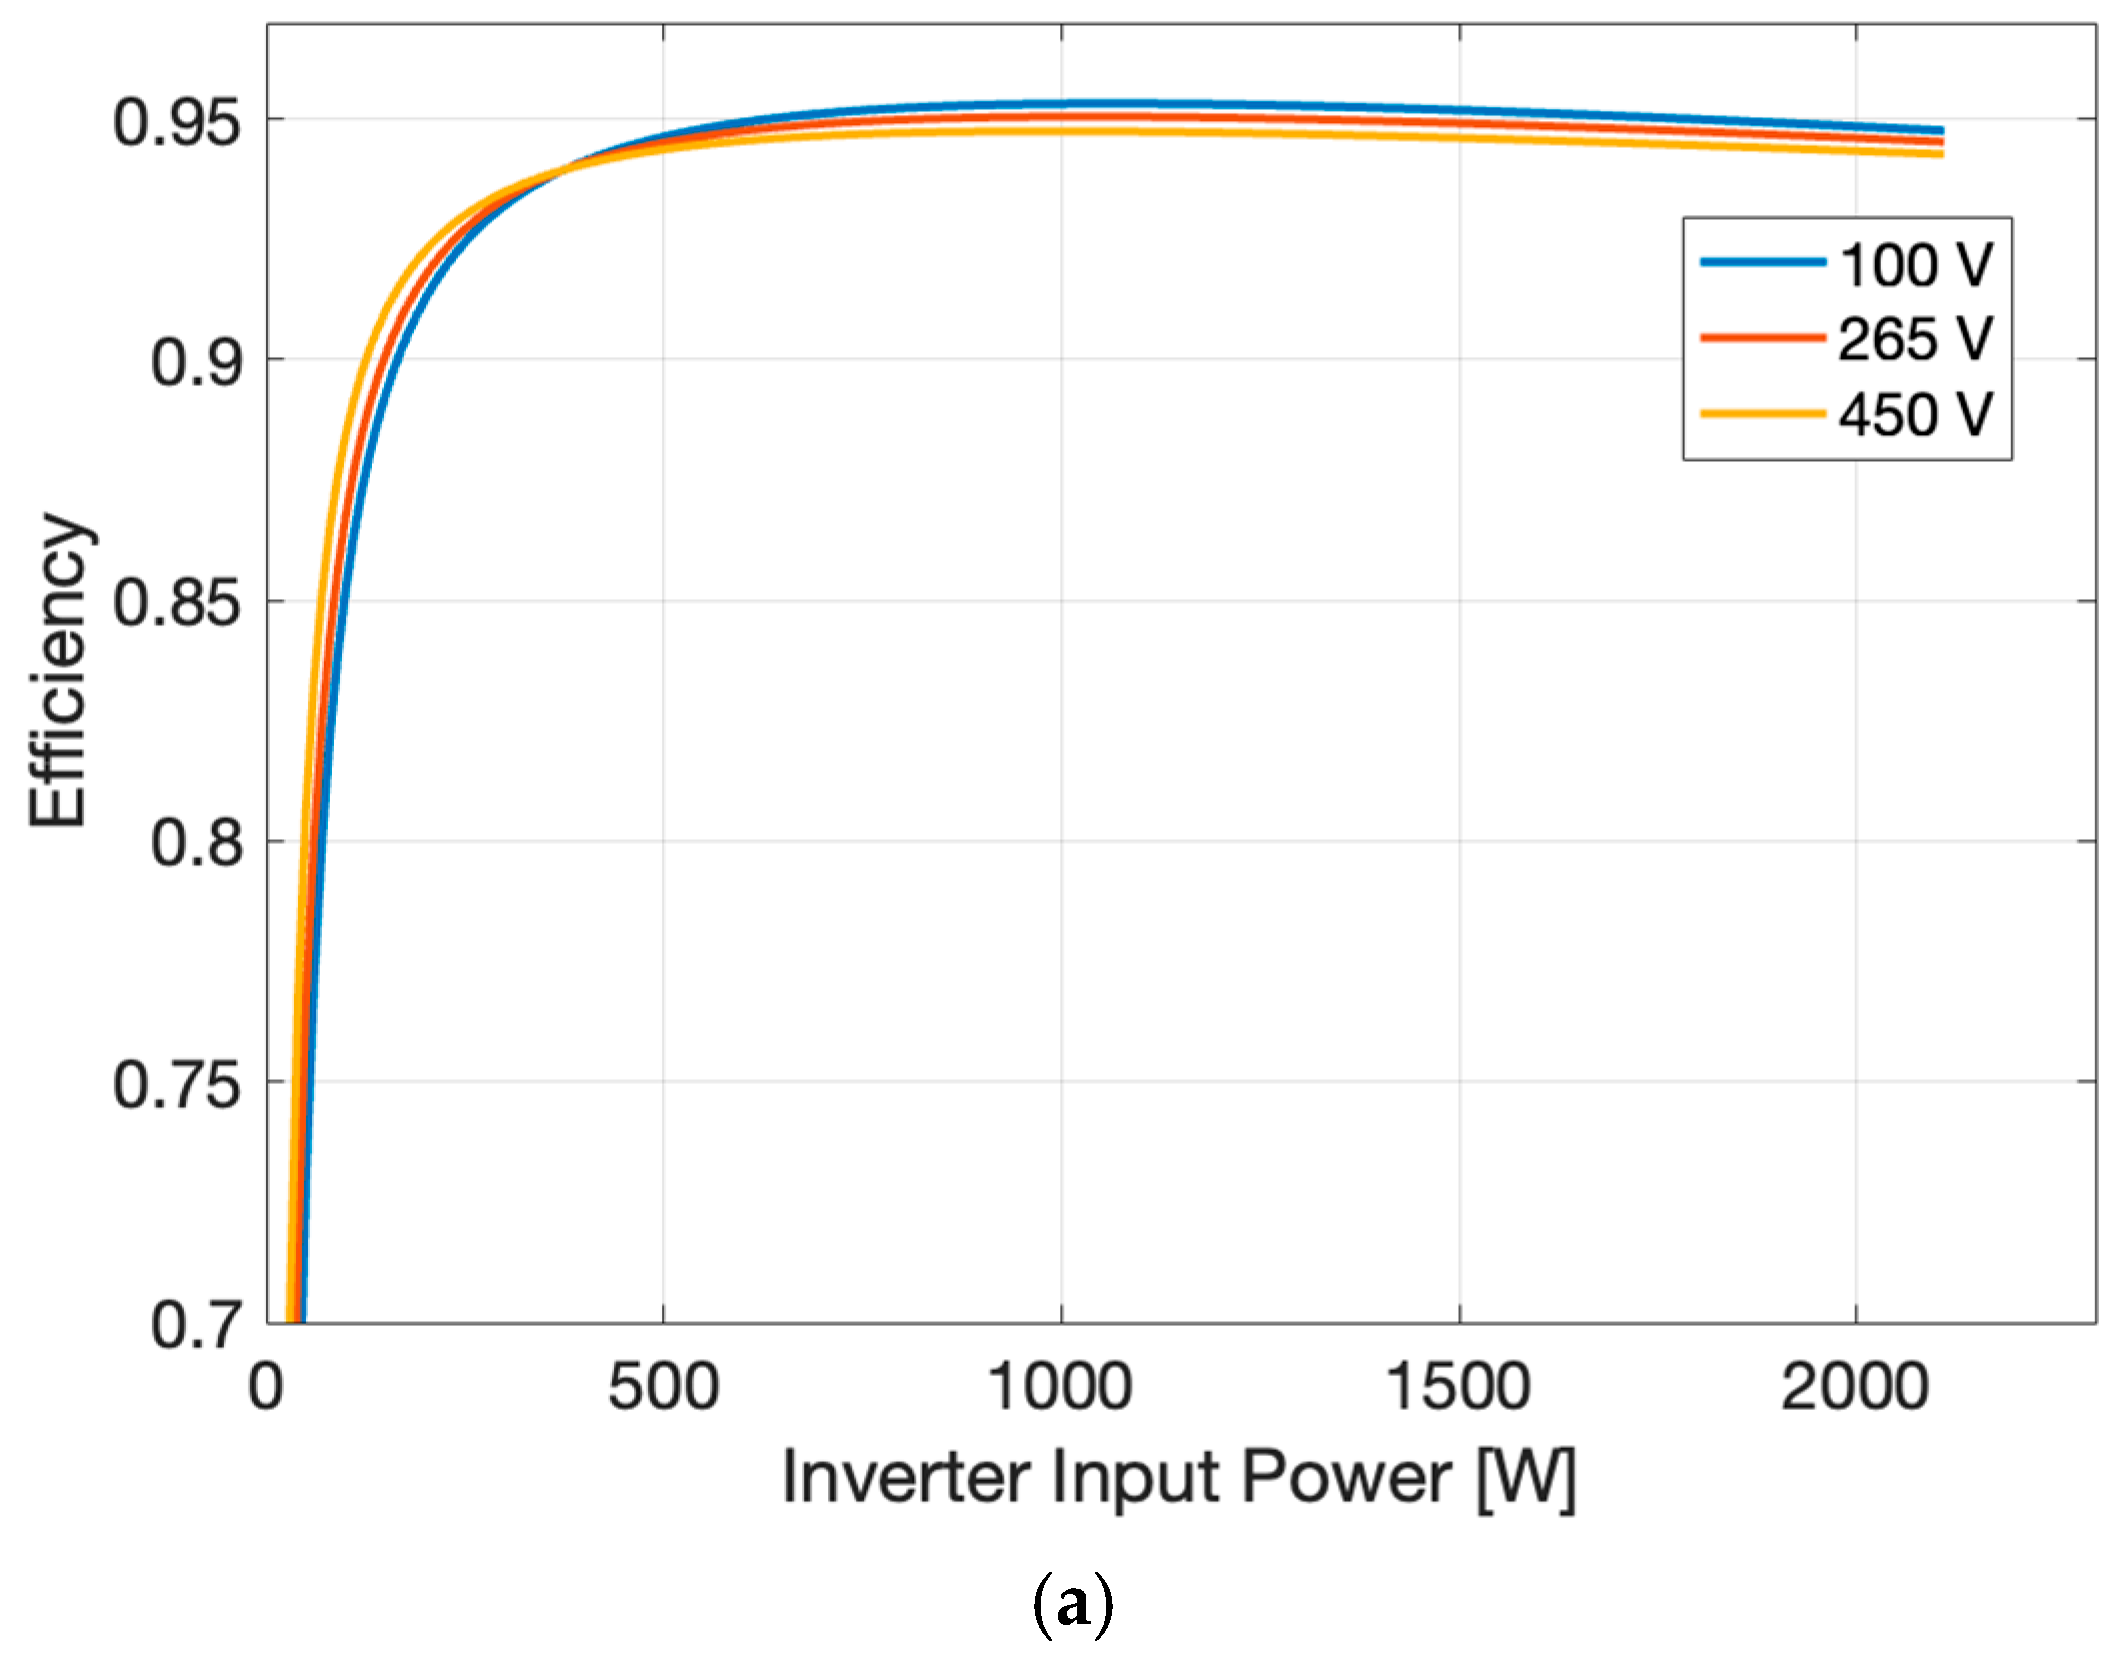
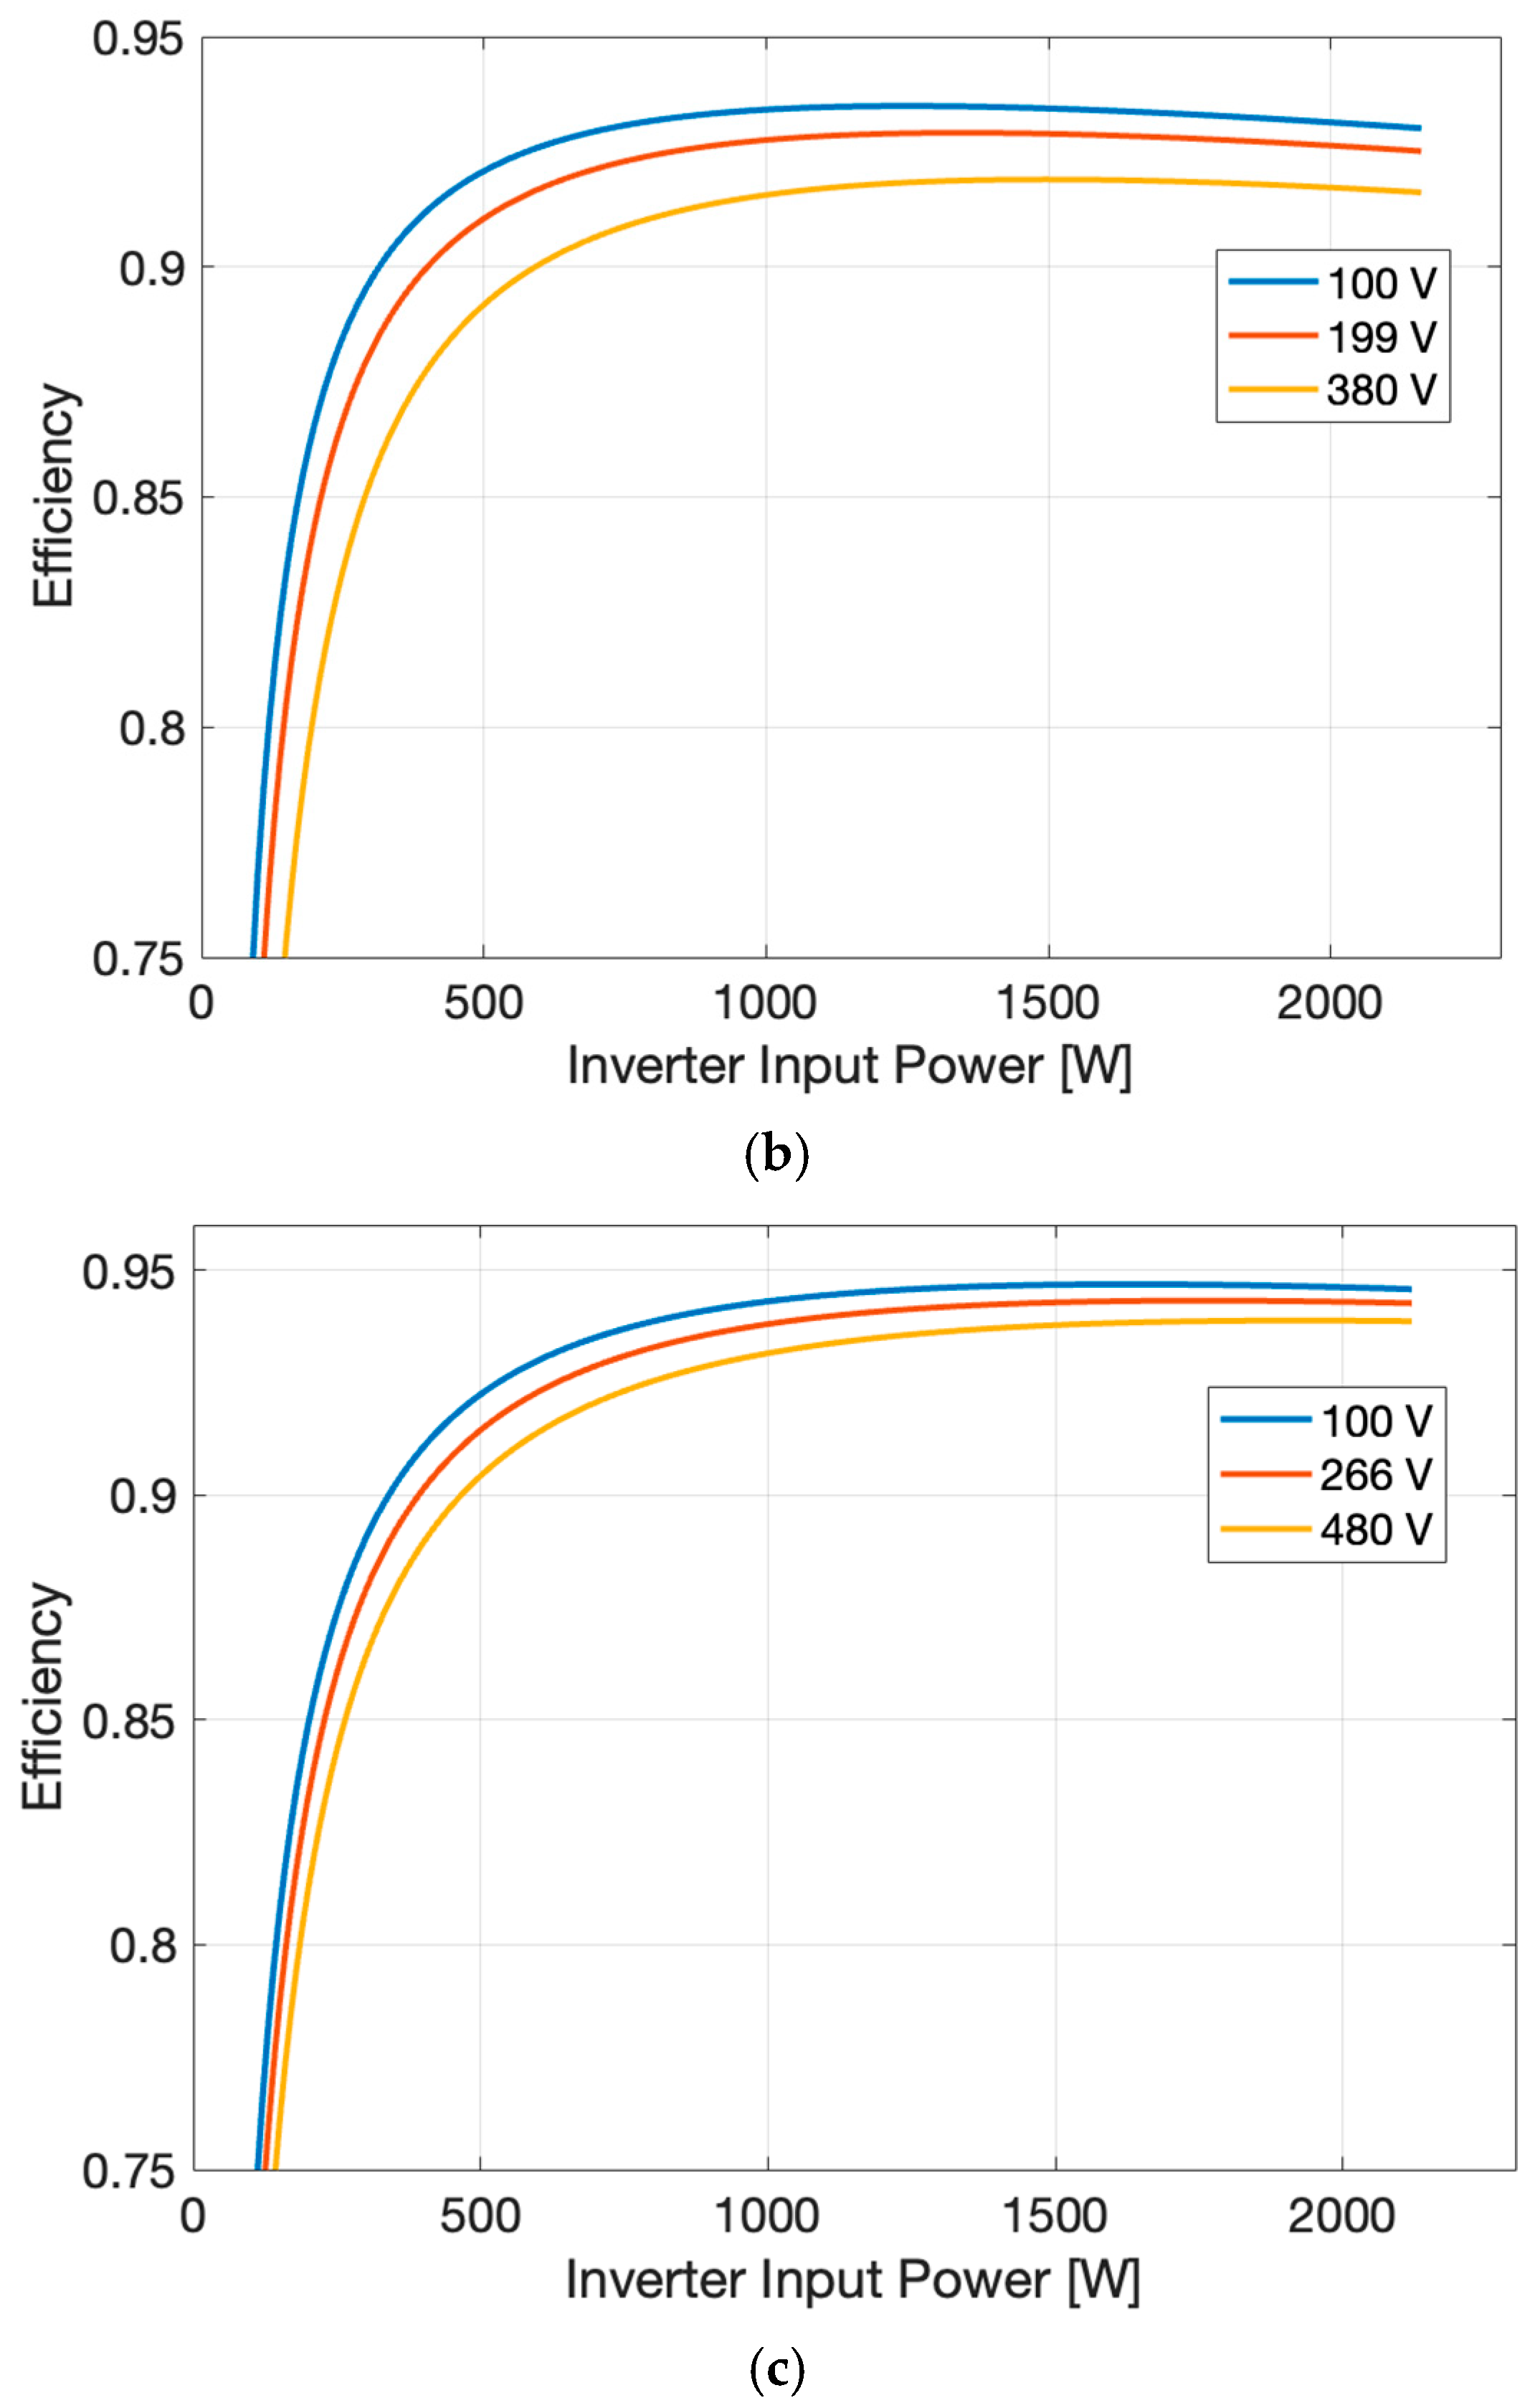
2. Inverter Efficiency Curve in Terms of Input Voltage and Input Power

The efficiency of PV inverters is one of the important aspects affecting the performance of PV systems. If the performance of the MPP trackers associated with operating the modules at the MPP is set aside, the combined efficiency of the DC/DC converter and DC/AC inverter is used in the PV catalogs (PS-M72-405, Philadelphia Solar, Jordan). At this point, the main factor affecting the efficiency of the inverter is the loading of the inverter, and many product catalogs give the efficiency curve in this respect. In the literature, there are also studies to mathematically model these curves with quadratic functions in order to use them for inverter-sizing problems [40,41]. However, the loading of the inverters is not the only parameter that affects efficiency; the input voltage has also recently started to be included in the catalogs. Especially in the scope of this study, the change in the number of bypass diodes under the effect of partial shading will cause the global MPP voltage to shift to different regions. Therefore, it is important to model the effect of input voltage on DC/AC efficiency. In the literature, there are some studies that relate the efficiency of inverters to both loading and input voltage. In [42,43], the mathematical models in the literature for DC/AC average efficiency in terms of both power and input voltage are summarized and tested under realistic irradiance conditions for several inverters in the market. One of the most comprehensive models developed in the literature in terms of the commercial inverters it covers is the model of Sandia National Laboratories [44]. The AC output power (Poutput) of an inverter can be calculated as
P o u t p u t = P A C o A i n v B i n v C i n v A i n v B i n v P i n p u t B i n v + C i n v P i n p u t B i n v 2
where Pinput is the DC input power of inverter, PACo is the maximum AC power at reference or nominal operating condition in W. Parameters of Ainv, Binv, and Cinv are the function of the input DC voltage (Vinput):
A i n v = P d c o 1 + C 1 V i n p u t V d c o
B i n v = P s o 1 + C 2 V i n p u t V d c o
C i n v = C o 1 + C 3 V i n p u t V d c o
where Pdco and Vdco represent DC power level [W] and DC input voltage level [V] at which the maximum AC power is achieved at the reference operating condition, respectively. Pso and Co are DC power required for self-consumption which determines the behavior of inverter at low power levels and parameter defining the curvature between AC and DC power at the reference operating condition in 1/W, respectively. C1, C2, and C3 are empirical coefficients in 1/V for the variations of Pdco, Pso, and Co with respect to the input voltage, respectively. By this way, DC/AC efficiency (ηinv) can be represented as
η i n v = f ( P i n p u t , V i n p u t )
In this context, based on the inverters available in the Sandia National Laboratory’s inventory, three different inverters with similar power capacities but distinct input voltage characteristics are assumed to be selected to represent a realistic range of commercially available inverter technologies. This selection allows for a comparative analysis of DC/AC efficiency behavior under varying input power and voltage levels, which is crucial for evaluating system performance under dynamic irradiance conditions. The parameters of these inverters are given in Table 1 and the efficiency curves are shown in Figure 1. As can be seen in the figure, the efficiency of inverter A does not change much depending on the input voltage, whereas the opposite is true for inverter B and inverter C. On the other hand, the region where inverter A operates at low efficiency at low powers is narrower, while for the other inverters the efficiency increases more slowly as the power increases. The difference between inverter B and inverter C is related to the fact that the efficiency decreases after a certain point as the power increases, which can be seen in the figure where the efficiency of inverter C does not decrease with increasing input power. Moreover, since the clipping is another factor affecting the efficiency, it is modeled in this study. The output power is limited at the inverter’s capacity when an input power is applied that exceeds the inverter’s capacity, such that
η i n v = f ( P i n p u t , V i n p u t ) i f   n o t   c l i p p e d P A C o P i n p u t i f   c l i p p e d
As seen in Table 1, the MPP operating voltage range of the inverters is also one of the important design parameters and affects efficiency. Considering that the global MPP voltage may shift towards the short circuit region, especially under partial shading conditions, the operation of the modules at local MPPs may affect efficiency. For this reason, this situation is also considered within the scope of modeling. If the string voltage is outside the MPP voltage range, the modules are allowed to operate at other local MPPs within the MPP voltage range.
One of the important design parameters considered in the design of PV systems is the inverter loading ratio (ILR) by changing the number of connected PV modules and it is defined as
I L R = P D C m a x P A C m a x
where P D C m a x is the peak DC power of the string at standard test conditions, while P A C m a x represents the rated output power of the inverter. In order to observe the effect of different ILRs on efficiency under partial shading, four different string configurations are considered for the above-mentioned inverters.

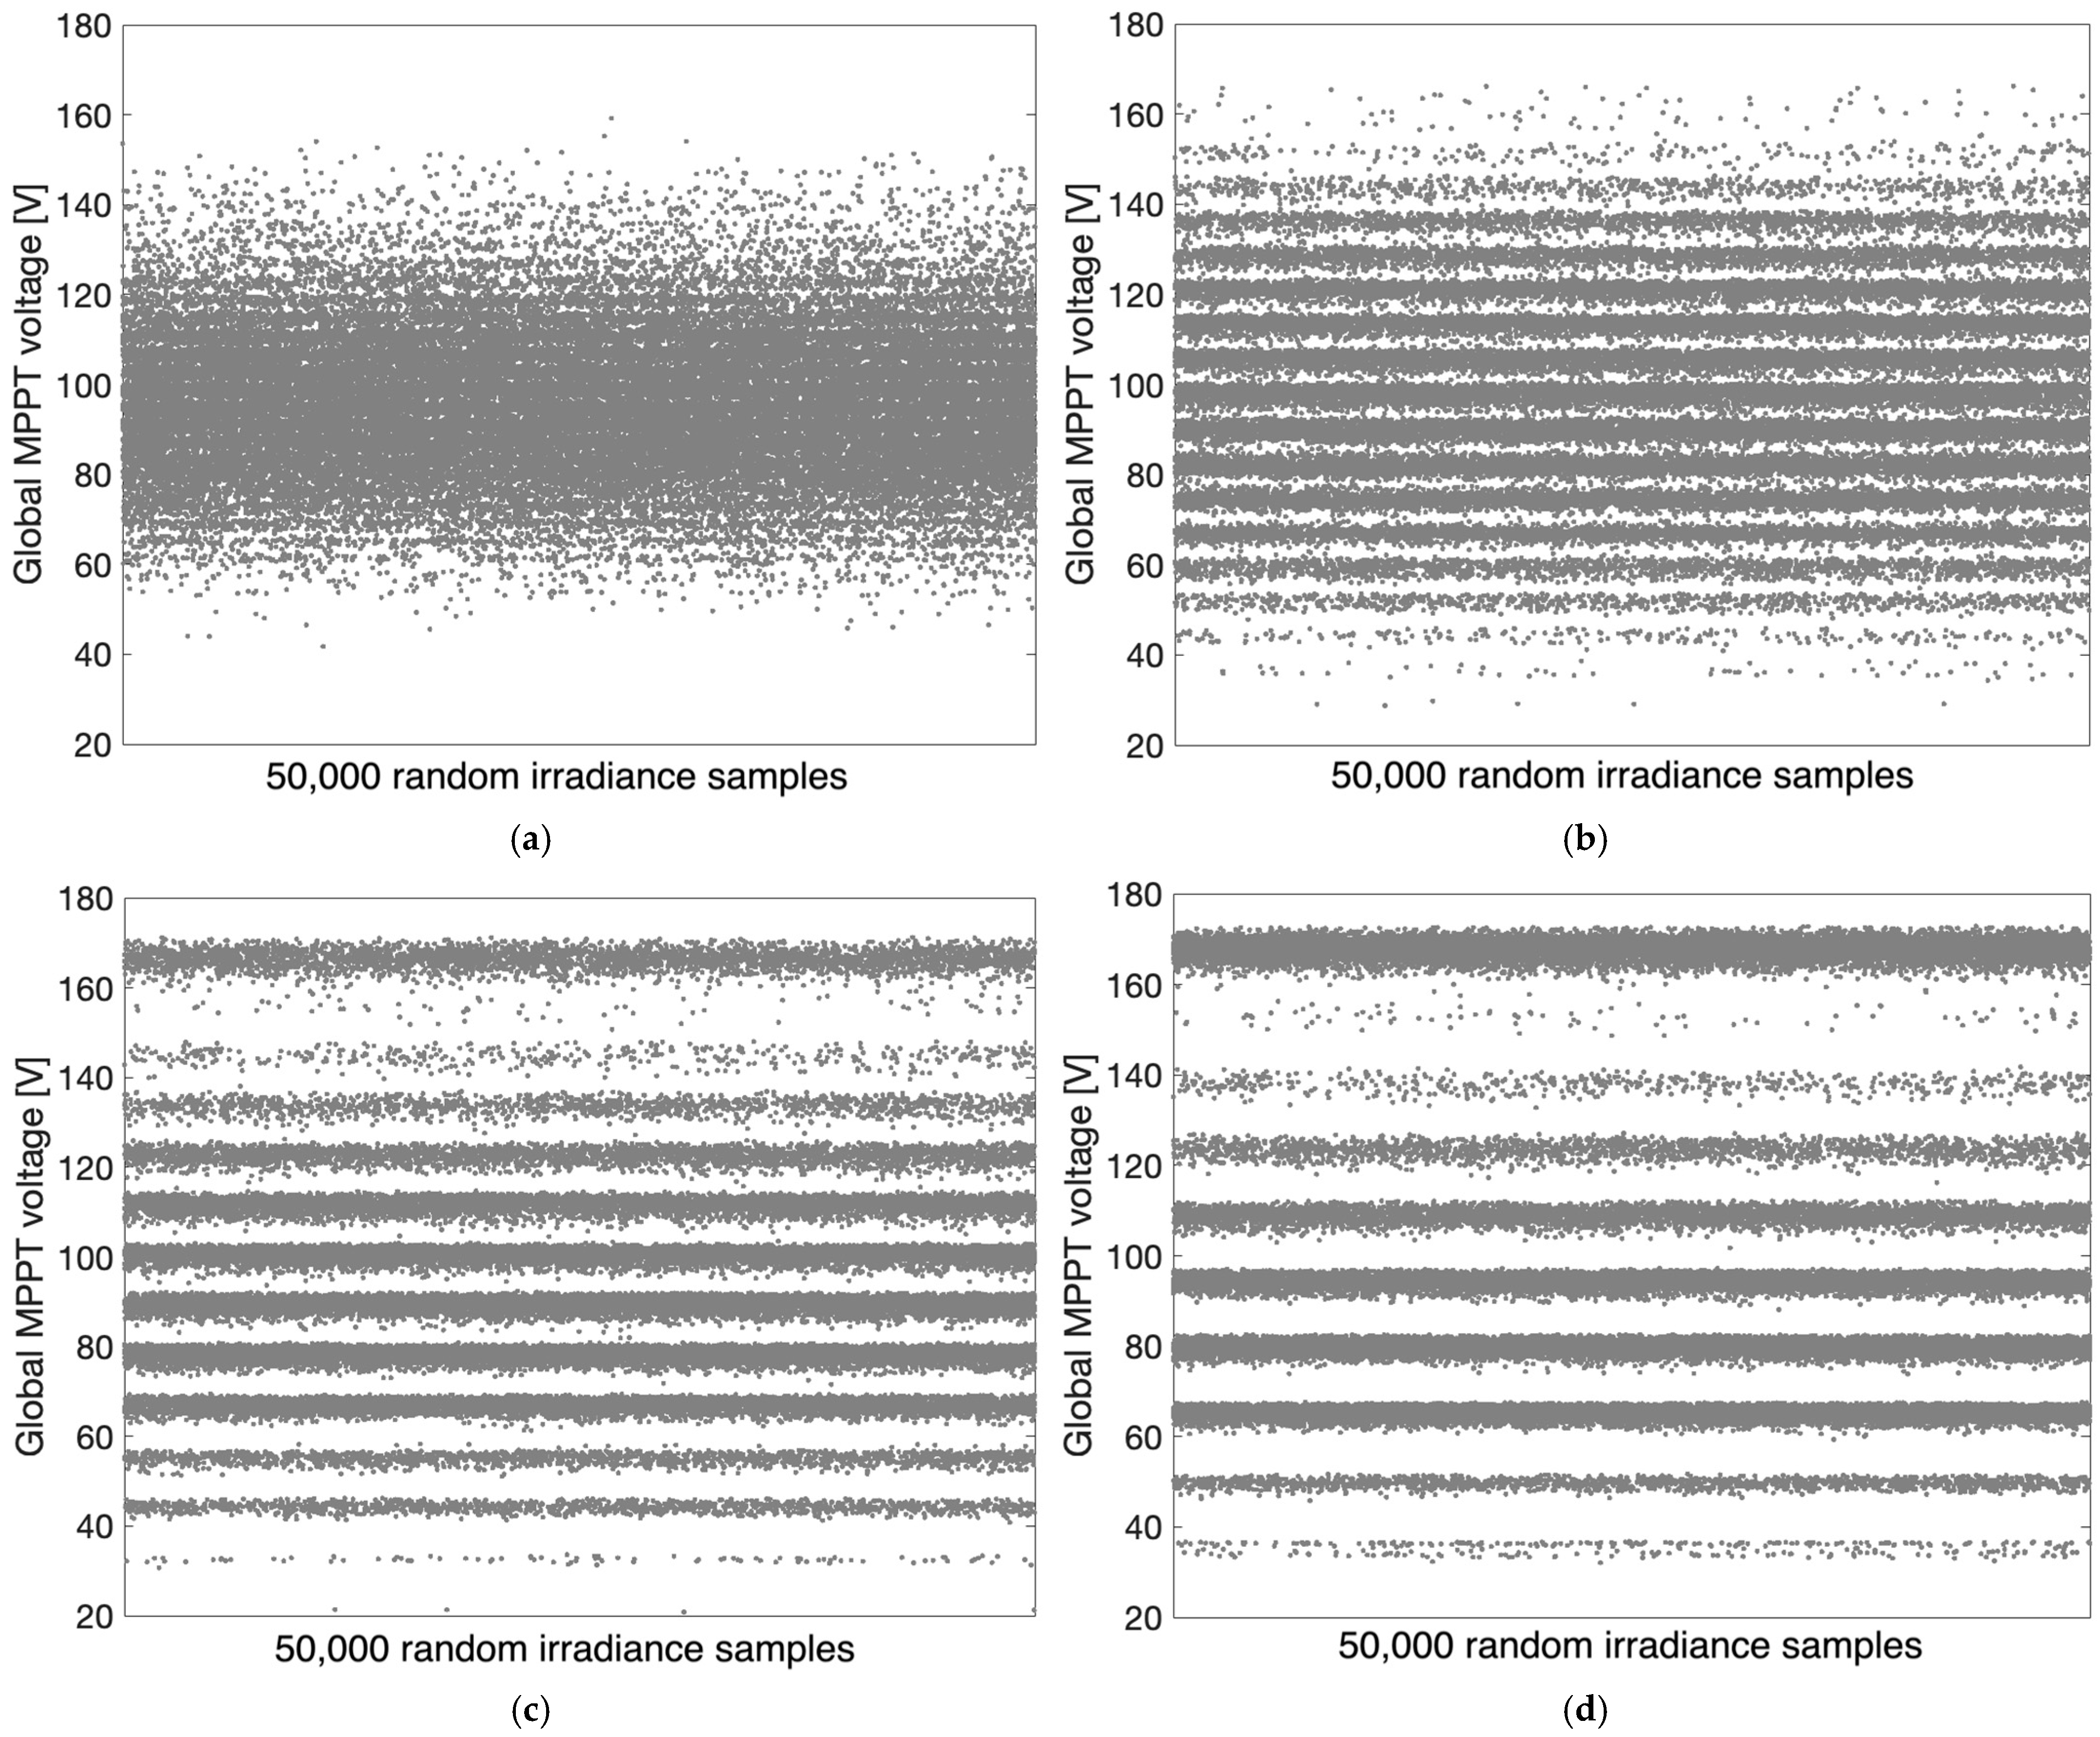
3. Global MPP Voltage and Power with Different Number of Bypass Diodes

In this study, the 72-cell PS-M72-405 PV module (Philadelphia Solar, Jordan) is used, and its characteristics are given in Table 2 [45]. This module consists of 72 cells and contains a total of 3 bypass diodes, one in 24 cells. In this study, 4, 5, 6, and 7 modules connected in a string are considered to determine its effect on the global MPP voltage and power. In order to observe how the number of bypass diodes affect the power and voltage of the string at the global MPP and thus the inverter efficiency, 4 bypass diode scenarios are considered, such that there are
  • Six cells per bypass diode.
  • Twelve cells per bypass diode.
  • Eighteen cells per bypass diode.
  • Twenty-four cells per bypass diode.
It can be said that increasing the number of bypass diodes in a PV module can indeed reduce the voltage drop under partial shading conditions, as a smaller number of shaded cells are subjected to the forward voltage drop of each diode [38]. However, this benefit may introduce certain drawbacks. Specifically, a higher number of diodes results in more frequent activation under shading scenarios, which may increase thermal stress due to sustained forward-biased operation. This stress may influence the long-term operation of the module and complicate maintenance due to an elevated likelihood of diode failure [46]. The extent of this issue depends heavily on the area and distribution of shading. While finer granularity in bypassing enables better power extraction under non-uniform irradiance—thereby potentially increasing the global voltage—this comes at the expense of increasing the potential failure of diodes. Thus, there exists a fundamental trade-off between maximizing energy yield and ensuring long-term module durability.
Here, it is assumed that the global MPP-tracking algorithm can find the global MPP [47] if the voltage corresponding to the global MPP of the string under the partial irradiance condition is within the MPPT operating voltage range of the inverter [48,49]. For this reason, P-V curves are obtained using a single-diode cell model in a MATLAB/Simulink Simscape (2024b) environment [45,50] to obtain the global MPPs of the PV string. This is carried out in order to evaluate the efficiency of the inverter by changing the bypass diode number using the flexibility of the Simscape language, allowing for the creation of custom components based on the standard blocks already provided [51]. Another advantage of Simscape is to allow for more natural modeling of physical systems and avoiding the well-known algebraic loop errors [52]. This model is also capable of representing mismatch-induced effects such as reverse-bias voltages among series-connected cells under nonuniform irradiance. To demonstrate this capability, cell-level simulation is performed where the current, voltage, and power profiles of all 72 cells in the PS-M72-405 module with three bypass diodes are analyzed under uniform and nonuniform irradiance conditions. Here, different irradiance levels are assigned to each group of 6 cells, resulting in 12 distinct irradiance regions across the 72 cell module. The corresponding irradiance for each cell is given in Figure 2. The results, shown in Figure 3, illustrate how local irradiance variations lead to electrical mismatch, and in some shaded cells, reverse-bias operation with negative power dissipation. The total output power is calculated as 383 W under the uniform irradiance case, 192 W in the ideal nonuniform case where each cell operates independently, and 108 W in the actual nonuniform case with series-connected cells. This significant drop in power output clearly illustrates the impact of mismatch effects and reverse-bias conduction, which are critical considerations when assessing the influence of bypass diode configurations and the effectiveness of MPPT algorithms.
Since the minimum number of cells connected to the bypass diode is 6, the same irradiance is sent to each of the 6 cells, which is randomized with 50,000 irradiance samples (Nsamples). Here, Simulink’s fast restart feature is utilized to speed up the simulation of a large number of irradiance samples. For this purpose, the configurability of the module temperature, which is included as a parameter in the modeling, is set to run time, so that once the model is compiled for each configuration, simulations for different irradiance and temperature conditions can be performed quickly. Three different cases are determined depending on the range of irradiances. The heavy partial shading case is modeled with irradiances between 100 and 1000 W/m2, the moderate partial shading case with 500–1000 W/m2, and the light partial shading case with 800–1000 W/m2.
Ambient temperature is one of the important issues affecting the string voltage, and three different ambient temperatures, 10   ° C , 25   ° C , and 40   ° C , are considered in this study. The cell temperature can be calculated based on irradiance and ambient temperature as follows [53]:
T c e l l = T a m b + N O C T 20 G 800
where T c e l l and T a m b are the cell and ambient temperatures, respectively. G represents the irradiance of the cell.
The global MPP voltages of four modules in series are given in Figure 4 for the heavy partial shading case at 25 °C ambient temperature. Using more bypass diodes causes the global MPP voltage to spread over a wider range due to partial shading, while decreasing the number of bypass diodes shifts the global MPP voltages into the open-circuit region. Moreover, it is clear that voltage bands are formed regardless of the number of bypass diodes used. However, the location and frequency of these bands appear to vary for each bypass diode condition. Although bands for other cases are not given due to space limitations, it is clear that the number of modules used, ambient temperature, and partial shading intensity will also change these bands. These bands can be considered as reference voltages for global MPP-tracking algorithms. Therefore, determining the probability and representative voltage and power values of each band is of great importance for efficiency analysis. In this way, the overall efficiency of the PV system can be calculated over 50,000 irradiance samples using the probabilities of those bands. For this purpose, lower and upper voltage limits of a band are determined and then its corresponding probability is calculated as
P r j b a n d = N j s a m p l e s N s a m p l e s ,   j = 1 ,   2 , ,   N b a n d
where P r j b a n d is the probability of the jth band and   N j s a m p l e s represents the number of samples within the jth band. N b a n d is the total number of the bands. The representative voltage V j b a n d and power P j b a n d of band j are calculated by averaging the voltage and power of the samples in that band, respectively:
V j b a n d = 1 N s a m p l e s i = 1 : N j s a m p l e s V i , j g m p p ,   j = 1 ,   2 , ,   N b a n d
P j b a n d = 1 N s a m p l e s i = 1 : N j s a m p l e s P i , j g m p p ,   j = 1 ,   2 , ,   N b a n d
where V i , j g m p p and P i , j g m p p are the global MPP voltage and power of samples within band j, respectively. Taking into account the effect of the bands, the average efficiency of an inverter ( η i n v a v e ) under partial shading conditions can be calculated as follows:
η i n v a v e = j = 1 : N b a n d η i n v P j b a n d , V j b a n d   ×   P r j b a n d
The probability, representative voltage, and power of the bands are given for the heavily and moderately shaded cases in Table 3, Table 4, Table 5 and Table 6 where a bypass diode is connected to 6, 12, 18, and 24 cells, respectively. The tables clearly show that the heavily shaded condition has the highest number of bands in all conditions. It can be seen in Table 3 that the number of bands reaches 24 when 7 modules are connected in series and the ambient temperature is 10 °C. It can be said that this issue will be important especially in roof, building, and terrain conditions, where partial shading is severe, and will affect the input voltage of the inverters.
It is understood from Table 3, Table 4, Table 5 and Table 6 that as the number of bypass diodes decreases, the number of bands decreases, and the locations of the bands change accordingly. With this change, it is seen that the bands are concentrated at certain voltages, some bands disappear, and new bands are formed closer to the open-circuit voltage. This shows that the voltage and power, which are important for the efficiency of the inverters, are affected by the number of bypass diodes. On the other hand, the ambient temperature also affects the voltage and power of the bands, although it does not significantly affect the number of bands. As expected, it can be observed that both power and operating voltage decrease with increasing ambient temperature. For the heavily shaded case, decreasing the number of modules in the string also decreases the number of bands, as can be seen from Table 3, Table 4, Table 5 and Table 6. This indicates that global MPP-tracking algorithms need to scan more bands as the number of modules increases.
When the results for the moderately shaded case are analyzed, it can be observed that the number of bands drops dramatically. Here, it can be said that a dominant band is formed at the point closest to the open-circuit voltage and the probability of this band is greater than 0.8 when one bypass diode is connected in 6 cells. The probability of this dominant band increases with both the increase in the ambient temperature and the increase in the number of modules. Table 4, Table 5 and Table 6 shows that when the number of bypass diodes decreases to six, the number of bands decreases to two, and if the bypass diode number decreases further, it decreases to one. Here, it is clearly seen that the number of bypass diodes has no effect on the band voltage and power when the number of bands is reduced to one. Therefore, although the decrease in the number of bypass diodes causes a decrease in the global MPP power, it will have a great effect on the efficiency by enabling the modules to operate at high voltages.
The voltage bands for the lightly shaded case are given separately in Table 7, since the bands remain the same as the number of bypass diodes changes. It can be said that the global MPP powers of the bands remain below 2000 W for almost all cases and only exceed 2000 W for the lightly shaded case, thus causing clipping. Based on all these observations, it can be said that the bands will affect the average efficiency of the inverters, so it is important to analyze how the inverters will perform with the help of these bands.

4. Results and Discussion

In this section, the roles of bypass diode configuration and inverter efficiency characteristics are examined using average efficiency under partial shading conditions defined in Section 3. The evaluation framework is illustrated in Figure 5, where the 72 cell PV module is segmented according to the defined bypass diode configurations. The number of bypass diodes is set to 3, 4, 6, and 12, which correspond to 24, 18, 12, and 6 cells per diode, respectively, and irradiance variations are applied to the module accordingly. The resulting global MPP voltage and power values are grouped into discrete bands based on the voltage bands, which are then mapped to the inverter efficiency curves. This band-based approach enables quantifying the combined impact of bypass diode number and inverter operating characteristics on the total output power under varying shading conditions. Here, it should be emphasized that the ILR value is obtained as 0.81, 1.01, 1.22, and 1.41 for a 2000 W inverter by changing the number of series modules to 4, 5, 6, and 7, respectively. In this way, both the oversizing and undersizing of the inverters are considered to see the effects of the inverter sizing. The average efficiencies of each inverter under different partial shading intensities, different ambient temperatures, different number of modules, and bypass diode configurations are calculated by (6) and given in Figure 6, Figure 7, and Figure 8 for inverter A, inverter B, and inverter C, respectively.
As seen in Figure 6 for inverter A, the use of more bypass diodes in the lightly shaded case increases the overall efficiency as it creates high power bands. However, in moderately and lightly shaded irradiance conditions, it can be seen that the efficiency has similar values since there is no significant change in the number and location of the bands depending on the number of bypass diodes. Moreover, since the input voltage-dependent efficiency difference is small in inverter A, the change in the average efficiency according to the bypass diode connection conditions is relatively limited. When the change in efficiency depending on temperature is examined, the average efficiency generally decreases with increasing temperature, as expected in the case of heavily shaded conditions. However, in the case of light and moderate partial shading, the overall efficiency is observed to increase, although the decrease in module power and voltage with increasing temperature causes the inverter to operate in more efficient regions. Therefore, it can be said that although the increase in temperature is known as a condition that reduces the efficiency of the modules, it may cause the inverter to operate in more efficient regions in partial shading conditions. In terms of ILR, if 4 or 5 modules are connected to the inverter, as expected, there is no efficiency reduction due to clipping. In the case of six modules, although the ILR is 1.22, the power of the bands remains within the limits of the inverter capacity due to partial shading, so there is no clipping. When seven modules are connected in series, it is observed that the efficiency is lower due to clipping, as the band voltages and powers are higher at low ambient temperatures.
Inverter B’ s average efficiency is generally lower than that of inverter A due to its low efficiency at low power levels and the fact that its efficiency varies more depending on the voltage. Although similar trends are observed in Figure 7, it is seen that the decrease in inverter efficiency with the decrease in the number of bypass diodes for the heavily shaded case is higher than that of inverter A. In the moderately shaded case, although lower efficiencies are obtained compared to inverter A, a higher average efficiency is obtained at 40 °C because the voltage and power of the bands coincide with the more efficient regions of the efficiency curve. Depending on the number of modules, it can be observed that clipping still occurs under low shading intensity when seven modules are connected, but the changes due to temperature are different than in inverter A. Here, it is seen that the average efficiency drops drastically at low temperatures and is closer to each other at 25 °C and 40 °C.
Finally, it can be said that the average efficiency of inverter C is overall better than inverter B and worse than inverter A. It is also valid for this inverter that the variation in the average efficiency depending on the number of bypass diodes can be observed under heavily partial shading. Here, it is evident that inverter C is the inverter with the highest decrease in average efficiency when the number of bypass diodes is changed from 12 to 3. Moreover, in moderately shaded conditions, while it is observed that the efficiency increases as the ambient temperature increases in other inverters, this increase does not occur in inverter C, and even the efficiency decreased in the case of four module connections. In the lightly shaded conditions, it is concluded that the efficiency changes less than the other inverters depending on the temperature in the case of 4, 5, and 6 module connections. Therefore, it can be said that the efficiency characteristics of the inverters and the climatic conditions of the region, as well as the partial shading intensity of the string and the number of bypass diodes used in the module, greatly affect the average efficiency of PV system. It can be said that the use of a high number of bypass diodes will be more advantageous in terms of system efficiency, especially in areas where partial shading is intensely experienced.
Table 8 summarizes the inverter efficiency differences for the 6-, 12-, and 18-cell-per-bypass-diode configurations, using the 24-cell-per-bypass-diode setup as the reference. The values represent average, minimum, and maximum differences across all combinations of temperature, partial shading levels, and number of series-connected PV modules. The results reveal a consistent trend: as the number of cells per bypass diode decreases, the average inverter efficiency improves. The 6 cell configuration shows the highest performance gain, with inverter C reaching an average improvement of 1.11% and a maximum of 3.89%. The 12 cell configuration provides a moderate gain, while the 18 cell configuration exhibits marginal improvements, with some negative minimum values indicating performance degradation under certain scenarios. Among the three inverters, inverter C demonstrates the highest sensitivity to diode configuration, achieving both the highest mean and peak improvements. This suggests that its efficiency profile better accommodates voltage shifts caused by bypass activity. Overall, the results emphasize the importance of jointly considering bypass diode configuration and inverter voltage characteristics when designing PV systems operating under non-uniform irradiance conditions.
The results of this study underscore the significance of both bypass diode configuration and inverter efficiency characteristics in determining PV system performance under partial shading conditions. While previous research has predominantly focused on inverter sizing and energy yield under uniform irradiance profiles [13,14,15,16,17,18], this study contributes a more comprehensive analysis by incorporating probabilistic non-uniform irradiance variations and a detailed modeling of bypass diode effects. Increasing the number of bypass diodes not only mitigates power losses due to shading but also alters the location of the global MPP voltage, which may fall within more favorable operating regions of the inverter’s efficiency curve. This shift, however, is critically dependent on the inverter’s ability to maintain high efficiency across a wide input voltage range. For example, inverter A exhibited relatively stable efficiency due to its flat voltage-response characteristic, whereas inverter B experienced substantial performance degradation at suboptimal voltages. These findings affirm that the input voltage of the inverter plays an important role in determining overall system efficiency under shaded conditions. There exists a wide variety of products, ranging from transformerless microinverters to high-voltage central inverters [54], and each has different efficiency curve characteristics [44]. Moreover, most commercially available PV modules are still produced with three bypass diodes per 60 or 72 cells due to cost and design simplicity [55]. Even without further increasing the number of bypass diodes, the location of the global MPPs under non-uniform irradiance conditions can significantly influence the overall system performance, particularly due to the sensitive inverter efficiency curves to input voltage. In an environment where the global installed PV capacity reached 1.6 TW in 2023 [56], it is evident that even marginal improvements in efficiency may lead to substantial global impacts, highlighting the importance of achieving an optimal system design considering the inverter efficiency and nonuniform irradiance conditions. The results confirm that, for a conventional module with three bypass diodes, the average system efficiency is influenced by several factors, including cell temperature, the number of series-connected modules, shading intensity, and the inverter’s efficiency characteristics. Increasing the number of bypass diodes has also been addressed in the literature as an alternative to prevent hotspot formation and to improve performance under non-uniform irradiance conditions [46]. In this context, it has been demonstrated that such configurations can further shift the location of the global MPP voltage, particularly under conditions of severe partial shading. Taken together, these findings suggest that non-conventional bypass diode configurations should be considered, particularly in PV installations prone to partial shading such as rooftops or complex urban environments. Furthermore, inverter selection should be based on detailed voltage-dependent efficiency profiles rather than simplified benchmark values.

5. Conclusions

This study examines the performance of PV systems under partial shading conditions, with particular emphasis on the influence of bypass diode configurations and the characteristic efficiency curves of inverters. A Simscape/Simulink-based circuit model has been employed to determine the global MPPs under heavily, moderately, and lightly shaded conditions by systematically varying both the number of PV modules and bypass diodes. The results indicate that different numbers and probabilities of voltage bands emerge depending on the number of bypass diodes, leading to significant variations in the global MPP voltage and power within a broad range. The voltage and power values of the identified global MPPs are integrated into the model as the input voltage and power for inverters with different efficiency characteristics, enabling a comparative analysis of PV system performance under diverse irradiance conditions.
Since an increased number of bypass diodes allows the system to operate over a wider voltage window, it becomes evident that inverter efficiency curves should consider not only input power but also voltage as a critical parameter. While adjusting the number of bypass diodes appears to be a practical approach to improving system performance under partial shading conditions, this adjustment also alters the range in which the global MPP fluctuates. Therefore, for a more precise long-term performance assessment, inverter efficiency curves must be taken into account—an aspect of growing importance as installed PV capacity continues to rise rapidly. In this context, it is crucial to ensure that the expanded global MPP range, in terms of both power and voltage, aligns with the efficiency capabilities of the inverter when increasing the number of bypass diodes to enhance the efficiency of PV systems. These insights are particularly relevant in the broader context of adapting renewable energy systems to the growing demand for sustainable electricity production.
Finally, the study highlights how the possibility of refining bypass diode configurations and employing context-aware inverter pairing can significantly influence energy yield under partial shading. These insights can assist system designers in optimizing PV system layouts that are tailored to the specific operating context of the PV system.

Funding

This research did not receive any specific grant from funding agencies in the public, commercial, or not-for-profit sectors.

Institutional Review Board Statement

Not applicable.

Informed Consent Statement

Not applicable.

Data Availability Statement

Data is contained within the article.

Conflicts of Interest

The author declares that they have no known competing financial interests or personal relationships that could have appeared to influence the work reported in this paper.

References

  1. IEA. Clean Energy Market Monitor 2024. Available online: https://www.iea.org/reports/clean-energy-market-monitor-march-2024 (accessed on 12 April 2025).
  2. Hwang, I. Application of photovoltaic systems for rural electrification at remote islands. Sol. Energy Mater. Sol. Cells 1997, 47, 295–302. [Google Scholar] [CrossRef]
  3. Razmjoo, A.; Ghazanfari, A.; Østergaard, P.A.; Abedi, S. Design and analysis of grid-connected solar photovoltaic systems for sustainable development of remote areas. Energies 2023, 16, 3181. [Google Scholar] [CrossRef]
  4. Rana, M.M.; Uddin, M.; Sarkar, M.R.; Shafiullah, G.M.; Mo, H.; Atef, M. A review on hybrid photovoltaic–battery energy storage system: Current status, challenges, and future directions. J. Energy Storage 2022, 51, 104597. [Google Scholar] [CrossRef]
  5. Sinha, S.; Chandel, S.S. Review of recent trends in optimization techniques for solar photovoltaic–wind based hybrid energy systems. Renew. Sustain. Energy Rev. 2015, 50, 755–769. [Google Scholar] [CrossRef]
  6. Chen, S.; Li, P.; Brady, D.; Lehman, B. Determining the optimum grid-connected photovoltaic inverter size. Sol. Energy 2013, 87, 96–116. [Google Scholar] [CrossRef]
  7. Aribia, H.B.; El-Rifaie, A.M.; Tolba, M.A.; Shaheen, A.; Moustafa, G.; Elsayed, F.; Elshahed, M. Growth optimizer for parameter identification of solar photovoltaic cells and modules. Sustainability 2023, 15, 7896. [Google Scholar] [CrossRef]
  8. Peippo, K.; Lund, P.D. Optimal sizing of solar array and inverter in grid-connected photovoltaic systems. Sol. Energy Mater. Sol. Cells 1994, 32, 95–114. [Google Scholar] [CrossRef]
  9. Rodrigo, P.M.; Velázquez, R.; Fernández, E.F. DC/AC conversion efficiency of grid-connected photovoltaic inverters in central Mexico. Sol. Energy 2016, 139, 650–665. [Google Scholar] [CrossRef]
  10. Vaicys, J.; Norkevicius, P.; Baronas, A.; Gudzius, S.; Jonaitis, A.; Peftitsis, D. Efficiency evaluation of the dual system power inverter for on-grid photovoltaic system. Energies 2022, 15, 161. [Google Scholar] [CrossRef]
  11. Munoz, J.; Martinez-Moreno, F.; Lorenzo, E. On-site characterisation and energy efficiency of grid-connected PV inverters. Prog. Photovolt. Res. Appl. 2011, 19, 192–201. [Google Scholar] [CrossRef]
  12. Krauter, S.; Bendfeld, J. Efficiency ranking of photovoltaic microinverters and energy yield estimations for photovoltaic balcony power plants. Energies 2024, 17, 5551. [Google Scholar] [CrossRef]
  13. Fernandes, P.; Reis, A.; Velasco, L.N.; Francisco, T.M.; Resende, E.C.; Freitas, L.C.G. Evaluation of a grid-connected photovoltaic system at the university of Brasília based on Brazilian Standard for performance monitoring and analysis. Sustainability 2024, 16, 11212. [Google Scholar] [CrossRef]
  14. Ketjoy, N.; Chamsa-ard, W.; Mensin, P. Analysis of factors affecting efficiency of inverters: Case study grid-connected PV systems in lower northern region of Thailand. Energy Rep. 2021, 7, 3857–3868. [Google Scholar] [CrossRef]
  15. Notton, G.; Lazarov, V.; Stoyanov, L. Optimal sizing of a grid-connected PV system for various PV module technologies and inclinations, inverter efficiency characteristics and locations. Renew. Energy 2010, 35, 541–554. [Google Scholar] [CrossRef]
  16. Sarniak, M.T. Researches of the impact of the nominal power ratio and environmental conditions on the efficiency of the photovoltaic system: A case study for Poland in Central Europe. Sustainability 2020, 12, 6162. [Google Scholar] [CrossRef]
  17. Mondol, J.D.; Yohanisa, Y.G.; Norton, B. Optimal sizing of array and inverter for grid-connected photovoltaic systems. Sol. Energy 2006, 80, 1517–1539. [Google Scholar] [CrossRef]
  18. Wang, H.X.; Munoz-García, M.A.; Moreda, G.P.; Alonso-García, M.C. Optimum inverter sizing of grid-connected photovoltaic systems based on energetic and economic considerations. Renew. Energy 2018, 118, 709–717. [Google Scholar] [CrossRef]
  19. Burger, B.; Rüther, R. Inverter sizing of grid-connected photovoltaic systems in the light of local solar resource distribution characteristics and temperature. Sol. Energy 2006, 80, 32–45. [Google Scholar] [CrossRef]
  20. Väisänen, J.; Kosonen, A.; Ahola, J.; Sallinen, T.; Hannula, T. Optimal sizing ratio of a solar PV inverter for minimizing the levelized cost of electricity in Finnish irradiation conditions. Sol. Energy 2019, 185, 350–362. [Google Scholar] [CrossRef]
  21. Deschamps, E.M.; Rüther, R. Optimization of inverter loading ratio for grid-connected photovoltaic systems. Sol. Energy 2019, 179, 106–118. [Google Scholar] [CrossRef]
  22. Balfour, J.; Hill, R.; Walker, A.; Robinson, G.; Gunda, T.; Desai, J. Masking of photovoltaic system performance problems by inverter clipping and other design and operational practices. Renew. Sustain. Energy Rev. 2021, 145, 111067. [Google Scholar] [CrossRef]
  23. Good, J.; Johnson, J.X. Impact of inverter loading ratio on solar photovoltaic system performance. Appl. Energy 2016, 177, 475–486. [Google Scholar] [CrossRef]
  24. Fairbrother, A.; Quest, H.; Özkalay, E.; Wälchli, P.; Friesen, G.; Ballif, C.; Virtuani, A. Long-term performance and shade detection in building integrated photovoltaic systems. Sol. RRL 2022, 6, 2100583. [Google Scholar] [CrossRef]
  25. Kaushika, N.D.; Mishra, A.; Rai, A.K. Solar Photovoltaics Technology, System Design, Reliability and Viability; Springer: New Delhi, India, 2018. [Google Scholar]
  26. Strache, S.; Wunderlich, R.; Heinen, S. A comprehensive, quantitative comparison of inverter architectures for various PV systems, PV cells, and irradiance profiles. IEEE Trans. Sustain. Energy 2014, 5, 813–822. [Google Scholar] [CrossRef]
  27. Matter, K.; El-Khozondar, H.J.; El-Khozondar, R.J.; Suntio, T. Matlab/Simulink modeling to study the effect of partially shaded condition on photovoltaic array’s maximum power point. Int. Res. J. Eng. Technol. 2015, 2, 697–703. [Google Scholar]
  28. El-Khozondar, H.J.; El-Khozondar, R.J.; Matter, K. Parameters influence on MPP value of the photovoltaic cell. Energy Procedia 2015, 74, 1142–1149. [Google Scholar] [CrossRef]
  29. Reyes-Suárez, L.I.; Guerrero-Ramírez, G.V.; Mares-Gardea, A.E.; Cervantes-Bobadilla, M.; Adam-Medina, M.; García-Morales, J. Solar energy harvesting under partial shading conditions through a reconfiguration strategy using a multi-port DC–DC converter. J. Braz. Soc. Mech. Sci. Eng. 2024, 46, 495. [Google Scholar] [CrossRef]
  30. Kotti, R.; Shireen, W. Efficient MPPT control for PV systems adaptive to fast changing irradiation and partial shading conditions. Sol. Energy 2015, 114, 397–407. [Google Scholar] [CrossRef]
  31. Craciunescu, D.; Fara, L. Investigation of the partial shading effect of photovoltaic panels and optimization of their performance based on high-efficiency FLC algorithm. Energies 2023, 16, 1169. [Google Scholar] [CrossRef]
  32. International Energy Agency Photovoltaics Power System Programme, Task 13. Performance of Partially Shaded PV Generators Operated by Optimized Power Electronics; Report IEA-PVPS T13-27:2024. 2024. Available online: https://iea-pvps.org/wp-content/uploads/2024/11/IEA-PVPS-T13-27-2024.pdf (accessed on 10 May 2025).
  33. Silvestre, S.; Boronat, A.; Chouder, A. Study of bypass diodes configuration on PV modules. Appl. Energy 2009, 86, 1632–1640. [Google Scholar] [CrossRef]
  34. Yadav, A.S.; Mukherjee, V. Comprehensive investigation of various bypass diode associations for killer-SuDoKu PV array under several shading conditions. Energy 2022, 239, 122014. [Google Scholar] [CrossRef]
  35. Daliento, S.; Di Napoli, F.; Guerriero, P.; d’Alessandro, V. A modified bypass circuit for improved hot spot reliability of solar panels subject to partial shading. Sol. Energy 2016, 134, 211–218. [Google Scholar] [CrossRef]
  36. Bauwens, P.; Doutreloigne, J. NMOS-based integrated modular bypass for use in solar systems (NIMBUS): Intelligent bypass for reducing partial shading power loss in solar panel applications. Energies 2016, 9, 450. [Google Scholar] [CrossRef]
  37. Zheng, H.; Li, S.; Challoo, R.; Proano, J. Shading and bypass diode impacts to energy extraction of PV arrays under different converter configurations. Renew. Energy 2014, 68, 58–66. [Google Scholar] [CrossRef]
  38. Fauzan, L.; Sim, Y.H.; Yun, M.J.; Choi, H.; Lee, D.Y.; Cha, S.I. Power from shaded photovoltaic modules through bypass-diode-assisted small-area high-voltage structures. Renew. Sustain. Energy Rev. 2025, 208, 115047. [Google Scholar] [CrossRef]
  39. Azad, M.A.; Tariq, M.; Sarwar, A.; Sajid, I.; Ahmad, S.; Bakhsh, F.I.; Sayed, A.E. A particle swarm optimization–adaptive weighted delay velocity-based fast-converging maximum power point tracking algorithm for solar PV generation system. Sustainability 2023, 15, 15335. [Google Scholar] [CrossRef]
  40. Demoulias, C. A new simple analytical method for calculating the optimum inverter size in grid-connected PV plants. Electr. Power Syst. Res. 2010, 80, 1197–1204. [Google Scholar] [CrossRef]
  41. Chouder, A.; Silvestre, S.; Sadaoui, N.; Rahmani, L. Modeling and simulation of a grid connected PV system based on the evaluation of main PV module parameters. Simul. Model. Pract. Theory 2012, 20, 46–58. [Google Scholar] [CrossRef]
  42. Scarabelot, L.T.; Rambo, C.R.; Rampinelli, G.A. A relative power-based adaptive hybrid model for DC/AC average inverter efficiency of photovoltaics systems. Renew. Sustain. Energy Rev. 2018, 92, 470–477. [Google Scholar] [CrossRef]
  43. Rampinelli, G.A.; Krenzinger, A.; Romero, F.C. Mathematical models for efficiency of inverters used in grid connected photovoltaic systems. Renew. Sustain. Energy Rev. 2014, 34, 578–587. [Google Scholar] [CrossRef]
  44. King, D.L.; Gonzalez, S.; Galbraith, G.M.; Boyson, W.E. Performance Model for Grid-Connected Photovoltaic Inverters; Sandia Report SAND2007-5036; Sandia National Laboratories (SNL): Albuquerque, NM, USA, 2007. [Google Scholar]
  45. MathWorks. Solar Cell, MATLAB Documentation. Available online: https://www.mathworks.com/help/sps/ref/solarcell.html (accessed on 3 February 2025).
  46. Pannebakker, B.B.; de Waal, A.C.; van Sark, W.G.J.H.M. Photovoltaics in the shade: One bypass diode per solar cell revisited. Prog. Photovolt. Res. Appl. 2017, 25, 836–849. [Google Scholar] [CrossRef]
  47. El-Khozondar, H.J.; El-Khozondar, R.J.; Matter, K.; Suntio, T. A review study of photovoltaic array maximum power tracking algorithms. Renewables 2016, 3, 3. [Google Scholar] [CrossRef]
  48. Lefevre, B.; Herteleer, B.; De Breucker, S.; Driesen, J. Bayesian inference based MPPT for dynamic irradiance conditions. Sol. Energy 2018, 174, 1153–1162. [Google Scholar] [CrossRef]
  49. Kumar, M.; Panda, K.P.; Rosas-Caro, J.C.; Valderrabano-Gonzalez, A.; Panda, G. Comprehensive review of conventional and emerging maximum power point tracking algorithms for uniformly and partially shaded solar photovoltaic systems. IEEE Access 2023, 11, 31778–31798. [Google Scholar] [CrossRef]
  50. Wang, N.; Guo, Y.; Liu, L.; Shao, S. Numerical assessment and optimization of photovoltaic-based 4 hydrogen-oxygen co-production energy system: A machine learning and multi-objective strategy. Renew. Energy 2024, 227, 120483. [Google Scholar] [CrossRef]
  51. MathWorks. Creating Custom Components, MATLAB Documentation. Available online: https://www.mathworks.com/help/simscape/lang/creating-custom-components.html (accessed on 3 February 2025).
  52. da Silva, R.M.; Fernandes, J.L.M. Hybrid photovoltaic/thermal (PV/T) solar systems simulation with Simulink/Matlab. Sol. Energy 2010, 84, 1985–1996. [Google Scholar] [CrossRef]
  53. Alonso Garcia, M.C.; Balenzategui, J.L. Estimation of photovoltaic module yearly temperature and performance based on Nominal Operation Cell Temperature calculations. Renew. Energy 2004, 29, 1997–2010. [Google Scholar] [CrossRef]
  54. Zeb, K.; Uddin, W.; Khan, M.A.; Ali, Z.; Ali, M.U.; Christofides, N.; Kim, H.J. A comprehensive review on inverter topologies and control strategies for grid connected photovoltaic system. Renew. Sustain. Energy Rev. 2018, 94, 1120–1141. [Google Scholar] [CrossRef]
  55. Lu, F.; Guo, S.; Walsh, T.M.; Aberle, A.G. Improved PV module performance under partial shading conditions. Energy Procedia 2013, 33, 248–255. [Google Scholar] [CrossRef]
  56. IEA. Snapshot of Global PV Market 2024. Available online: https://iea-pvps.org/snapshot-reports/snapshot-2024/ (accessed on 3 February 2025).
Figure 1. Efficiency curves of (a) inverter A, (b) inverter B, and (c) inverter C.
Sustainability 17 04626 g001aSustainability 17 04626 g001b
Figure 2. The irradiance of each cell.
Sustainability 17 04626 g002
Figure 3. Simscape model results under uniform and nonuniform irradiance conditions: (a) power, (b) voltage, and (c) current distributions across the PV cells.
Sustainability 17 04626 g003
Figure 4. Voltage bands for four modules in series at 25 °C for (a) 6 cells, (b) 12 cells, (c) 18 cells, and (d) 24 cells per bypass diode.
Sustainability 17 04626 g004
Figure 5. Evaluation framework for PV system efficiency.
Sustainability 17 04626 g005
Figure 6. Average efficiency for inverter A (rows 1–4: 4 modules, 5 modules, 6 modules, and 7 modules; columns 1–3: heavily, moderately, and lightly shaded cases).
Sustainability 17 04626 g006
Figure 7. Average efficiency for inverter B (rows 1–4: 4 modules, 5 modules, 6 modules, and 7 modules; columns 1–3: heavily, moderately, and lightly shaded cases).
Sustainability 17 04626 g007
Figure 8. Average efficiency for inverter C (rows 1–4: 4 modules, 5 modules, 6 modules, and 7 modules; columns 1–3: heavily, moderately, and lightly shaded cases).
Sustainability 17 04626 g008
Table 1. Parameters of three inverters.
ParametersInverters
ABC
P A C o [W]200020002000
P d c o [W]211621612122
C 1 [1/V]0.0000150.0000550.000020
C 2 [1/V]−0.0012250.0017030.000583
C 3 [1/V]−0.0008570.000315−0.000317
P s o [W]10.48475624.46577528.845461
V d c o [V]265199266
C o [1/W]−9.53044 × 10−6−0.000013−9.12500 × 10⁻⁶
V m p p t l o w [V]100100100
V m p p t h i g h [V]450380480
Table 2. The characteristics of PS-M72-405 at STC.
CharacteristicValue
P D C m a x   [ W ] 405
V o c [ V ] 50.32
I s c   [ A ] 10.35
V m p p   [ V ] 41.70
I m p p   [ A ] 9.72
N c e l l 72
β v o c   [ % / ] −0.30
β I S C   [ % / ] 0.06
N O C T   [ ] 45
Table 3. Probabilities, representative voltage, and power of bands for six cells per bypass diode.
Number of ModulesHeavily Shaded ConditionModerately Shaded Condition
10   ° C 25   ° C 40   ° C 10   ° C 25   ° C 40   ° C
40.10 (105, 498)
0.10 (101, 485)
0.09 (97, 478)
0.09 (109, 513)
0.08 (93, 477)
0.08 (114, 529)
0.07 (89, 477)
0.06 (118, 546)
0.06 (85, 482)
0.05 (122, 560)
0.04 (81, 485)
0.04 (78, 477)
0.03 (126, 564)
0.02 (74, 465)
0.02 (130, 564)
0.02 (144, 478)
0.02 (70, 444)
0.02 (63, 411)
0.01 (135, 548)
0.10 (99, 470)
0.10 (95, 457)
0.10 (91, 451)
0.10 (103, 485)
0.09 (87, 445)
0.08 (107, 501)
0.07 (111, 516)
0.06 (80, 448)
0.06 (83, 445)
0.05 (115, 530)
0.04 (76, 453)
0.03 (73, 446)
0.03 (119, 533)
0.02 (69, 431)
0.02 (123, 527)
0.02 (136, 448)
0.01 (59, 384)
0.01 (65, 417)
0.01 (127, 515)
0.11 (92, 442)
0.11 (89, 430)
0.10 (85, 420)
0.09 (96, 456)
0.09 (100, 471)
0.08 (81, 413)
0.07 (78, 416)
0.07 (104, 486)
0.05 (74, 415)
0.05 (108, 498)
0.03 (111, 500)
0.03 (71, 418)
0.03 (67, 412)
0.02 (128, 418)
0.02 (115, 493)
0.02 (64, 403)
0.01 (119, 472)
0.01 (60, 386)
0.01 (55, 356)
0.80 (172, 880)
0.08 (149, 914)
0.05 (146, 898)
0.04 (153, 939)
0.02 (157, 964)
0.01 (132, 939)
0.82 (162, 835)
0.07 (141, 867)
0.04 (144, 890)
0.04 (138, 854)
0.02 (148, 913)
0.01 (124, 892)
0.84 (152, 790)
0.09 (131, 815)
0.04 (135, 838)
0.02 (139, 861)
0.01 (118, 839)
50.09 (132, 618)
0.09 (128, 604)
0.08 (136, 636)
0.08 (123, 592)
0.08 (140, 653)
0.07 (119, 586)
0.07 (115, 584)
0.06 (144, 672)
0.05 (111, 591)
0.05 (107, 602)
0.05 (148, 689)
0.04 (103, 608)
0.03 (152, 703)
0.03 (99, 605)
0.03 (172, 636)
0.02 (84, 539)
0.02 (157, 712)
0.02 (95, 596)
0.02 (91, 576)
0.02 (161, 713)
0.10 (120, 570)
0.09 (128, 601)
0.09 (124, 583)
0.08 (116, 557)
0.08 (132, 619)
0.07 (112, 550)
0.07 (108, 548)
0.06 (136, 636)
0.05 (104, 551)
0.05 (139, 651)
0.04 (100, 561)
0.03 (143, 665)
0.03 (97, 566)
0.03 (93, 564)
0.02 (147, 673)
0.02 (89, 555)
0.02 (78, 503)
0.02 (166, 562)
0.02 (151, 668)
0.01 (85, 540)
0.01 (155, 651)
0.10 (116, 548)
0.10 (112, 534)
0.09 (119, 565)
0.09 (123, 583)
0.08 (108, 522)
0.08 (104, 514)
0.07 (127, 599)
0.06 (97, 511)
0.05 (101, 507)
0.05 (131, 615)
0.04 (93, 518)
0.04 (77, 492)
0.04 (89, 524)
0.03 (135, 626)
0.02 (154, 530)
0.02 (139, 631)
0.02 (85, 520)
0.02 (143, 624)
0.84 (215, 1101)
0.07 (183, 1125)
0.05 (188, 1148)
0.03 (192, 1176)
0.01 (163, 1161)
0.85 (203, 1044)
0.06 (173, 1070)
0.05 (177, 1090)
0.03 (181, 1114)
0.02 (185, 1144)
0.87 (190, 988)
0.05 (166, 1028)
0.04 (162, 1012)
0.03 (171, 1058)
0.01 (145, 1038)
60.09 (162, 758)
0.08 (154, 723)
0.08 (150, 709)
0.08 (158, 739)
0.07 (166, 778)
0.06 (146, 696)
0.06 (171, 796)
0.06 (141, 693)
0.05 (107, 684)
0.05 (137, 692)
0.05 (175, 815)
0.04 (133, 707)
0.04 (179, 833)
0.03 (129, 720)
0.03 (125, 729)
0.03 (199, 810)
0.03 (121, 735)
0.03 (183, 850)
0.02 (117, 727)
0.02 (187, 861)
0.09 (145, 682)
0.09 (149, 699)
0.08 (153, 717)
0.08 (141, 669)
0.07 (156, 735)
0.07 (137, 656)
0.06 (161, 754)
0.06 (133, 652)
0.05 (129, 645)
0.05 (165, 772)
0.05 (184, 773)
0.04 (125, 661)
0.04 (169, 789)
0.04 (100, 637)
0.03 (121, 672)
0.03 (117, 676)
0.03 (173, 804)
0.02 (113, 685)
0.02 (109, 677)
0.09 (137, 649)
0.09 (141, 667)
0.09 (133, 633)
0.08 (145, 686)
0.08 (129, 620)
0.07 (149, 703)
0.07 (125, 610)
0.07 (99, 615)
0.06 (153, 721)
0.06 (121, 603)
0.04 (117, 608)
0.04 (157, 738)
0.04 (177, 697)
0.04 (113, 616)
0.03 (161, 756)
0.03 (109, 626)
0.02 (165, 762)
0.85 (258, 1320)
0.07 (220, 1351)
0.05 (226, 1384)
0.02 (233, 1428)
0.01 (195, 1393)
0.87 (244, 1253)
0.07 (208, 1286)
0.05 (215, 1328)
0.01 (185, 1323)
0.89 (229, 1185)
0.07 (196, 1221)
0.03 (203, 1260)
0.01 (174, 1253)
70.08 (189, 881)
0.08 (180, 844)
0.08 (185, 862)
0.07 (176, 828)
0.07 (193, 900)
0.06 (197, 920)
0.06 (172, 812)
0.05 (168, 804)
0.05 (164, 799)
0.05 (201, 939)
0.04 (206, 958)
0.04 (156, 816)
0.03 (160, 804)
0.03 (151, 837)
0.03 (210, 976)
0.03 (121, 782)
0.03 (147, 854)
0.02 (230, 954)
0.02 (143, 863)
0.02 (214, 993)
0.02 (139, 864)
0.02 (135, 859)
0.01 (131, 837)
0.01 (218, 1009)
0.08 (173, 816)
0.08 (169, 798)
0.08 (177, 834)
0.08 (166, 781)
0.07 (181, 852)
0.06 (162, 768)
0.06 (185, 871)
0.06 (158, 757)
0.05 (189, 889)
0.05 (154, 750)
0.04 (119, 764)
0.04 (150, 756)
0.04 (193, 908)
0.04 (213, 909)
0.03 (146, 763)
0.03 (197, 926)
0.03 (142, 774)
0.02 (138, 793)
0.02 (134, 804)
0.02 (201, 941)
0.02 (130, 802)
0.09 (162, 766)
0.09 (166, 785)
0.08 (158, 748)
0.08 (154, 732)
0.08 (170, 803)
0.07 (150, 716)
0.06 (174, 821)
0.06 (146, 707)
0.05 (178, 840)
0.05 (142, 699)
0.04 (182, 858)
0.04 (138, 704)
0.03 (134, 708)
0.03 (186, 875)
0.03 (130, 723)
0.02 (109, 703)
0.02 (207, 805)
0.02 (126, 737)
0.02 (190, 891)
0.02 (122, 746)
0.01 (194, 892)
0.01 (118, 740)
0.87 (302, 1540)
0.08 (258, 1580)
0.04 (267, 1633)
0.01 (226, 1609)
0.89 (284, 1463)
0.08 (244, 1504)
0.03 (252, 1555)
0.91 (267, 1383)
0.07 (229, 1425)
0.02 (238, 1474)
Table 4. Probabilities, representative voltage, and power of bands for 12 cells per bypass diode.
Number of ModulesHeavily Shaded ConditionModerately Shaded Condition
10   ° C 25   ° C 40   ° C 10   ° C 25   ° C 40   ° C
40.12 (104, 350)
0.11 (87, 370)
0.11 (95, 366)
0.11 (120, 352)
0.10 (112, 345)
0.10 (79, 352)
0.09 (128, 368)
0.07 (71, 330)
0.06 (136, 388)
0.04 (63, 313)
0.04 (144, 410)
0.02 (55, 290)
0.01 (152, 431)
0.01 (45, 259)
0.01 (163, 420)
0.12 (98, 330)
0.11 (82, 348)
0.11 (113, 333)
0.11 (106, 327)
0.10 (90, 345)
0.10 (74, 332)
0.09 (121, 350)
0.07 (67, 311)
0.06 (128, 368)
0.04 (136, 390)
0.04 (59, 294)
0.02 (52, 271)
0.01 (144, 410)
0.01 (154, 398)
0.01 (42, 240)
0.12 (92, 311)
0.11 (99, 308)
0.11 (106, 315)
0.11 (77, 324)
0.10 (84, 325)
0.10 (114, 330)
0.09 (70, 311)
0.07 (62, 291)
0.06 (121, 348)
0.04 (128, 368)
0.03 (55, 275)
0.02 (135, 388)
0.01 (48, 252)
0.01 (39, 222)
0.01 (142, 409)
0.01 (151, 297)
0.98 (173, 882)
0.01 (154, 943)
0.01 (148, 910)
0.99 (163, 838)
0.01 (143, 884)
0.99 (153, 792)
0.01 (135, 838)
50.10 (140, 418)
0.10 (149, 428)
0.09 (107, 464)
0.09 (99, 446)
0.09 (124, 439)
0.08 (132, 420)
0.08 (115, 464)
0.08 (156, 447)
0.07 (164, 468)
0.06 (91, 423)
0.04 (172, 489)
0.04 (83, 396)
0.02 (180, 512)
0.02 (75, 374)
0.01 (188, 534)
0.01 (67, 354)
0.01 (200, 534)
0.01 (57, 327)
0.10 (132, 396)
0.10 (140, 405)
0.09 (101, 436)
0.09 (125, 397)
0.09 (117, 415)
0.08 (148, 425)
0.08 (108, 438)
0.08 (93, 421)
0.07 (155, 444)
0.06 (85, 399)
0.05 (163, 465)
0.04 (78, 372)
0.02 (170, 487)
0.02 (70, 350)
0.01 (60, 324)
0.01 (178, 508)
0.01 (189, 507)
0.10 (131, 383)
0.10 (124, 372)
0.09 (117, 373)
0.09 (94, 409)
0.09 (109, 391)
0.09 (139, 401)
0.08 (101, 410)
0.08 (87, 396)
0.07 (146, 420)
0.06 (80, 373)
0.05 (153, 440)
0.03 (73, 348)
0.02 (160, 461)
0.02 (66, 327)
0.02 (170, 479)
0.01 (56, 306)
0.99 (216, 1102)
0.01 (190, 1163)
0.99 (203, 1047)
0.01 (178, 1100)
0.99 (191, 990)
0.01 (168, 1041)
60.09 (169, 491)
0.08 (177, 506)
0.08 (185, 526)
0.08 (161, 485)
0.07 (127, 565)
0.07 (119, 541)
0.07 (135, 567)
0.07 (193, 547)
0.07 (144, 540)
0.06 (153, 500)
0.06 (111, 514)
0.05 (200, 570)
0.04 (103, 485)
0.03 (208, 593)
0.02 (95, 455)
0.02 (83, 436)
0.02 (217, 615)
0.01 (224, 637)
0.01 (235, 657)
0.09 (167, 480)
0.09 (174, 499)
0.09 (159, 464)
0.08 (152, 458)
0.07 (119, 532)
0.07 (182, 521)
0.07 (111, 511)
0.07 (127, 534)
0.07 (135, 512)
0.06 (144, 472)
0.06 (104, 485)
0.05 (189, 542)
0.04 (97, 457)
0.03 (197, 564)
0.02 (89, 429)
0.02 (205, 586)
0.01 (78, 409)
0.01 (216, 612)
0.09 (156, 454)
0.09 (149, 439)
0.09 (164, 472)
0.08 (142, 434)
0.07 (171, 492)
0.07 (111, 499)
0.07 (119, 502)
0.07 (135, 441)
0.07 (104, 480)
0.07 (127, 480)
0.06 (97, 455)
0.05 (178, 512)
0.03 (90, 428)
0.03 (185, 533)
0.02 (83, 402)
0.02 (192, 554)
0.01 (73, 384)
0.01 (203, 580)
0.99 (259, 1323)
0.01 (226, 1384)
0.99 (244, 1256)
0.01 (213, 1316)
0.99 (229, 1188)
0.01 (201, 1247)
70.08 (205, 585)
0.08 (213, 606)
0.07 (197, 567)
0.07 (189, 555)
0.07 (221, 628)
0.07 (139, 639)
0.06 (146, 665)
0.06 (154, 668)
0.06 (131, 609)
0.06 (164, 647)
0.05 (181, 560)
0.05 (229, 650)
0.05 (173, 591)
0.04 (123, 575)
0.04 (237, 673)
0.03 (115, 544)
0.02 (102, 514)
0.02 (245, 695)
0.02 (257, 729)
0.08 (193, 555)
0.08 (201, 575)
0.08 (186, 537)
0.07 (178, 527)
0.07 (208, 596)
0.07 (154, 605)
0.06 (130, 604)
0.06 (137, 626)
0.06 (123, 575)
0.06 (216, 618)
0.05 (171, 526)
0.05 (145, 644)
0.05 (163, 557)
0.04 (115, 542)
0.04 (224, 640)
0.02 (108, 513)
0.02 (231, 661)
0.02 (242, 692)
0.01 (101, 489)
0.01 (90, 475)
0.09 (181, 525)
0.09 (189, 544)
0.08 (174, 508)
0.07 (196, 564)
0.07 (167, 494)
0.06 (128, 588)
0.06 (144, 567)
0.06 (160, 498)
0.06 (121, 568)
0.05 (152, 531)
0.05 (203, 585)
0.05 (135, 600)
0.05 (115, 540)
0.04 (210, 606)
0.04 (108, 508)
0.02 (217, 626)
0.02 (228, 656)
0.02 (101, 480)
0.02 (90, 452)
0.99 (302, 1543)
0.01 (263, 1611)
0.99 (285, 1466)
0.01 (249, 1536)
0.99 (267, 1386)
0.01 (235, 1459)
Table 5. Probabilities, representative voltage, and power of bands for 18 cells per bypass diode.
Number of ModulesHeavily Shaded ConditionModerately Shaded Condition
10   ° C 25   ° C 40   ° C 10   ° C 25   ° C 40   ° C
40.18 (95, 284)
0.17 (83, 266)
0.15 (106, 309)
0.13 (71, 250)
0.12 (118, 338)
0.07 (176, 184)
0.06 (130, 370)
0.04 (59, 280)
0.03 (141, 403)
0.03 (47, 231)
0.01 (153, 436)
0.01 (34, 226)
0.18 (89, 269)
0.17 (78, 252)
0.15 (100, 293)
0.13 (67, 236)
0.12 (112, 322)
0.07 (166, 175)
0.06 (123, 352)
0.04 (55, 265)
0.03 (134, 383)
0.03 (44, 218)
0.01 (145, 415)
0.01 (32, 211)
0.18 (84, 254)
0.17 (73, 237)
0.15 (94, 277)
0.13 (62, 221)
0.12 (105, 304)
0.07 (156, 166)
0.06 (115, 333)
0.04 (51, 249)
0.03 (126, 362)
0.03 (41, 204)
0.01 (136, 393)
0.01 (30, 197)
1.00 (172, 882)1.00 (163, 838)1.00 (153, 792)
50.16 (116, 342)
0.15 (127, 367)
0.14 (104, 325)
0.12 (139, 397)
0.11 (92, 310)
0.09 (151, 430)
0.07 (80, 299)
0.06 (162, 462)
0.04 (219, 239)
0.03 (68, 320)
0.02 (174, 495)
0.01 (56, 280)
0.01 (186, 529)
0.01 (43, 283)
0.16 (109, 324)
0.15 (120, 349)
0.14 (98, 307)
0.12 (131, 377)
0.11 (87, 292)
0.09 (142, 408)
0.07 (75, 282)
0.05 (153, 440)
0.04 (207, 227)
0.03 (63, 302)
0.02 (164, 471)
0.01 (51, 264)
0.01 (175, 503)
0.16 (113, 330)
0.16 (102, 306)
0.14 (92, 288)
0.13 (123, 357)
0.11 (81, 274)
0.09 (134, 386)
0.07 (71, 266)
0.05 (144, 416)
0.04 (195, 214)
0.03 (59, 284)
0.02 (154, 446)
0.01 (48, 246)
0.01 (165, 477)
1.00 (216, 1103)1.00 (203, 1047)1.00 (191, 990)
60.15 (148, 427)
0.14 (137, 400)
0.13 (160, 457)
0.12 (125, 381)
0.10 (172, 489)
0.09 (113, 371)
0.07 (184, 522)
0.06 (101, 361)
0.04 (257, 331)
0.03 (195, 555)
0.03 (88, 414)
0.02 (207, 589)
0.01 (77, 364)
0.01 (64, 318)
0.15 (140, 405)
0.14 (129, 380)
0.13 (151, 434)
0.12 (118, 360)
0.10 (162, 465)
0.09 (106, 351)
0.07 (173, 496)
0.06 (95, 338)
0.04 (242, 317)
0.04 (184, 528)
0.02 (83, 391)
0.02 (68, 326)
0.02 (195, 559)
0.15 (131, 383)
0.14 (121, 358)
0.13 (142, 410)
0.12 (110, 339)
0.10 (152, 439)
0.09 (99, 330)
0.07 (163, 470)
0.06 (89, 315)
0.04 (228, 300)
0.04 (173, 500)
0.02 (77, 367)
0.02 (63, 307)
0.02 (183, 530)
1.00 (259, 1323)1.00 (244, 1256)1.00 (229, 1188)
70.14 (169, 485)
0.13 (181, 516)
0.13 (158, 458)
0.11 (193, 549)
0.10 (146, 440)
0.09 (204, 582)
0.08 (134, 430)
0.06 (122, 427)
0.05 (216, 615)
0.03 (110, 436)
0.02 (228, 648)
0.02 (297, 399)
0.02 (97, 459)
0.01 (83, 396)
0.01 (239, 681)
0.14 (160, 460)
0.13 (171, 490)
0.13 (149, 434)
0.11 (182, 521)
0.10 (137, 417)
0.09 (193, 553)
0.08 (126, 406)
0.06 (115, 401)
0.05 (204, 585)
0.03 (103, 418)
0.03 (282, 372)
0.02 (215, 616)
0.01 (91, 433)
0.01 (78, 372)
0.01 (226, 648)
0.14 (150, 435)
0.13 (160, 463)
0.13 (139, 409)
0.11 (171, 493)
0.10 (129, 391)
0.09 (118, 382)
0.08 (181, 523)
0.06 (107, 375)
0.05 (192, 553)
0.03 (265, 348)
0.03 (96, 398)
0.02 (202, 583)
0.01 (85, 405)
0.01 (212, 614)
0.01 (72, 347)
1.00 (302, 1543)1.00 (285, 1466)1.00 (267, 1386)
Table 6. Probabilities, representative voltage, and power of bands for 24 cells per bypass diode.
Number of ModulesHeavily Shaded ConditionModerately Shaded Condition
10   ° C 25   ° C 40   ° C 10   ° C 25   ° C 40   ° C
40.22 (177, 182)
0.21 (85, 249)
0.21 (69, 212)
0.16 (100, 287)
0.10 (115, 330)
0.04 (131, 372)
0.04 (53, 252)
0.01 (146, 416)
0.01 (38, 199)
0.22 (168, 173)
0.21 (80, 236)
0.21 (65, 201)
0.16 (94, 273)
0.10 (109, 313)
0.04 (123, 354)
0.04 (50, 237)
0.01 (138, 395)
0.01 (35, 192)
0.23 (158, 164)
0.22 (75, 223)
0.21 (61, 190)
0.16 (88, 258)
0.10 (102, 296)
0.04 (116, 335)
0.03 (45, 218)
0.01 (130, 374)
1.00 (172, 882)1.00 (163, 838)1.00 (153, 792)
50.19 (98, 287)
0.18 (221, 229)
0.18 (114, 326)
0.17 (83, 252)
0.13 (129, 368)
0.07 (144, 411)
0.03 (160, 455)
0.03 (66, 310)
0.01 (51, 245)
0.01 (175, 498)
0.19 (209, 218)
0.18 (92, 272)
0.18 (107, 310)
0.17 (78, 238)
0.13 (122, 350)
0.07 (136, 390)
0.03 (151, 432)
0.03 (62, 292)
0.01 (48, 231)
0.01 (165, 474)
0.20 (197, 206)
0.19 (87, 257)
0.17 (100, 293)
0.16 (73, 225)
0.13 (114, 331)
0.07 (128, 369)
0.03 (142, 409)
0.03 (58, 275)
0.01 (44, 218)
0.01 (155, 448)
1.00 (216, 1102)1.00 (203, 1047)1.00 (191, 990)
60.20 (264, 286)
0.18 (127, 365)
0.17 (112, 326)
0.15 (142, 406)
0.10 (158, 450)
0.09 (97, 300)
0.05 (173, 493)
0.02 (188, 537)
0.02 (79, 372)
0.02 (64, 302)
0.20 (252, 261)
0.18 (120, 347)
0.17 (105, 308)
0.15 (134, 386)
0.10 (149, 427)
0.08 (91, 288)
0.05 (163, 469)
0.02 (178, 510)
0.02 (60, 285)
0.02 (74, 352)
0.01 (192, 552)
0.21 (237, 248)
0.18 (112, 328)
0.17 (99, 291)
0.15 (126, 365)
0.10 (140, 404)
0.07 (85, 276)
0.06 (154, 444)
0.02 (167, 483)
0.02 (56, 267)
0.01 (69, 330)
0.01 (181, 523)
1.00 (259, 1323)1.00 (244, 1256)1.00 (229, 1188)
70.22 (309, 328)
0.16 (141, 404)
0.15 (125, 364)
0.15 (156, 445)
0.12 (171, 488)
0.08 (187, 532)
0.04 (202, 575)
0.04 (110, 371)
0.02 (217, 619)
0.01 (92, 432)
0.01 (77, 365)
0.22 (292, 312)
0.16 (132, 383)
0.16 (118, 345)
0.15 (147, 423)
0.12 (162, 464)
0.08 (176, 505)
0.04 (191, 547)
0.03 (104, 359)
0.02 (205, 588)
0.01 (87, 408)
0.01 (72, 344)
0.22 (275, 296)
0.16 (124, 361)
0.16 (111, 326)
0.15 (138, 400)
0.12 (152, 439)
0.08 (165, 478)
0.04 (179, 517)
0.03 (97, 345)
0.02 (193, 557)
0.01 (81, 383)
0.01 (67, 322)
1.00 (302, 1543)1.00 (285, 1465)1.00 (267, 1385)
Table 7. Probabilities, representative voltage, and power of bands for 6, 12, 18, and 24 cells per bypass diode under lightly shaded condition.
Number of Modules 10   ° C 25   ° C 40   ° C
41.00
(163, 1327)
1.00
(153, 1253)
1.00
(143, 1176)
51.00
(203, 1658)
1.00
(191, 1566)
1.00
(179, 1470)
61.00
(244, 1990)
1.00
(229, 1879)
1.00
(214, 1764)
71.00
(285, 2321)
1.00
(267, 2192)
1.00
(250, 2058)
Table 8. Average, minimum, and maximum inverter efficiency differences relative to 24 cells per diode.
InverterNumber of Cells per Bypass DiodeMean (%)Min (%)Max (%)
A60.3948−0.00321.4654
120.2314−0.00650.9659
180.0579−0.35200.3822
B60.9385−0.00323.2582
120.5230−0.00652.0590
180.1307−0.88020.9457
C61.1066−0.00323.8950
120.6262−0.00652.4731
180.1618−0.94921.0628
Disclaimer/Publisher’s Note: The statements, opinions and data contained in all publications are solely those of the individual author(s) and contributor(s) and not of MDPI and/or the editor(s). MDPI and/or the editor(s) disclaim responsibility for any injury to people or property resulting from any ideas, methods, instructions or products referred to in the content.

