1. Introduction
In today’s world, all companies rely on logistical support, and it is even colloquially said that if something fails, it is due to logistics. However, it is important to remember that the execution of key logistical processes, like transportation, contradicts environmental protection requirements, as transportation is identified as one of the main causes of air pollution. In modern logistics, attention is being paid to technologies that support sustainability. Logistics companies are implementing innovations in automation and robotics, but they are also using green transport to reduce emissions. Sustainable transport meets society’s expectations by minimizing harmful economic and environmental impacts. It focuses on controlling emissions of harmful compounds found in exhaust fumes, as well as switching from combustion-based modes of transport to renewable energy. This system meets mobility needs, guarantees an improved quality of life for city dwellers, and stops endangering human health. It meets emissions and noise standards; minimizes the need for land use; is affordable, and therefore supports the competitiveness of regions and the economy as a whole; and is cost-effective and energy-efficient [
1]. Green logistics (GL) maximize economic benefits while reducing environmental nuisance, emphasizing the particular relevance vis-à-vis the integration by Logistics Service Providers (LSPs) of elements of the logistics chain for joint environmental action. Green logistics refers to the systematic measurement, analysis, and mitigation of the environmental impacts of logistics activities. Efforts by logistics companies to mitigate environmental externalities in logistics activities include reducing the consumption of non-renewable energy sources, particulate emissions, and greenhouse gas emissions, and reducing waste [
2].
Therefore, the research in this article focuses on identifying changes among LSPs, particularly for green logistics provided by logistics operators in cities, regions, countries, and globally, where approaches to environmental protection and minimizing impacts on the environment are applied, while also addressing the adverse effects of transportation on urban quality of life.
In recent years, globalization and the liberalization of international trade have multiplied logistical flows between different countries and organizations, increasing the complexity level of supply chain logistics [
3]. In Polish transport companies, managers focus above all on optimizing the routes taken, which has a positive upshot not only on savings, but also on lowering the amount of exhaust CO
2 emissions entering the atmosphere. The aim here is to reduce empty journeys and optimize routes. In Poland, companies often choose to use a low-emission and energy-efficient fleet by outsourcing logistics services, while LSPs invest their capital in environmentally friendly means of transport. It is worth noting that in Poland, starting as early as 2025, every new truck designed to handle the transport of goods will meet the CO
2 emission requirements of being 15% less compared to 2019. Meeting this target is hugely important, especially as lorries, which account for 5% of all road traffic in Europe, are responsible for as much as 22% of overall carbon dioxide emissions. Regulations are not only motivating transport companies to change by implementing a green supply chain, but will force them to adapt to the new regulations. An example of this is the Polish courier company InPost, which was the first to decide to deliver parcels en masse to parcel machines, bringing them closer to reducing CO
2 emissions by 75% compared to traditional courier services [
4]. Managers of transport and logistics companies acknowledge that climate action dominates thinking about investments. ESG reporting is also a reason for this. The Polish transport market is currently highly fragmented, which is a significant barrier to increasing the added value and generating economies of scale. Other important changes that will intensify included immigration and the development of high-value-added services, as well as the digitalization and automation of drivers. A fundamental challenge for Polish logistics companies is decarbonization or EU climate change regulations, and adaptation to the mobility package. The significance of technology is reflected in logistics through inventory reduction, delivery schedule optimization, and significant damage reduction. This means that organizations’ primary concern is selecting efficient and effective technology for various logistical activities, such as data collection, processing, and analysis, with a high degree of performance, reliability, and accuracy [
5].
Urban transportation has become a global phenomenon in recent decades. Due to high population density, goods distribution in large cities has become a highly demanding task [
6]. Russo and Comi (2012) observed that freight vehicles in urban areas accounted for 6–18% of total transportation, but consumed about 19% of fuel and emitted 21% of CO
2 into the environment of a given city [
7]. Indeed, freight trucks are a more significant cause of serious health and environmental problems than passenger vehicles. With the development of the “just in time” system, many manufacturing companies have abandoned warehouses, leading to significant investments and the maintenance of transportation, causing traffic congestion and pollution in cities. Large cities have special logistics terminals operated by logistics service providers (LSPs), making logistics centers (LCs) a central element of the goods delivery system. City logistics centers (CLCs) are located in industrial zones and on the outskirts of cities, are connected to cities, and coordinate the flow of goods to and from the city area [
8]. By utilizing logistics terminals, an increasing number of companies can reduce their costs; however, the issue of environmental pollution in urban areas still remains. Green logistics (GL) is a concept that integrates resources, products, and consumers in their flows, and it is also an important tool for developing a closed-loop economy, as indicated by some publications [
9,
10,
11]. The aim is to assess the use of the green logistics concept by selected logistics operators in Poland. The theoretical gap lies in the lack of research on the impact of logistics operators on pollution levels in the context of legislative changes and the modernization of transport means in the European Union market.
2. Green Logistics—The Terminology and Concept
For many years, European Union countries have been striving to increase the importance of environmental respect in economic activities. This is one of the main developmental trends in managing modern supply chains, often referred to in the literature as the sustainable development of supply chains [
12,
13,
14]. The next stage in the development of this concept was ecologistics, which is related to the concept of reverse logistics. Ecologistics primarily focuses on minimizing the negative influence of logistics on the natural environment. This can involve actions such as designing packaging to minimize the materials needed for their production, reusing packaging, reducing energy and pollution associated with transportation, and recycling packaging waste [
15,
16]. According to J. Witkowski, ecologistics is a part of the supply chain, both as a process and a subsystem of the supply chain, which can be defined as an ecological supply chain or a post-sales supply chain, but it considers the specific activities related to waste management. Therefore, an ecologistic supply chain is a set of cooperating entities and processes occurring along the waste flow path, including accompanying information and cash [
17]. Green logistics originates from environmentalism, as the realization of optimal solutions for the collection, collection, disposal, and diversion of waste for disposal or environmentally and socially unobtrusive disposal, including packaging, and the concept has subsequently been significantly extended.
The concept of a green supply chain (GSC) was first proposed by the Manufacturing Research Consortium (MRC) at Michigan State University in the USA in 1996, within the context of comprehensively addressing the relationship between the natural environment and production optimization in the supply chain [
18]. The main assumption was to minimize the negative environmental impact by tracking the product throughout its lifecycle and monitoring products withdrawn from circulation. Among the pioneers of using the term “green supply chain” in the literature is B.M. Beamon in 1999 [
19]. This term was further refined as a tool for analyzing processes in relation to the SCOR model by R. Cacha and T. Wilkerson in 2003, where GreenSCOR is a tool that helps ecologists and logisticians maintain a perspective of the entire dynamic SC [
20]. Another step in the development of the concept of the GSC was the definition by S.K. Srivastava in 2007, according to which managing a GSC is related to the full cycle of design, production, packaging, sales, use, and recycling, taking into account storage, transportation, and information exchange processes that should meet appropriate environmental standards [
21]. For the practical management of the green supply chain, Zhu, Sarkis, and Geng developed a questionnaire based on a literature review presented to Chinese companies and evaluated for comparative analysis, noting improved results resulting from regulations and competitiveness [
22]. Similarly, Mohanty and Prakash conducted an empirical study in India among micro, small, and medium enterprises, where they found that these companies are under significant pressure to adopt green supply chain management (GSCM) due to the interest of other stakeholders [
23]. In summary, the basic concept of green logistics is becoming a determinant of the activities of the modern logistics sector. It is worth emphasizing that the focus of LSP companies on implementing this idea not only contributes to environmental protection, but also builds a positive brand image. Applying modern technologies to logistics processes and adapting them to green ideas becomes a way to theoretically support this research. The implementation of green supply chains by LSPs represents a practical application of GL.
Rachmangulow, Sladkowski, Osintsev, and Murayev present a very interesting system of methods and instruments for GL, where they weigh all changes that an enterprise can implement in the entire logistics system to make it eco-friendly. They divide all logistical activities into green logistical instruments [
24]. In another publication, from an academic perspective they define GL as “an effective approach to managing technological processes, resources, and energy flow to reduce environmental and economic damage”. Furthermore, in their considerations, such an approach could prepare social and innovative development for workers and production [
25]. From an industry perspective, Osintsev et al., in 2018, defined the concept of GL as environmental problems aimed at reducing CO
2 exhaust emissions and related to sustainable transport, handling, and warehousing of hazardous materials, inventory management, warehousing, packaging, and facility place [
26]. In 2022, Mutua Mutie et al. defined GL as an environmentally friendly process or system involving ecological processes in all logistic activities, such as transportation, storage, distribution, and waste recycling or disposal [
27]. From the perspective of a developing country, Wu et al. (2023) [
28] argue that creating GL is difficult due to its numerous contradictions and inconsistencies. Classical logistics aims at minimizing costs and improving overall service; environmental logistics, on the other hand, concerns the environment. Another element Wu et al. (2023) write about is the fact that, in developed countries, there are service logistics where they are improved, and there are policies requiring certain environmental actions, but this is not the case in less-developed countries [
28]. Therefore, GL can be described as the efficiency of the economic cycle in a closed-loop economy. Important actions related to GL that are carried out by companies in the context of the circular economy concept include the following environmentally friendly activities [
29]:
- -
Eco-friendly packaging suitable for recycling;
- -
Eco-friendly and emission-free transportation;
- -
Storage, warehousing, and picking as phases of movement in warehouses or logistics centers;
- -
Flow processing, also known as green production (low-emission of harmful waste and pollutants; resource savings such as raw materials, energy, and water).
The dynamic development of green logistics results from several reasons [
30,
31], which are as follows:
Legislation imposes higher environmental standards and potential penalties for non-compliance, aiming, among other things, to reduce greenhouse gas emissions. The 2011 EU Transport White Paper sets targets for modernizing transport in Europe.
There is increased societal awareness through the dissemination of knowledge and information about the environment and the detrimental influence of daily processes. As a result, enterprises take actions to correct their image to attract potential customers.
An increase in technological potential in recent years has also influenced logistics. Technological innovations consider the environment and aim to prevent its degradation. Simultaneously, technologies contribute to the transformation of SC into GSC.
Cost minimization is an integral part of logistics and the operation of any enterprise. Through careful analysis and streamlining of SC, enterprises can save money and minimize waste production.
Corporate image policy is very important in the 21st century. Corporations acquire new clients and generate revenue from the sale of recyclable products. Often, this is due to comparison to the best enterprises in the industry that use specific ecological solutions, as it is the case in the LSP sector.
The European Union’s ‘Fit for 55’ package is a set of policies and instruments aimed at reducing greenhouse gas emissions by 55% by 2030 compared to 1990, and achieving net zero emissions by 2050 [
32]. In addition, targets have been updated to include an increase in the share of renewable energy sources (RES) in final energy consumption to 32% and progress towards a 32.5% increase in energy efficiency (compared to 2005 levels) [
33]. By 2035, all new passenger cars and vans registered in the EU should be zero-carbon (European Commission 2021f). To stimulate the sales of zero- and low-emission vehicles (ZLEV), Regulation (EU) 2019/631 provides a credit system where ZLEV are counted more than once in the calculation of the average specific emissions of a manufacturer. For new heavy-duty vehicles, the standard is less ambitious, with a 15% reduction of the EU-wide emissions in 2025 and a 30% reduction in 2030. Some green concepts concern the supply chain as a whole [
34,
35,
36]. This includes creating closed-loop supply chains. Moreover, this is an ecological concept, which is particularly important in the context of green supply chain management by a logistics operator (LO). LO combines environmental management and supply chain management, including the use of tools such as environmental supplier assessment. Other green concepts concern specific elements of the supply chain [
37,
38]. From the previous definitions, it can be concluded that the green logistics system was created by combining the concept of sustainable development, ecologistics, and logistics rules, including waste logistics. The main purpose is to ensure the balance of environmental sustainability, ecology, and economics in the logistics system.
3. Materials and Methods
Based on the previously mentioned publications on green supply chains, the following question was formulated in the form of a research problem: what role do LSPs play in green supply chains, and how can we observe their mutual interactions and benefits resulting from the coexistence of individual attributes? Additionally, in most supply networks, LSPs probably do not have a dominant role as integrators in GSC due to the following factors:
- -
The nature of the transported product: demand for the product is relatively predictable, it does not have a high level of innovativeness, it is not always a green product, it does not have a short life cycle, and it is susceptible to positive economies of scale associated with production;
- -
Permanent relationships with suppliers or customers in the supply chain (SC): due to established trust, unique competencies of the logistics operator, and high transaction costs associated with changing partners, there may not be a significant role for LSPs as integrators in green supply chains;
- -
High cost of flexibility: this may be unattainable for networks operating in highly competitive cost environments.
To analyze this, it is necessary to consider the complexity of extended delivery in the supply chain, identified as a set of potential strategic and operational considerations, as follows:
- -
Number and place of product/packaging pickup points and their reuse;
- -
The results of traditional SC strategies (e.g., decentralized) compared to centralized locations of logistics operators and their impact on environmental efficiency;
- -
Simultaneous operational and environmental optimization of the supply chain;
- -
Incorporating environmental and operational goals into traditional analysis;
- -
The level and location of buffer stocks in SC, including LSP terminals and sorting centers;
- -
Action of influence and recovery (which are not fully correlated) on the uncontrolled growth of unwanted parts or the unavailability of critical parts and other decisions.
When determining the impact, it is important to adopt a holistic approach to LSP supply chain practices in environmental transportation efficiency. Therefore, there should be a significant degree of reliability regarding which aspects of uncertainty are relevant to GL. To establish this, research should undertake the following:
- -
Identify and categorize all sources of uncertainty affecting the SC and transportation;
- -
Account the primary causes and basic results of each type of uncertainty;
- -
Determine where each type of uncertainty arises, whether in transportation operations or other parts of the SC;
- -
Determine the influence of uncertainty causes on the efficiency of GL;
- -
Set priorities of uncertainty and determine solutions, including flexibility strategies, to minimalization their effects;
- -
Examine the full range of uncertainties, primarily related to the external environment, such as product availability, goods prices, regulations on international trade, taxes, and customs.
For the analysis, we have selected the ten largest companies operating in the Polish market in terms of LSP revenues in 2022, where the main type of activity is logistics services. We exclusively focus on their activities, as these entities also operate in European Union countries (
Table 1) [
39]. Data on LSP companies were obtained from the industry supplement, which is a ranking of LSP companies that provides annual data for the Polish area [
40].
The lack of research on large-scale supply network issues is conducive to assessing many performance criteria in green supply chains. This publication attempts to identify theories and concepts of integrating different logistics decisions and their impact on the environment through the choice of LSP.
Therefore, it is important to gain a better understanding of how enterprises can reduce their costs and enlarge competitiveness while also minimizing their environmental influence. In cases where enterprises have strategically redesigned their SC or distribution networks, it seems that, in many instances, profits achieved in overall system costs also lead to environmental interactions in terms of reduced CO
2 exhaust emissions or energy profits. The effects of CO
2 exhaust emission efficiency, transport intensity, and industrial structure vary by country as well as by region, with high-emission regions including Mazowieckie, Gornoslaskie, and Dolnoslaskie. Therefore, there are significant differences in the development and emission levels among individual logistics operators across different regions. Studies conducted from a national perspective or within a single region cannot fully reveal the various relationships between the development of the LSP sector and CO
2 exhaust emissions in Poland (
Figure 1) [
41].
The main contribution is filling the theoretical gap through research on the impact of logistics operators on pollution levels in the context of legislative changes and the modernization of transport means in the European Union market. To address this gap, this study focuses on analyzing the pollution levels of selected logistics operators in Poland. The research was conducted using data from all terminals in Poland. The research problem is formulated as follows:
To what extent do logistics operators influence environmental pollution levels in the context of changes in the European Union?
The research hypotheses are as follows:
Hypothesis 1. Logistics operators, as participants in the transport market, have an impact on environmental pollution.
Hypothesis 2. The modernization of transport means contributions to reducing air pollution.
Hypothesis 3. Legislative conditions significantly influence the reduction of pollution levels by logistics operators.
The EU introduced the European emissions standard, covering all new cars. LSP companies use cars of the EURO 4–6 standard (
Table 2). The purpose of the EURO standards is to reduce emissions of several major harmful exhaust gases, such as nitrogen oxides (NOx), hydrocarbons (HC), carbon monoxide (CO), and particulate matter (PM). LSPs are introducing modern EURO 4–6 vehicles, where environmental pollution caused by transport activities is reduced. Research is needed in the technical and organizational aspects of transport [
42].
Table 2 presents the emission limits for EURO 4–6 vehicles fueled by petrol, CNG, or LNG.
Freight transport vehicles are categorized as follows:
- -
Delivery lorries with a gross vehicle weight (GVW) of 3.5 t (st = 1);
- -
Delivery lorries with a GVW of 12 t (st = 2);
- -
Heavy-duty lorries with a GVW of 24 t (st = 3) and refrigerated lorries for transporting cooled and frozen goods (st = 4);
- -
Dump lorries for transporting bulk materials (st = 5). Freight transport vehicles include lorries with a wide range of payload capacities, from standard lorries to those exceeding a GVW of 24 tons (st = 6, …, std), used for transporting oversized cargo.
In rail transport, wagons are classified based on their purpose and load capacity. The maximum load capacity is 62 tons, optimized for coal transport and with axle loads of up to 20 tons. Carriers operate using diesel and electric locomotives or are organized into electric traction units. Freight is transported in wagons with load capacities ranging from 20 to 65 tons (st = std + 1, …, ST), depending on transport mode, natural load-bearing capacity, and railway line classification.
Due to the varying environmental effect of different transport means, the model additionally considers the transport structure based on the following factors:
- -
Engine type and fuel: gasoline engines, diesel (ON), liquefied petroleum gas (LPG), compressed natural gas (CNG), hybrid engines, and electric engines, RS = {1, 2, 3, 4, 5};
- -
European emission standard (EURO), NE = {0, 1, 2, 3, 4, 5, 6}.
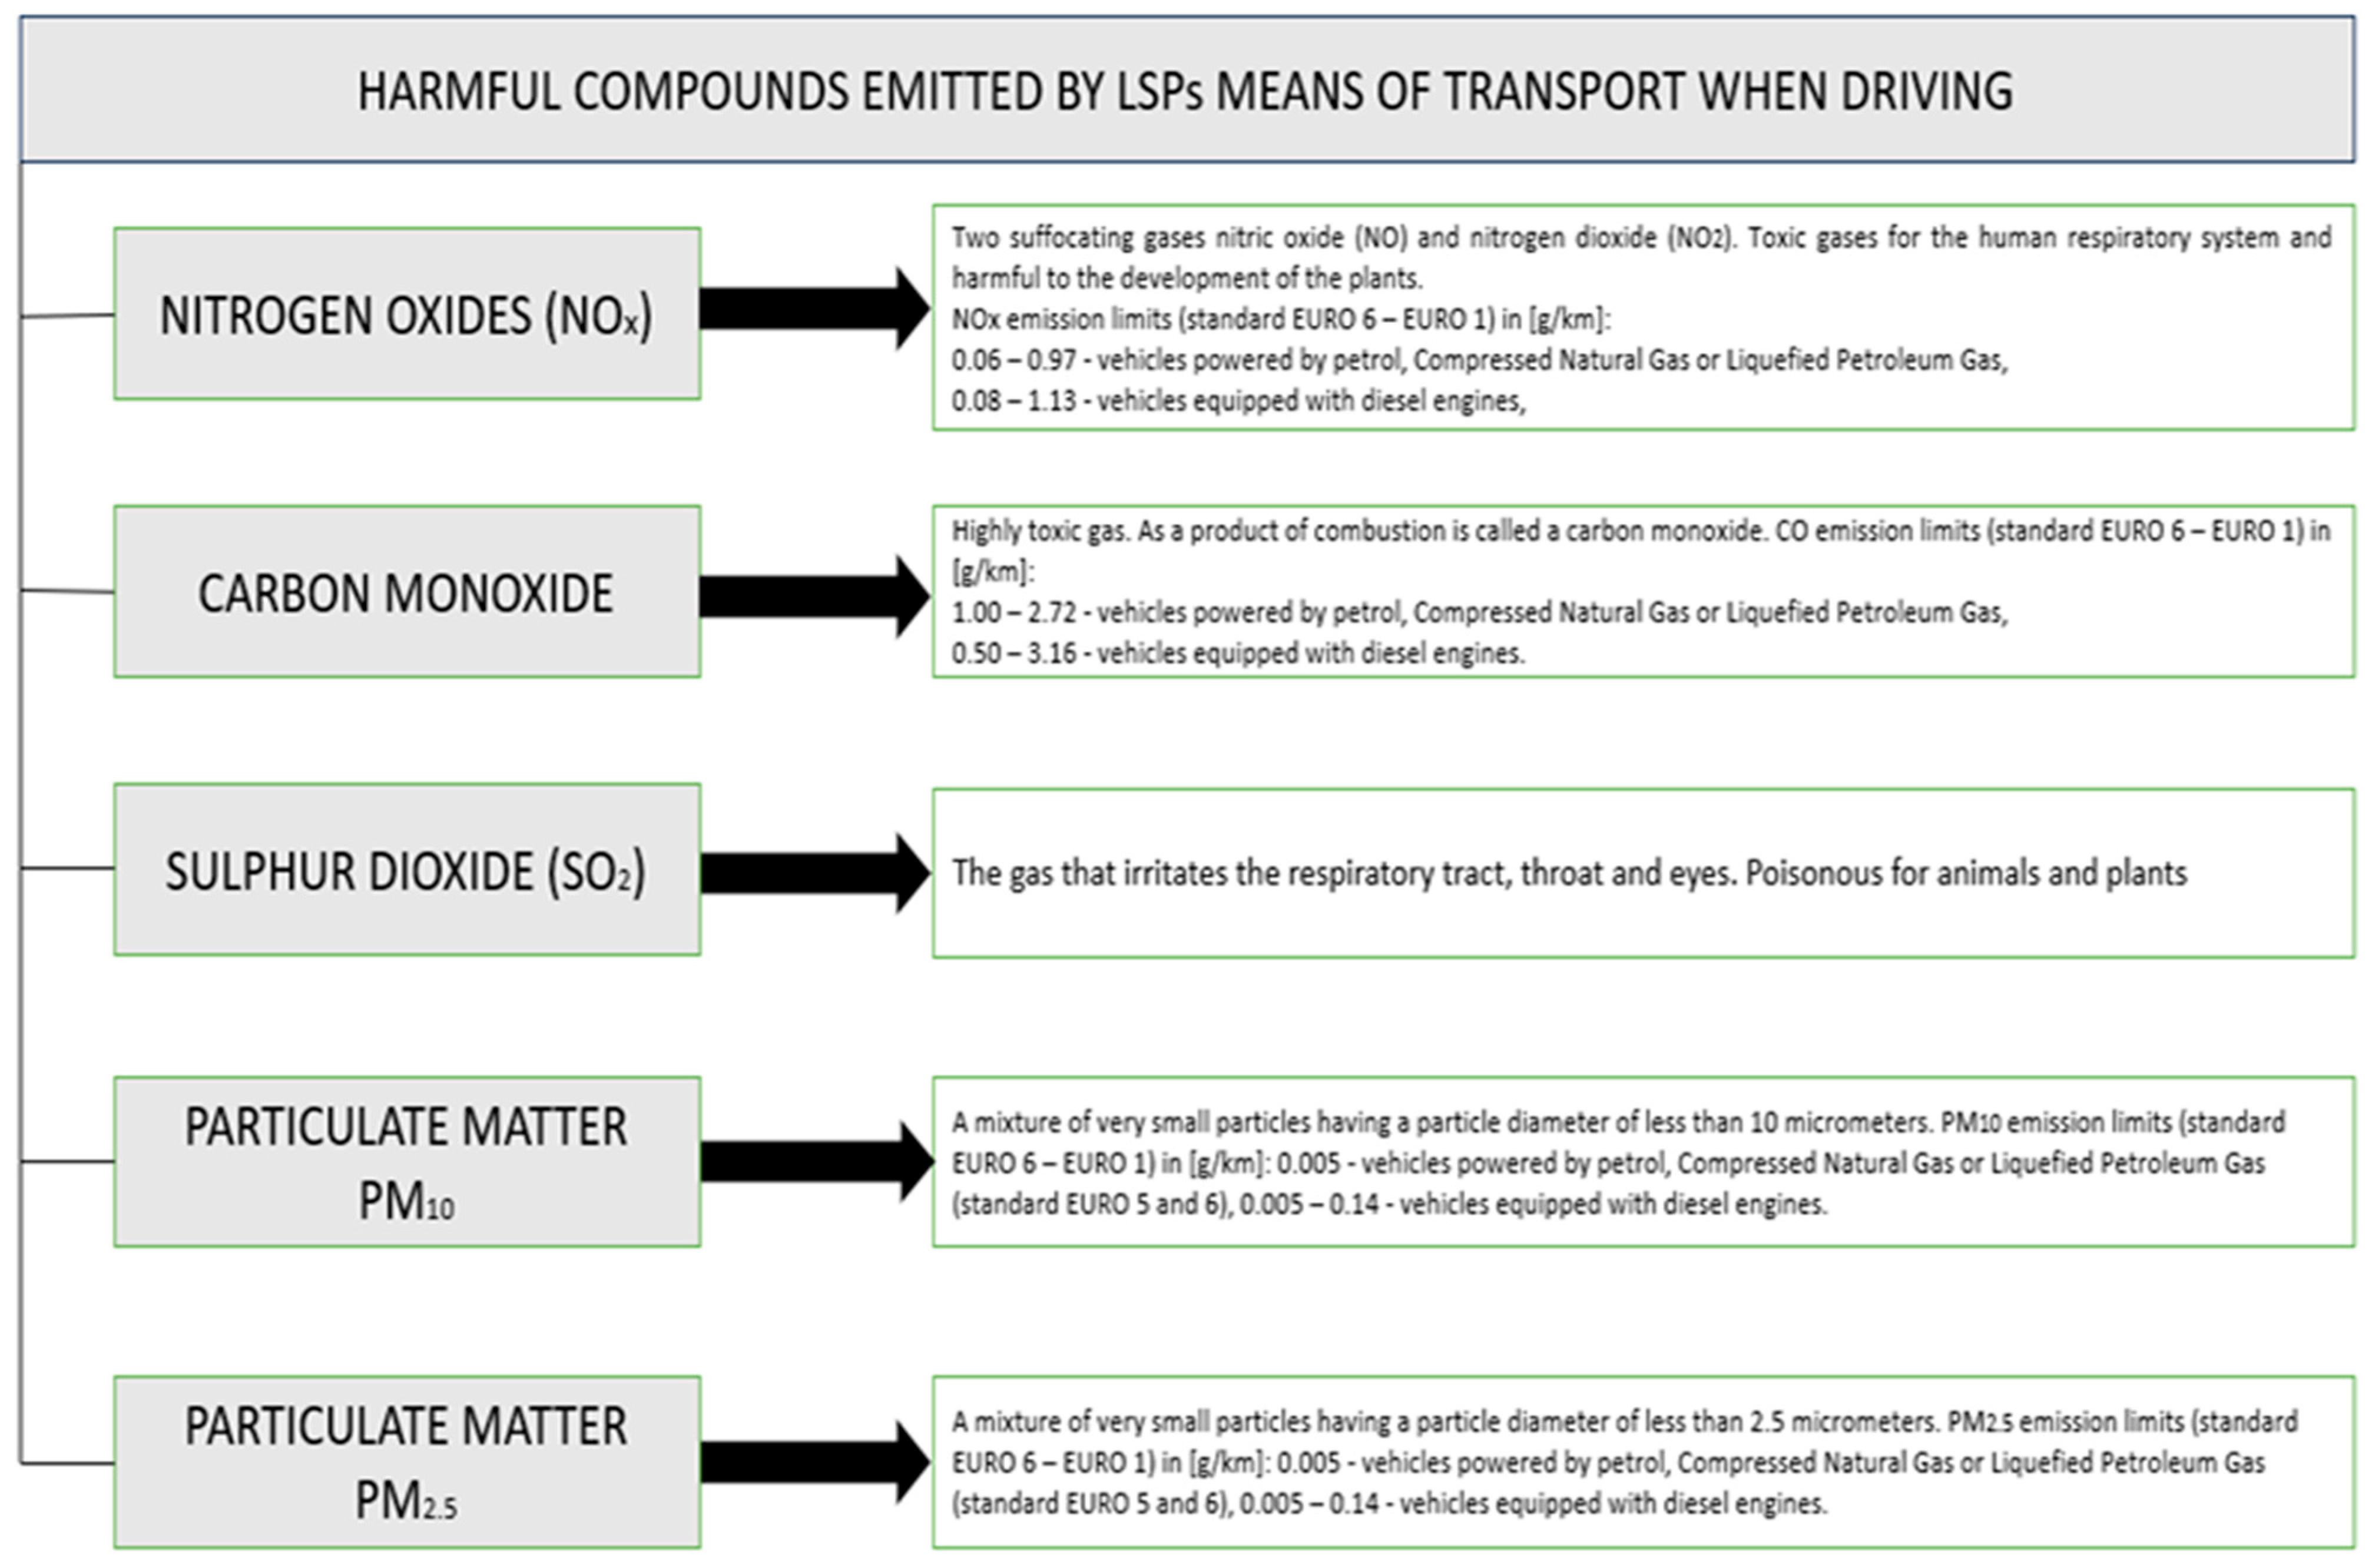
Air pollution is measured by the emission and concentration of primary pollutants (harmful compounds released during vehicle operation), including nitrogen oxides (NOx), carbon monoxide (CO), sulfur dioxide (SO2), lead (Pb), and particulate matter (PM10, PM2.5), as well as dust and soot. The composition and concentration of these pollutants vary, yet road transport remains a key area requiring eco-friendly solutions.
The model also incorporates functional relationships describing the emission levels of the following pollutants:
- -
Carbon monoxide (CO), s = 1;
- -
Hydrocarbons (HC), s = 2;
- -
Nitric oxide (NO), s = 3;
- -
Nitrogen dioxide (NO2), s = 4;
- -
Particulate matter (PM), s = 5;
- -
Carbon dioxide (CO2), s = 6.
Unit emission indicators for these harmful substances have been determined based on extensive research conducted under real-world traffic conditions using onboard testing equipment across various road sections, speeds, vehicle loads, and engine heating characteristics.
The EMITRANSYS ecological project simulation model was developed at PTV VISUM and was adapted by Prof. M. Jacyna’s team at the Warsaw University of Technology, where the results of a multivariate distribution of the traffic flow on the network, taking into account ecological factors, can be obtained [
43]. The demand model for the ecological project includes passenger travel and freight transport demand between network areas in Poland. The traffic volume within the transport and logistics network score is based on the demand for transport services and is expressed in terms of products transported and passengers moved within a given period. Considering the structure of transport means and their average occupancy, traffic volume is converted into the number of cars of different types used for transport. Thus, the nature of transport tasks in the ecological project simulation model is determined by the type of transport (freight or passenger), characteristics or requirements of the transport entity, transport relations, and vehicle type. Since the tool was developed in the PTV Visum environment, freight transport was modeled according to the specific features of this system. Due to the assumed detail of the ecological project simulation model, it was necessary to aggregate stops located in the area of a single transport node, which were the terminals and sorting plants of the LSP enterprises. Public transport was omitted from the simulation model, and only fixed lines of long-distance regular transport were taken into account.
The most general tool for automatic transport network optimization in transport modelling software is the line proposal algorithm for Visum developed by sPTV in 2006 [
44]. This tool applies a heuristic algorithm to an existing Visum network model. The algorithm first generates a palette of candidate routes between pre-selected terminals. These candidate routes are then individually evaluated in Visum, and the route with the highest demand for the LSP is then permanently added to the freight network. The tool requires only a minimal interface, as the algorithm simply inspects the route endpoints (terminals) and initiates their evaluation. All other aspects are handled by Visum, and the algorithm does not modify pre-existing routes. To allocate traffic demand to the transport network in PTV Visum, it is necessary to define allocation criteria. The objective function determines road resistance on network sections and nodes, return relations, and connections between regions in Poland. In the sought-after traffic distribution, the resistance function in the transport network reaches its extreme (maximum or minimum) value. Resistance can be associated with travel distance, travel time, and travel cost. The ecological project uses emissions of selected environmental pollutants and the resulting external costs and/or noise emissions as criteria for traffic distribution. Emission characteristics measured under real-world conditions have been implemented as functional relationships in which the emission intensity of harmful compounds varies depending on vehicle type and speed. When assessing the freight process of an LSP in the case of a sustainable transport system, the emission levels of air pollutants can be an assessment indicator. Among the elements of a sustainable transport system, the following types are distinguished:
- -
Shipper terminals, transport starting points;
- -
Points of change in road characteristics and change in mode of transport from bus to lorry with associated point transport infrastructure (terminals, sorting plants);
- -
Transport destination points, receiving terminals;
- -
Transport links between the above-mentioned points, appearing as an existing linear transport infrastructure with sorting plants;
- -
Means of transport, including economic parameters and characteristics of emitted harmful compounds. The tool for analyzing and evaluating the functioning of the internal systems of the LSP is a model in which the properties of the real system relevant to the research objective must be mapped.
Harmful exhaust emissions depend on vehicle type, technical and environmental characteristics, vehicle age, and the condition of the cargo vehicle. Moreover, emission levels are influenced by vehicle speed, which results from traffic intensity and the technical condition of infrastructure in Poland. Inputs to Visum’s transport models include parcel shipments and a network model of the available transport infrastructure in Poland. As standard practice in macroscopic transport simulations, the parcel transport demand in Visum is aggregated at the zone level (Z = {z1, z2, …, z|Z|}) and given in the form of a send–receive matrix. The transport demand matrix D|Z|x|Z| specifies how many shipments start in zone zi and are transported to zone zj. The freight demand data for consignments are given as separate matrices for PuT and different PrT modes (e.g., cars). It is possible to initially provide parcel carriage as a single matrix aggregating all carriages and then use the mode selection procedure to split the demand into separate matrices for different parcel modes like parcels and general cargo. Therefore, the formula for emission levels considers coefficients dependent on the section where vehicles operate and speed. In this context, the emission level formula takes the following form:
where
ES(s, k) is the total emission of the harmful exhaust component by the k-th transport subsystem (in kg);
xp(p, a, b, st, ne, rs) is the number of s-type vehicles moving on the p-th road in relation (a, b), meeting the ne-th emission standard, and equipped with an rs-type engine (in vehicles);
l(i, i′) is the length of the section (i, i′) of the transport network (in km);
v(i, i′) is the speed of movement on the section (i, i′) (in km/h);
em(
s,
st,
ne,
rs,
i,
i′) is the unit emission of the
s-th-identified harmful compound for
st-type lorries equipped with an
rs-type engine that meets the
ne-th emission standard and moves on the section (
i,
i′) of the transport network, defined per unit distance (in mg/s/lorries). Considering the dependence of emission levels on transport distance (shortest trips generate the highest unit emissions), the emission formula has been reformulated as follows:
where
Ψ(s, st, ne, rs, p, a, b) is the impact of distance on the unit emission volume of the s-th-identified compound for st-type lorries with an rs-type engine meeting the ne-th emission standard, moving in relation (a, b) on the p-th route; other symbols remain as in Equation (1).
Equations (1) or (2), combined with the transport volumes handled by all transport subsystems, allow for the determination of the transport work emission efficiency indicator, which is as follows:
where
ε(s, k) is the emission efficiency of transport work performed by the k-th transport subsystem in relation to the s-th compound (in tkm/t, paskm/t);
q(rt, k) is the transport volume handled by the k-th transport subsystem for the rt-th transport mode (in tons or passengers);
L(rt, k) is the average transport distance within the k-th transport subsystem for the rt-th transport mode (in km); other symbols remain as in Equation (1).
The model includes constraints due to the specific capacity of the road links, entry into the area due to the Euro standard allowed, constraints regarding not exceeding the available number of means of transport at the logistics operators and regarding the type of decision variable for consignments, constraints regarding the possibility of operating routes with vehicles that meet certain emission standards such as city center exclusion, and constraints regarding transport congestion and the fulfilment of transport needs for consignments.
Ecological indicators were taken into account as the basic criteria for evaluating the distribution of the vehicle traffic flow on the transport network of LSP enterprises in Poland in the developed model. The basic criteria for the evaluation of the distribution of the traffic flow in the LSP transport system model are the levels of emissions of individual harmful fumes emitted by means of transport carrying out transport tasks in the selected area of Poland’s LSP transport network. It is assumed that traffic distribution within the transport system of logistics operators serves as the basis for optimizing the organization of traffic flow in the network to shape the sustainable development of the transport system. It is also assumed that the demand for transport services by the logistics operator is predefined in transport relations and remains constant over specified time intervals. The forecasted variables include the transport routes of the logistics operator’s freight flow in specific transport relations, as well as the volume of traffic that flows by moving along particular roads.
5. Discussion and Conclusions
Pro-environmental logistics is a relatively new field, and many of the practical issues involved have yet to be addressed in appropriate, effective ways. Often the LSP, as a logistics network integrator, strives for a sustainable policy, which it presents as green logistics. The development of the LSP’s offer of green logistics practices is a consequence of the tangible results achieved from the green solutions already implemented in the area of the logistics service provided, such as energy- and water-efficient warehouses or packaging. It is therefore possible to speak of a kind of feedback loop between the implementation of green solutions and the resulting economic and environmental effects. Still, problems in the supply chain that are passed on to logistics operators are related to waste management. Furthermore, the Polish LSP market ranges from simple green transport operations with electric vehicles to complex programs related to logistics services for entire supply chains.
Poland, as well as most CEE countries, is not among the beneficiaries of the direction of transformation of economies and transport sectors. The scale of development needs in individual modes of transport is too large, due to the persistence of significant differences from the already achieved state of development of the transport sector in the rest of the EU countries; hence, customers do not notice changes implemented in green logistics at LSPs in the last mile. Nevertheless, the logistics sector has evolved steadily over the decades, but it is particularly affected by current developments. Today, there is a steady increase in global environmental awareness, which is having a significant impact on its transformation, from its traditional form into a greener and more sustainable form.
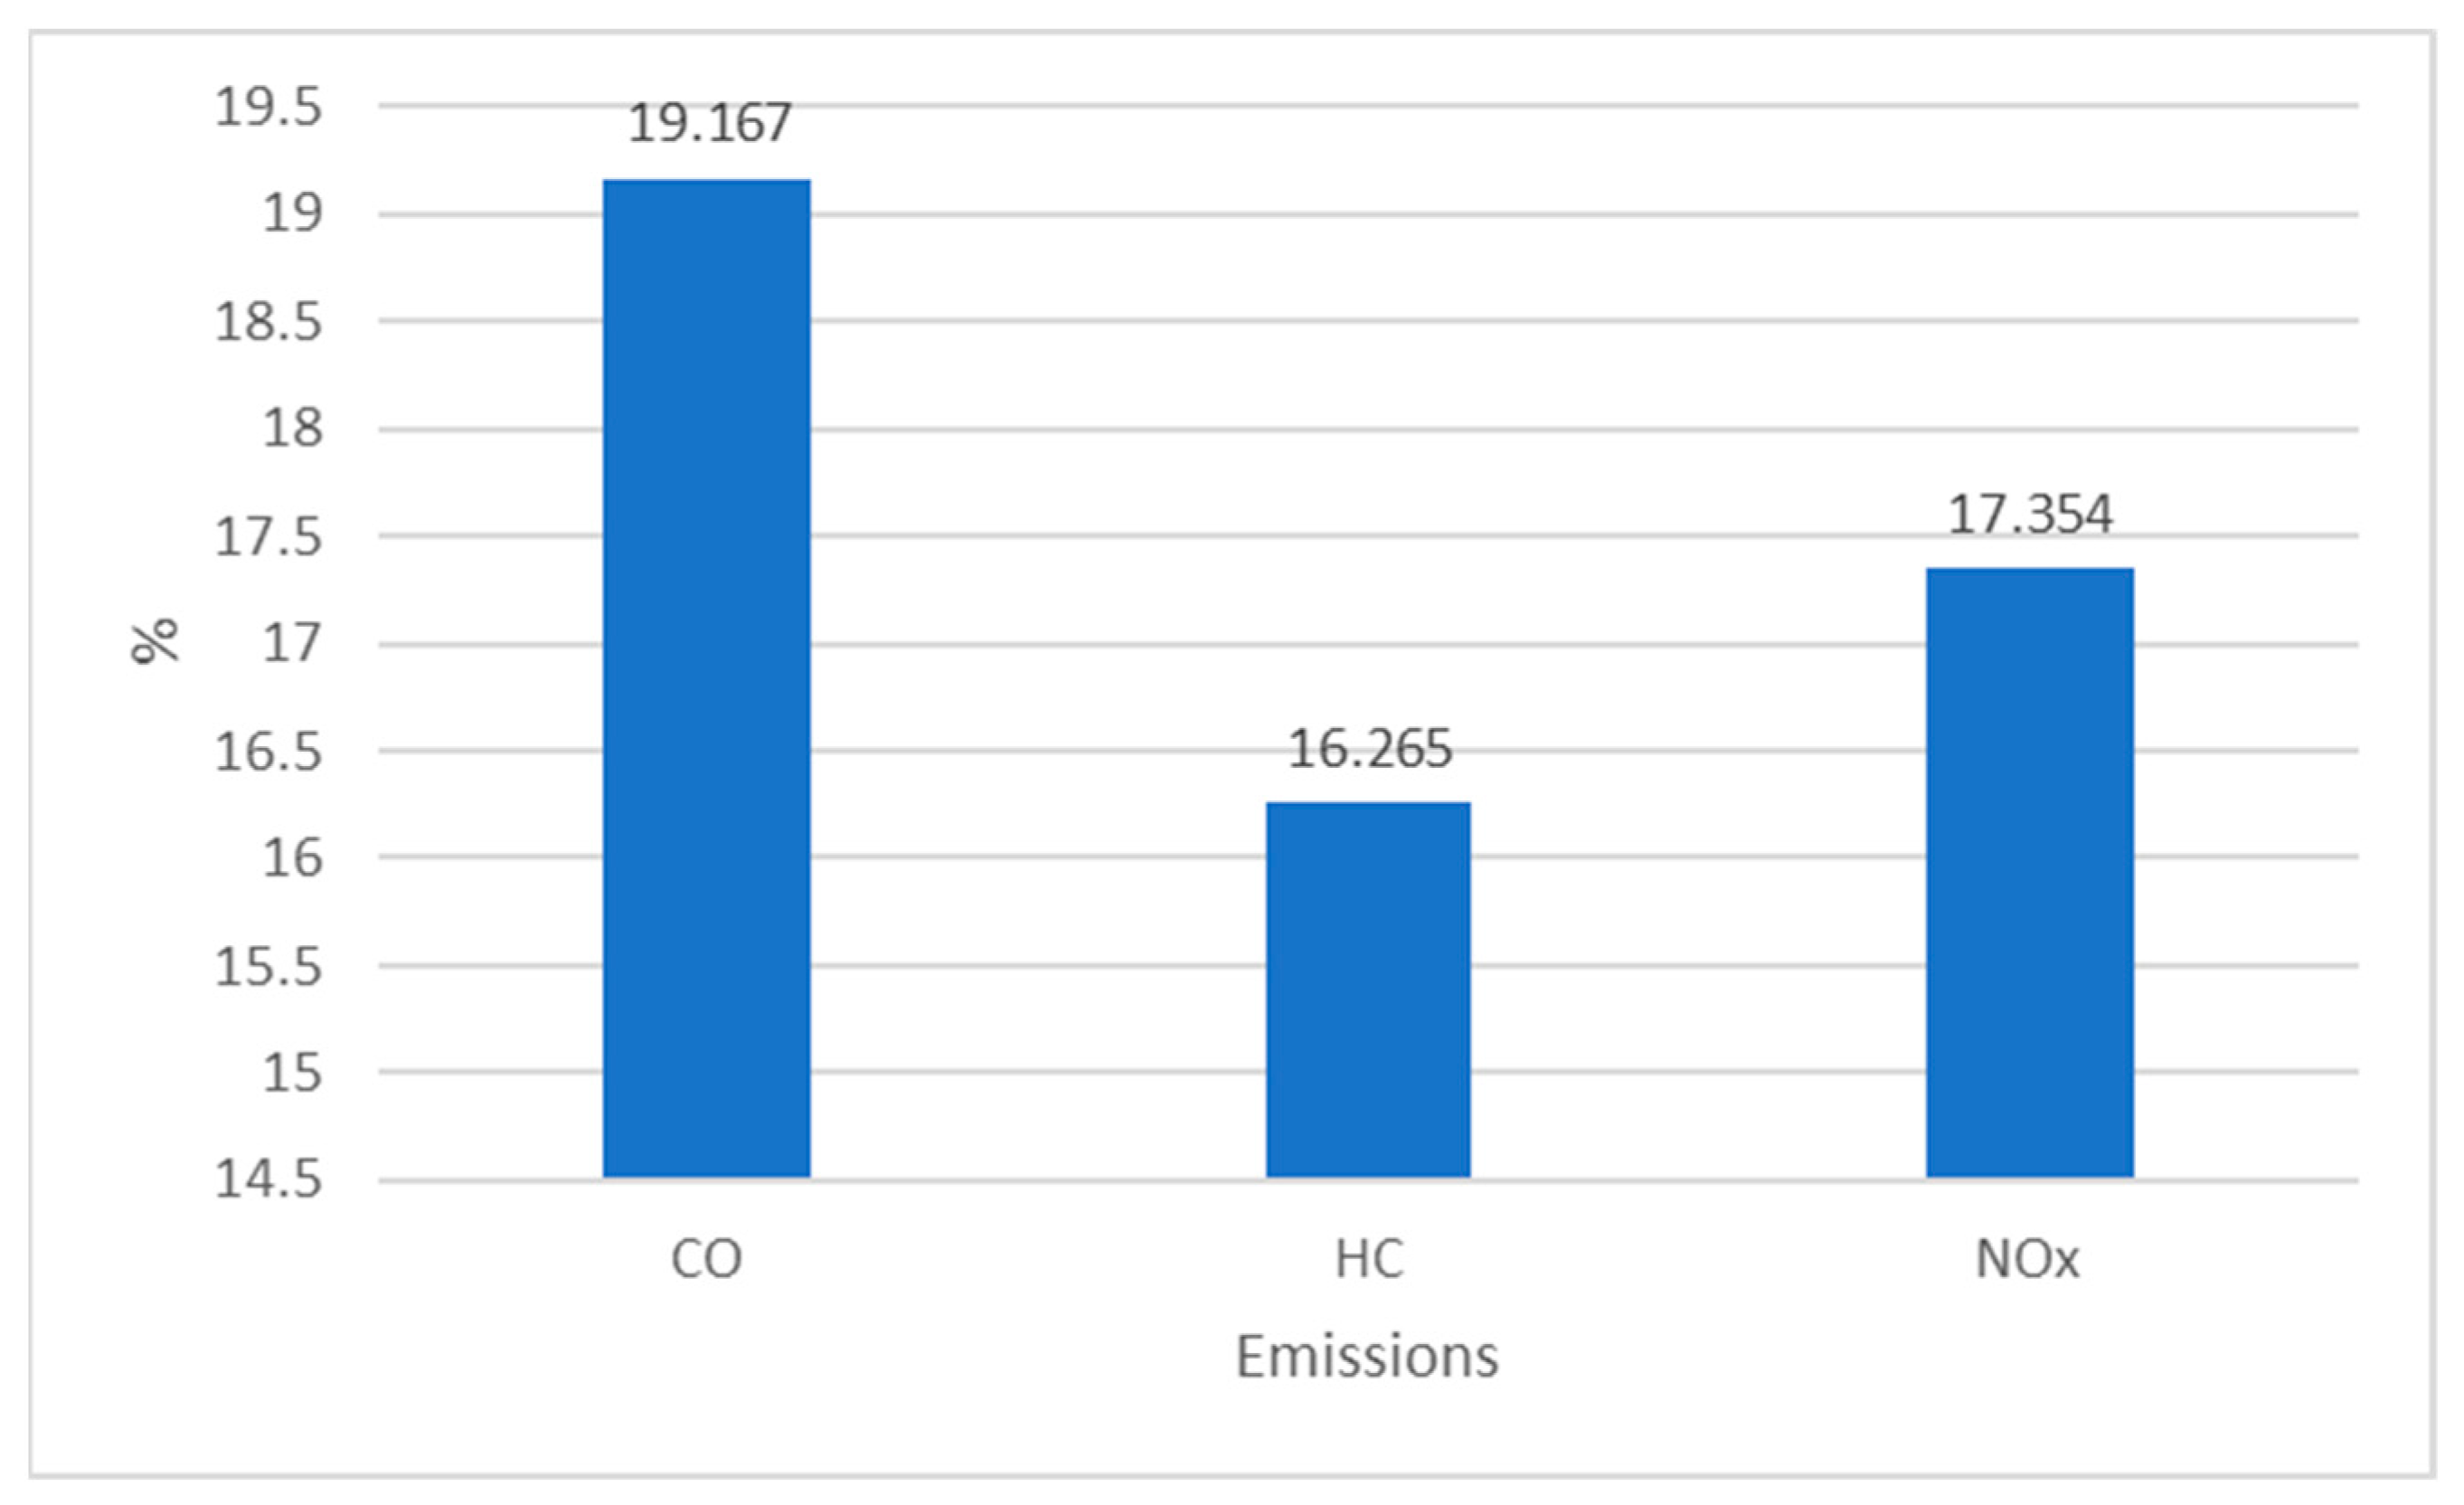
However, against the background of the largest countries, and also the EU economies, Poland stands out in terms of the energy transformation of road transport. In 2023, the share of vehicles with electric, hybrid, or natural gas propulsion in newly registered heavy goods vehicles with a dmc of 16 tons or more in Germany was 2.7 per cent, in Italy it was 2.3 per cent, and it was as high as 7.5 per cent in France. In Poland, it was just 1.1 per cent, below the EU average of 3.5 per cent. Nevertheless, the results for the selected LSPs show an increase in the emissions of all harmful compounds in the analyzed transport system by 2030 in the selected LSPs, as follows: CO, 19.167%; HC, 16.265%; and NOX, 17.354%, due to an increase in the number of goods transported and proportionally less investment in alternative fuel vehicles [
50]. All of the examined major LSP companies are implementing the concept of green logistics (GL) to reduce CO
2 emissions in transportation by exchanging transport means and utilizing renewable energy in warehouses, aiming for zero greenhouse gas emissions. In reality, the pursuit of ecological balance is transforming into a form of management and benchmarking, which for the LSP industry means a change in thinking about services, technologies, procedures, processes, and business models. It should be noted that an untapped gap for LSPs is packaging management, as few associate it with the implementation of GL.
Concepts related to GL and the circular economy, as well as promoting this type of economy among LSP entrepreneurs, are currently crucial. Implementing GL concepts is a challenging task, especially for the LSP sector. The simulation model of the ecological project described in this article is an attempt to address the questions posed by LSPs involved in environmentally friendly solutions. Both the mathematical model and its implementation in PTV VISUM serve as decision-support tools for the development of an eco-friendly transport system at the operational level (within a given region) and the strategic level (influencing the future development of transport fleets). These decisions may concern warehouse infrastructure modernization, traffic reorganization, or legislative restrictions that LSP companies have no direct control over. By implementing the model for selected logistics operators, it is possible to simulate and assess the impact of development decisions and constraints on environmental pollution. The model also takes into account functional dependencies between the technical and organizational consequences of these decisions and the level of harmful exhaust emissions.
The general objective of a sustainable urban transport policy should be to create the conditions for the efficient, safe, and economically effective movement of people and goods within the limits set by the activities available for this, the natural resources, and the possibilities of discharging pollutants into the environment. The most up-to-date EU document on EU transport policy, linked to the revised Europe 2020 strategy, is the White Paper entitled Roadmap to a Single European Transport Area—Towards a competitive and resource-efficient transport system. The document emphasizes the importance of sustainable transport for the development of the EU and the achievement of its strategic goals, and it aims to reduce the EU’s dependence on oil imports and reduce pollutant emissions by 60% by 2050. According to this document, the main objectives to be achieved in the field of transport, including the logistics sector, are to change sustainable propulsion systems, and to optimize the performance of multimodal logistics chains, inter alia, by making greater use of more energy-efficient modes of transport.
At the same time, considering the expected changes in the structure of heavy-duty vehicles in terms of their role in meeting current and projected transport demands, the developed model enables the identification of the predicted impact of road transport by logistics operators on the environment for various transport system development scenarios. Additionally, it can be used to identify noise pollution issues, particularly at a smaller scale, such as in urban areas or traffic zones. This points to the need for us to conduct broader and more in-depth research in the future, covering both medium and small logistics companies and regional areas (provinces). Thus, the future trend in green logistics (GL) appears to be the analysis and evaluation of LSP operations to enhance environmental protection.


