Article

Sustainable Infrastructure Development: Integrating Karst Seepage Field Characteristics with Water Inrush Prediction Models of the Qigan Mountain Tunnel

1
China Railway Eryuan Engineering Group Co., Ltd., Chengdu 610031, China
2
Faculty of Geosciences and Engineering, Southwest Jiaotong University, Chengdu 611756, China
3
Sichuan Province Engineering Technology Research Center of Ecological Mitigation of Geohazards in Tibet Plateau Transportation Corridors, Chengdu 611756, China
*
Author to whom correspondence should be addressed.
Sustainability 2025, 17(10), 4585; https://doi.org/10.3390/su17104585
Submission received: 9 April 2025 / Revised: 12 May 2025 / Accepted: 15 May 2025 / Published: 16 May 2025

Abstract

:
[Objective] This study aims to assess and predict the risks of water inrush and leakage during tunnel excavation in karst regions, where groundwater intrusion poses serious threats to construction safety and long-term hydrogeological sustainability. [Study area] This study is conducted in the Qigan Mountain, involving detailed hydrogeological surveys and hydrochemical analyses to understand the subsurface conditions. [Methods] Numerical simulation methods are employed to model the regional seepage field distribution under natural conditions and two excavation conditions, using MODFLOW. [Challenges] One of the main challenges is accurately estimating tunnel water inflow under varying geological and hydrological conditions. [Results] The simulation results indicate that under excavation with blocking conditions, tunnel water inflow reaches 31,932 m3/d, whereas without blocking, inflow surges to 359,199 m3/d. In contrast, the theoretical calculation estimates a water inflow of 131,445 m3/d, revealing considerable discrepancies between the methods. [Recommendations] These findings highlight an important point of reference for the prevention of water influx in karst tunnel construction.

1. Introduction

As a result of the rapid growth of China’s economy, China has constructed numerous highways, high-speed railways, and hydropower projects, necessitating extensive tunnel excavations [1,2]. Notably, the number of tunnels constructed in karst regions is increasing, constituting half of the total number of tunnels constructed [3,4,5]. According to statistical analysis, water inrush incidents have historically been encountered in karst tunnels, representing one of the most significant geological challenges faced during engineering construction [6,7,8,9]. Tunnel water inrush is a phenomenon in which groundwater suddenly rushes into the tunnel through fractures, faults, karst pipelines, and cystic weathering caves during tunnel excavation or construction [10,11,12,13]. The presence of water inrush not only causes delays to construction timelines, but also poses safety risks in regard to tunnel construction [14,15,16]. On the other hand, the ecosystem and groundwater sustainability are negatively influenced by groundwater drainage in tunnels [17]. Therefore, it is important to understand the changes in the seepage field of tunnel water inflow and predict the amount of tunnel water inflow in a given situation to assess the risk of future water surges in tunnels, to improve construction safety, and to protect the environment [18,19].
Numerous researchers have conducted extensive and varied investigations into tunnel water inrush. The hydrogeological and hydrochemical data on seepage in Seoul subway tunnels were studied, and the characteristic hydrochemistry of seepage in subway tunnels was simulated through a geochemical simulation of redox reactions [20]. The stress, displacement, and water pressure changes were analyzed through a water inrush physical simulation test to reveal the mechanism of water inrush during tunnel construction and to establish the criteria for water inrush [21]. To study the minimum safety thickness under different strata pressure and hydraulic pressures, a series of large-scale model tests have been carried out. The influence of strata pressure and the waterproof-resistant slab thickness on water inrush were analyzed [22]. The phenomenon of the water inrush process at the engineering scale was simulated using the DEM–CFD method, and the formation and expansion process of the dominant channel of water inrush was reproduced. The problems related to parameter selection and quantitative analysis were identified to realize the simulation of the water inrush mechanism [23]. With the continuous development and popularization of groundwater numerical simulation technology, the use of groundwater numerical simulation to simulate the regional seepage field of groundwater has certain practical significance and broad application prospects. The groundwater seepage field before and after tunnel excavation was established using MODFLOW (version: 2005), with data obtained from geophysical exploration and hydrogeological drilling tests, and the results of the study provided evidence and a useful method to quantitatively assess the impact of tunnel excavation on groundwater resources and sustainable usage [24]. Three commonly used modules (CHD, DRAIN, and CFPM1) in MODFLOW were selected and compared to predict the water inflow of tunnels; this study provides theoretical and numerical support for the safe construction of relatively uniform rock mass tunnels in karst areas [24]. A numerical model was formulated to delineate the crucial strata, incorporating both the structural features and mechanical attributes of the floor rock located at the working face of a specific coal mine. This model facilitated the prediction of potential failure modes and contributed to the formulation of guidelines aimed at ensuring safe mining practices above the aquifer [25]. RFPA2D code was employed to simulate the water inrush process triggered by the activation of collapse columns that were fully or partially filled with water. This numerical simulation replicated the entire sequence of events leading to the formation of major water pathways and conducted the channels originating from water-saturated collapse columns [26]. There are many existing methods of predicting the amount of water influx in a tunnel, and improvements to the calculation methods used to produce previous research results are abundant. The effect of decreasing groundwater levels on tunnel water surges was analyzed [27]. A method for predicting groundwater inflow at the tunnel palm scale was proposed and the prediction of groundwater influx in urban tunnels constructed using a tunnel boring machine (TBM) was analyzed [28]. In response to steady water influx occurring in a circular tunnel area, Butscher et al. identified the relationship between the tunnel support structure and the tunnel water influx [29]. Undoubtedly, these studies have revealed the causes and patterns of water inrush, providing methods for water inrush prediction and prevention. In spite of this, there is limited research on the integration of tunnel seepage fields and hydrochemical analysis.
The current research is based on the Qigan Mountain Tunnel project and aims to delineate the hydrogeological conditions of the tunnel area. Hydrochemical characterization is also employed to discern the groundwater evolution pattern, while isotope analysis is utilized to ascertain the source of tunnel water influx. A geologic model of the study area is developed and the seepage field in regard to the plan and profile locations for different working conditions in the region is simulated using MODFLOW. A combination of theoretical calculations and numerical simulations is used to predict and calculate the water influx in different sections of the tunnel, aiming to offer theoretical guidance for tunnel project construction.

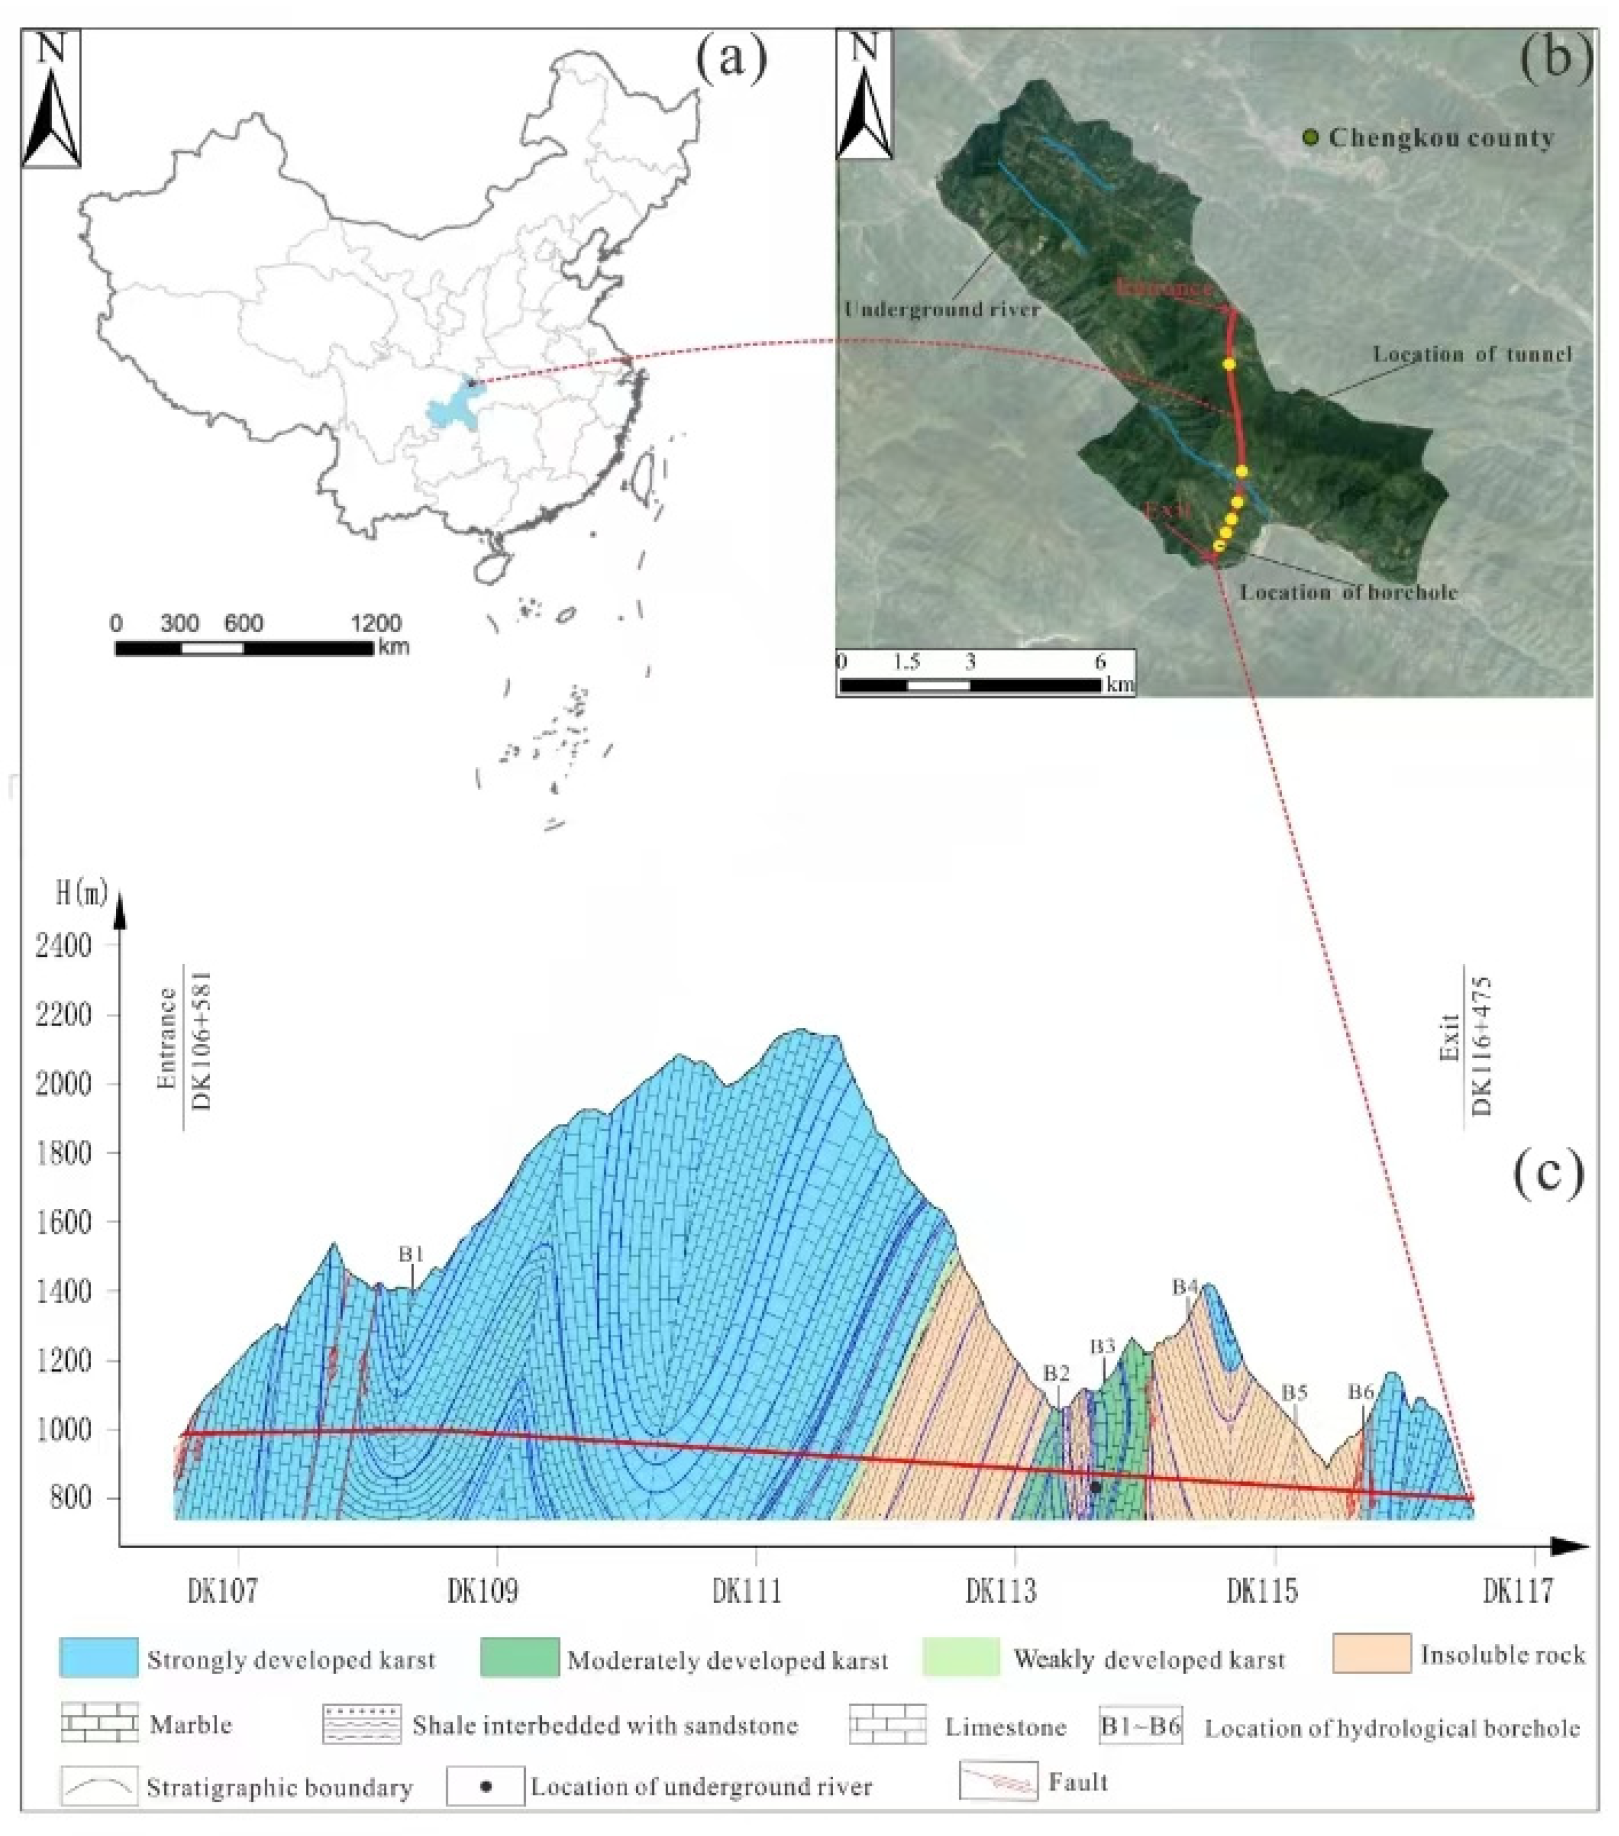
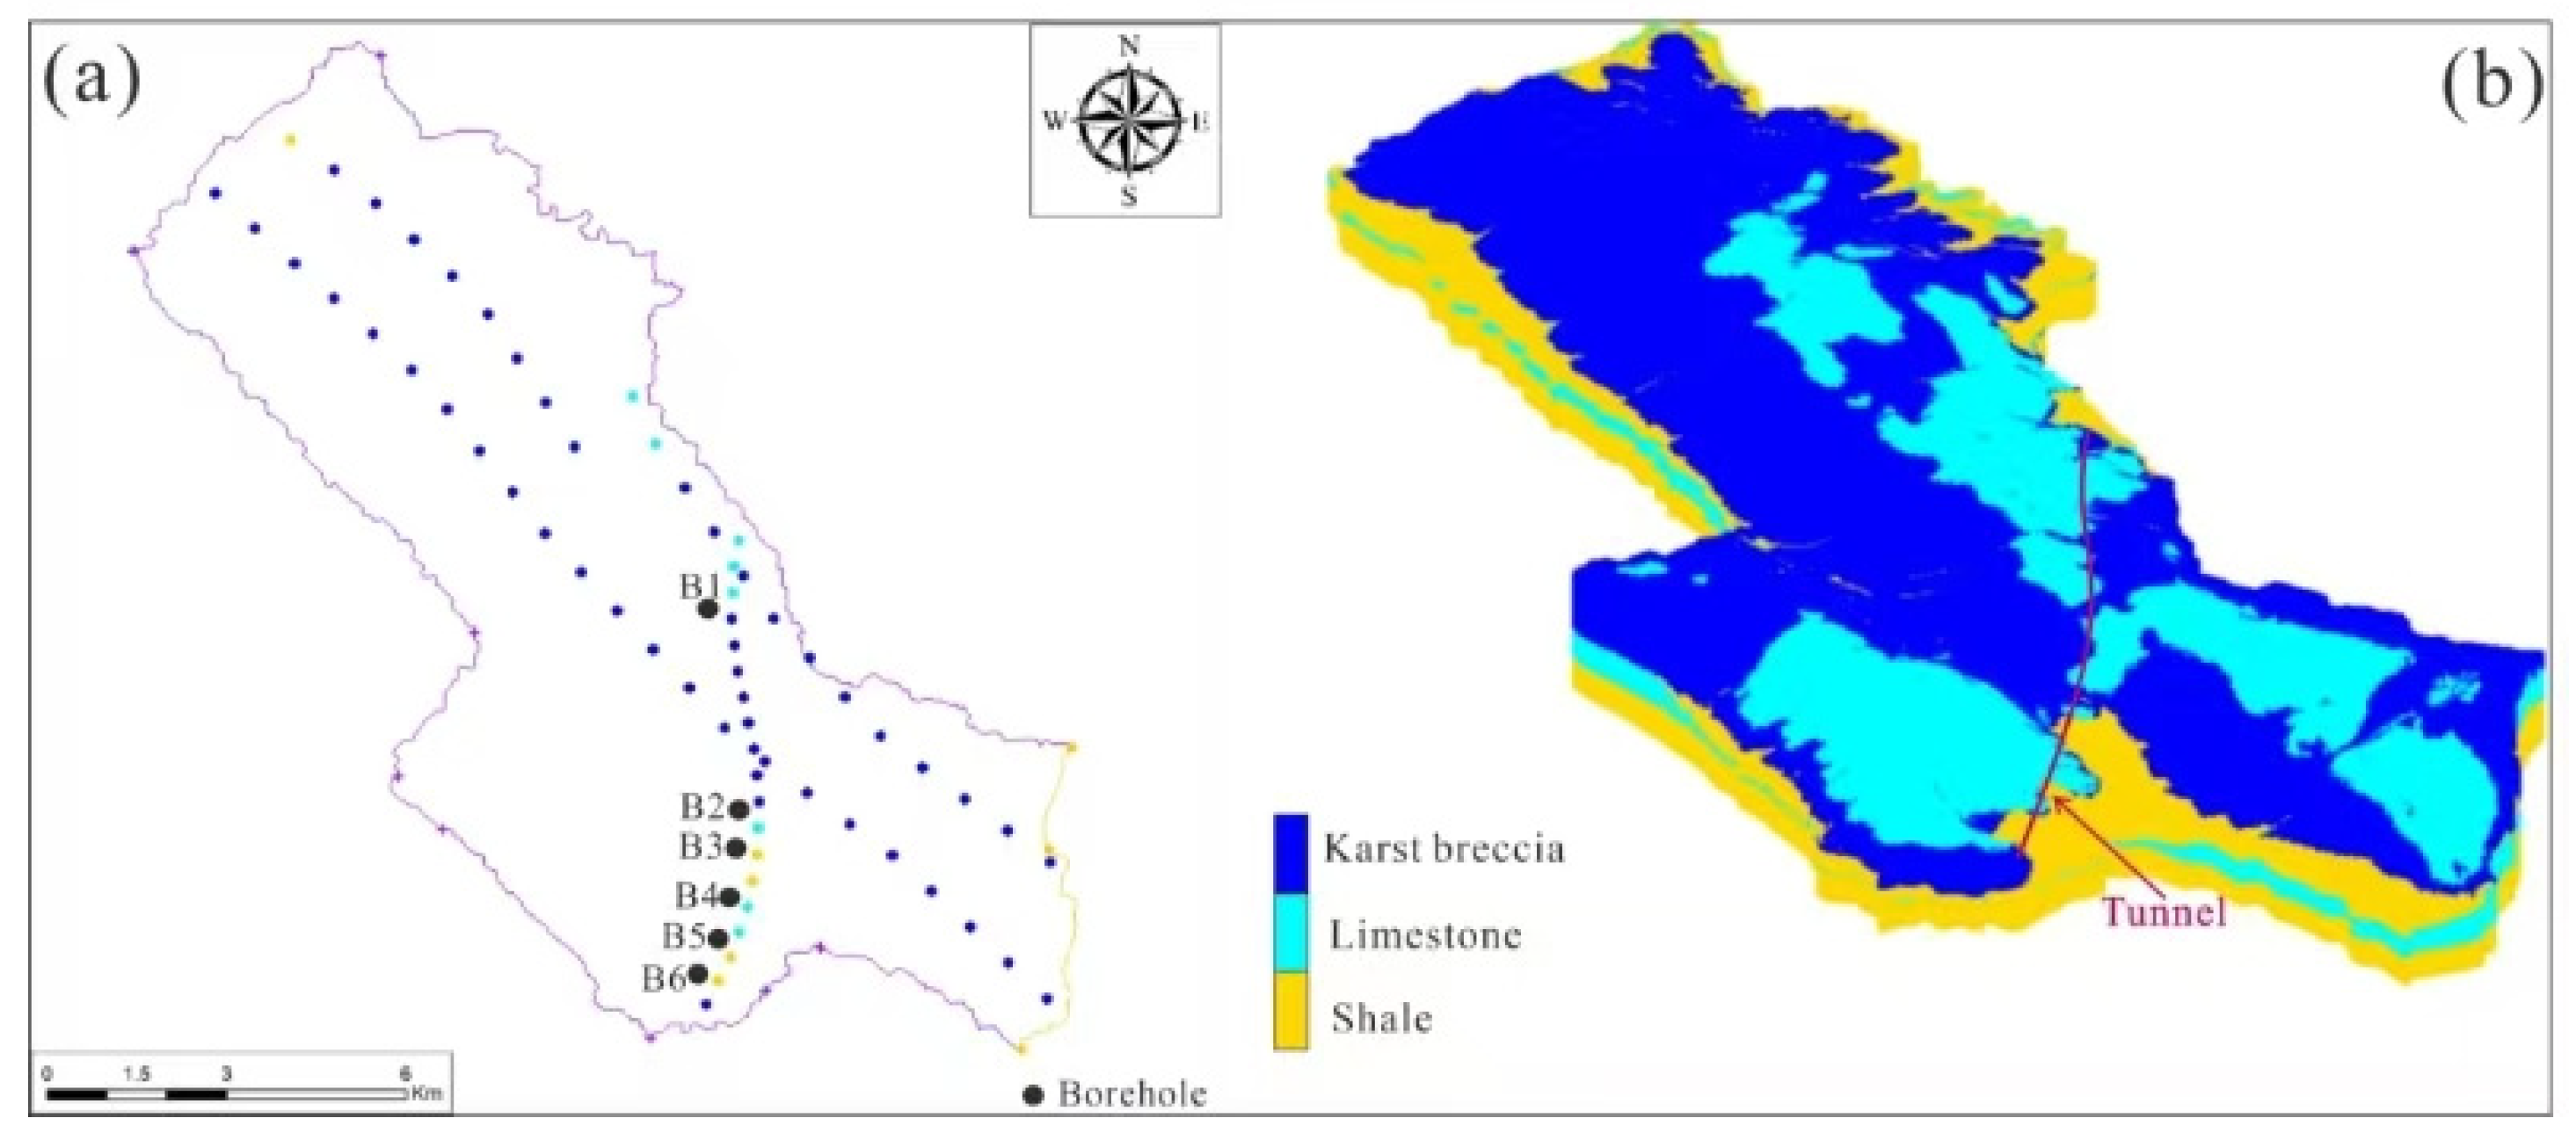
2. Geological Settings

The Qigan Mountain Tunnel is located in Chengkou County, Chongqing Municipality, China. This area belongs to the subtropical mountainous climate zone of the Sichuan Basin [30]. The entrance to the Qigan Mountain Tunnel is situated close to Hekou Village in Gaoyan Town, Chengkou County. It traverses through the Qigan Mountain and emerges in Liaozi Township. With a length of 9894 m, it reaches a maximum depth of about 1200 m. The tunnel alignment intersects the mountain range at a notable angle.
The Qigan Mountain region has been subject to the gradual development of tight linear complex folds and thrust fault structures, resulting from strong compression from north to south. The tunnel area comprises four anticlines, four synclines, and eight faults. Therefore, the lithology and rock properties are significantly affected by the regional tectonic activity. The lithology of the research area exhibits a wide range of variations, primarily comprising Triassic, Permian, Ordovician, and Cambrian soluble rock formations. Furthermore, Silurian sand shale and localized interbedded shale formations are present within the Ordovician series [30,31].
Through the use of lithological analysis in the research area, the groundwater types are categorized into three groups: porous water within Quaternary loose deposits, fractured water within clastic rocks, and karst water within carbonate rocks. Groundwater in the study area infiltrates primarily through the pore space in loose sediments and sinkholes, causing significant dynamic fluctuations. Additionally, data from six hydrological boreholes and sixty-four geological boreholes were utilized to establish the following numerical model. Figure 1 illustrates the location and geological profile of the Qigan Mountain Tunnel.

3. Methodology

We conducted water chemistry analysis and numerical simulations at the tunnel site. Surface water and groundwater samples were collected using professional sampling equipment, and their fundamental chemical and isotope characteristics were tested in a water chemistry laboratory. Subsequently, a numerical model of the tunnel site was developed, using MODFLOW [32] to evaluate the seepage field. Figure 2 shows a flowchart of the applied methodologies in this study.

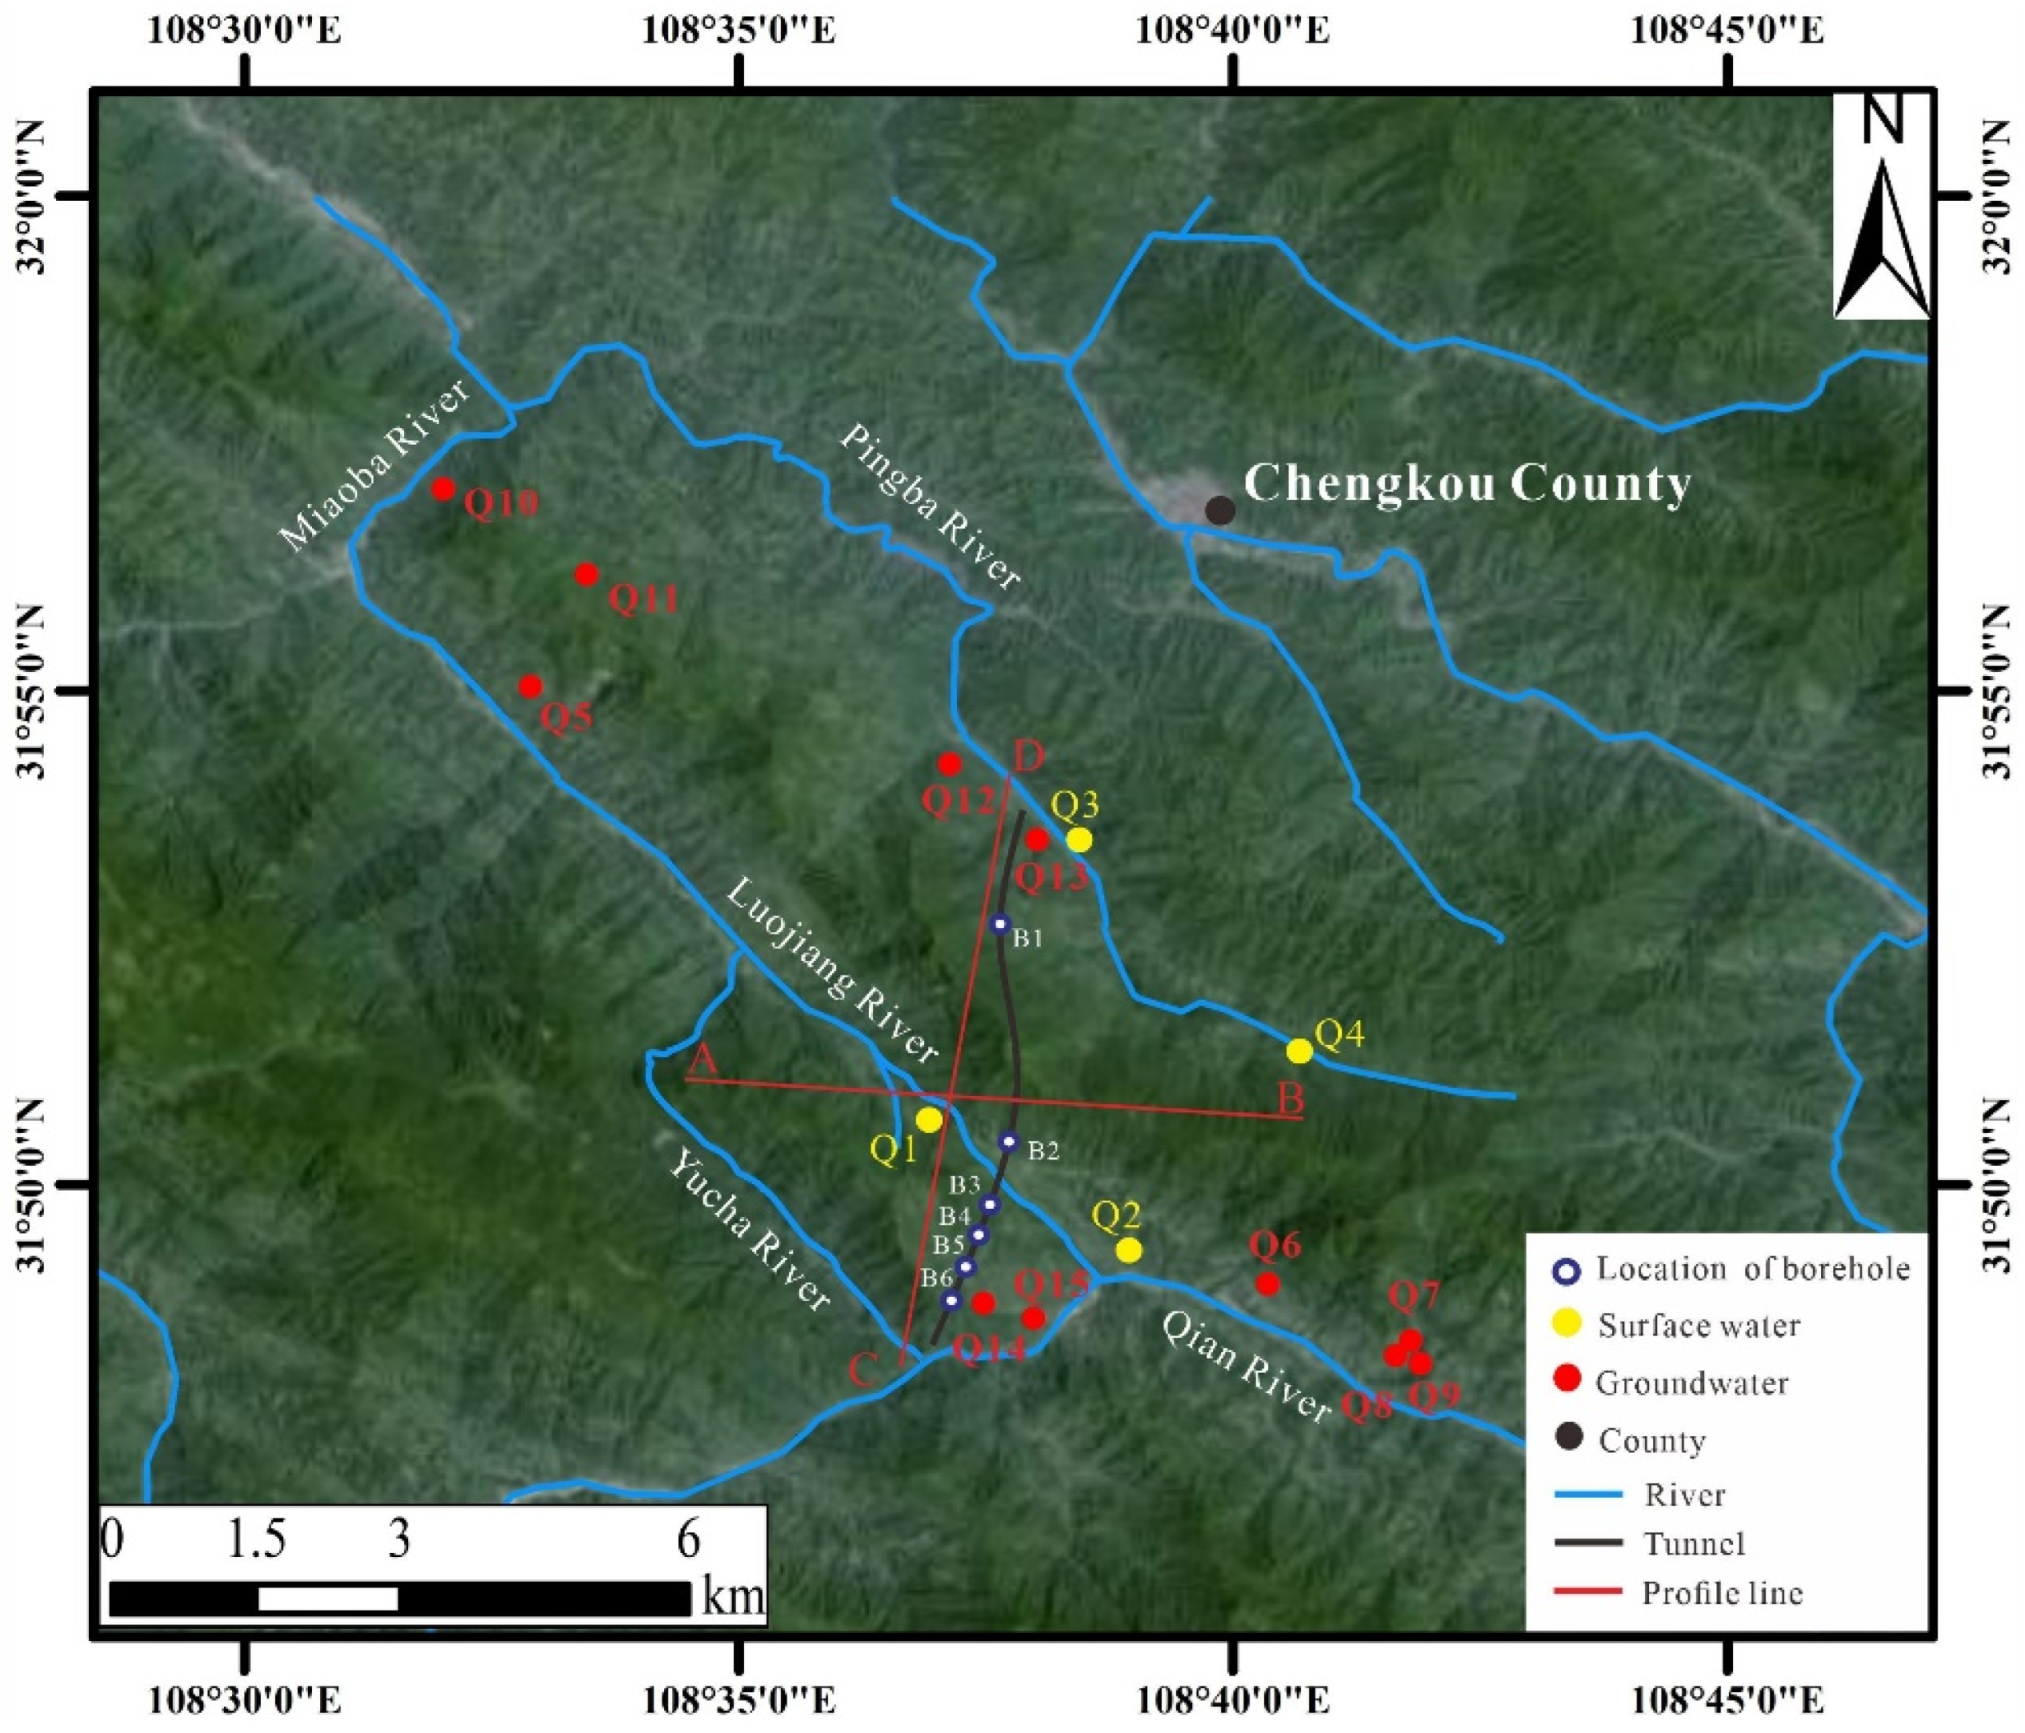
3.1. Water Chemistry Analysis in the Study Area

A field investigation was carried out on both the surface water and groundwater within the research area. Four surface water samples and eleven groundwater samples were collected. The groundwater samples were collected from springs and outlets of underground rivers. To ensure result accuracy, all the samples were collected in 500 mL polyethylene bottles, directly from field water sources, during this study [33]. During the laboratory analysis, all the water samples underwent comprehensive water chemistry and isotope analysis. The testing instruments used include: ICP-OES (Thermo Fisher ICAP 7200 Radial, Thermo Fisher, Waltham, MA, USA) for analyzing the elemental composition of the samples, ICS-2100 (Thermo Fisher, Waltham, MA, USA) for determining anions and cations in the water samples, a pH meter (PHSJ-4F, Shilei-ci, Shanghai, China) for measuring the pH levels of various water types, and a stable isotope ratio mass spectrometer (Nu Perspective Series, Nu Instruments, Wrexham, UK) for measuring the isotope ratios in the samples [33,34,35]. The precise locations of the sampling points are depicted in Figure 3.

3.2. Establishment of Numerical Models

3.2.1. Mathematical Modeling of Groundwater

The fluid in the seepage field follows Darcy’s law, which states that in a connected, saturated reservoir, the velocity of groundwater is determined by the hydraulic head gradient perpendicular to the flow direction. This law explains the dynamics of groundwater movement in a reservoir and serves as a key parameter in the fundamental equations for groundwater flow. The Darcy equation is given as follows (Equation (1)) [32]:
Q = K ω h L
where Q, ω, K, h, and L represent the infiltration flow rate, cross-sectional area, infiltration coefficient, head loss, and seepage pathway, respectively.
The fundamental equation governing groundwater flow describes the state and variations of groundwater movement using a mathematical model. In accordance with Darcy’s law, the three-dimensional groundwater flow differential equation chosen for this simulation is (Equation (2)) [32]:
x k x x H x + y k y y H y + z k z z H z + q = 0
where H and q represent the head and source–sink term flow rate, respectively; and kxx, kyy, and kzz represent the components of the permeability coefficient in the x, y, and z directions, respectively.

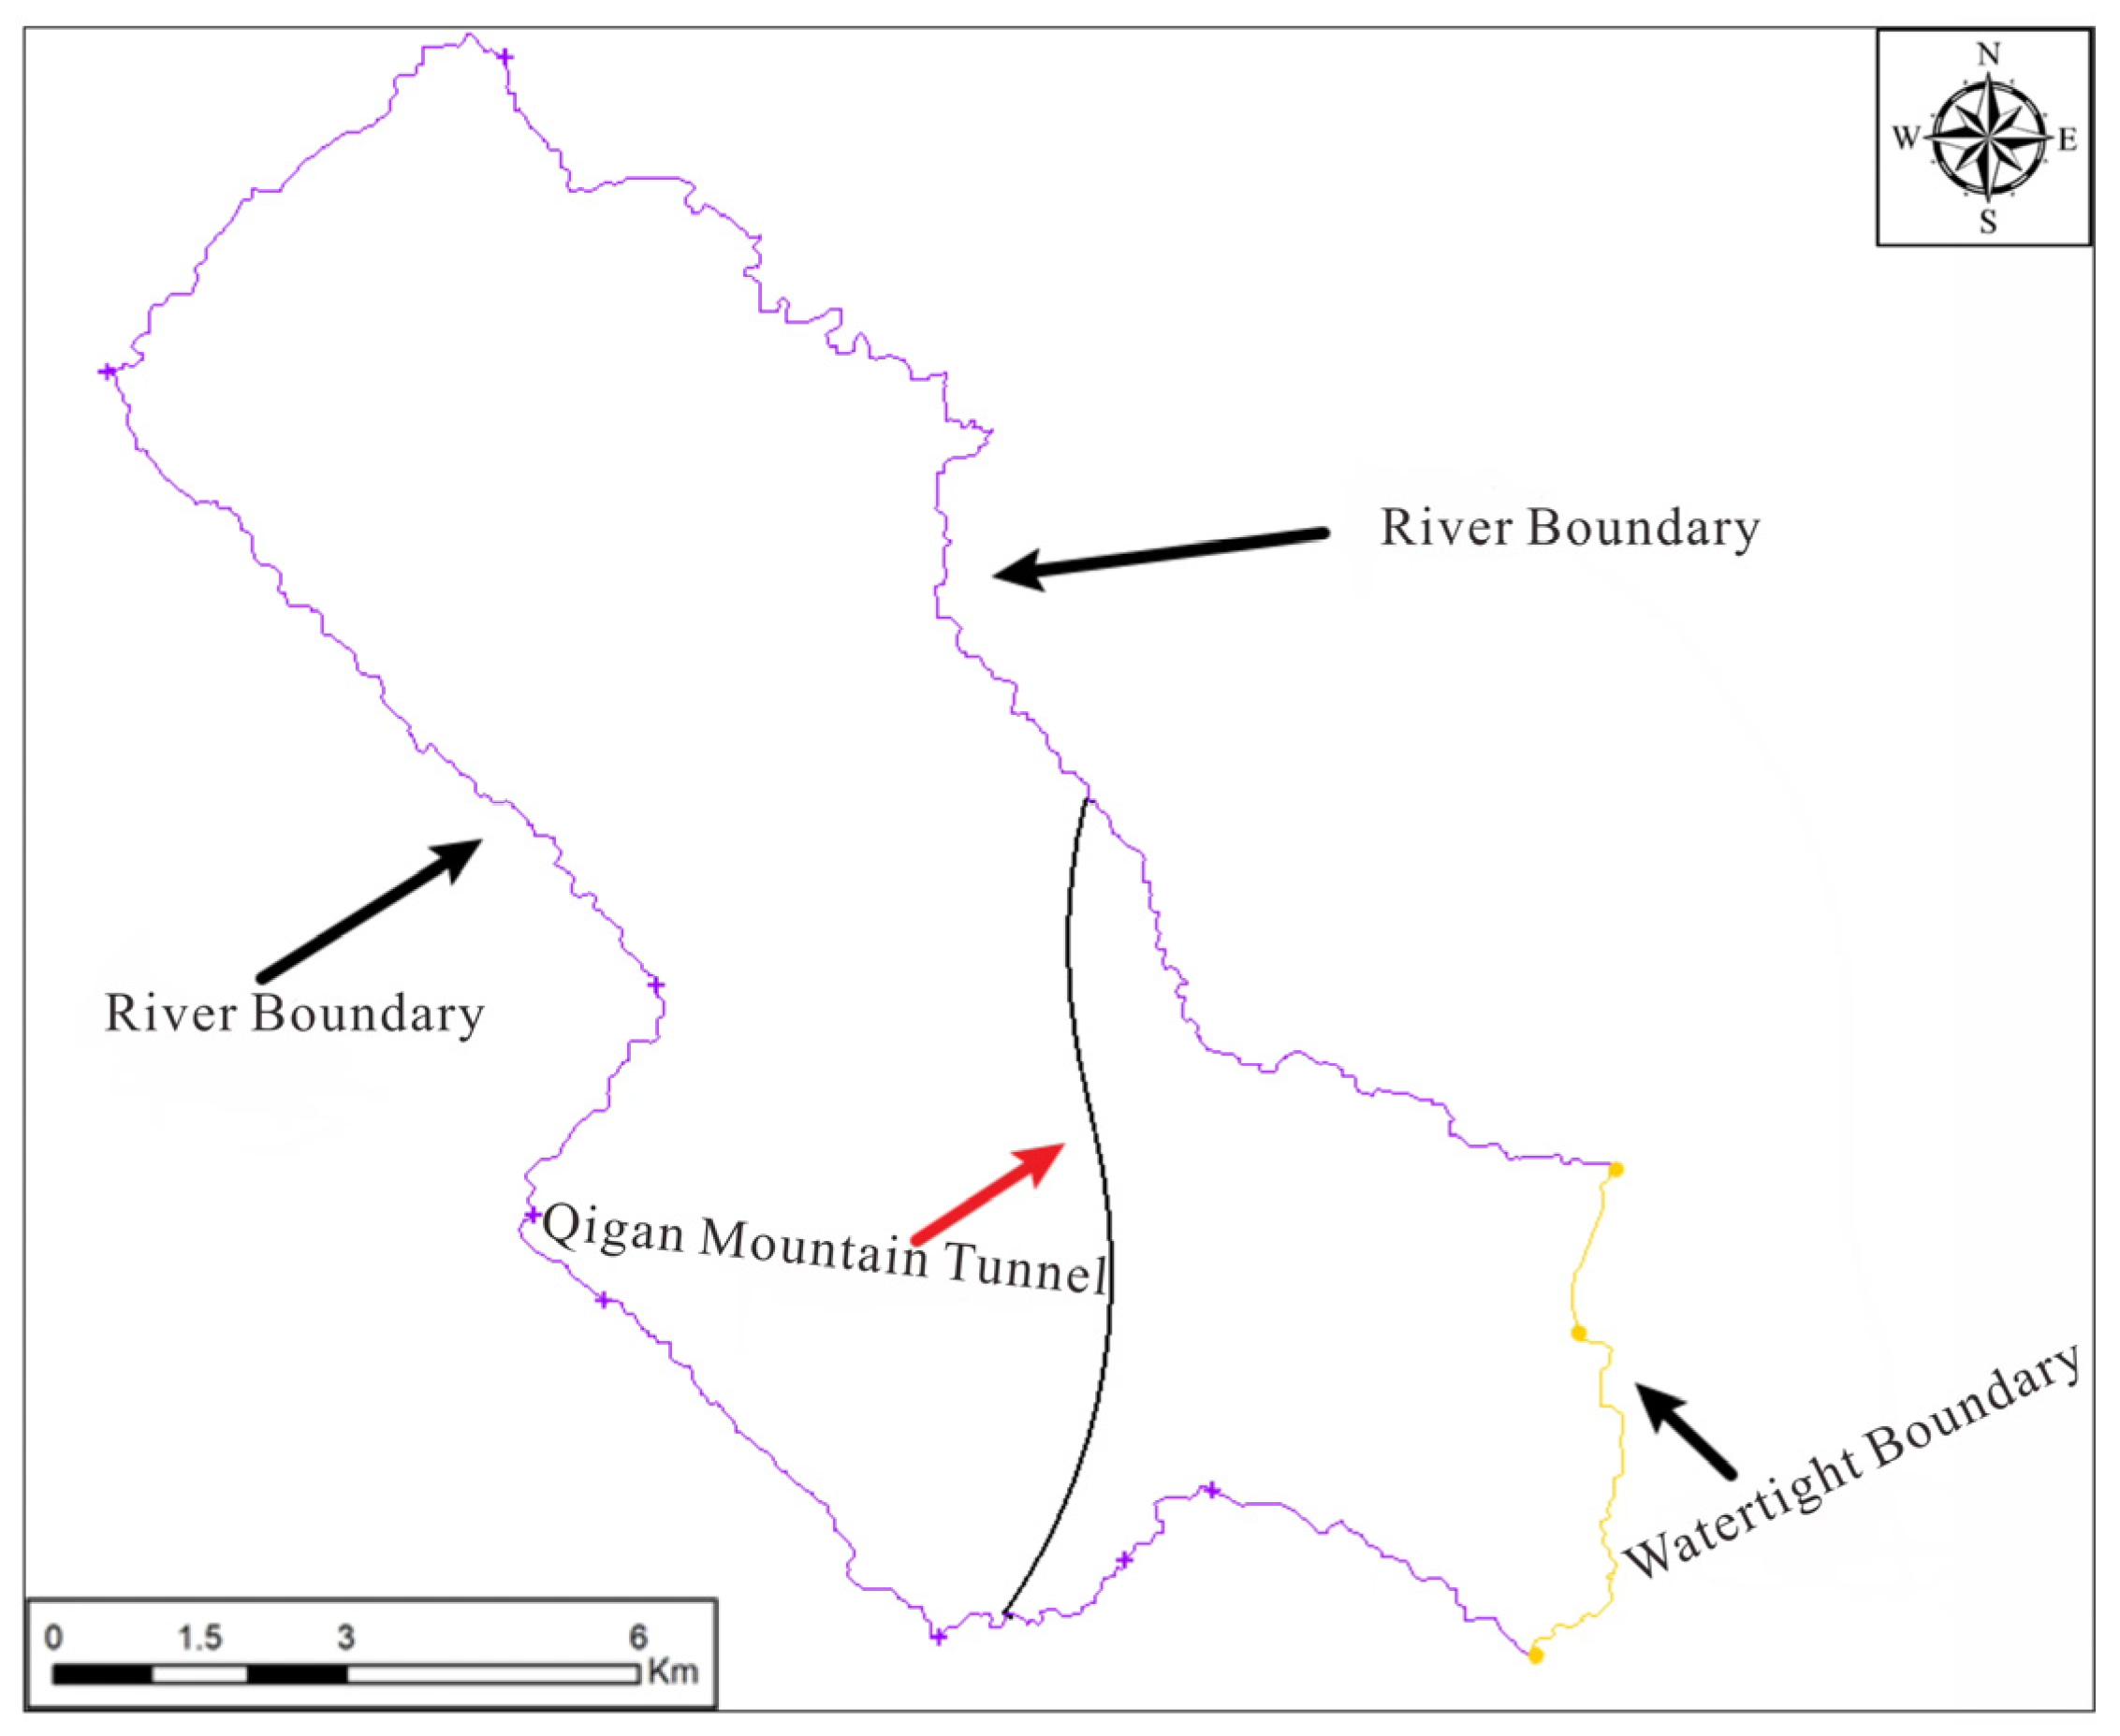
3.2.2. Model Scope and Boundary Condition Generalization

Establishing a hydrogeological model requires the boundary range to be defined including both the tunnel and the hydrogeological units affected by it, thereby ensuring the establishment of an independent hydrogeological system. When constructing the model, priority should be given to natural boundaries, such as surface water bodies, faults, and watersheds, as boundary conditions. Rivers, including the Pingba River, Miaoba River, Dongxi River, Yucha River, and Qian River, are identified as specified-head boundaries, based on their hydrogeological characteristics, with a small watershed in the southeast serving as a watertight boundary. The regional scope encompasses an area of 145.89 km2, with the model boundaries depicted in Figure 4.

3.2.3. Construction of the Geological Model

Using geological borehole data obtained from regional surveys and tunnel cross-sections, a 3D geological model of the study area was established, using linear interpolation. The 3D geological model contained some discrepancies in the stratigraphy. To rectify these discrepancies, the model was corrected by comparing it with the geological plan of Chengkou, with the aim of accurately representing the geological conditions of the study area. The geologic model is divided into six layers using interpolation and the finalized 3D geological model is depicted in Figure 5.
Following the construction of the three-dimensional geological model, the subsequent step entails establishing a 3D model for spatial discretization. The study area is subdivided into a grid measuring 300 × 300 × 6. Subsequently, the geological model is imported into it. After trimming the grids outside the boundaries, a total of 379,482 active grids remain.

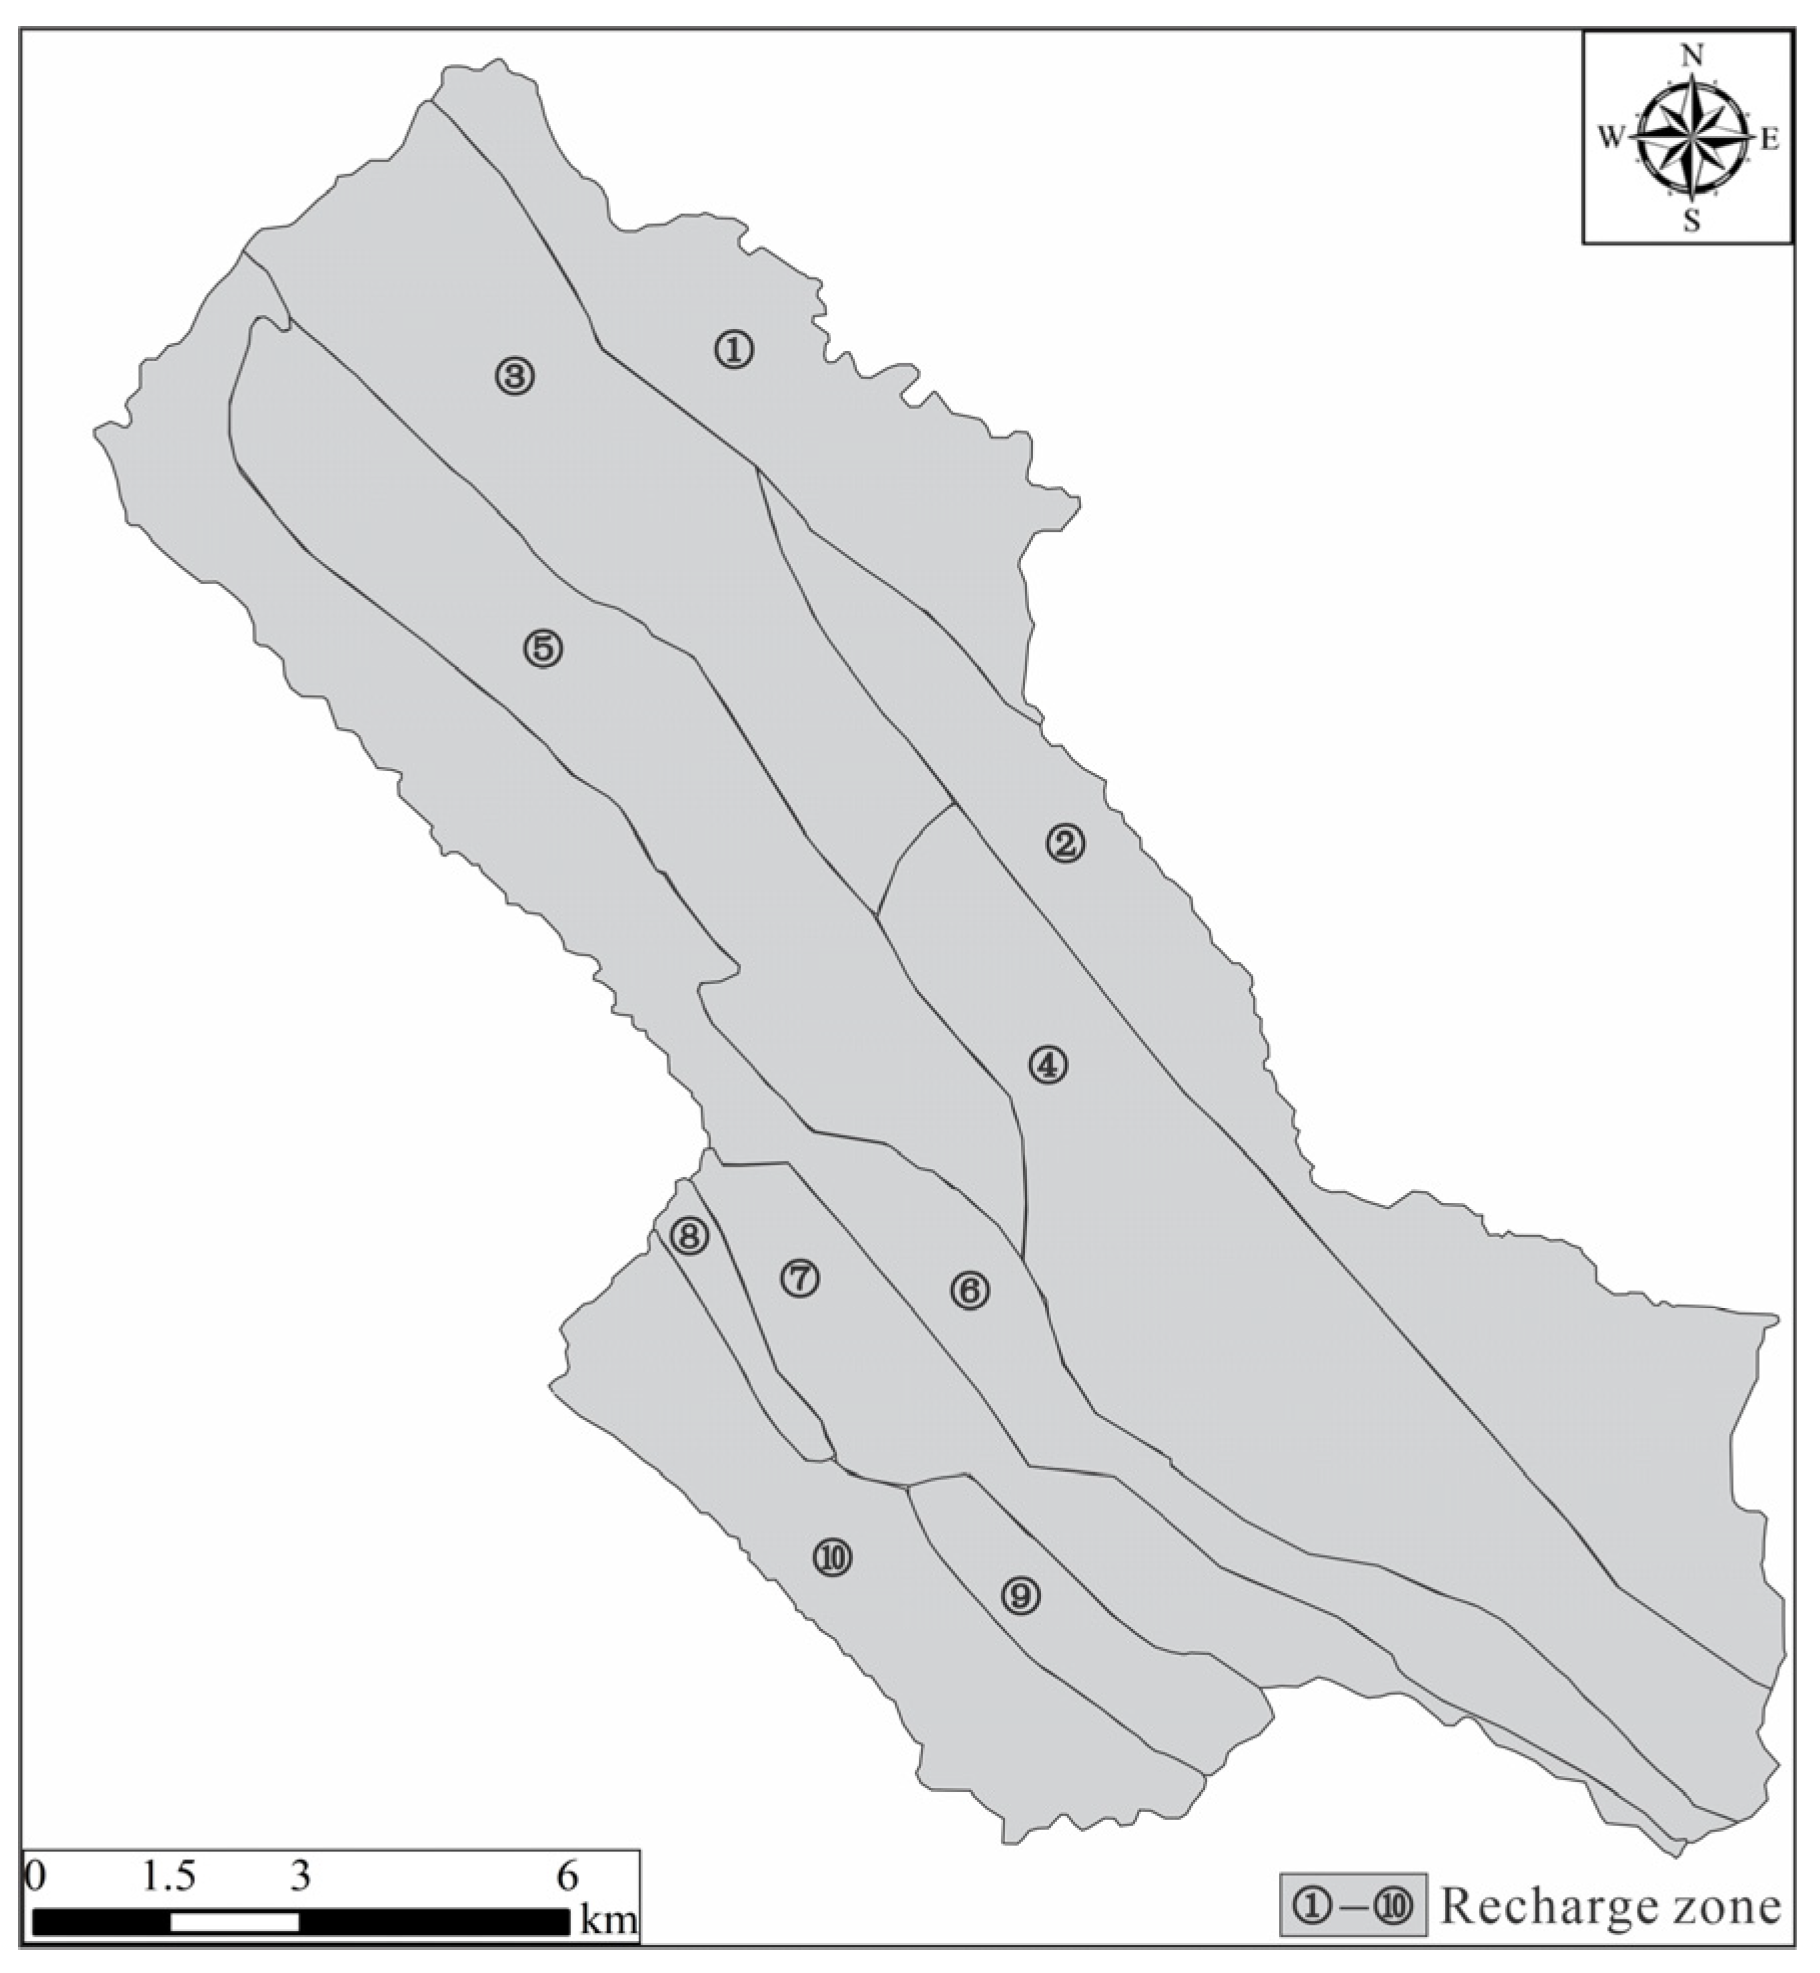
3.2.4. Rainfall Recharge Zone

In this simulation, rivers serve as boundary conditions and are designated as specific head boundaries (Dirichlet boundary condition), while watersheds are treated as no-flow boundaries. Rivers within the region are classified as general head boundaries, and the tunnel is represented as a drainage ditch model. In the study area, faults play a crucial role in the formation of underground rivers, extending along fault surfaces and exhibiting parallel distribution characteristics. Consequently, in this model, faults and underground rivers are collectively treated as rivers and incorporated into the model. Additionally, the recharge boundary is delineated based on hydrogeological units.
The subsequent hydrochemical analysis reveals that groundwater in the tunnel area is predominantly recharged by atmospheric precipitation. This model defines recharge by assigning infiltration coefficients to the top layer of the model and divides the study area into 10 infiltration recharge zones. These zones are delineated based on the collection of regional meteorological data and the division of hydrogeological units. The precipitation recharge zoning map of the study area is depicted in Figure 6. The specific infiltration coefficients for each zone were determined during the calibration process, based on the observation borehole water levels (Section 3.2.5), which are shown in Table 1.

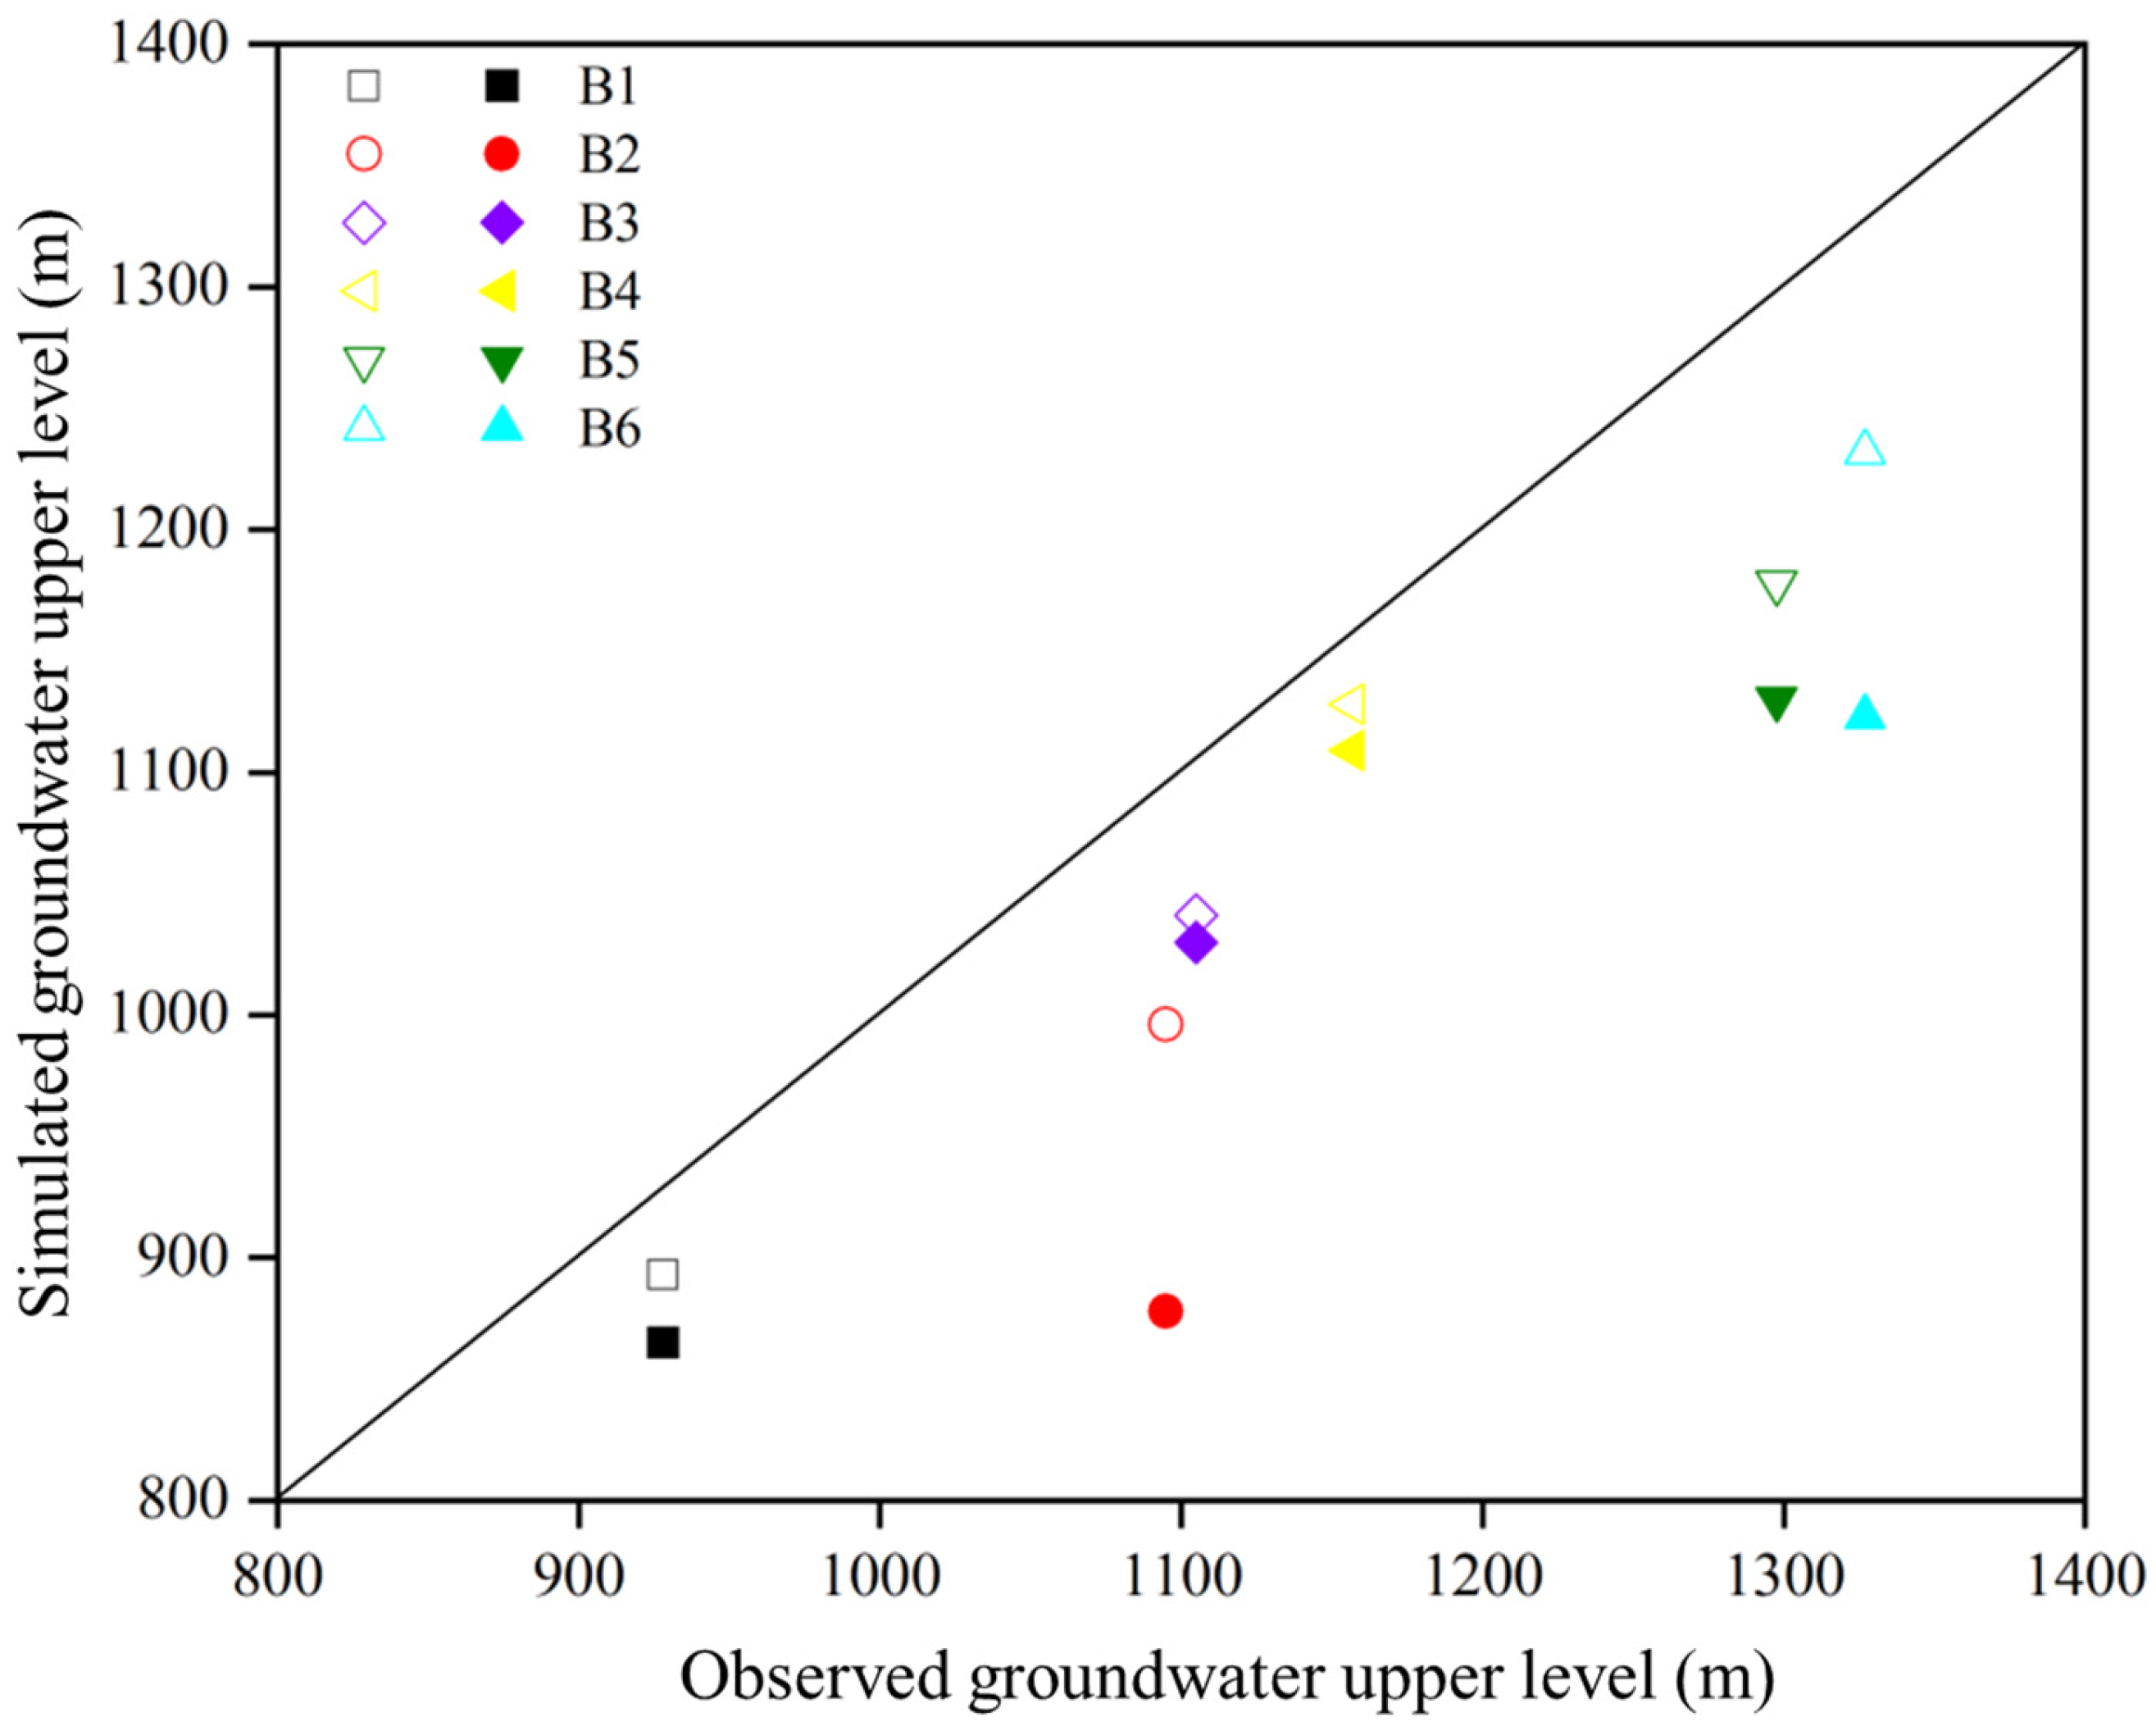
3.2.5. Observation Borehole Water Level Fitting

Borehole water levels serve as crucial indicators for verifying the simulation accuracy of the model at local points. Six hydrological boreholes with stable groundwater levels in the area were included as observation points in the model. Simulated head changes were compared with actual observed values to validate the model’s local simulation accuracy. The error values for each observation borehole vary considerably.
After adjusting the permeability coefficients of each aquifer, the corrected values of the borehole water level errors are presented in Table 2. Following the correction, the simulated water levels in the boreholes are relatively lower, and the relative errors are within 1.5% of each other.

4. Results and Discussion

4.1. Identification of Water Inrush Sources

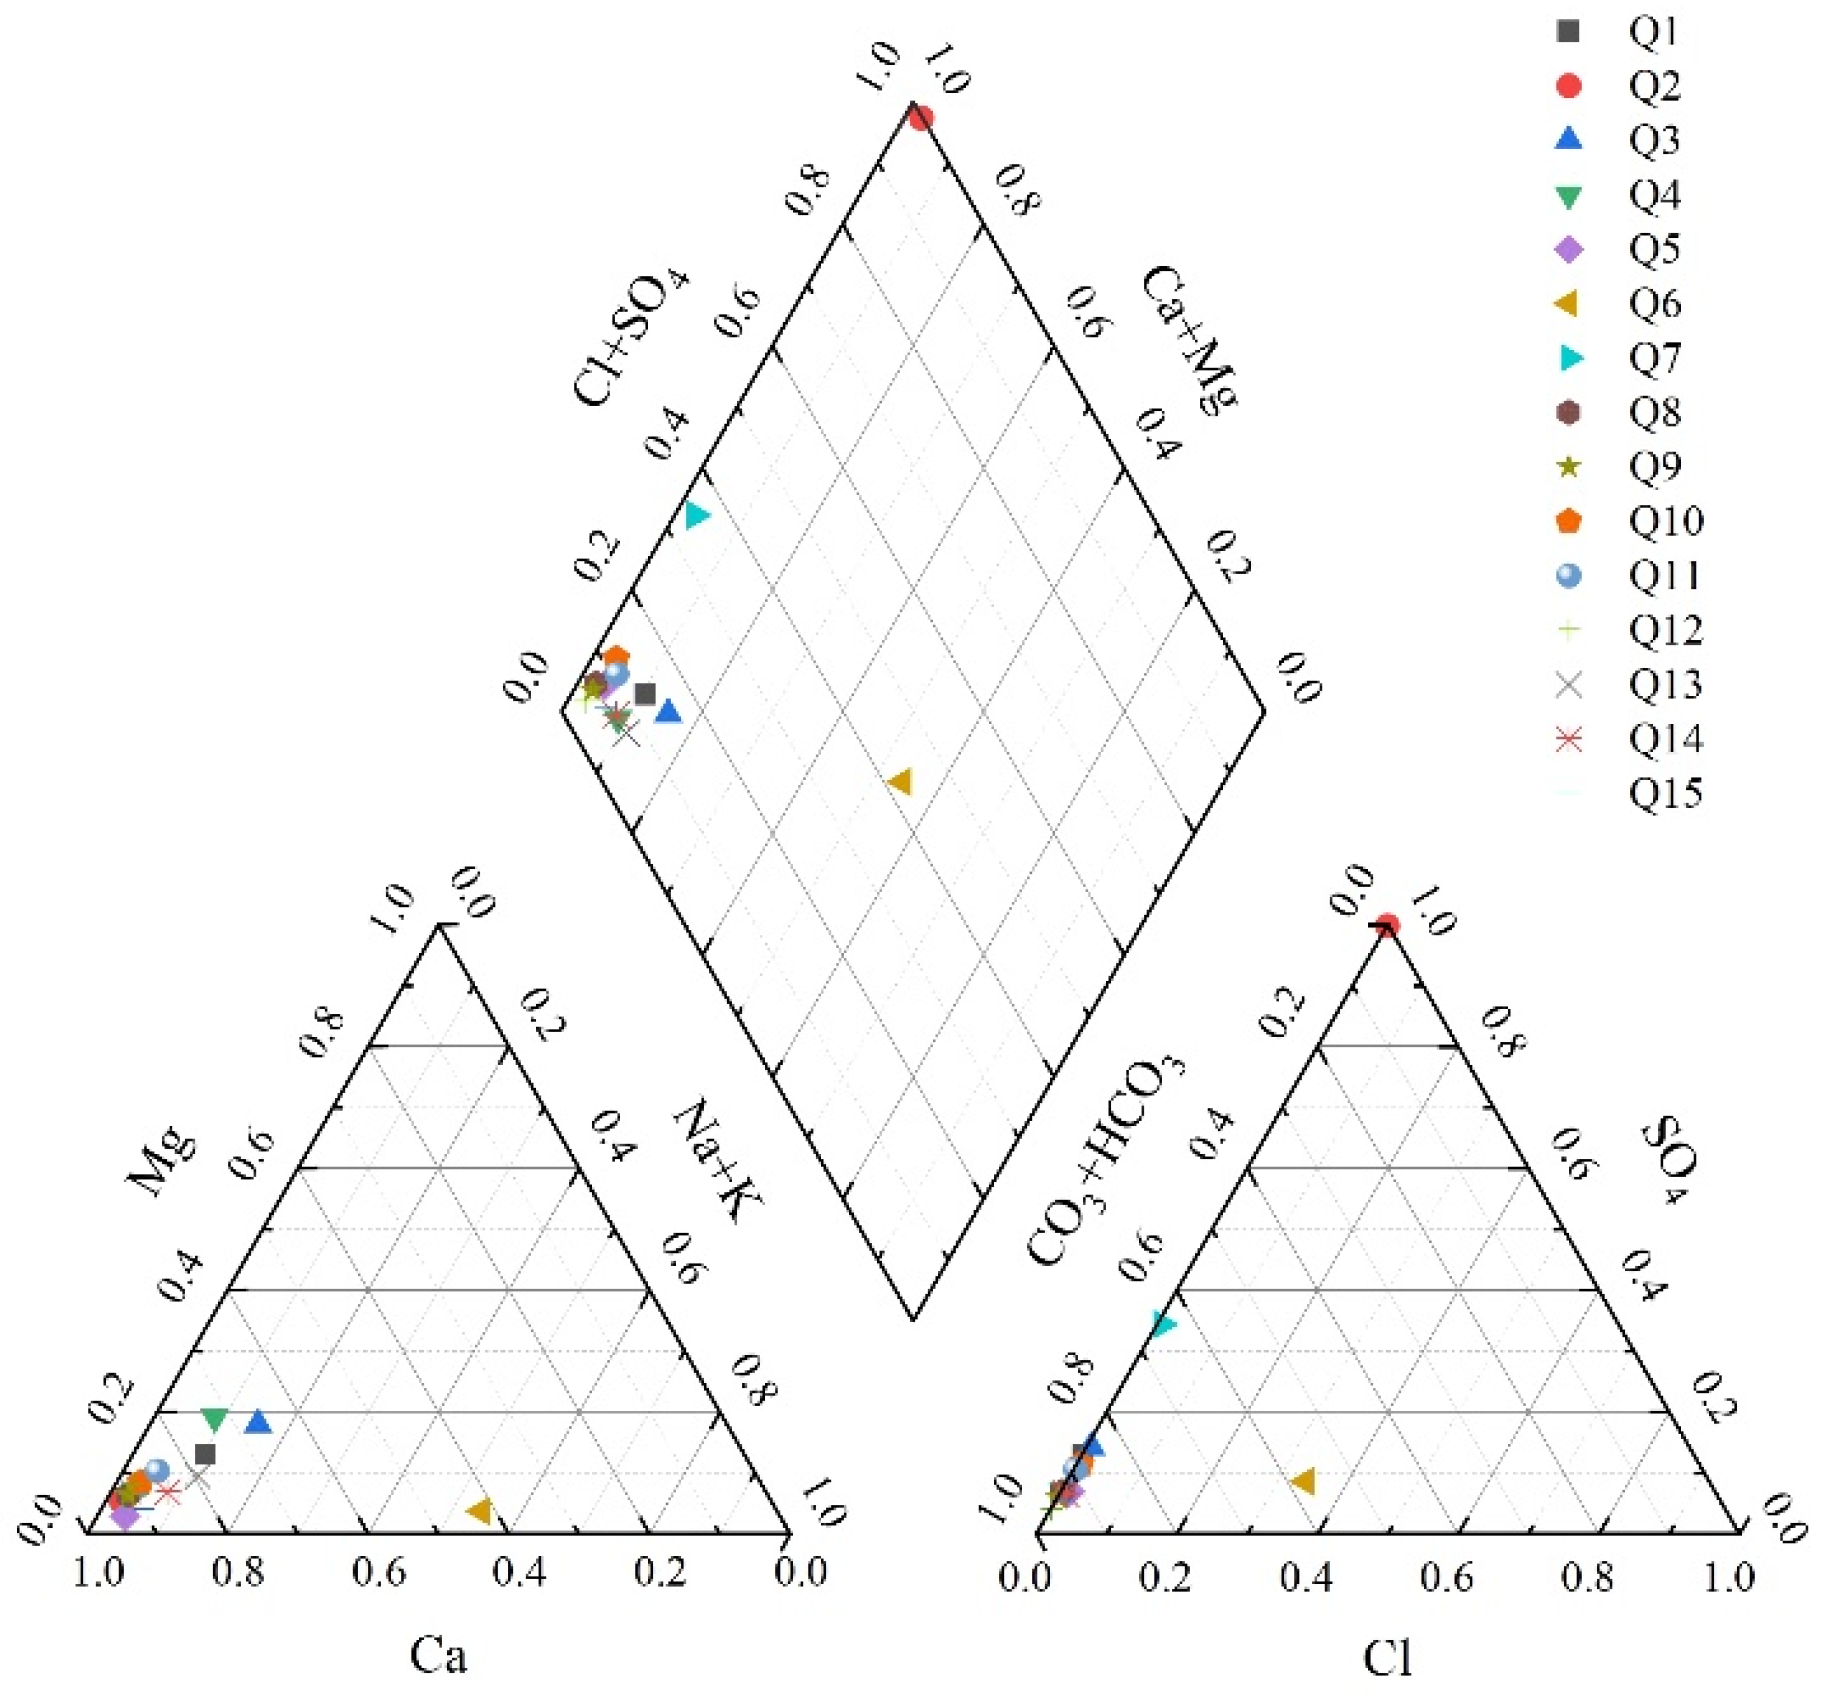
4.1.1. Water Chemistry Types and Distribution Patterns

To identify the hydrochemical types of different water sources in the study area, we conducted measurements of the major cation (K+, Na+, Ca2+, Mg2+) and anion (Cl, SO42−, HCO3−) concentrations, as well as δD and δ18O values.
After converting the ion concentration units to equivalent concentration percentages, the water chemistry types were analyzed. As shown in Figure 7, the majority of the groundwater exhibited Ca–HCO3 type characteristics, while the surface water displayed Ca–Mg–HCO3 type characteristics.
The chemical properties of both groundwater and surface water are influenced by multiple factors. Surface water is mainly derived from precipitation and surface runoff, and its chemical composition is greatly affected by environmental factors. Ca–HCO3 type groundwater is generated through the interaction of groundwater with carbonate minerals. In carbonate rock areas, groundwater frequently interacts with these rocks, leading to dissolution and resulting in elevated concentrations of Ca2+ and HCO3 ions, thereby forming Ca–HCO3 type water.
In this study, Q6, Q7, and Q2 exhibit different hydrochemical types, namely the Na–Ca–HCO3–Cl type, Ca–HCO3–SO4 type, and Ca–SO4 type, respectively. By integrating field sampling and analyzing regional hydrogeological features, Q6, which traverses a construction area during runoff, exhibits variations in its ion concentrations, which is attributed to external factors. Q7 represents water from fractured rocks, undergoing displacement reactions with rocks along the runoff pathway, particularly with sulfate-bearing minerals, resulting in notable alterations in its SO42− concentrations. Q2 is impacted by pollution from mining areas in the upstream region of the surface water, containing significant levels of Ca2+ and SO42− ions, thus defining its hydrochemical composition.
The stress values in the vicinity of a fault are significantly lower than those in the adjacent regions of undisturbed rock, due to stress release resulting from fault evolution and activity, as well as the weakening of the physical mechanical properties of the rock mass near the fault. As one moves away from the fault zone, this influence gradually diminishes. Near a fault, rocks typically undergo fracturing and displacement, leading to the accumulation and release of stress, thereby causing a pronounced stress concentration at the fault’s terminus.
As can be seen from Figure 7, the maximum horizontal principal stress, vertical principal stress, and minimum principal stress all change significantly near the fault. The stress in the fault center position is significantly lower than that on the two sides of the fault, and the stress value gradually increases as the observation point moves away from the fault.

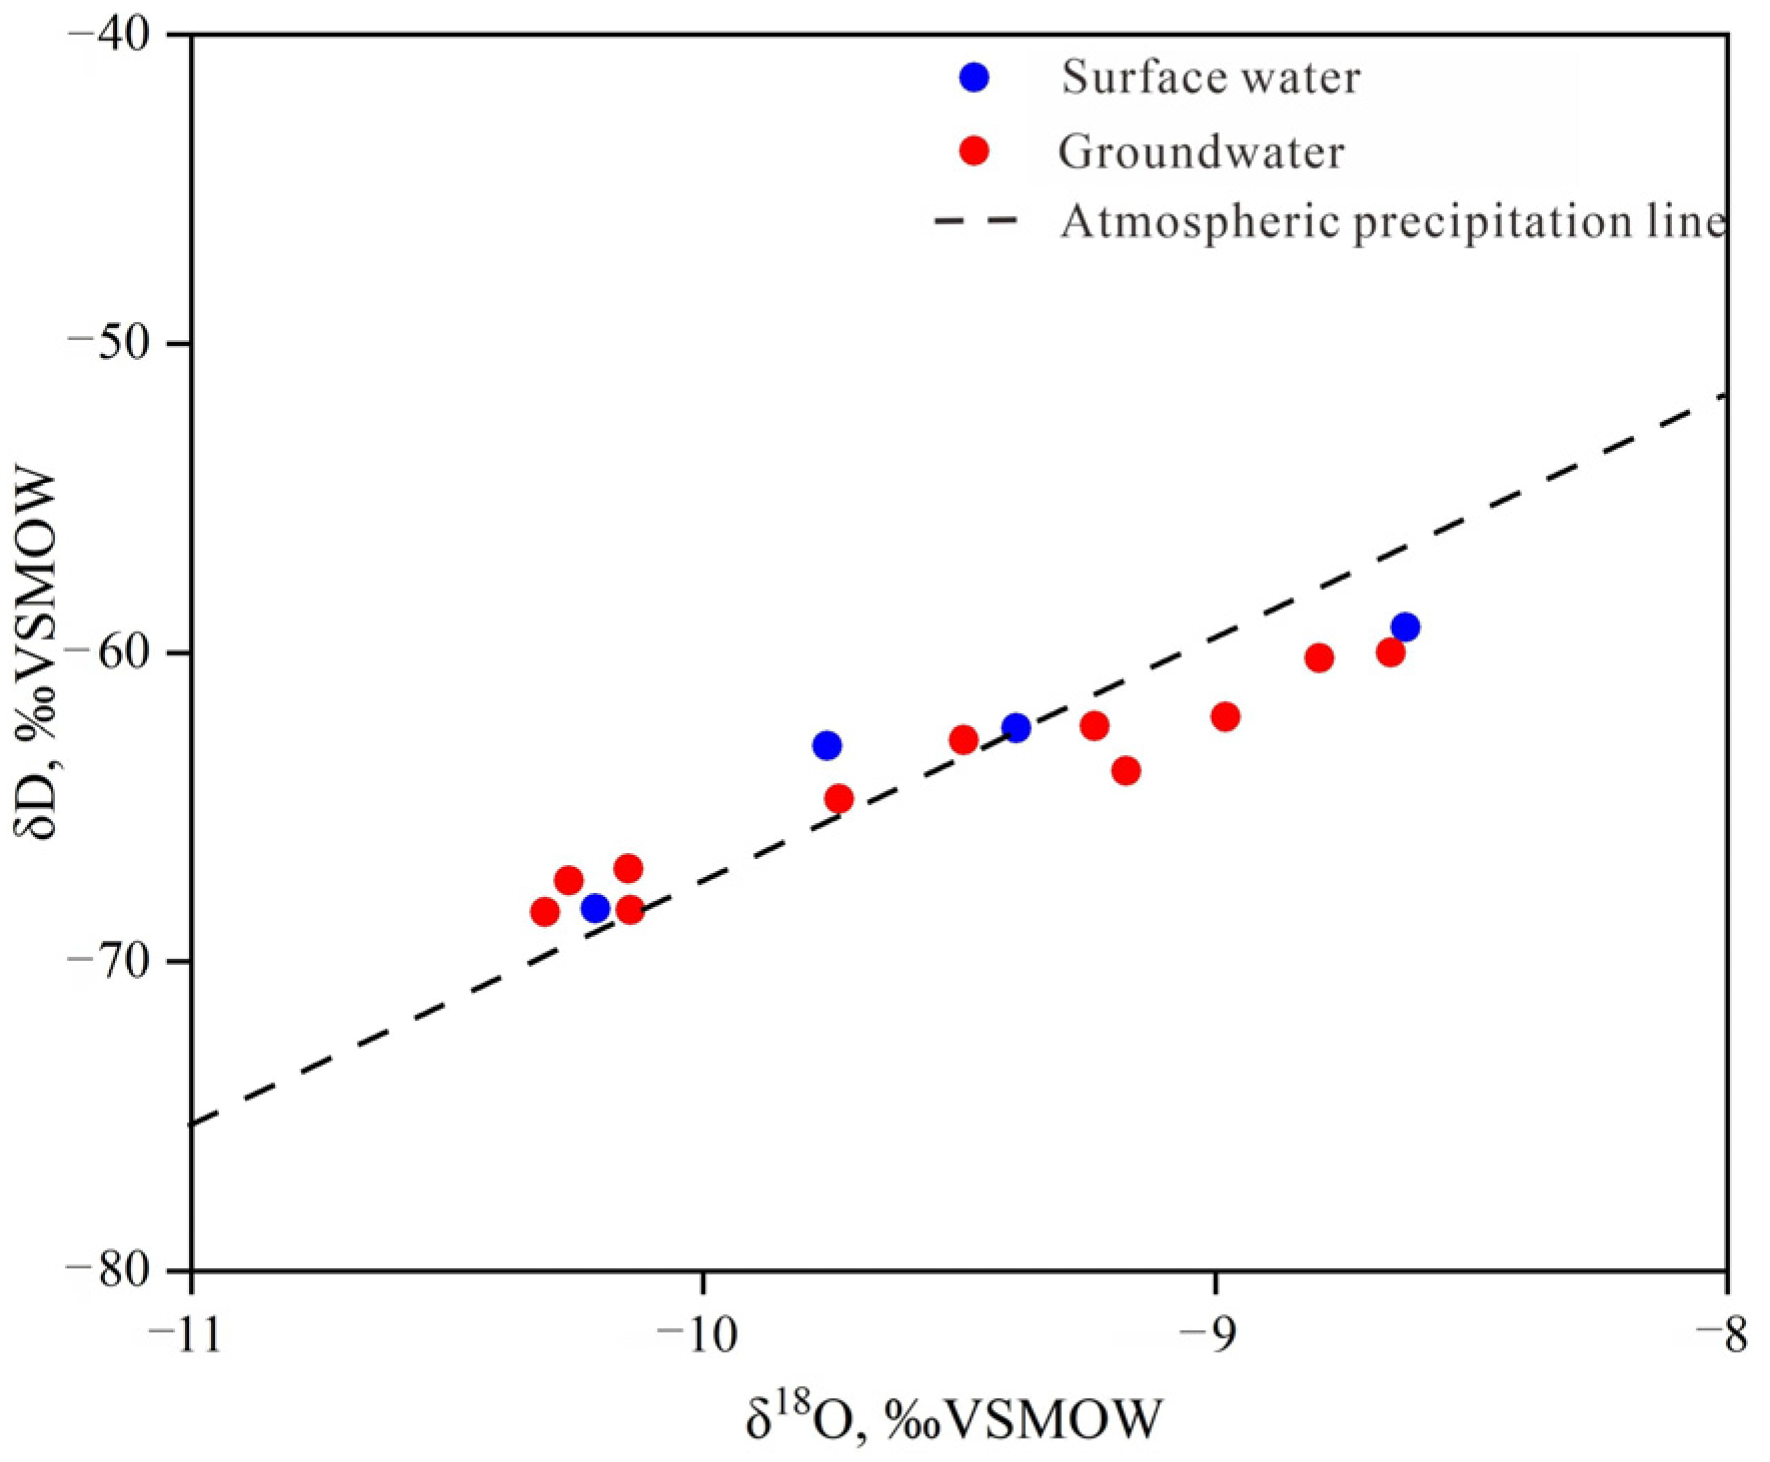
4.1.2. Hydrogen and Oxygen Isotope Characteristics

The type of recharge source can be determined by comparing the δD and δ18O values of groundwater with the spatial relationship of the global or local atmospheric precipitation line.
According to the test results, the δ18O values of the groundwater range from −10.31‰ to −8.66‰, with an average of −9.67‰; the δD values range from −68.4‰ to −60.2‰, with an average of −65.0‰. The δ18O values of the surface water range from −10.2‰ to −8.63‰, with an average of −9.26‰; the δD values range from −68.3‰ to −59.2‰, with an average of −64.4‰.
Figure 8 illustrates the relationship between the hydrogen and oxygen stable isotope ratios for the groundwater and surface water in the tunnel engineering area and its surroundings. The figure shows that the hydrogen and oxygen stable isotope ratios for the groundwater and surface water in the engineering area and its surroundings are predominantly negatively skewed. The sampling point data for the groundwater and surface water are clustered around the Global Meteoric Water Line (GMWL), suggesting that both the shallow surface water and deep groundwater originate from atmospheric precipitation.

4.2. Numerical Simulation Results

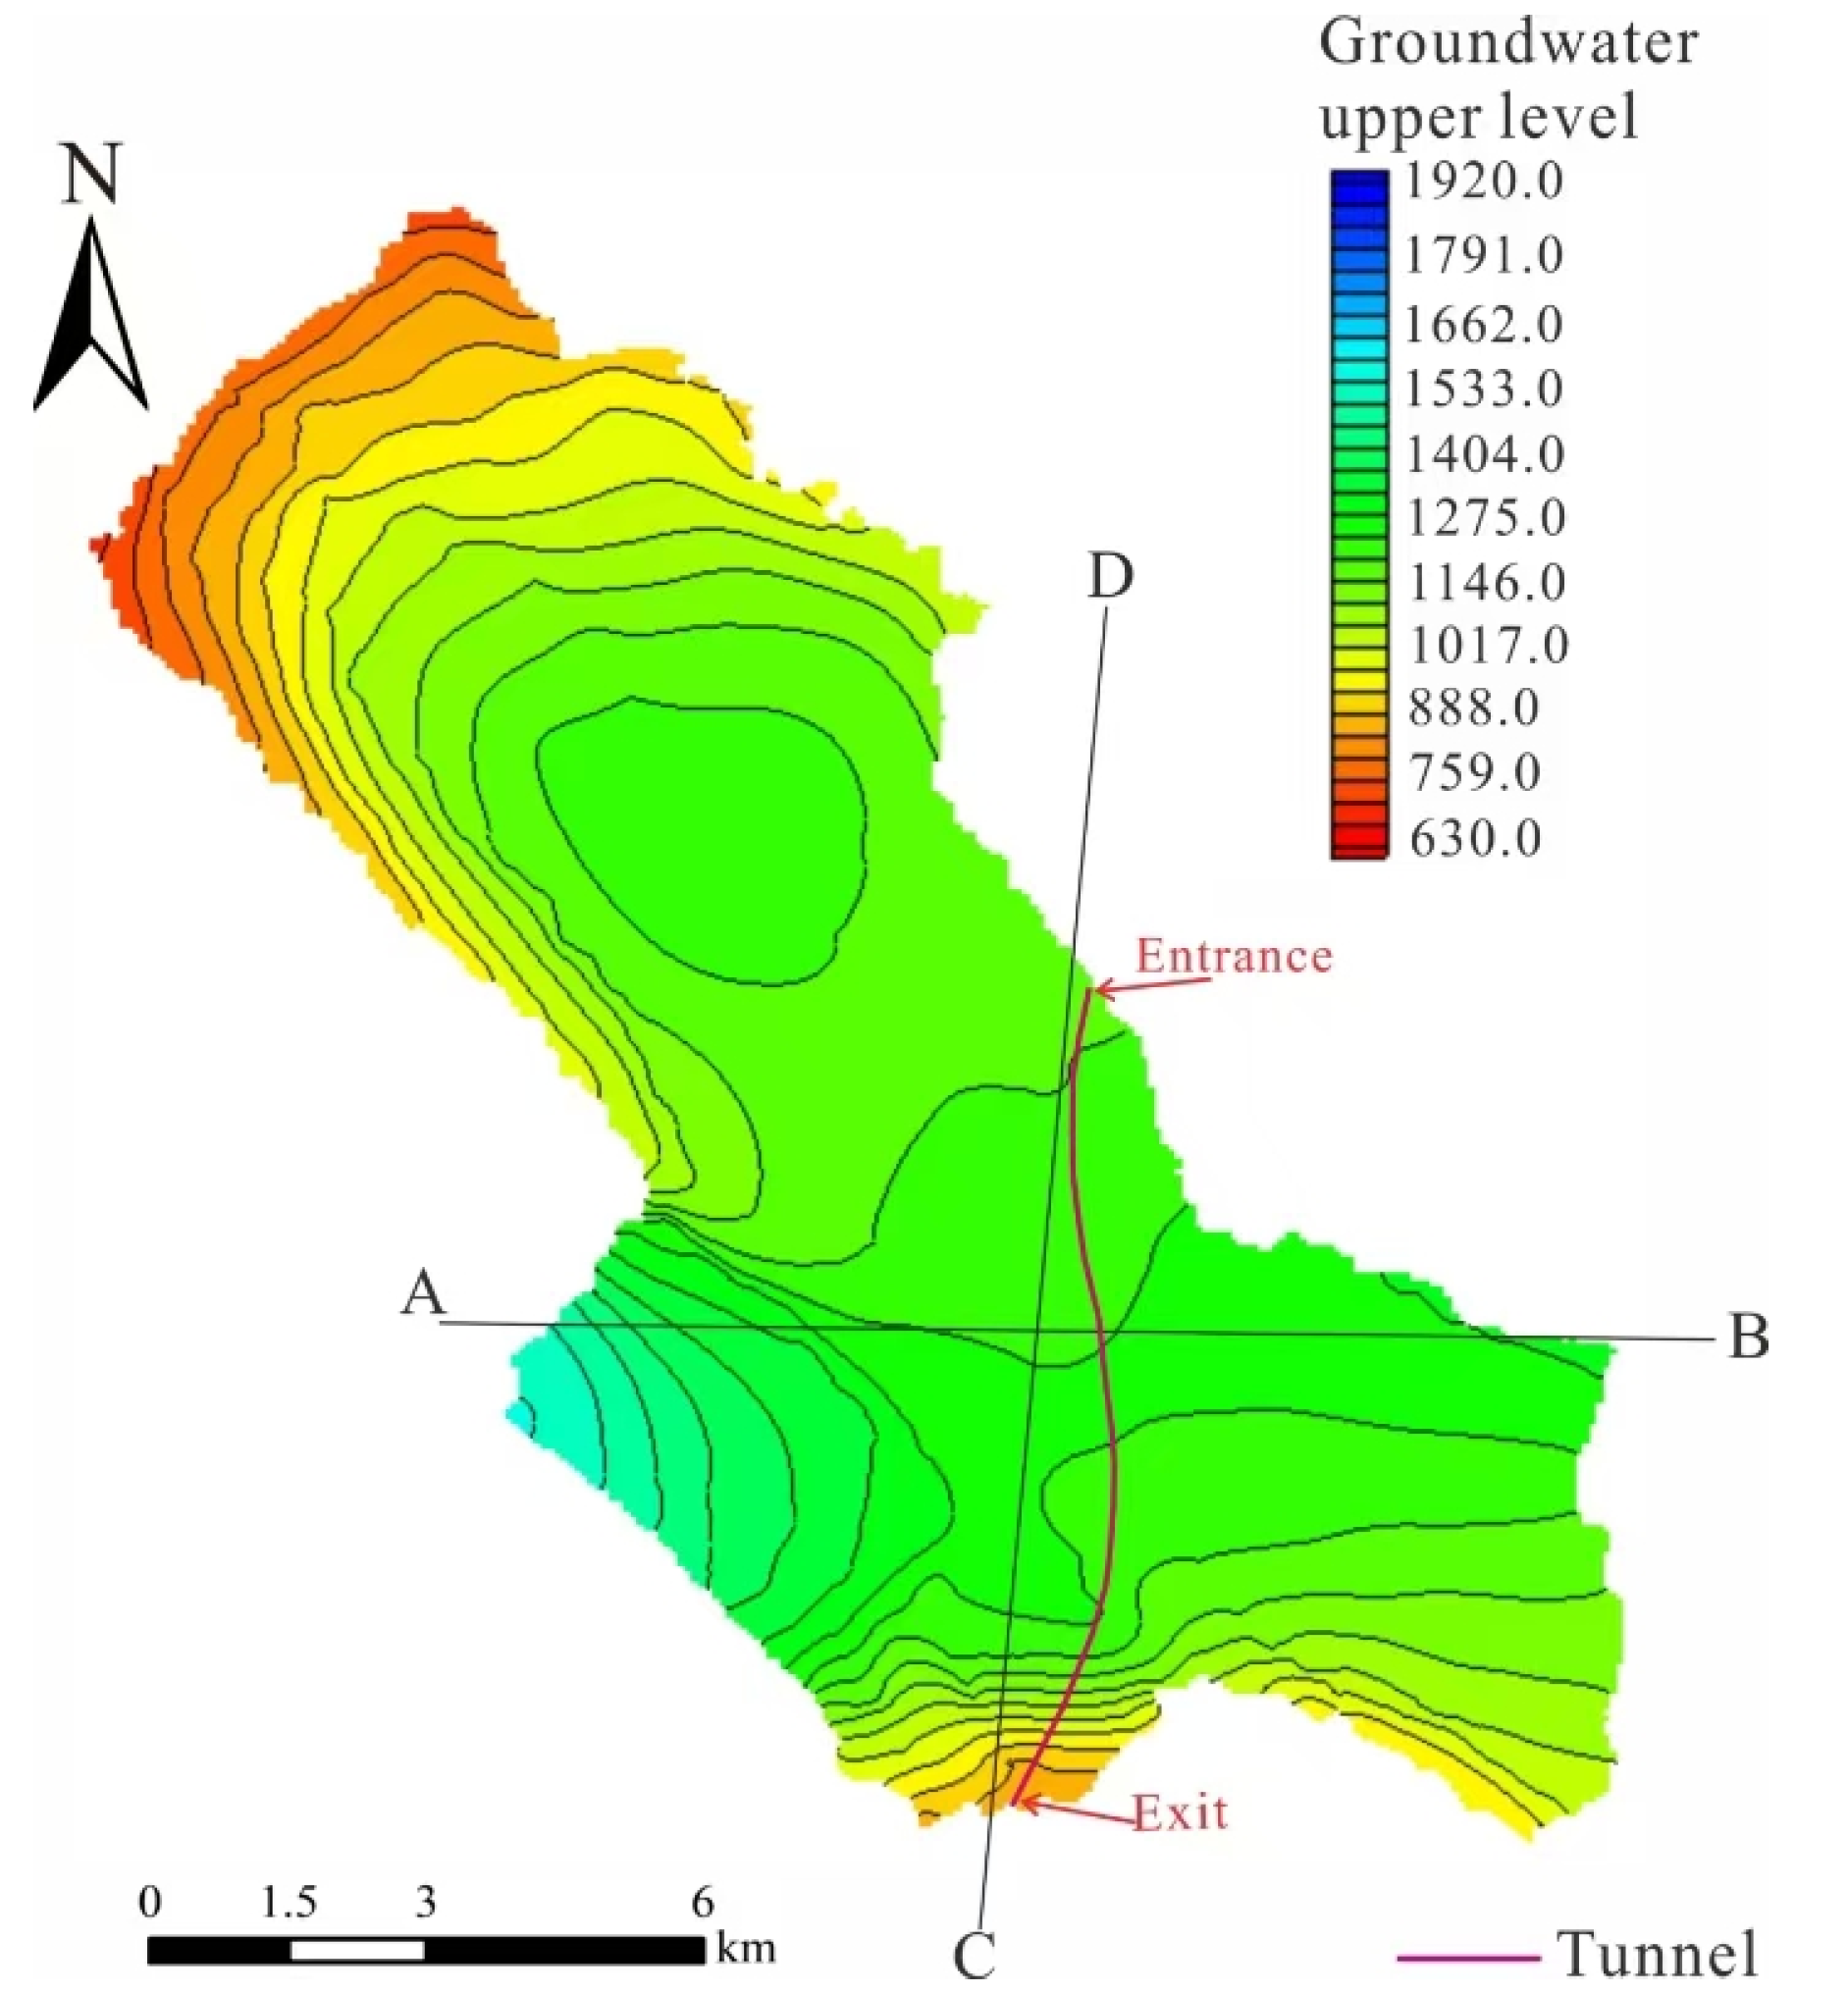
4.2.1. Regional Natural Seepage Field

The numerical simulation divides the regional seepage field into six layers, according to the strata, from top to bottom. Figure 9 illustrates the initial seepage field in the fourth layer, which the tunnel primarily passes through. In natural conditions, the maximum groundwater head in the area reaches 1920 m, while the minimum head is 630 m. Regional groundwater tends to converge towards rivers, resulting in significant fluctuations in the groundwater upper level, with a decreasing trend from high to low elevation areas.
The natural distribution of the seepage field in the study area suggests that groundwater flows outwards from the Qigan Mountain towards the northwestern and southeastern directions, due to watershed incision. Moreover, near the contact zone between soluble and nonsoluble rocks, there is a phenomenon involving a rapid increase or decrease in the hydraulic gradient, accompanied by the exposure of nonsoluble rocks, which conforms to the principles governing groundwater flow.
Groundwater leakage into the tunnel is unavoidable during tunnel construction below the groundwater level [36]. Excessive leakage not only delays construction, but also significantly impacts the groundwater environment. Therefore, the tunnel walls are generally sealed during the tunnel construction process to reduce the leakage of groundwater. Considering this, groundwater seepage fields were simulated under two construction conditions, namely unblocked and blocked tunnel construction conditions, at tunnel plan and profile locations. The tunnel water inrush volume was calculated for each condition. The unblocked condition considers the tunnel to be completely excavated without any protective measures. The blocked condition considers the tunnel to be excavated before the inclusion of perimeter rock support and overrun grouting, reducing the water permeability of the perimeter rock to a certain extent.

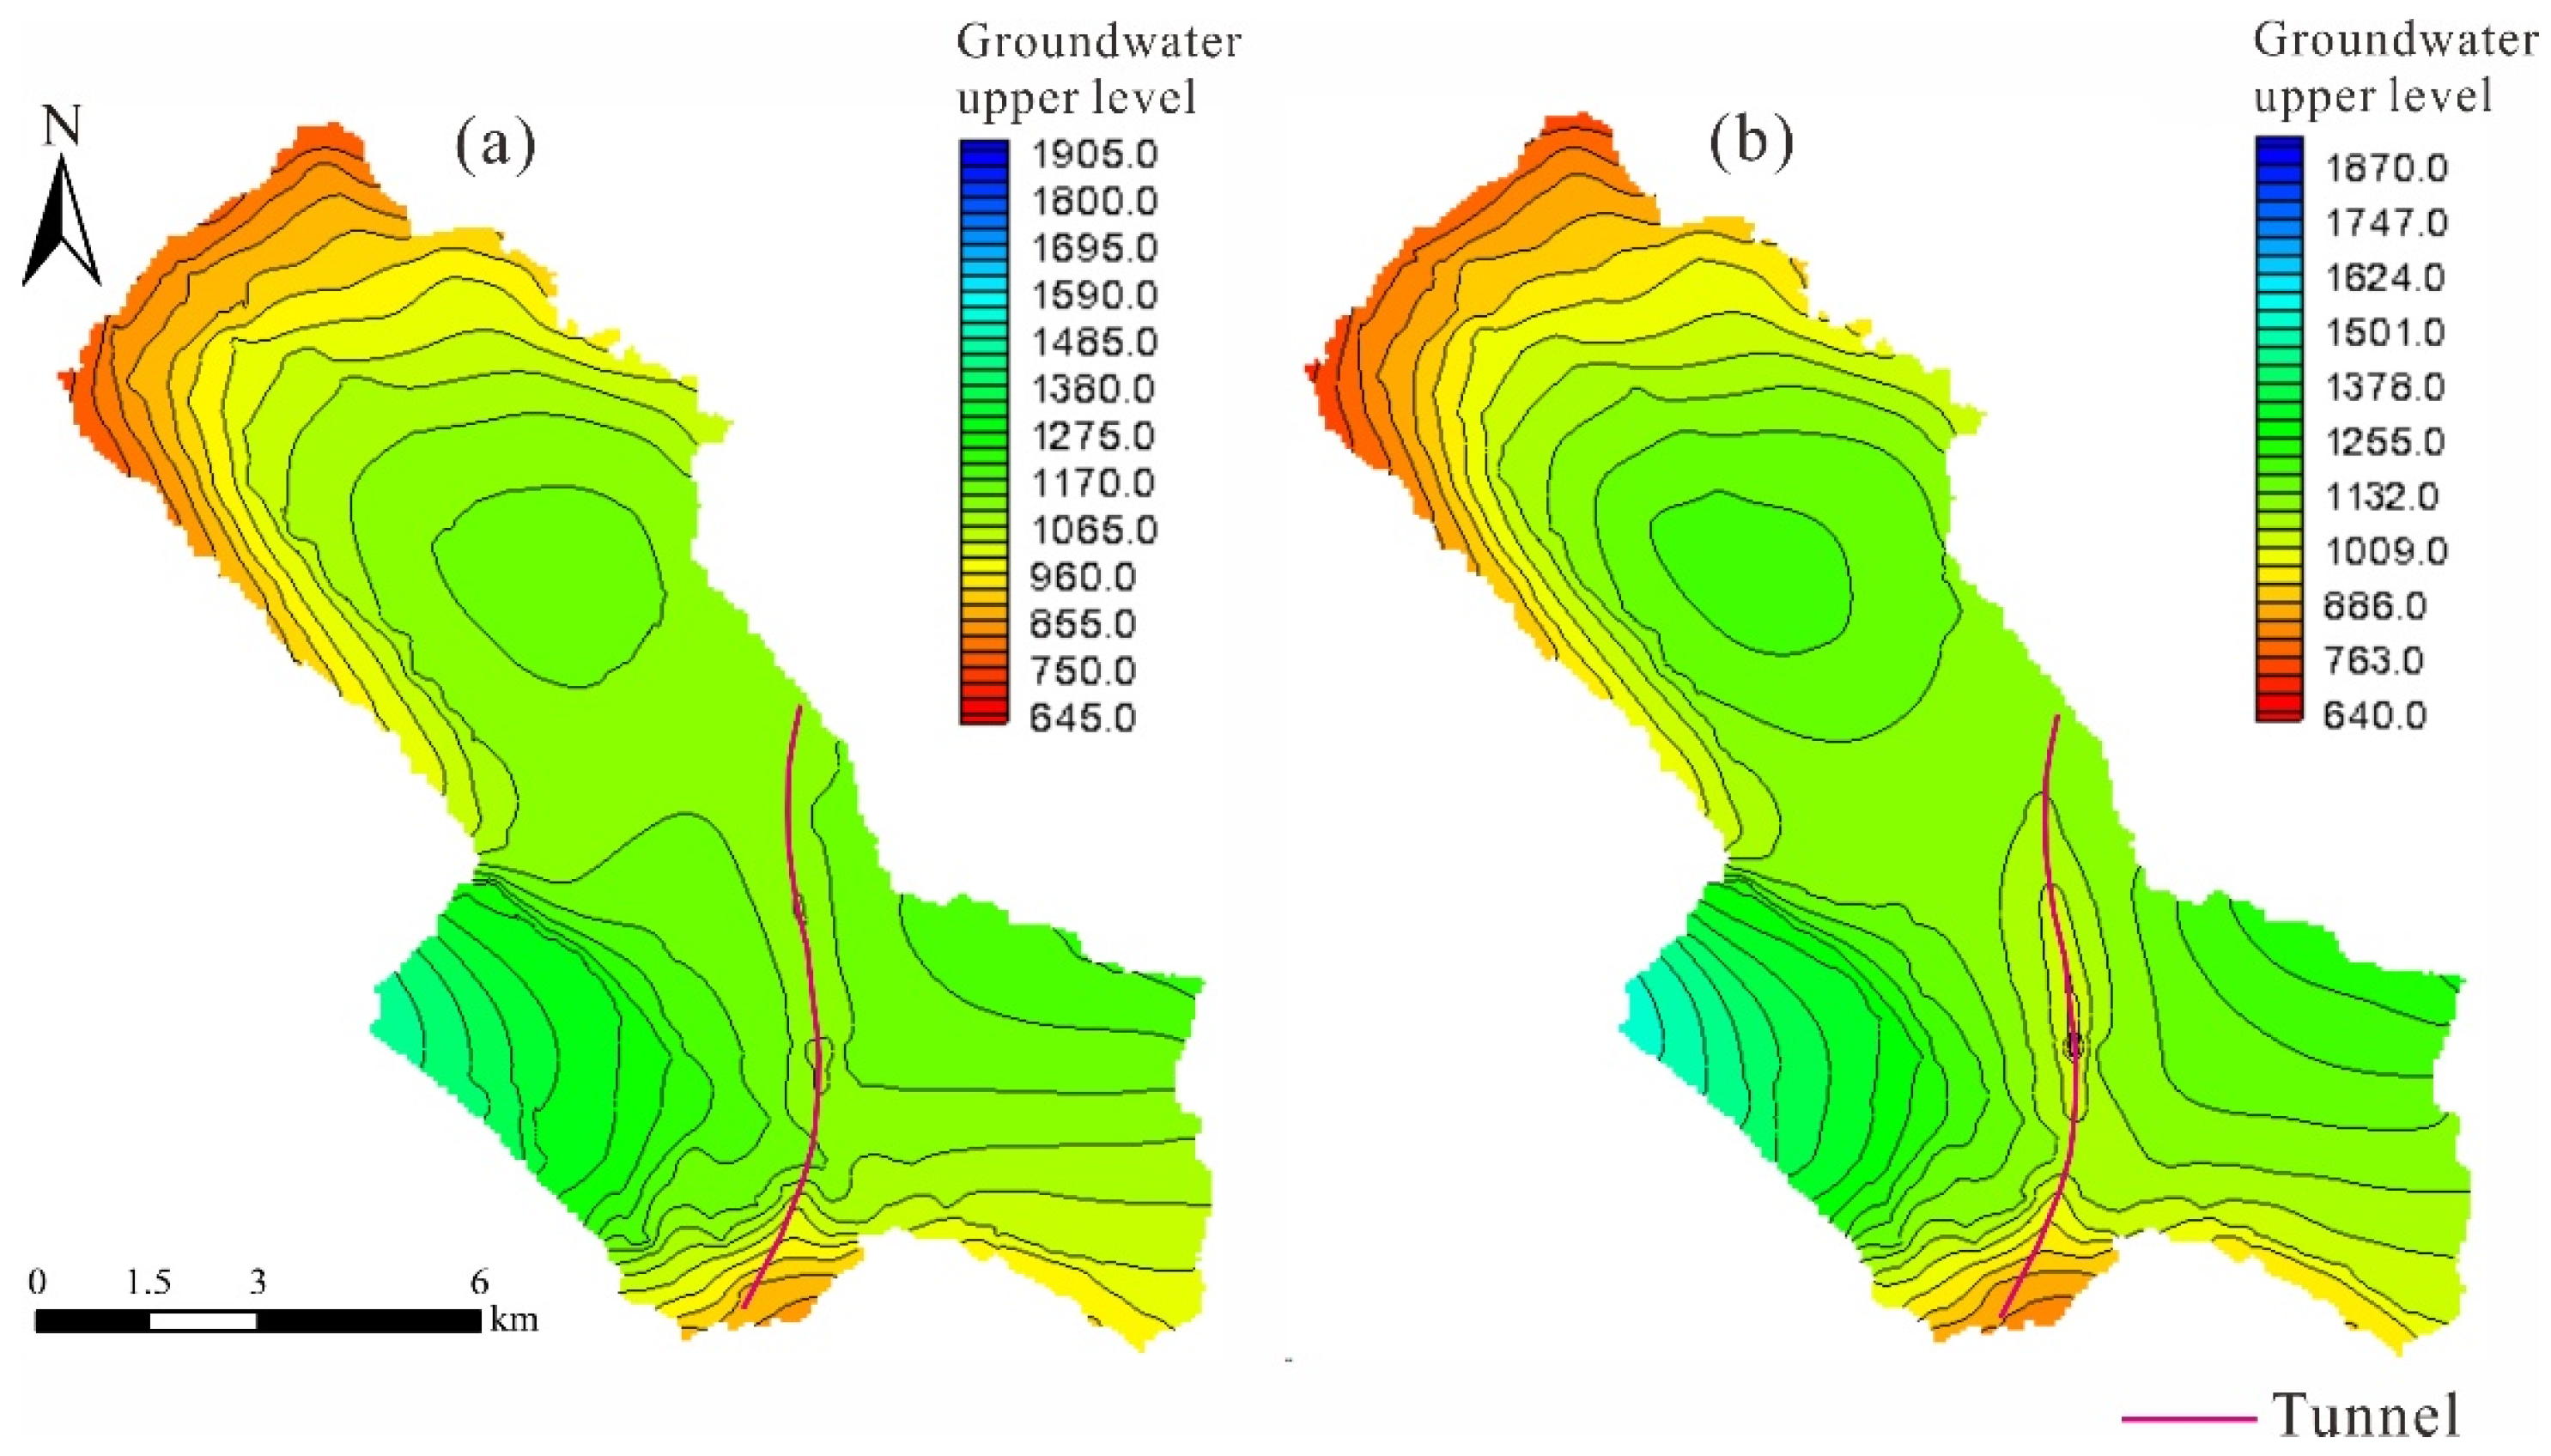
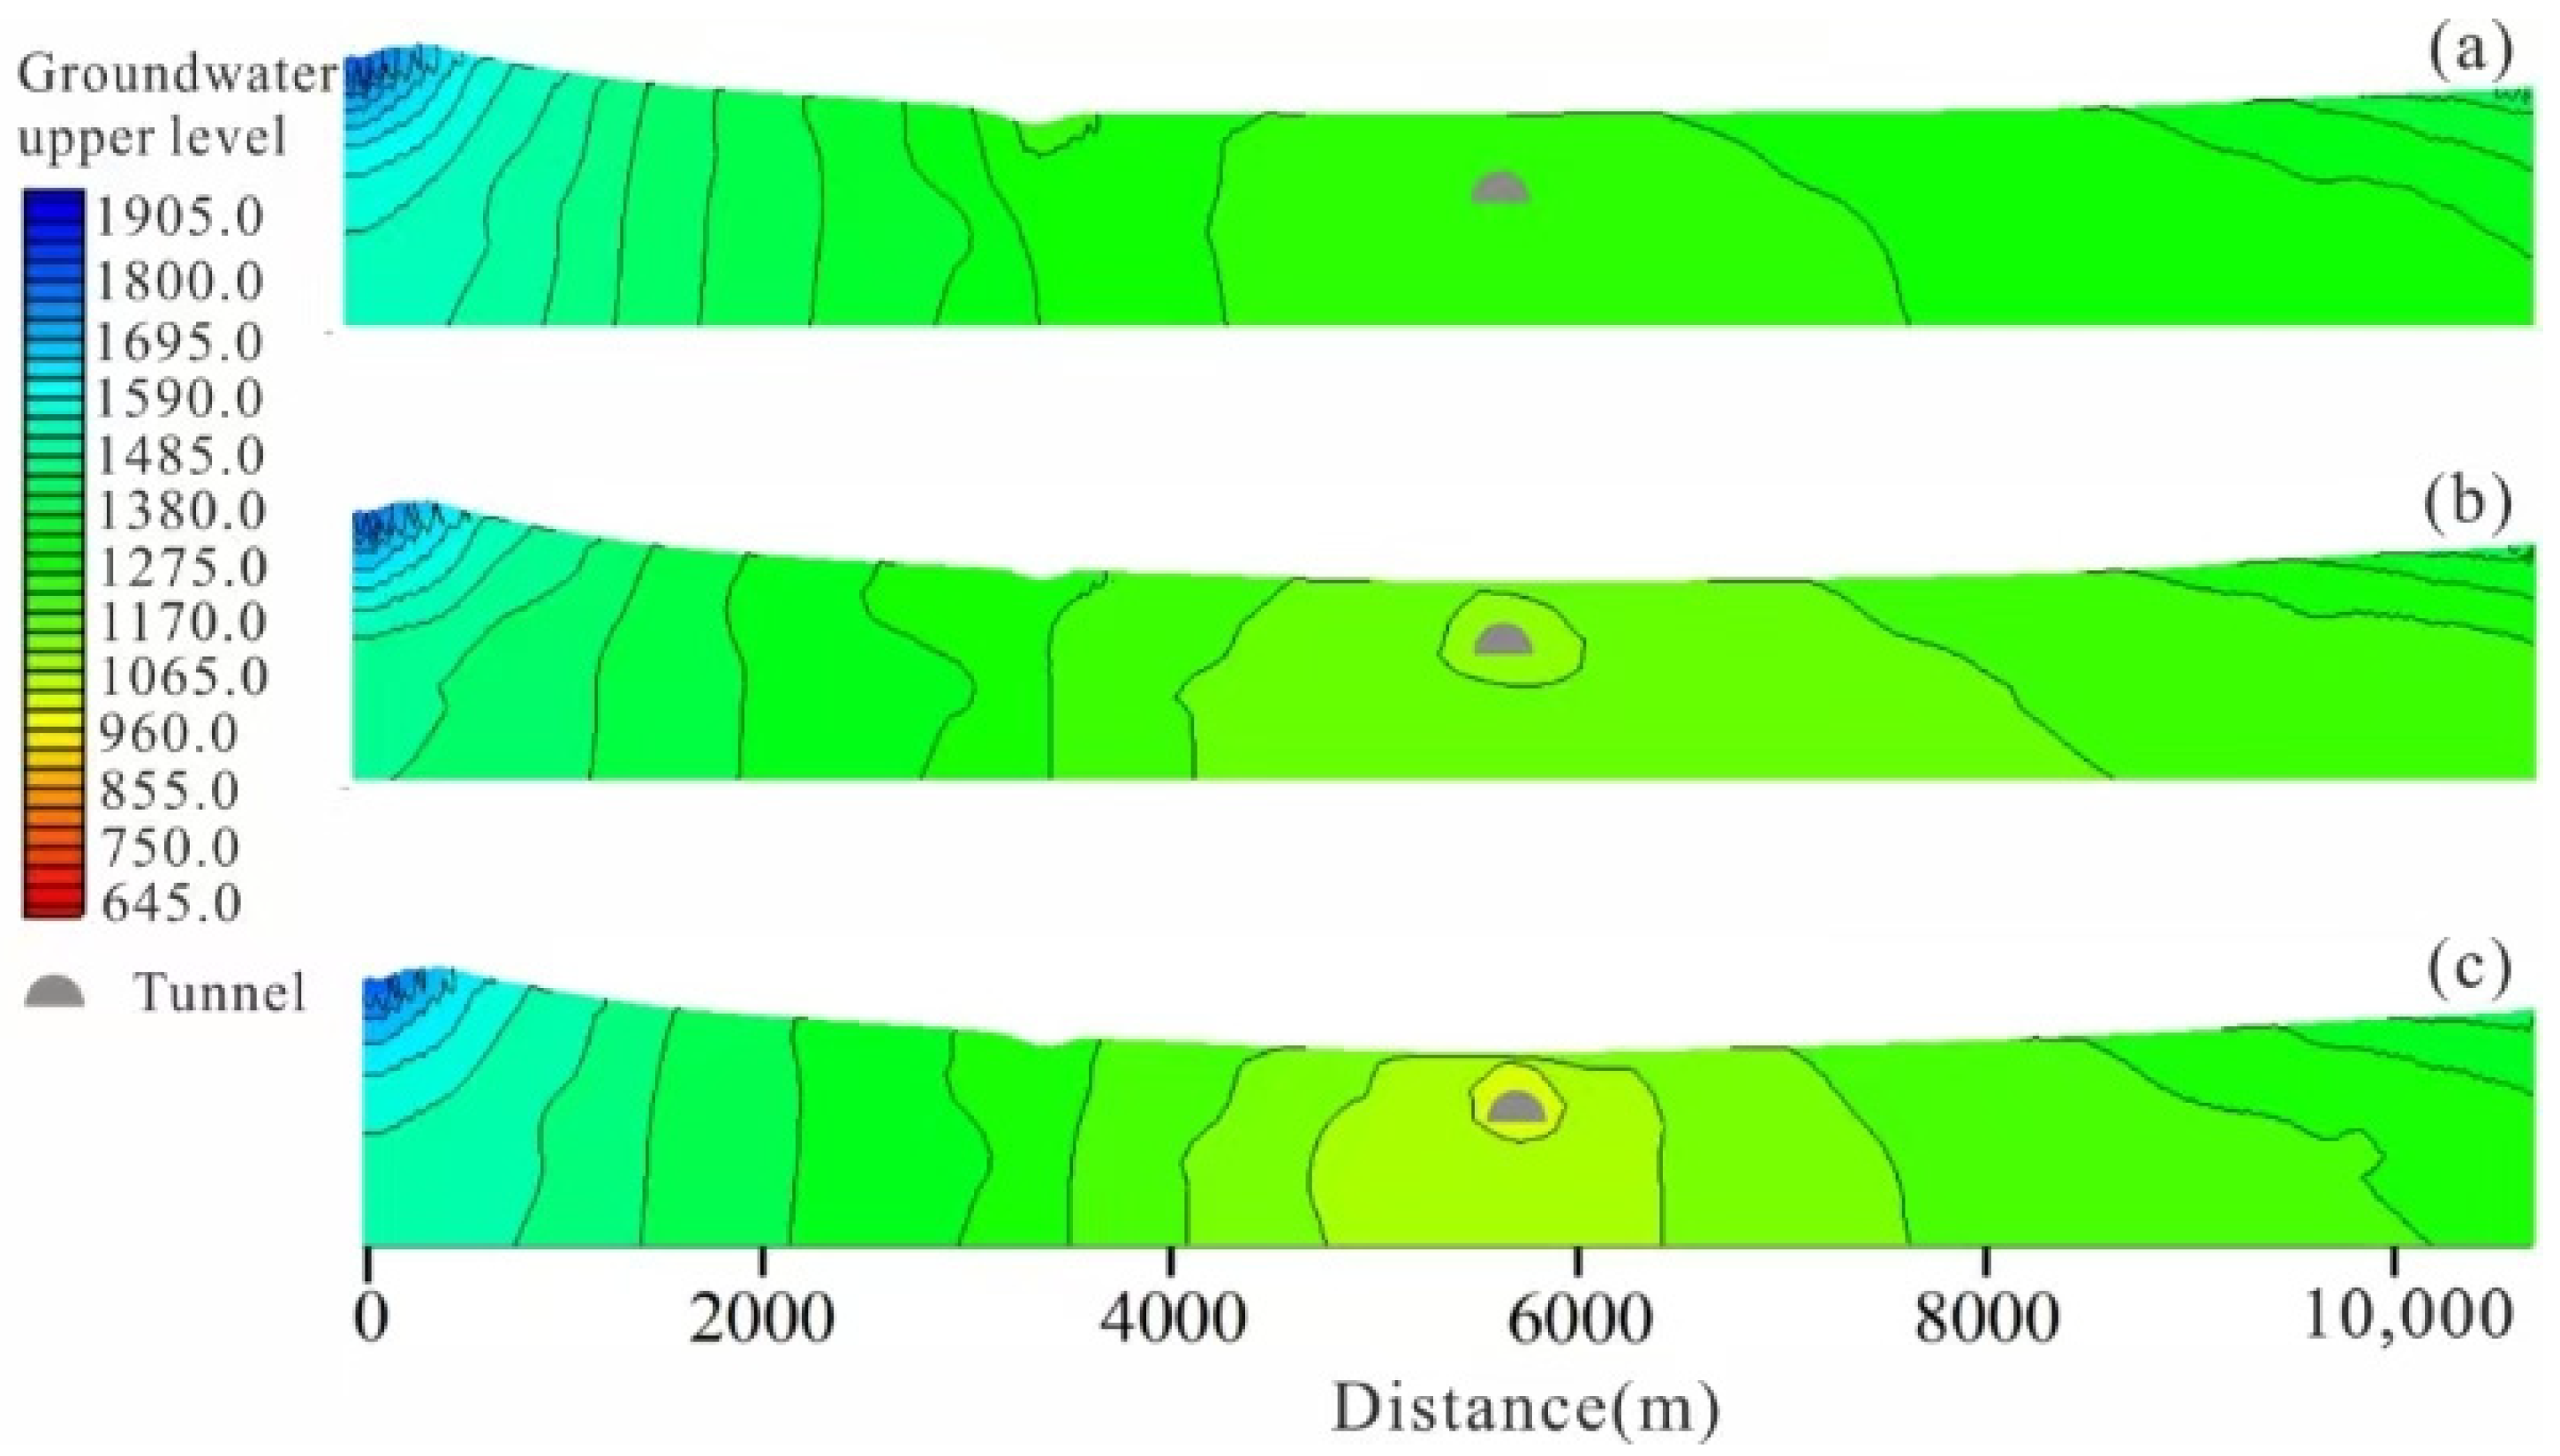
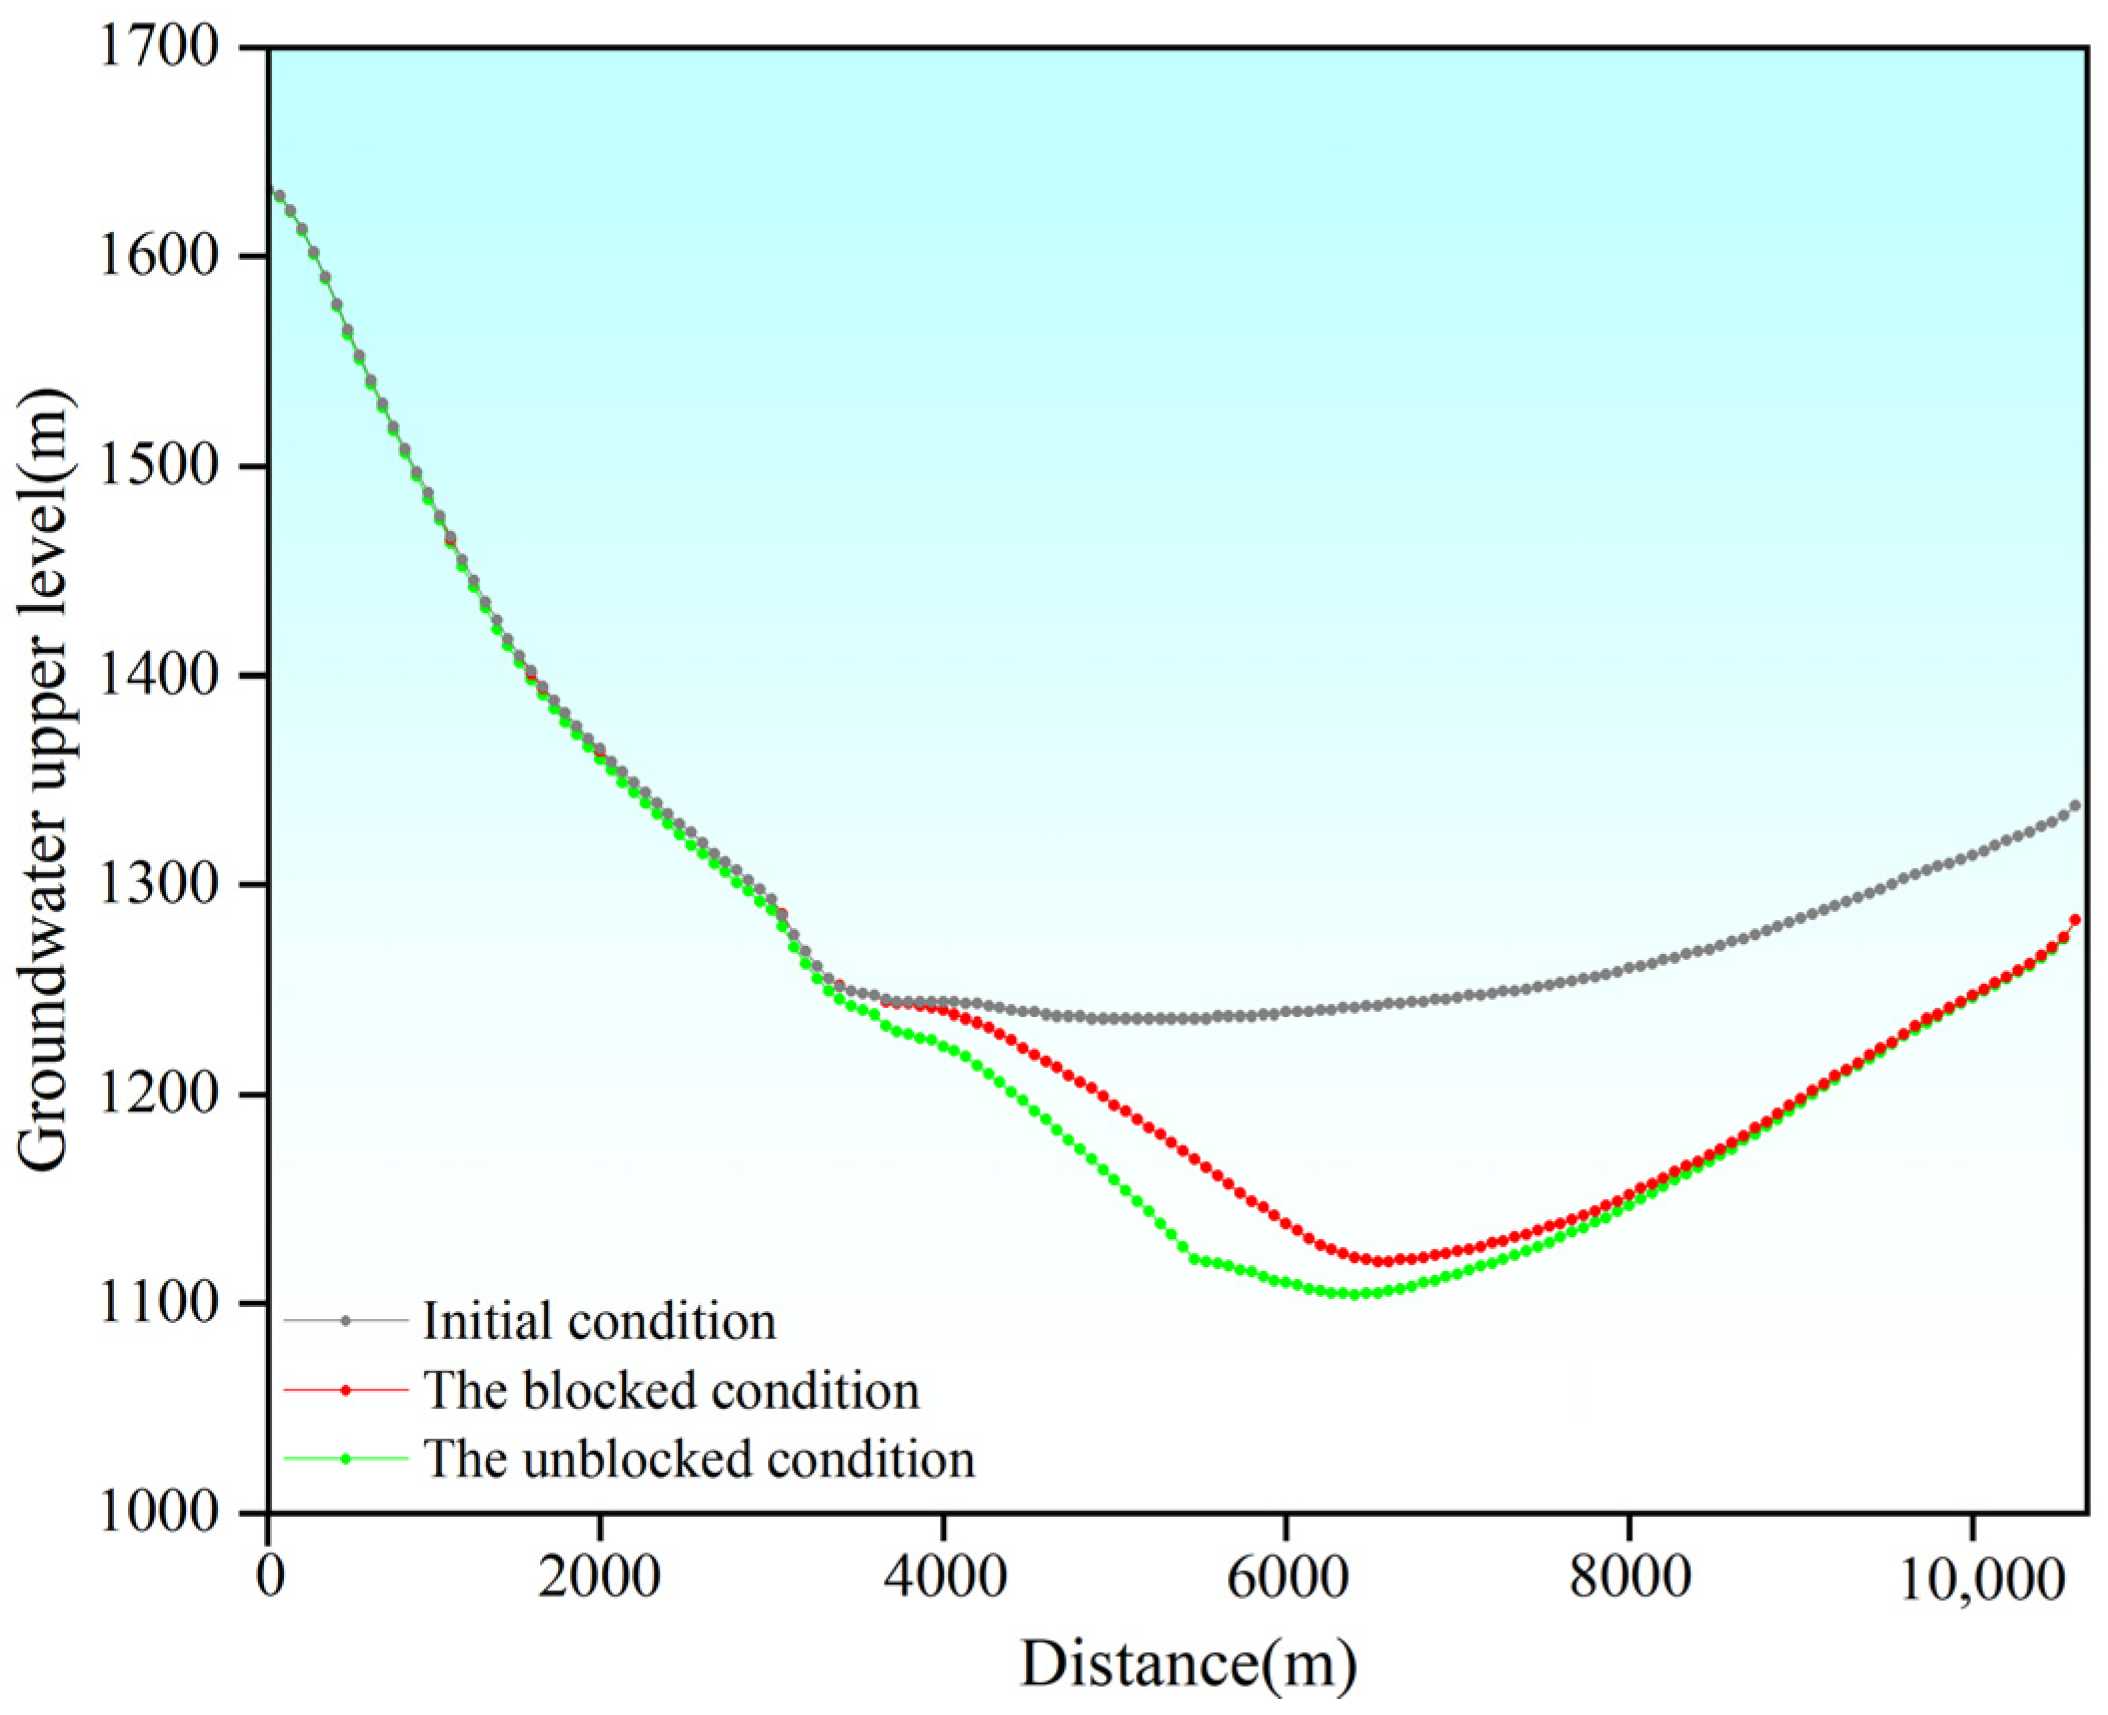
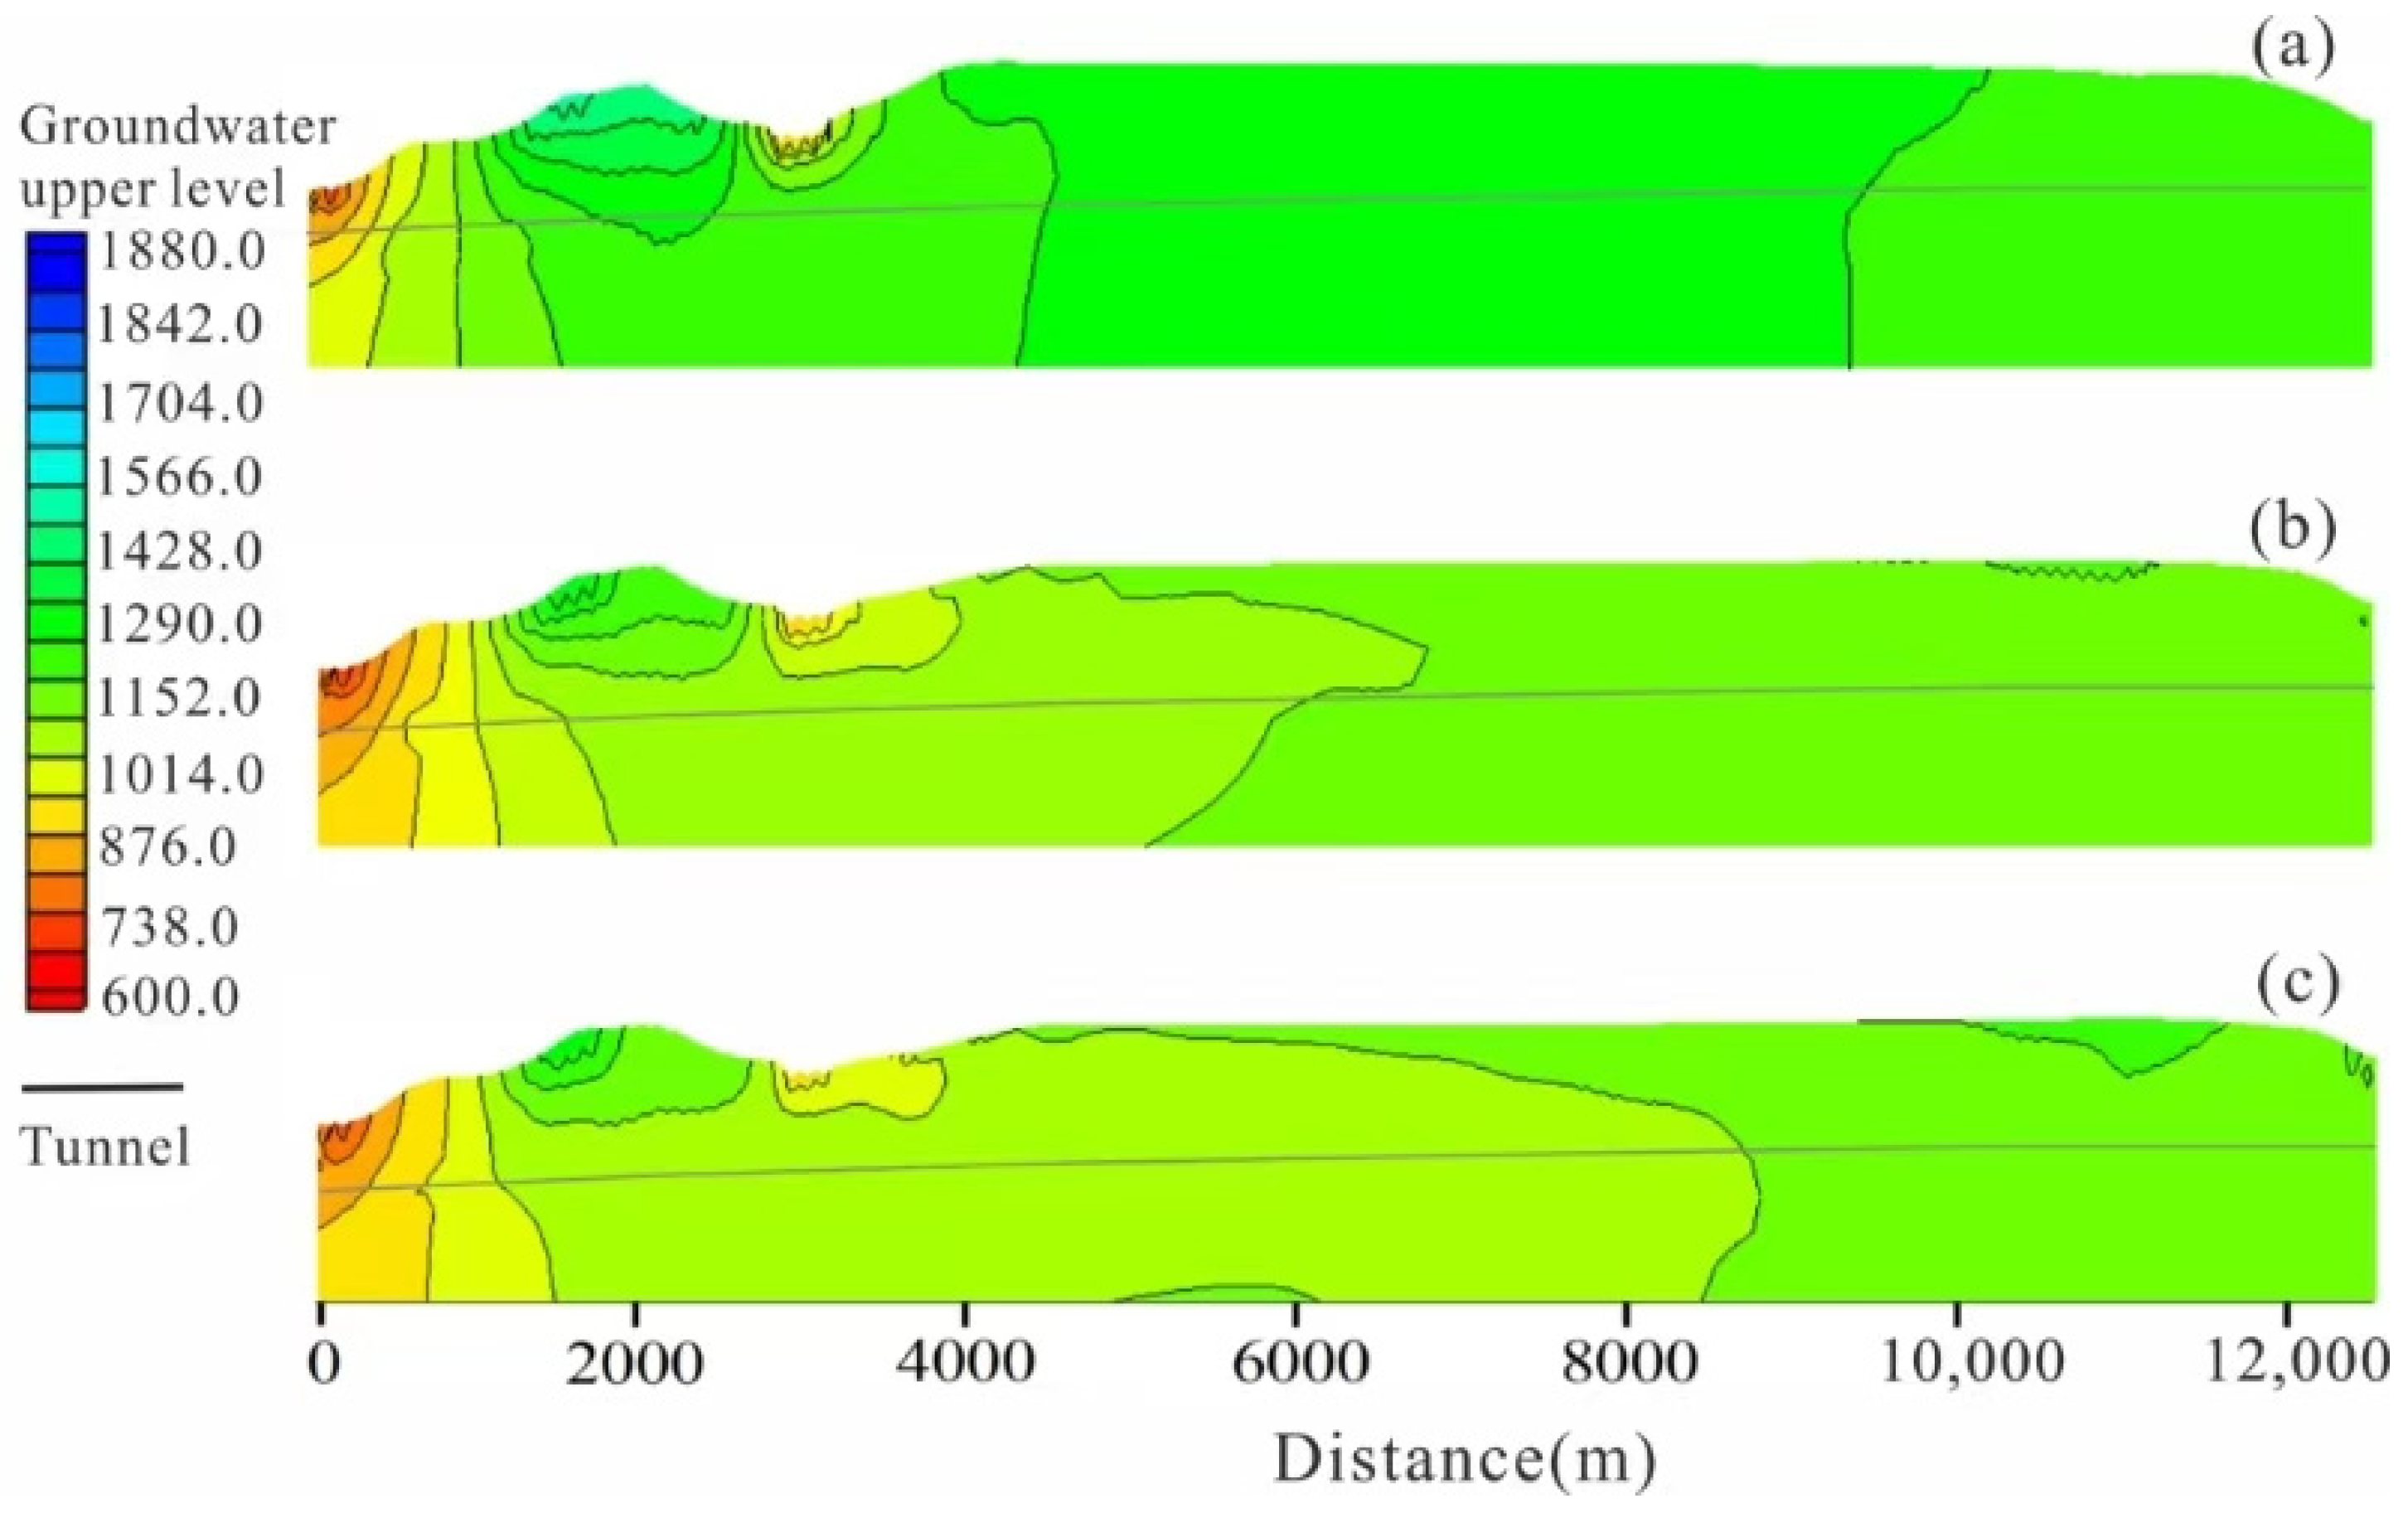
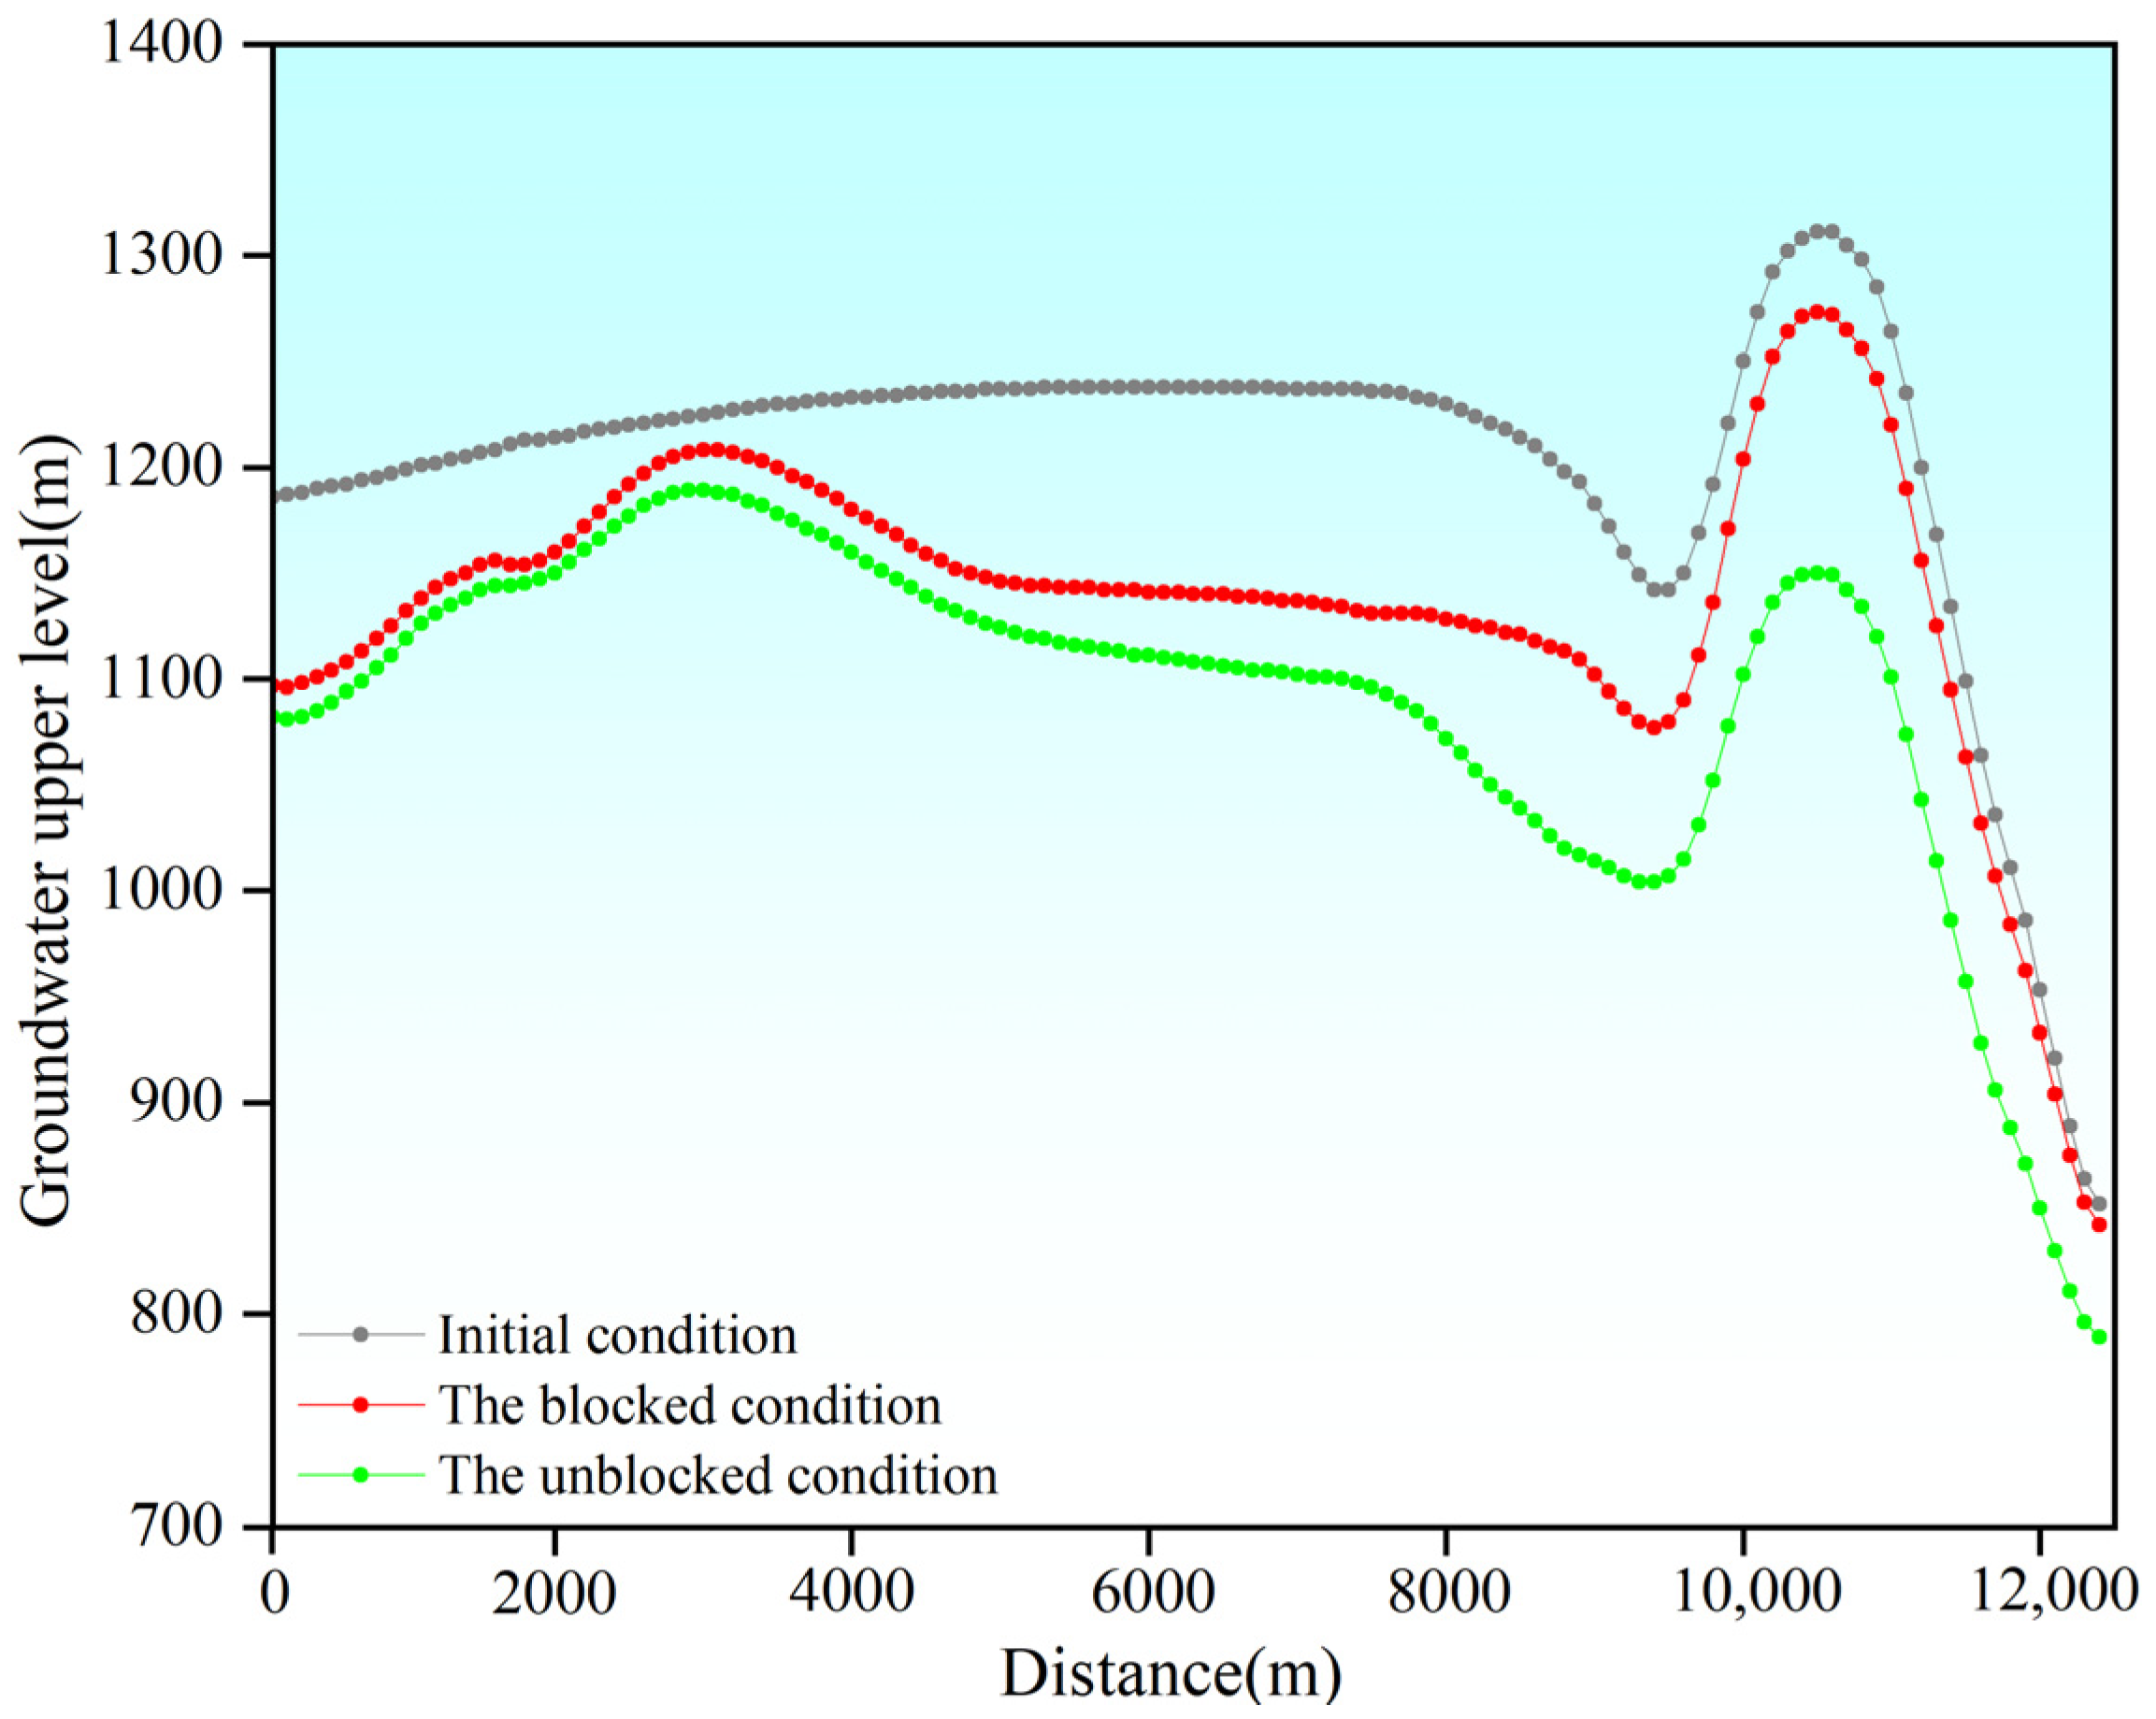
4.2.2. Analysis of Seepage Field Under Different Construction Conditions

The seepage field in the fourth layer under different working conditions is shown in Figure 10. It is found that the excavation of the tunnel will affect the changes in the regional seepage field to a certain extent, and the seepage field around the location of the tunnel will converge and flow into the tunnel during excavation. From Figure 10, it is evident that tunnel excavation induces a decline in the groundwater upper level within the seepage field area. Notably, the hydrological boreholes exhibit varying degrees of head reduction, depending on the excavation conditions. Specifically, in the absence of blocking, the magnitude of the head decline is significantly higher compared to scenarios where blocking measures are implemented. Among the six hydrological boreholes (Figure 11), “B2” stands out, with the most pronounced decrease in the groundwater upper level, registering a substantial reduction of approximately 216 m. Located in an area with intense karst formation, “B2” is close to the excavation site, resulting in a significant change in the water levels. Conversely, “B4” exhibits the smallest reduction in the groundwater upper level, with a decline of approximately 27 m, under excavation conditions without blocking. Located in a region devoid of significant karst development, “B4” is located at a distance from the tunnel excavation site, thus experiencing a comparatively minor impact on the water levels. The significant alteration in the seepage field during tunnel excavation is evident. The large-scale influx of groundwater during tunnel excavation elevates the water pressure on the tunnel construction surface, intensifying the challenges faced during underground construction and posing significant safety risks.
Comparing the seepage field of the tunnel under different working conditions reveals significant changes around the tunnel after excavation. As depicted in Figure 12, under unblocked conditions, the seepage field near the tunnel’s path exhibits a cone of depression, with the center point of the depression experiencing a maximum decrease of 228 m compared to the initial water level. Conversely, upon tunnel blockage, a substantial rise in the groundwater level is observed, diminishing the distinctiveness of the regional drawdown, with the center observation point 4 experiencing a reduction of approximately 139 m compared to the initial water level. Figure 13 illustrates the variation in the groundwater upper level during tunnel excavation for profile A–B. In the initial seepage field profile, the groundwater upper level is lower in the middle and gradually increases towards both ends. As the tunnel is excavated, the overall groundwater upper level of the seepage field decreases, with the most significant reduction occurring in the middle and gradually diminishing towards both ends. Among them, the groundwater upper level in the middle decreases the most because this point is located at the site of the tunnel excavation. The change in the groundwater upper level under blocked conditions is about half that of the unblocked conditions. Additionally, from the entire profile A–B seepage field, it is evident that the seepage field is more significantly affected near the tunnel location, and the farther away from the tunnel, the lesser the impact of the seepage field.
Profile C–D is positioned near the entire length of the tunnel. As depicted in Figure 14, it is evident that the seepage field of the entire profile will experience a significant impact and undergo considerable changes during tunnel excavation. Figure 15 shows the changes in the groundwater upper level along the C–D profile as tunnel excavation progresses. Initially, the groundwater upper level distribution within the profile showed lower values at the rightmost position and higher values elsewhere. With the progress of tunnel excavation, the overall groundwater upper level of the seepage field decreased, with a similar variation trend in the groundwater upper level. Under blocked conditions, the decrease in the groundwater upper level is about two-thirds of that under unblocked conditions. The maximum decrease in the groundwater upper level under blocked conditions is around 120 m and the lowest decrease in the groundwater upper level is about 50 m. While under unblocked conditions, the maximum decrease is around 160 m and the lowest decrease is about 100 m.

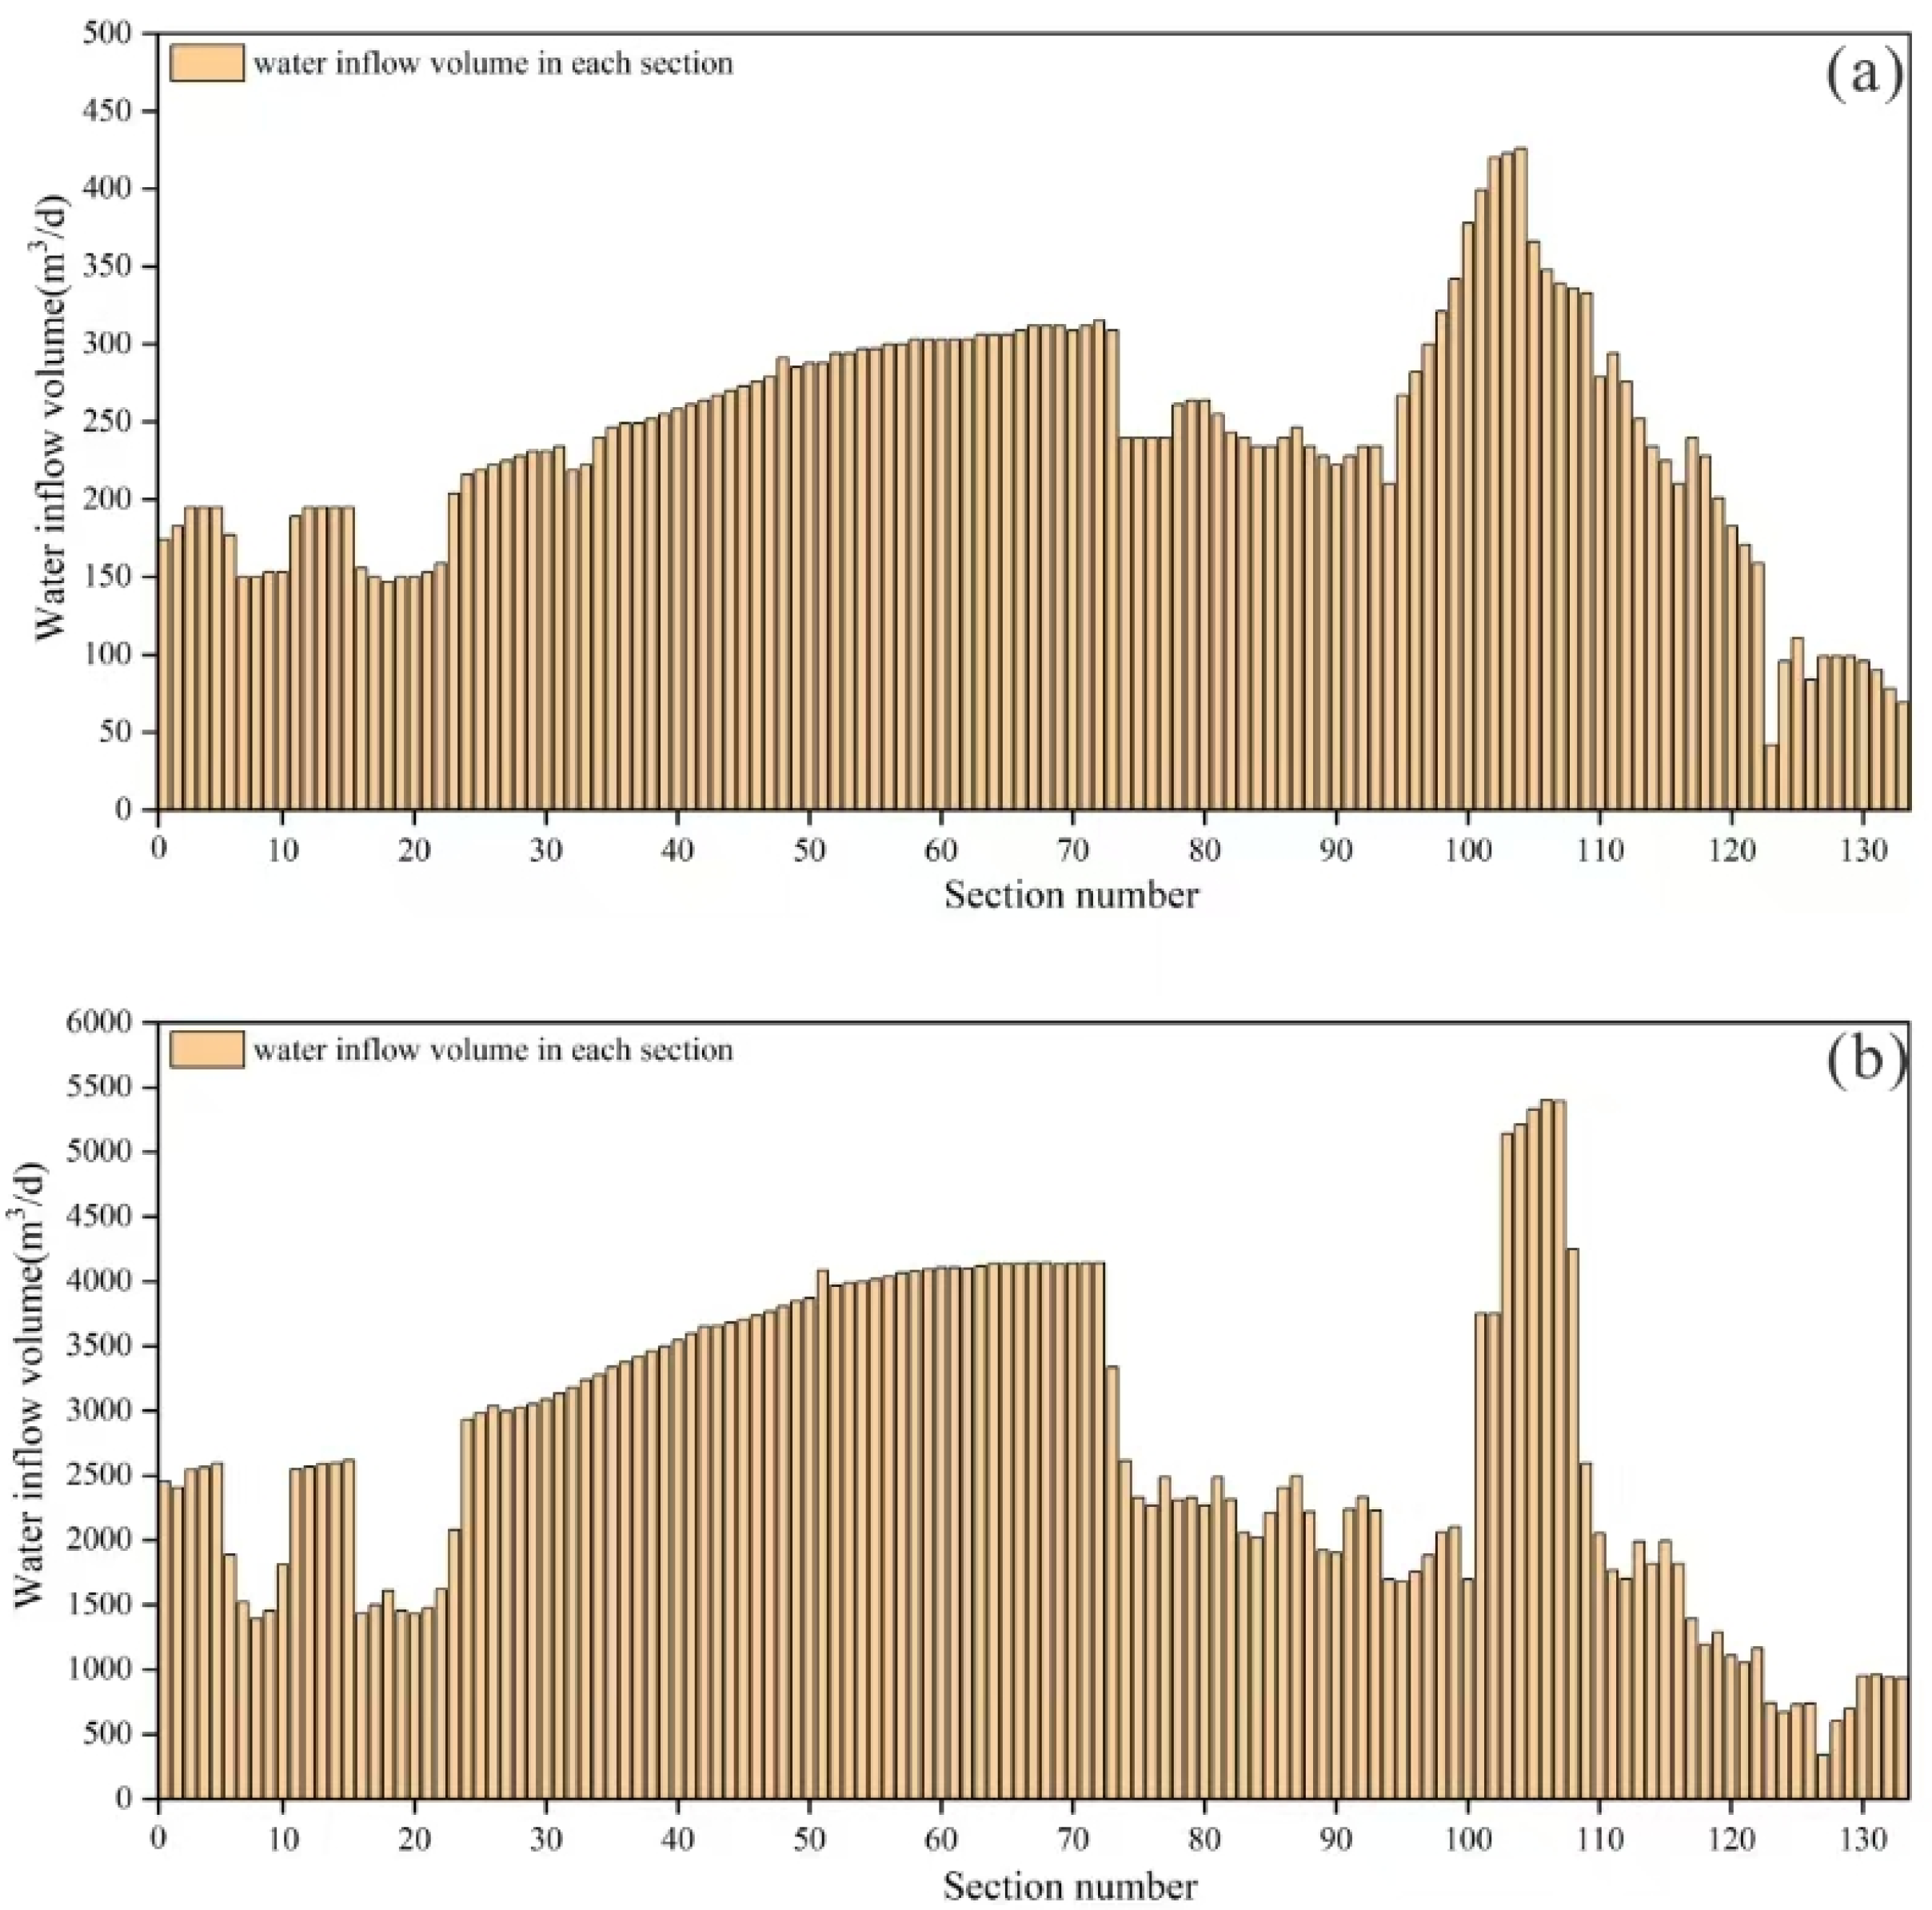
4.3. Inflow Prediction Under Different Conditions

Considering the geological conditions of the Qigan Mountain Tunnel, the rainfall infiltration method and numerical simulation method were used to predict the water influx of the tunnel, respectively.
The principle of the numerical simulation method for predicting water inflow is that by selecting the model grids traversed by different tunnel segments, the “flow budget” module in MODFLOW can be used to view the water balance data of the inflow and outflow of the different surfaces in the grid during a certain seepage period, which can be considered as the maximum water inflow that may be encountered during the tunnel construction process. The inflow from the grid represents the potential water influx encountered by the tunnel during construction. Utilizing this information, grid selection can be performed for various tunnel segments to compute the water inflow across these segments. In this numerical simulation, the established mesh model divides the entire tunnel length into an average of 133 grids, each approximately 75 m long. The numerical simulation evaluates both blocked and unblocked conditions for a fully excavated tunnel.
The rainfall infiltration method is commonly employed for predicting water influx in tunnels, due to its minimal parameter requirements [37]. This method utilizes the idea of water balance to determine the value of the infiltration recharge coefficient for each part of the area by combining factors, such as the amount of precipitation in the study area, the type of precipitation, the lithology of the ground layer, the slope, the geodetic structure, and the vegetation coverage on the surface, and then calculates the amount of groundwater recharge in each section. The formula is as follows:
Q S = 2.74 α A W
where Q S , α , A , and W represent tunnel water influx and the infiltration coefficient and tunnel catchment area and annual average precipitation, respectively.
According to the numerical simulations, the tunnel’s water inflow under excavation and blocking conditions is 31,932 m3/d, and under excavation without blocking conditions is 359,199 m3/d. Meanwhile, the theoretical calculation method yields a tunnel water inflow of 131,445 m3/d. The theoretical approach primarily accounts for rainfall recharge and the hydrological catchment area, but lacks a comprehensive consideration of the geomorphological and geological conditions, which play a critical role in governing groundwater flow in karst regions. Consequently, significant discrepancies have been observed between the results of numerical simulations and theoretical calculations. As the tunnel construction is still ongoing, it remains inconclusive as to which prediction method yields more accurate results. Nevertheless, both predictive approaches can serve as valuable references for guiding tunnel construction.
The water inflow in the tunnel under excavation without blocking conditions, as calculated by the numerical simulation, is approximately 10 times greater than under excavation and blocking conditions. Large-scale water inflow in tunnels poses significant safety hazards during construction. Therefore, appropriate safety measures must be taken during tunnel excavation. In the future, efforts should be made to enhance advanced prediction of groundwater influx and the prediction of its environmental impact. Additionally, emergency measures for water inflow should be implemented during future construction periods. According to the calculation results, the numerical simulation results differ from the theoretical calculations, but numerical simulations can handle complex geological conditions, providing more comprehensive and accurate results. The value estimated by the numerical simulation for the unblocked tunnel construction condition can be considered the maximum possible water inrush volume for the entire tunnel, while the value derived from the theoretical calculation method can be regarded as the normal water inrush volume for the entire tunnel.
Figure 16 illustrates the water inflow in different sections of the tunnel under various conditions. Figure 16 shows that under excavation and blocking conditions, the tunnel section experiences a minimum water inflow of 42 m3/d and a maximum of 423 m3/d. Without blocking during excavation, tunnel sections experience a minimum water inflow of 342 m3/d and a maximum of 5403 m3/d. Overall, the water inflow in the tunnel exhibits a pattern wherein the middle sections have higher inflows compared to the end sections. The distribution characteristics of water inflow in each section correlate with the depth of the tunnel segments. Deeper segments of the tunnel show higher corresponding water inflows, whereas shallower segments have smaller water inflows. Sections 92 to 100 of the tunnel notably exhibit higher water inflow compared to other sections. This occurs because these tunnel segments traverse karst areas, primarily consisting of fault zones that are highly fragmented and contain numerous interconnected fissures, forming complex water systems. Consequently, these formations have high groundwater activity, leading to significant water inflows in the tunnel sections. Additionally, these sections cross underground rivers, which are the main channels of groundwater flow, further increasing water influx during tunnel construction. Tunnel excavation in these sections caused the underground rivers and surrounding groundwater to converge towards the tunnel.

5. Conclusions

This study focuses on the karst tunnel in the Qigan Mountain, conducting a detailed investigation and data analysis to understand the hydrogeological conditions and hydrochemical characterization of the area. Numerical simulation methods were used, a geological model of the study area was established, and the distribution characteristics of the regional seepage field under natural conditions and various excavation conditions were obtained. The study quantifies the volume of water influx in the tunnel segments and points to potential risks related to significant groundwater-related disasters and the importance of sustainable groundwater management. The following results were obtained:
(1) The Qigan Mountain Tunnel is located in Chengkou County, Chongqing Municipality. This area lies within the subtropical mountainous climate zone of the Sichuan Basin and is bordered by the Daba Mountains. The stratigraphic lithology in the study area includes a wide range of variations, and is subject to strong extrusion from north to south, and the area is mainly characterized by tight linear compound folds and reverse fault structures. Through the analysis of the lithology in the research area, the groundwater types are categorized into three classes: porous water in Quaternary loose deposits, fractured water in clastic rocks, and karst water in carbonate rocks;
(2) The hydrochemical type of the groundwater in the study area is Ca–HCO3, and the hydrochemical type of the surface water is Ca–Mg–HCO3. The hydrogen and oxygen isotope analyses indicate that groundwater recharge in the study area predominantly originates from atmospheric precipitation. Consequently, precipitation recharge is considered as the main groundwater source for the numerical simulation of the regional seepage fields;
(3) Numerical simulations were performed using MODFLOW, a simulation of the regional seepage field was conducted, generating a model depicting the regional seepage field under natural conditions. By comparing the changes in the seepage field at different profile locations under various excavation conditions, it can be observed that, in the case of excavation without blocking, the maximum head value of the regional planar seepage field decreased by 216 m, the maximum head value of the A–B profile seepage field decreased by 228 m, and the maximum head value of the C–D profile seepage field decreased by 159 m;
(4) Through the use of numerical simulation and rainfall infiltration methods, water inflow predictions were made for the different segments of the tunnel. The results revealed that, under excavation with blocking conditions, the tunnel water inflow calculated using numerical simulation is 31,932 m3/d. Under excavation without blocking conditions, the tunnel water inflow calculated using numerical simulation is 359,199 m3/d. The theoretical calculation method yields a tunnel water inflow of 131,445 m3/d. According to the calculation results, the value estimated by the numerical simulation for the unblocked tunnel construction conditions can be considered the maximum possible water inrush volume for the entire tunnel, while the value derived from the theoretical calculation method can be regarded as the normal water inrush volume for the entire tunnel;
(5) The construction of the Qigan Mountain Tunnel poses significant implications for local groundwater sustainability. The tunnel’s excavation could lead to changes in groundwater flow patterns, potentially affecting water availability for local ecosystems, agricultural activities, and water supply systems. Therefore, implementing tunnel blocking measures is crucial to mitigate the risk of excessive groundwater inflow and safeguard the sustainability of local groundwater resources.

Author Contributions

Conceptualization, Z.X. and X.L.; methodology, X.L., L.L. and K.Z.; software, B.Q.; validation, Z.X. and X.L.; formal analysis, K.Z.; investigation, B.Q.; resources, X.L. and J.J.; data curation, B.Q.; writing—original draft preparation, K.Z; writing—review and editing, B.Q. and L.L.; visualization, B.Q.; supervision, Z.X. and X.L.; project administration, Z.X. and X.L.; funding acquisition, Z.X. and X.L. All authors have read and agreed to the published version of the manuscript.

Funding

This research was funded by the Key R&D Program of Sichuan (2022YFWZ0009), the National Natural Science Foundation of China (42477200), the Natural Science Foundation of Sichuan for Young Scholars (2022NSFSC1117), the Innovative Practice Bases of Geological Engineering and Surveying Engineering of Southwest Jiaotong University (YJG-2022-JD04), and the New Interdisciplinary Cultivation Fund of Southwest Jiaotong University (2682022KJ055).

Institutional Review Board Statement

Not applicable.

Informed Consent Statement

Not applicable.

Data Availability Statement

The original contributions presented in this study are included in the article. Further inquiries can be directed to the corresponding authors.

Conflicts of Interest

Author Ke Zhang was employed by the China Railway Eryuan Engineering Group Co., Ltd. The remaining authors declare that the research was conducted in the absence of any commercial or financial relationships that could be construed as a potential conflict of interest.

References

  1. Li, S.; Hu, C.; Li, L.; Song, S.; Zhou, Y.; Shi, S. Bidirectional construction process mechanics for tunnels in dipping layered formation. Tunn. Undergr. Space Technol. 2013, 36, 57–65. [Google Scholar] [CrossRef]
  2. Wang, T.; Wang, W.; Lin, M. Harnessing the catastrophic inrush of water into new Yungchuen tunnel in Taiwan. Tunn. Undergr. Space Technol. 2004, 19, 4–5. [Google Scholar]
  3. Liu, N.; Pei, J.; Cao, C.; Liu, X.; Huang, Y.; Mei, G. Geological investigation and treatment measures against water inrush hazard in karst tunnels, A case study in Guiyang, southwest China. Tunn. Undergr. Space Technol. 2002, 124, 104491. [Google Scholar] [CrossRef]
  4. Pang, Y.; Liu, Z.; Nie, L.; Zhang, Y.; Shao, J.; Bai, P.; Dong, Z. 3D multi-scale resistivity inversion method applied in the tunnel face to borehole observations for tunnel-ahead prospecting. J. Appl. Geophys. 2022, 196, 104510. [Google Scholar] [CrossRef]
  5. Zhou, P.; Jiang, Y.; Zhou, F.; Wu, F.; Qi, Y.; Wang, Z. Disaster mechanism of tunnel face with large section in sandy dolomite stratum. Eng. Fail. Anal. 2022, 131, 105905. [Google Scholar] [CrossRef]
  6. Golian, M.; Abolghasemi, M.; Hosseini, A.; Abbasi, M. Restoring groundwater levels after tunneling: A numerical simulation approach to tunnel sealing decision-making. Hydrogeol. J. 2021, 29, 1161–1628. [Google Scholar] [CrossRef]
  7. Su, M.; Liu, Y.; Xue, Y.; Cheng, K.; Ning, Z.; Li, G.; Zhang, K. Detection method of karst features around tunnel construction by multi-resistivity data-fusion pseudo-3D-imaging based on the PCA approach. Eng. Geol. 2021, 288, 106127. [Google Scholar] [CrossRef]
  8. Ma, K.; Sun, X.; Tang, C.; Yuan, F.; Wang, S.; Chen, T. Floor water inrush analysis based on mechanical failure characters and microseismic monitoring. Tunn. Undergr. Space Technol. 2021, 108, 103698. [Google Scholar] [CrossRef]
  9. Xue, Y.; Kong, F.; Qiu, D.; Su, M.; Zhao, Y.; Zhang, K. The classifications of water and mud/rock inrush hazard: A review and update. B Eng. Geol. Environ. 2021, 80, 1907–1925. [Google Scholar] [CrossRef]
  10. Andrews, K.; Keim, S. Underground mine stream crossing assessment: A multi-disciplinary approach. Int. J. Min. Sci. Technol. 2021, 31, 59–65. [Google Scholar] [CrossRef]
  11. Huang, Z.; Zeng, W.; Zhao, K. Experimental investigation of the variations in hydraulic properties of a fault zone in Western Shandong, China. J. Hydrol. 2019, 574, 822–835. [Google Scholar] [CrossRef]
  12. Meng, Z.; Li, G.; Xie, X. A geological assessment method of floor water inrush risk and its application. Eng. Geol. 2012, 143–144, 51–60. [Google Scholar] [CrossRef]
  13. Ma, D.; Rezania, M.; Yu, H.; Bai, H. Variations of hydraulic properties of granular sandstones during water inrush: Effect of small particle migration. Eng. Geol. 2017, 217, 61–70. [Google Scholar] [CrossRef]
  14. Li, S.; Liu, R.; Zhang, Q.; Zhang, X. Protection against water or mud inrush in tunnels by grouting: A review. J. Rock Mech. Geotech. 2016, 8, 753–766. [Google Scholar] [CrossRef]
  15. Wu, Y.; Wang, K.; Zhang, L.; Peng, S. Sand-layer collapse treatment: An engineering example from Qingdao Metro subway tunnel. J. Clean. Prod. 2018, 197, 19–24. [Google Scholar] [CrossRef]
  16. Zhao, Y.; Li, P.; Tian, S. Prevention and treatment technologies of railway tunnel water inrush and mud gushing in China. J. Rock Mech. Geotech. 2013, 5, 468–477. [Google Scholar] [CrossRef]
  17. Zhou, W.; Liao, S. The analysis and control of inrush and mud gushing in the broken rock tunnel under high water pressure. Procedia Eng. 2016, 165, 259–264. [Google Scholar] [CrossRef]
  18. Shi, S.; Xie, X.; Bu, L.; Li, L.; Zhou, Z. Hazard-based evaluation model of water inrush disaster sources in karst tunnels and its engineering application. Environ. Earth Sci. 2018, 77, 1–13. [Google Scholar] [CrossRef]
  19. Wang, Y.; Geng, F.; Yang, S.; Jing, H.; Meng, B. Numerical simulation of particle migration from crushed sandstones during groundwater inrush. J. Hazard. Mater. 2019, 362, 327–335. [Google Scholar] [CrossRef]
  20. Chae, G.T.; Yun, S.T.; Choi, B.Y.; Yu, S.Y.; Jo, H.Y.; Mayer, B.; Kim, Y.J.; Lee, J.Y. Hydrochemistry of urban groundwater, Seoul, Korea: The impact of subway tunnels on groundwater quality. J. Contam. Hydrol. 2008, 101, 42–52. [Google Scholar] [CrossRef]
  21. Liang, D.; Jiang, Z.; Zhu, S.; Sun, Q.; Qian, Z. Experimental research on water inrush in tunnel construction. Nat. Hazards 2016, 81, 467–480. [Google Scholar] [CrossRef]
  22. Jiang, H.; Li, L.; Rong, X.; Wang, M.; Xia, Y.; Zhang, Z. Model test to investigate waterproof-resistant slab minimum safety thickness for water inrush geohazards. Tunn. Undergr. Space Technol. 2017, 62, 35–42. [Google Scholar] [CrossRef]
  23. Zhou, Z.; Li, L.; Shi, S.; Liu, C.; Gao, C.; Tu, W.; Wang, M. Study on tunnel water inrush mechanism and simulation of seepage failure process. Rock Soil Mech. 2021, 41, 6. [Google Scholar]
  24. Lv, Y.; Jiang, J.; Chen, L.; Hu, W.; Jiang, Y. Elaborate simulation and predication of the tunnel drainage effect on karst groundwater field and discharge based on Visual MODFLOW. J. Hydrol. 2022, 612, 128023. [Google Scholar] [CrossRef]
  25. Zhu, Q.; Feng, M.; Mao, X. Numerical analysis of water inrush from working-face floor during mining. J. China Univ. Min. Technol. 2008, 18, 159–163. [Google Scholar] [CrossRef]
  26. Li, L.; Tang, C.; Liang, Z.; Ma, T.; Zhang, Y. Numerical simulation on water inrush process due to activation of collapse columns in coal seam floor. J. Min. Saf. Eng. 2009, 26, 158–162. [Google Scholar]
  27. Moon, J.; Fernandez, G. Effect of excavation-induced groundwater level drawdown on tunnel inflow in a jointed rock mass. Eng. Geol. 2010, 110, 33–42. [Google Scholar] [CrossRef]
  28. Font-Capo, J.; Vazquez-Sune, E.; Carrea, J.; Marti, D.; Carbonell, R.; Perez-Estaun, A. Groundwater inflow prediction in urban tunneling with a tunnel boring machine (TBM). Eng. Geol. 2011, 121, 46–54. [Google Scholar] [CrossRef]
  29. Butscher, C. Steady-state groundwater inflow into a circular tunnel. Tunn. Undergr. Space Technol. 2012, 32, 158–167. [Google Scholar] [CrossRef]
  30. Chongqing Geological Survey Institute. Regional Geology of China—Chongqing; Geology Press: Beijing, China, 2021. (In Chinese) [Google Scholar]
  31. Chen, Z.; He, C.; Zhang, Y.; Xu, Z.; Li, Z.; Yu, B. The impact of formation heterogeneity on water discharge and groundwater depletion of an excavated tunnel. J. Hydrol. 2023, 627, 130304. [Google Scholar] [CrossRef]
  32. Harbaugh, A.W. MODFLOW-2005, the US Geological Survey Modular Ground-Water Model: The Ground-Water Flow Process; US Department of the Interior, USGS Reston: Reston, VA, USA, 2005. [Google Scholar]
  33. Wu, X.; Wang, X.; Wang, Y.; Hu, B.X. Origin of water in the Badain Jaran Desert, China: New insight from isotopes. Hydrol Earth Syst. Sci. 2017, 21, 4419–4431. [Google Scholar] [CrossRef]
  34. Liu, J.; Lou, K.; Tian, H.; Ma, C.; Jiang, B.; Gao, Z. Characterization and Health Risks of Groundwater Hydrochemistry in the Upper Weihe River Basin. Sustainability 2025, 17, 1197. [Google Scholar] [CrossRef]
  35. Zhao, Z.; Liu, G.; Qin, G.; Chen, H.; Chen, H.; Hu, W.; Yang, S.; Wang, J.; Zhang, Y.; Zhao, D.; et al. Exploring the Hydrochemical Characteristics and Controlling Processes of Groundwater in Agricultural Lower Reaches of a Typical Arid Watershed on Tibetan Plateau. Sustainability 2025, 17, 2117. [Google Scholar] [CrossRef]
  36. Zhang, Z.; Jin, G.; Tang, H.; Zhang, S.; Zhu, D.; Xu, J. How does the three gorges dam affect the spatial and temporal variation of water levels in the Poyang Lake? J. Hydrol. 2022, 605, 127356. [Google Scholar] [CrossRef]
  37. National Railway Administration of PRC. Code for Hydrogeological Investigation of Railway Engineering; China Railway Publishing House: Beijing, China, 2014. (In Chinese) [Google Scholar]
Figure 1. Location and geological profile of the Qigan Mountain Tunnel: (a) the location of the study area; (b) the range of the numerical simulation and the Qigan Mountain Tunnel; and (c) the geological profile of the tunnel.
Sustainability 17 04585 g001
Figure 2. Flowchart of this study.
Sustainability 17 04585 g002
Figure 3. Sampling points, boreholes, and profile lines in the study area.
Sustainability 17 04585 g003
Figure 4. Boundary conditions of the numerical simulation. The purple line represents river boundaries (specified-head boundary); the yellow line represents the watertight boundary (no-flow boundary).
Sustainability 17 04585 g004
Figure 5. Geological modeling in three dimensions: (a) regional geological borehole distribution map; (b) 3D geological model.
Sustainability 17 04585 g005
Figure 6. Precipitation recharge zoning map of the study area.
Sustainability 17 04585 g006
Figure 7. Piper diagram of the water samples from the study area.
Sustainability 17 04585 g007
Figure 8. δD–δ18O map of surface water and groundwater in the study area.
Sustainability 17 04585 g008
Figure 9. Regional distribution of seepage fields in the 4th layer, before tunnel excavation.
Sustainability 17 04585 g009
Figure 10. Plan view of the seepage field under different working conditions: (a) seepage field under blocked tunnel construction conditions; and (b) seepage field under unblocked tunnel construction conditions.
Sustainability 17 04585 g010
Figure 11. A comparison of the groundwater upper-level changes in boreholes under different working conditions. The hollow symbols represent excavation under blocked conditions. The solid symbols represent excavation under unblocked conditions.
Sustainability 17 04585 g011
Figure 12. Seepage field of A–B profile for different working conditions (Figure 3 and Figure 9): (a) initial seepage field profile; (b) seepage flow field under construction blocking conditions; and (c) seepage field profile under construction without blocking conditions.
Sustainability 17 04585 g012
Figure 13. Groundwater upper level for profile A–B.
Sustainability 17 04585 g013
Figure 14. Seepage field of C–D profile for different working conditions (Figure 3 and Figure 9): (a) initial seepage field profile; (b) seepage flow field under construction blocking conditions; and (c) seepage field profile under construction without blocking conditions.
Sustainability 17 04585 g014
Figure 15. Groundwater upper level for profile C–D.
Sustainability 17 04585 g015
Figure 16. The numerical simulation calculates the water inflow for different conditions in various sections of the tunnel: (a) the blocked construction conditions; and (b) the unblocked construction conditions.
Sustainability 17 04585 g016
Table 1. Precipitation recharge data table for the study area.
Number12345678910
Infiltration Coefficient0.00050.0030.0030.0050.0040.00050.0010.00050.00050.005
Table 2. A comparison between the measured groundwater level and the simulated groundwater level.
Borehole NumberMeasured Groundwater Upper Level (m)Simulated Groundwater Upper Level (m)Relative Error (%)
1928.15915.911.31
21094.881079.151.44
31326.971333.66−0.51
41297.621314.12−1.27
51105.011089.911.37
61156.521166.96−0.90
Disclaimer/Publisher’s Note: The statements, opinions and data contained in all publications are solely those of the individual author(s) and contributor(s) and not of MDPI and/or the editor(s). MDPI and/or the editor(s) disclaim responsibility for any injury to people or property resulting from any ideas, methods, instructions or products referred to in the content.

