
Development, Thermodynamic Evaluation, and Economic Analysis of a PVT-Based Automated Indirect Solar Dryer for Date Fruits

 ,
,  ,
,  ,
,  and
and 
Abstract
1. Introduction
2. Materials and Methods
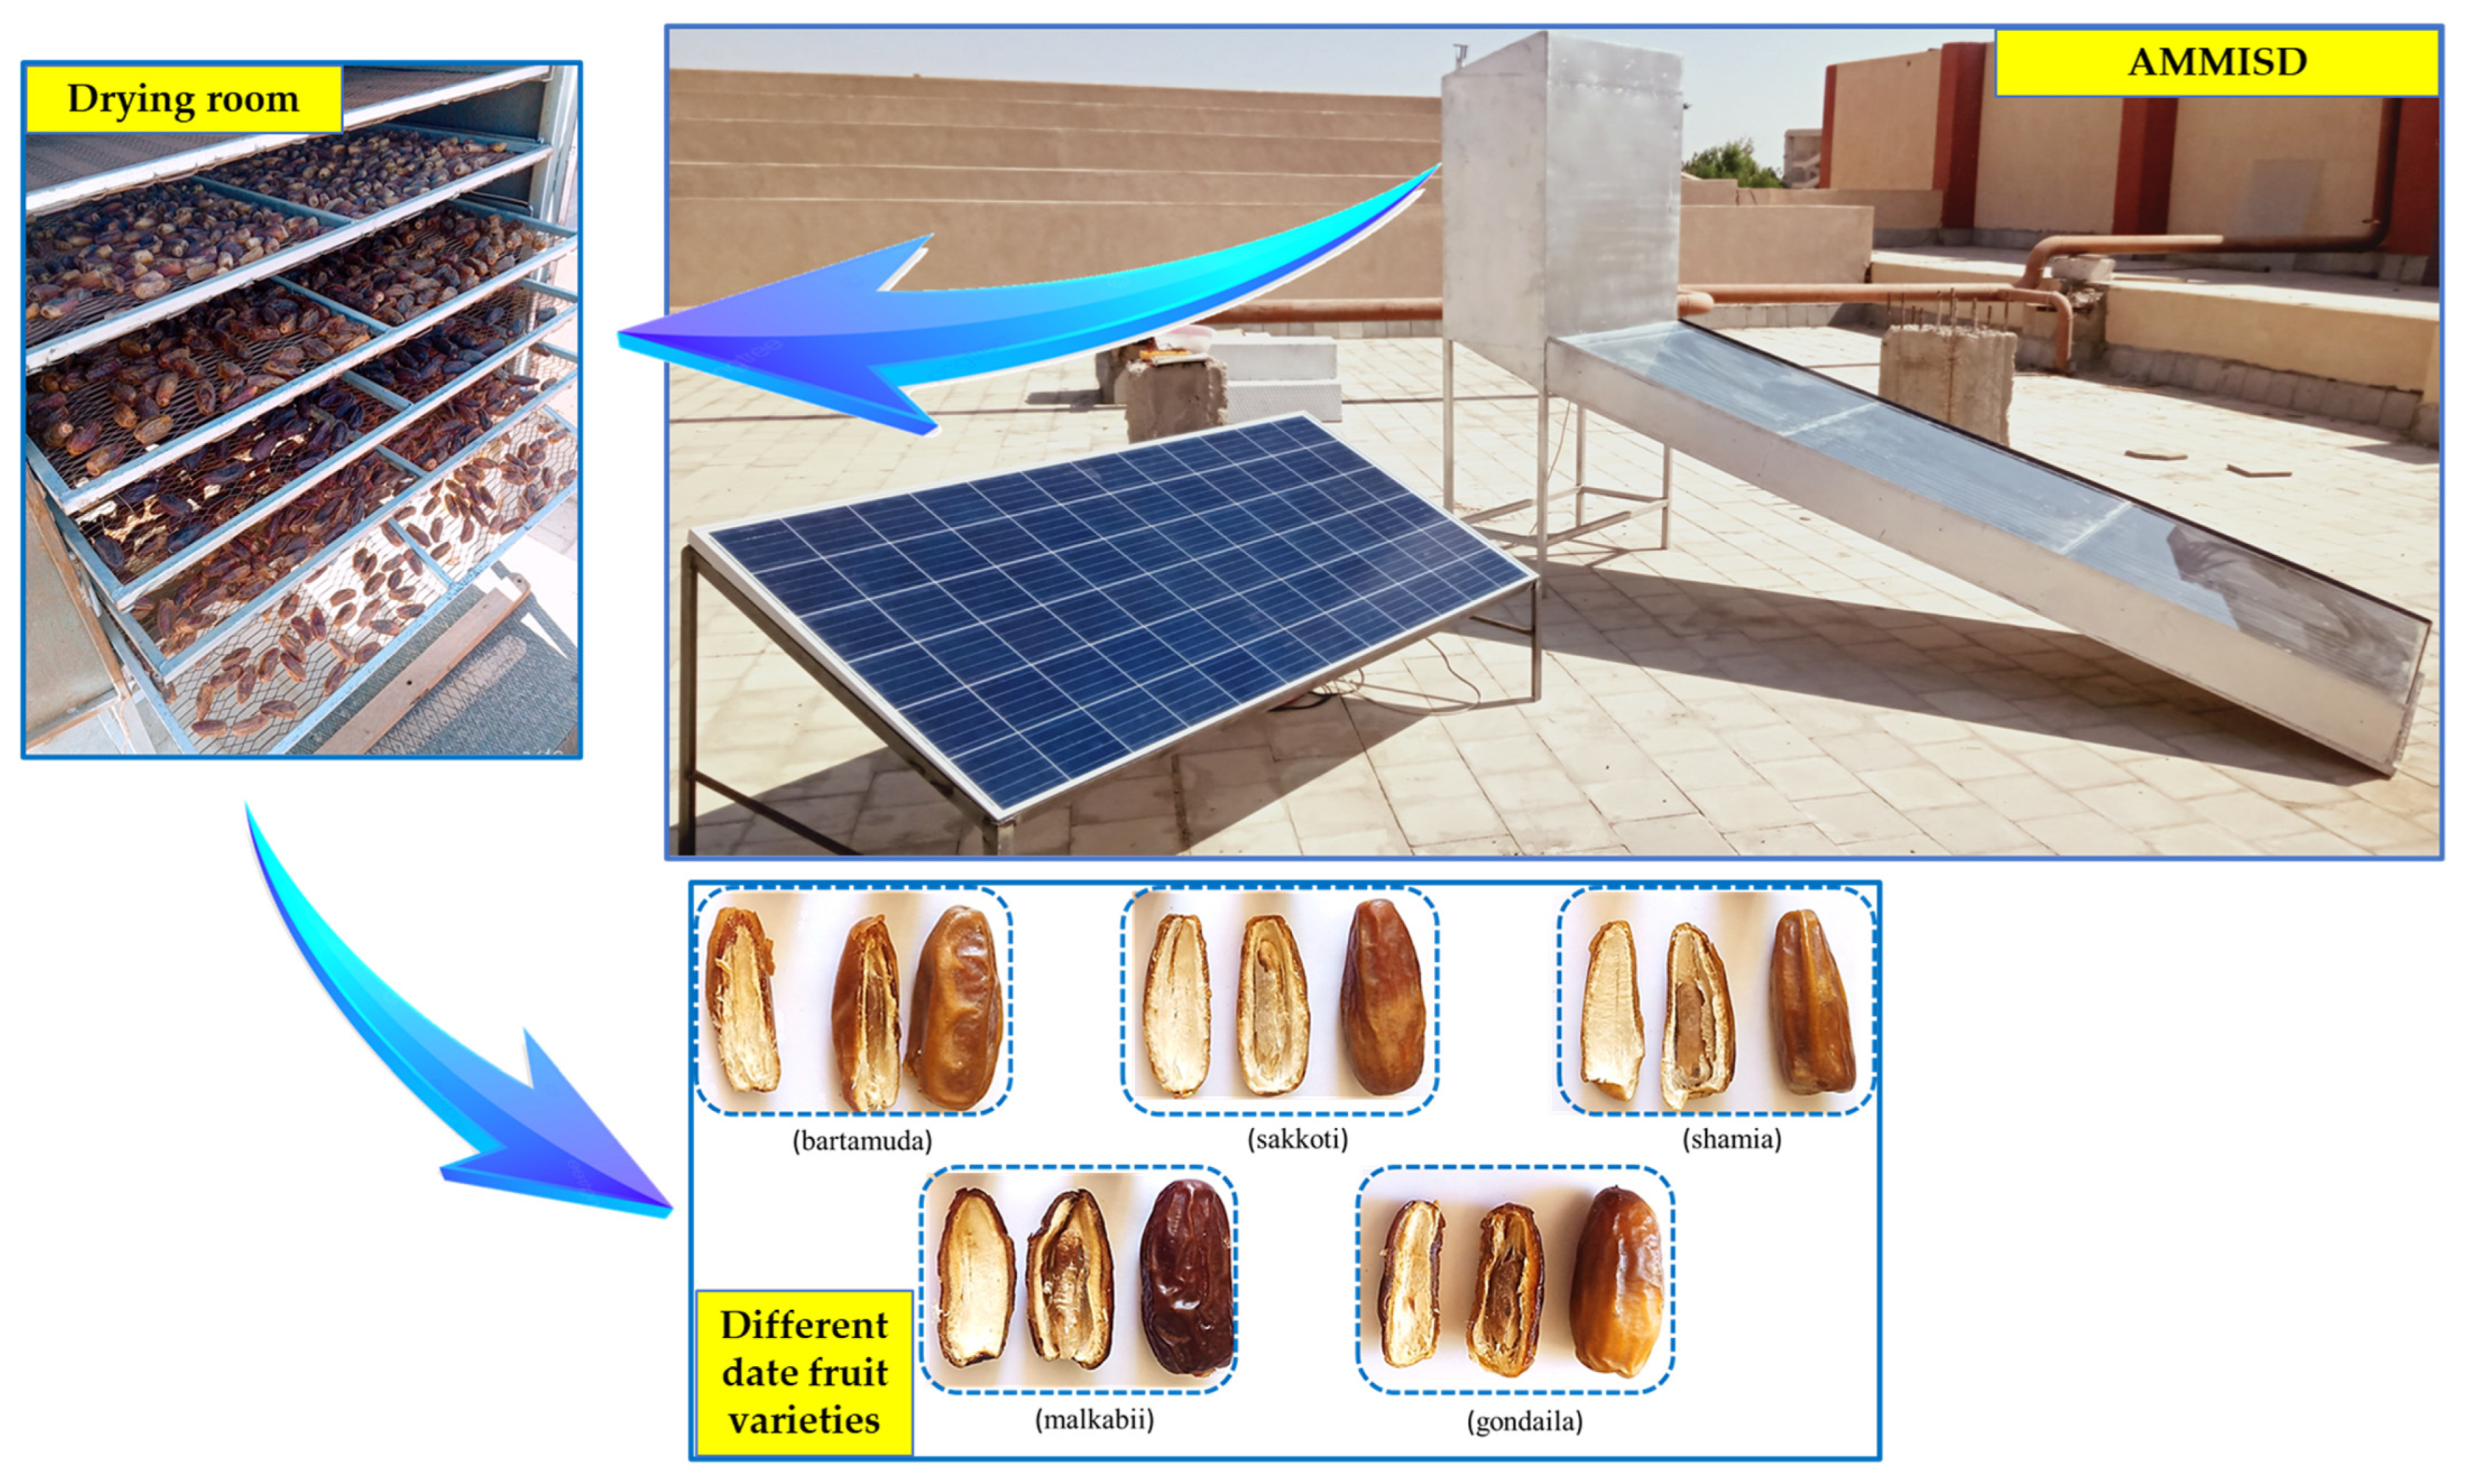
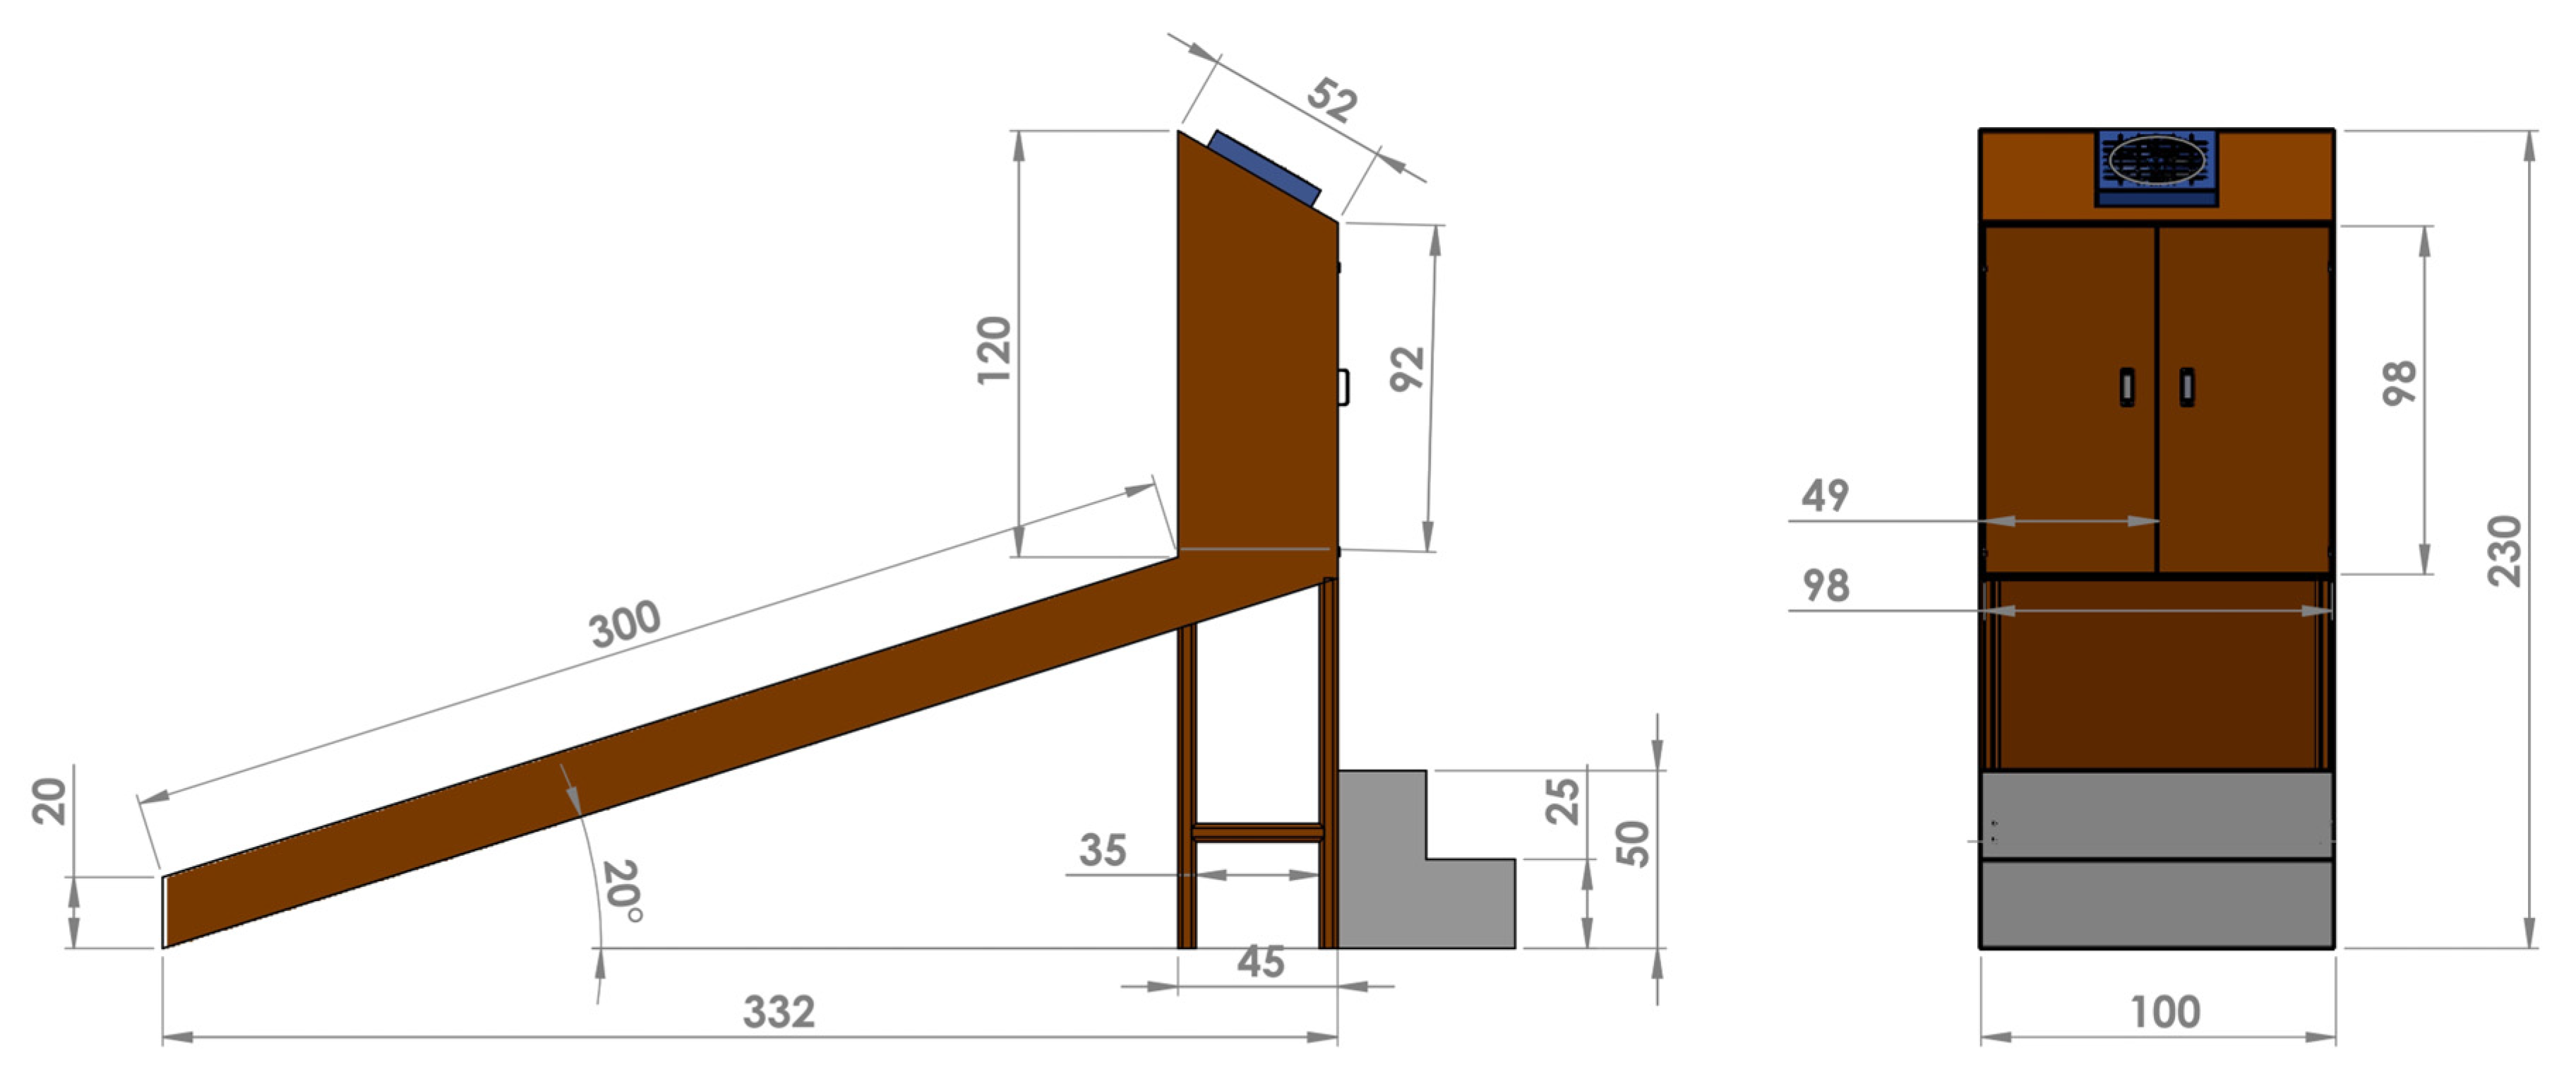
2.1. Description of the Developed AMMISD
2.2. Control Circuit and Operating Algorithm for the Developed AMMISD
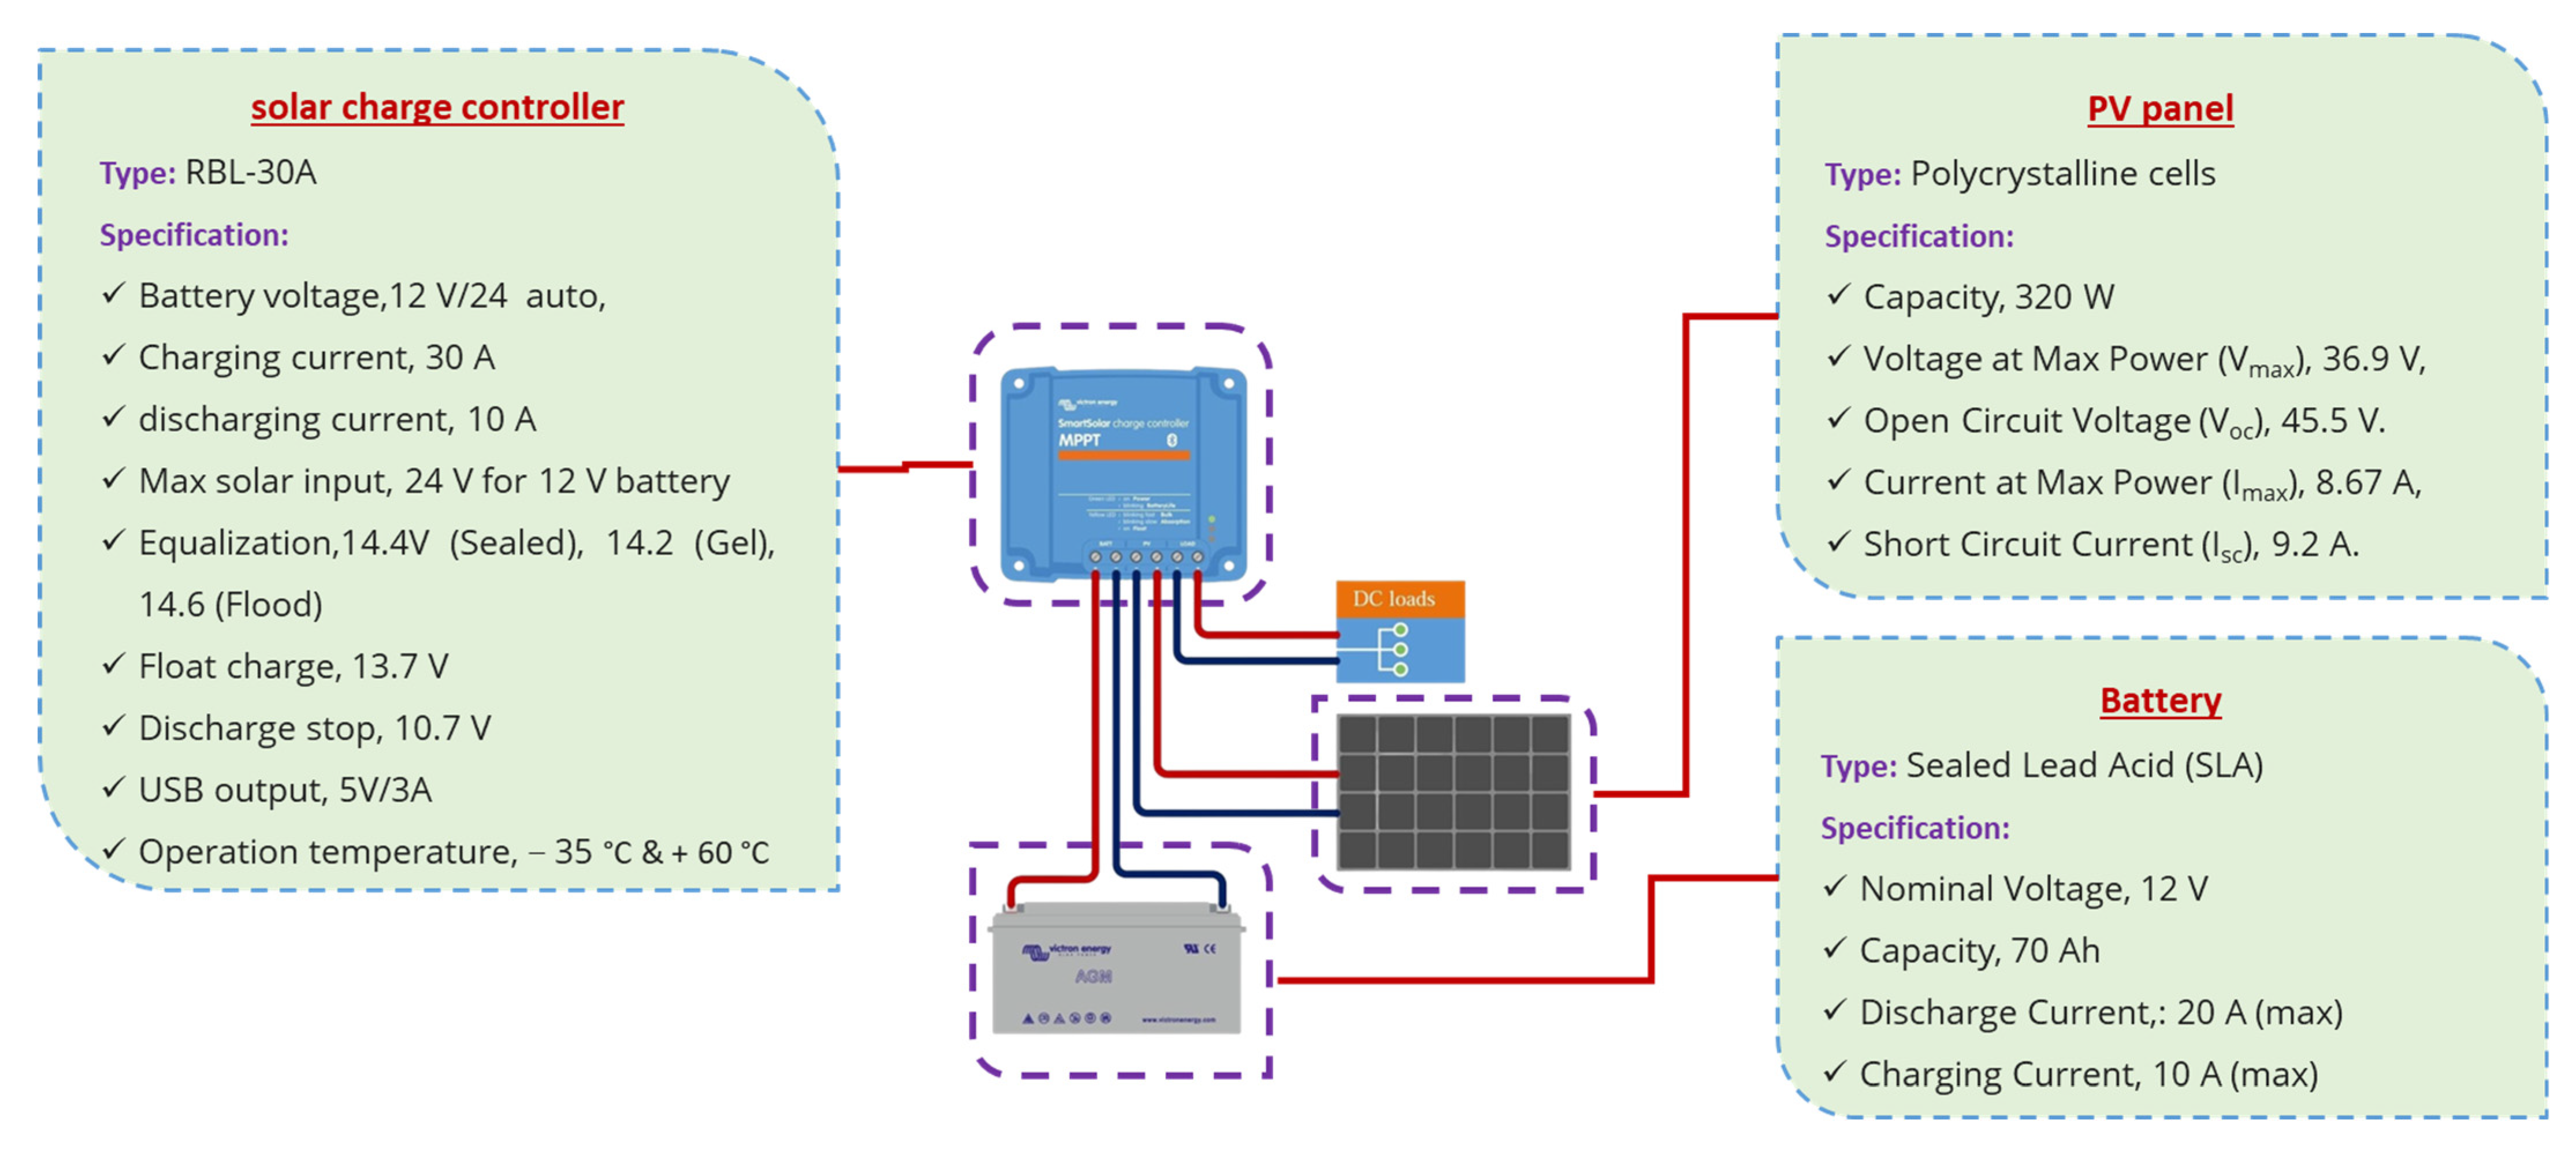
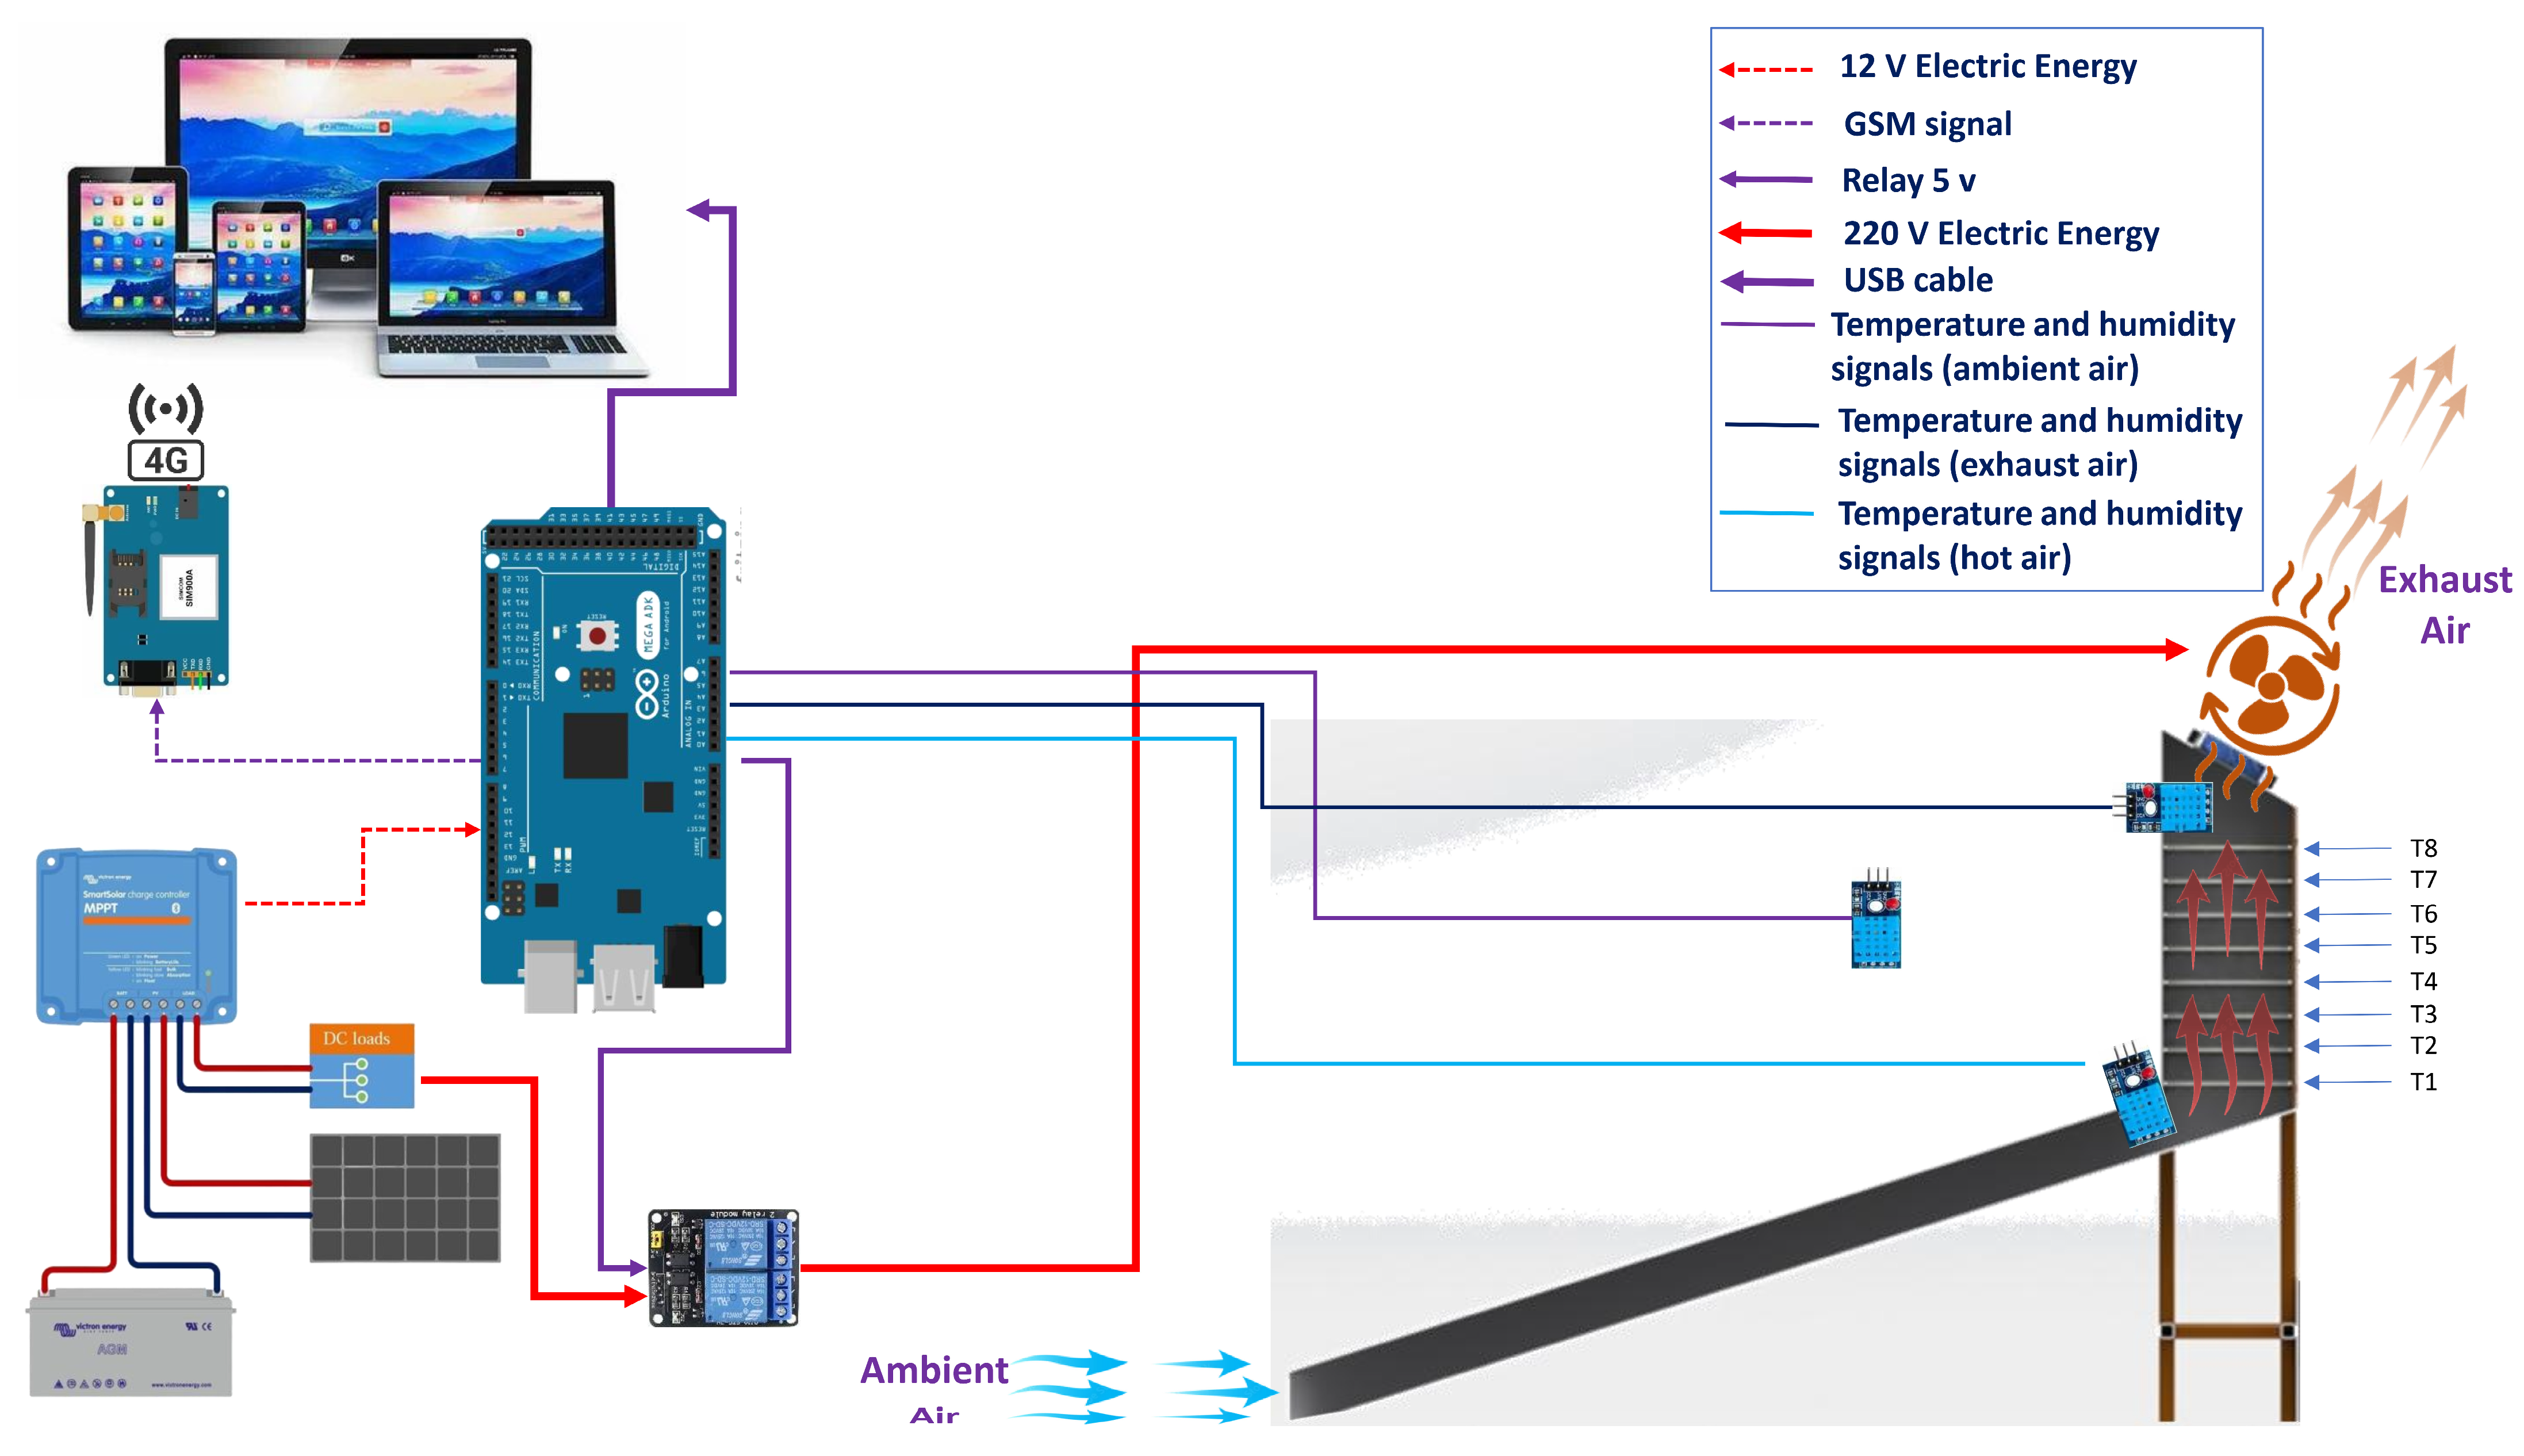
2.2.1. Design of a Control Circuit
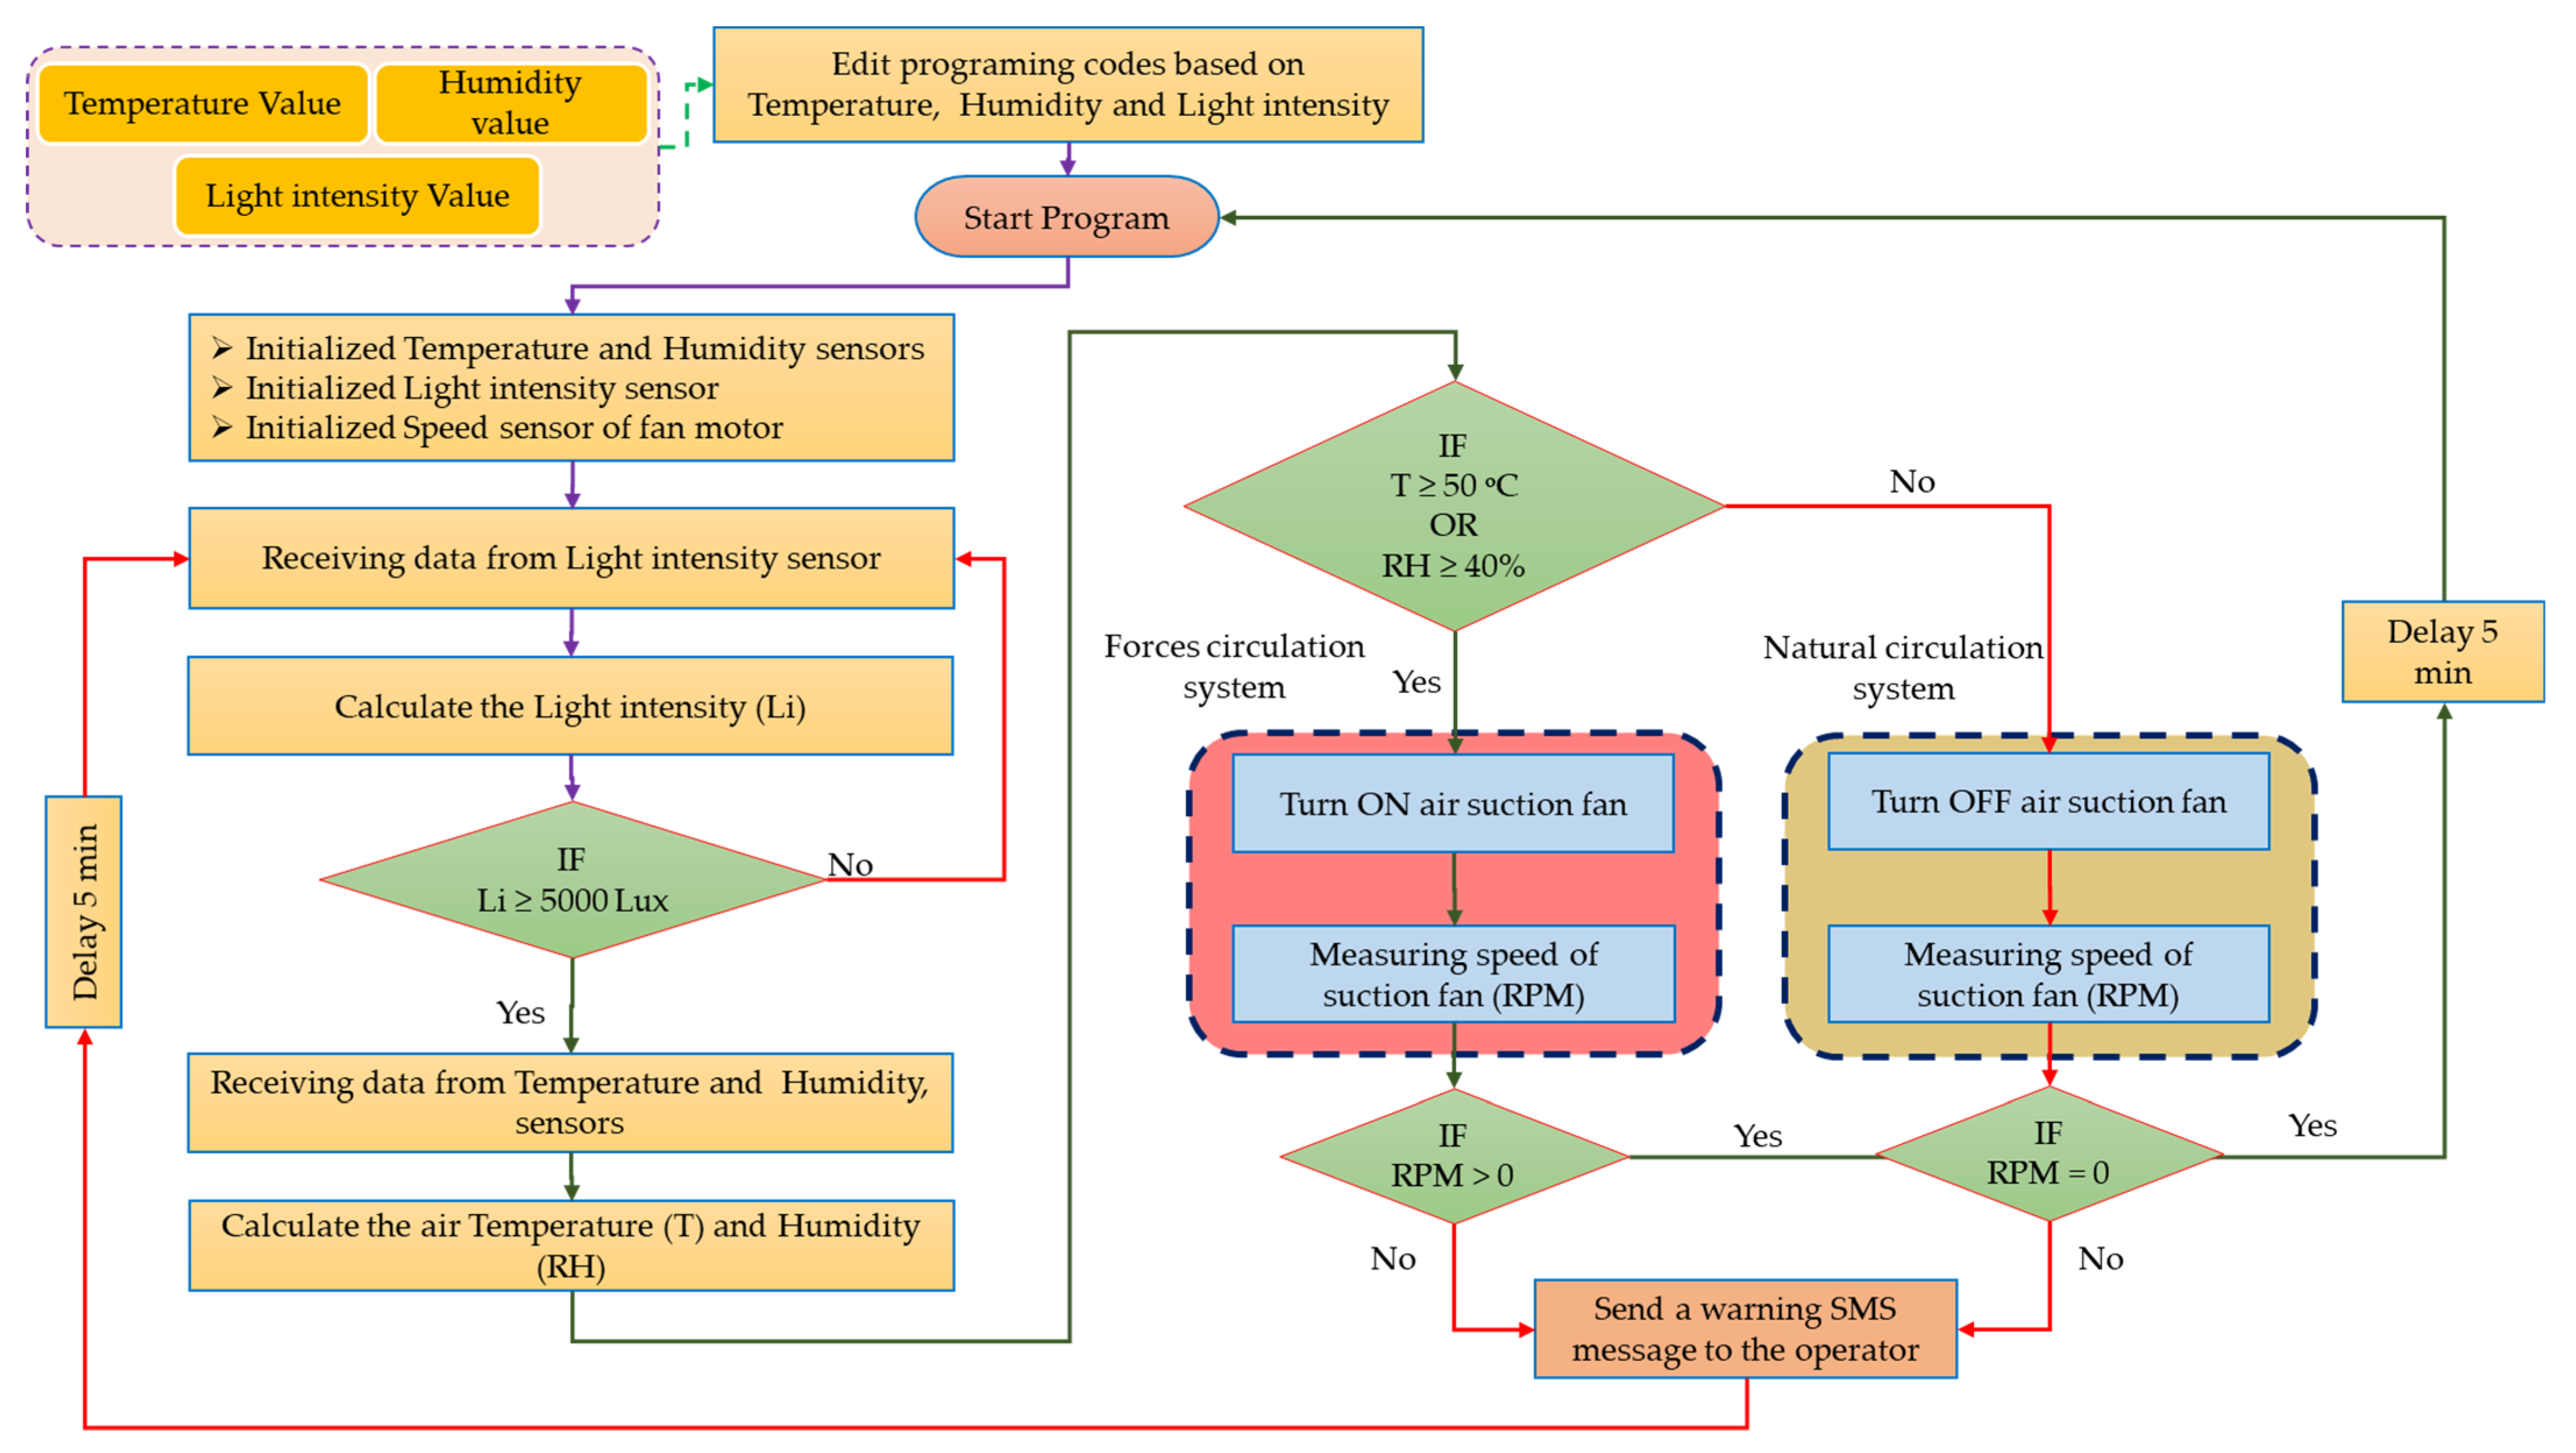
2.2.2. Operating Algorithm of the Developed AMMISD
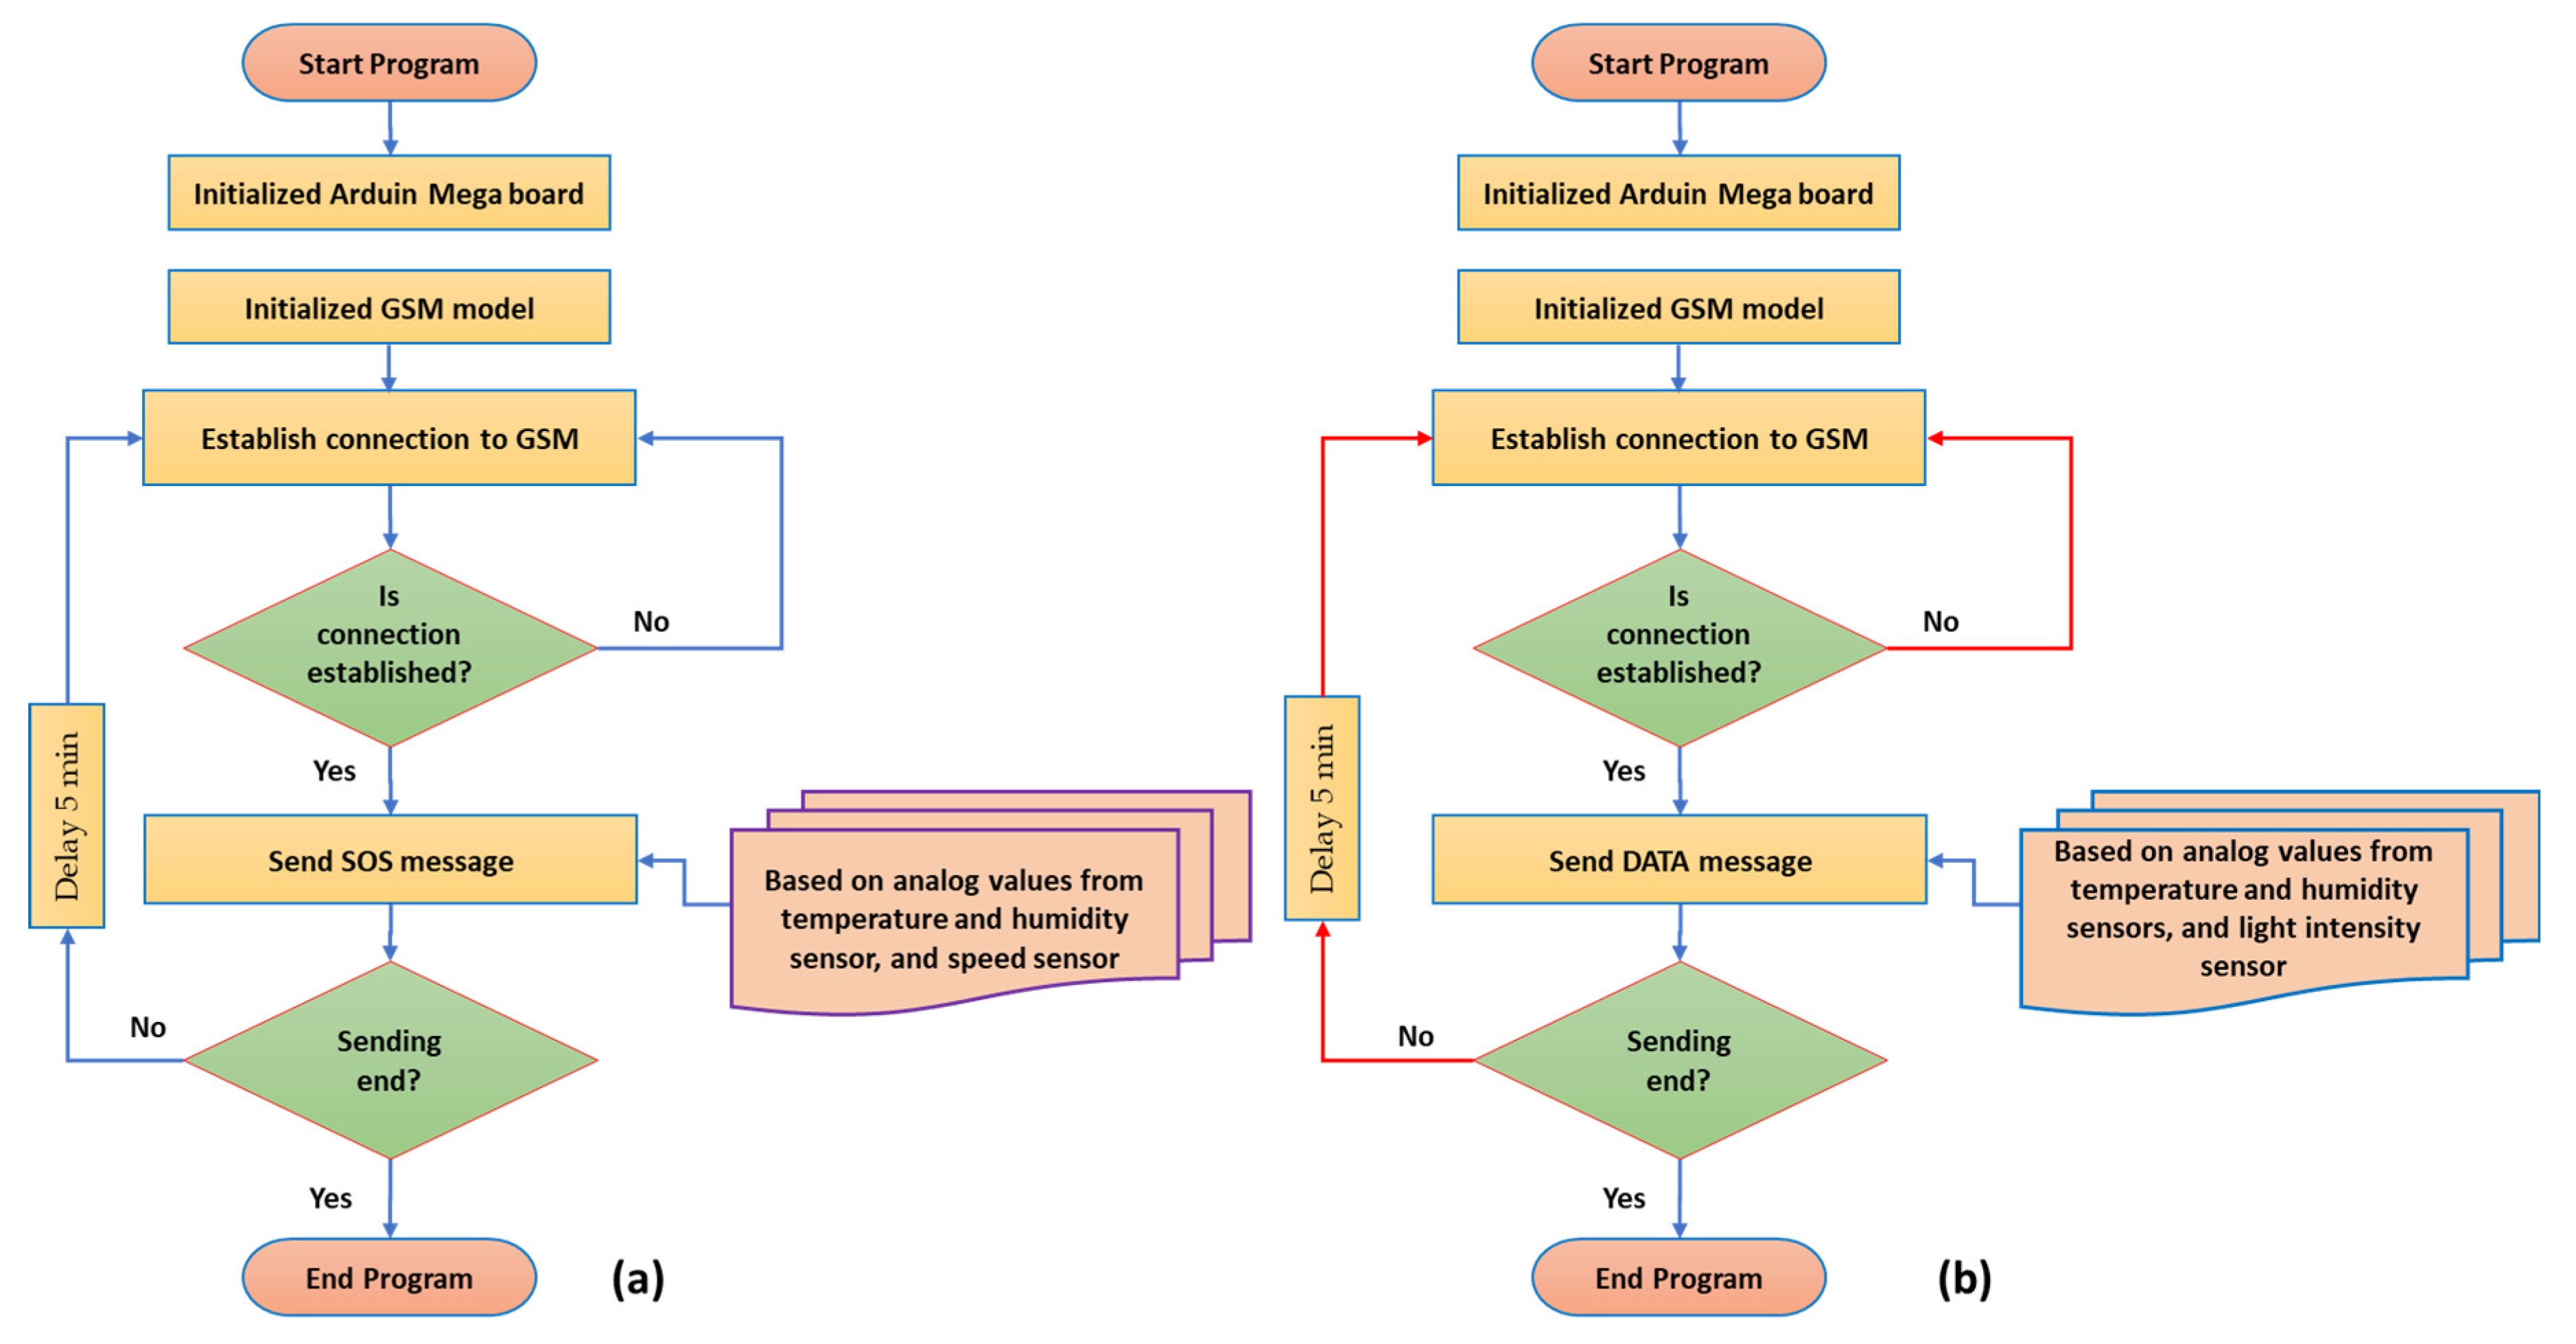
2.2.3. Operating Algorithm of the GSM Module
2.3. Performance Analysis of the Developed AMMISD
2.3.1. Moisture Content (MC)
2.3.2. Energy Analysis of the Developed AMMISD
2.3.3. Energy Analysis of the SAC and the Developed AMMISD
2.3.4. Exergy Analysis ()
Exergy Analysis of the SAC
Analysis of the DR
2.3.5. Sustainability Indicators
2.3.6. Economic Analysis
3. Results and Discussion
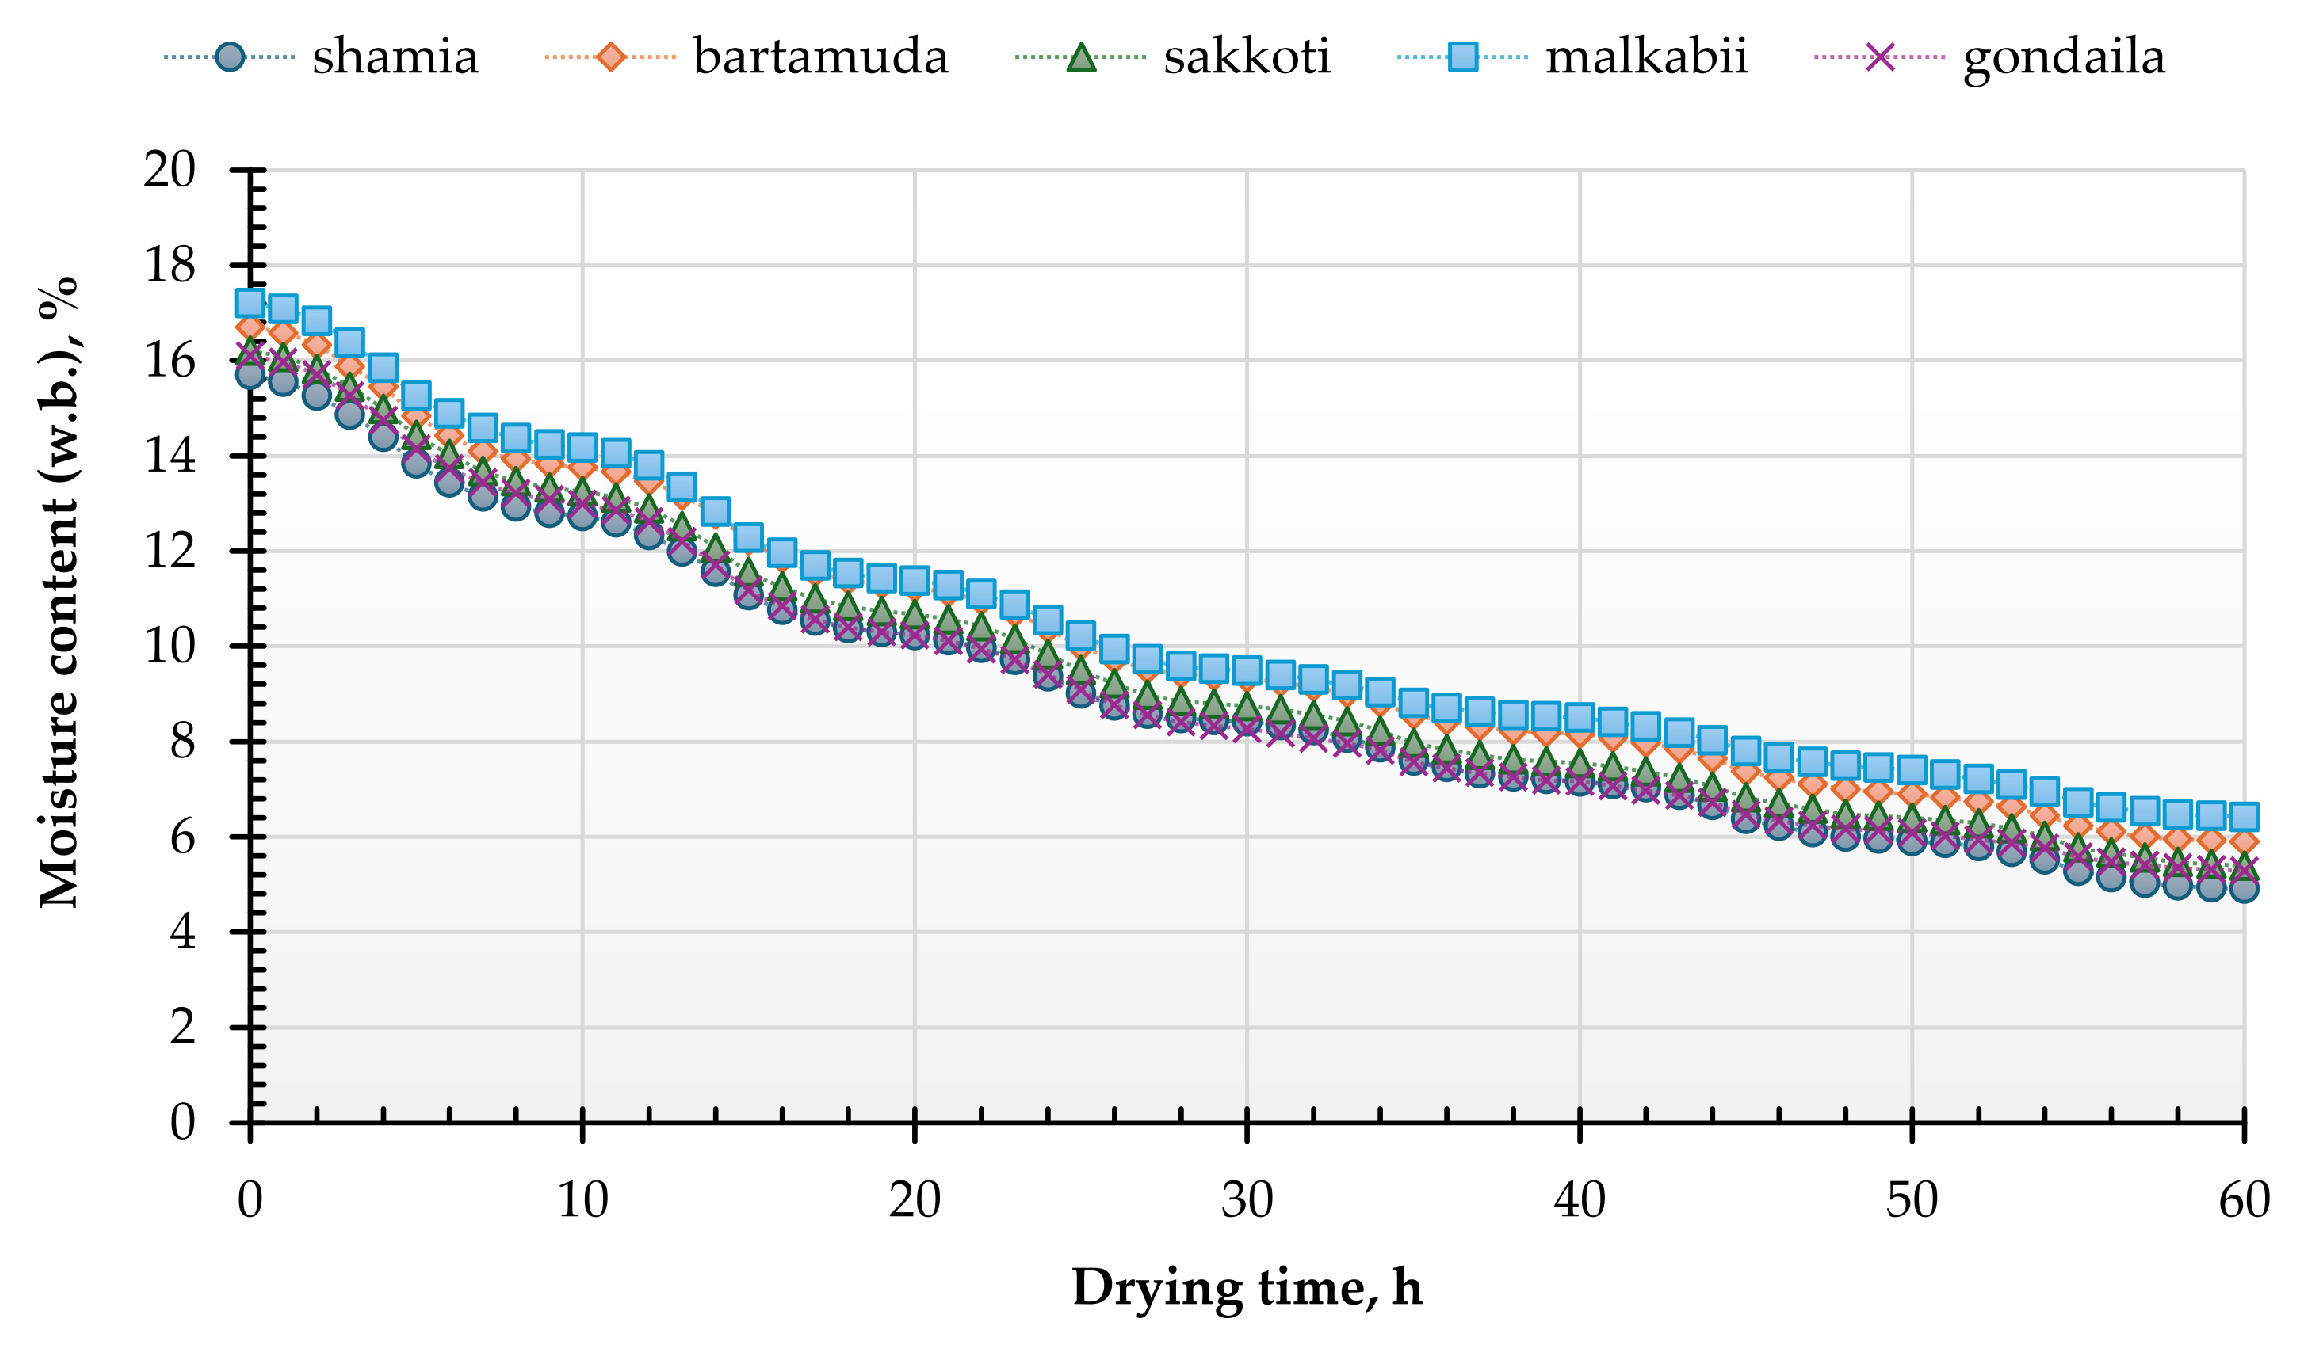
3.1. Moisture Content (MC)
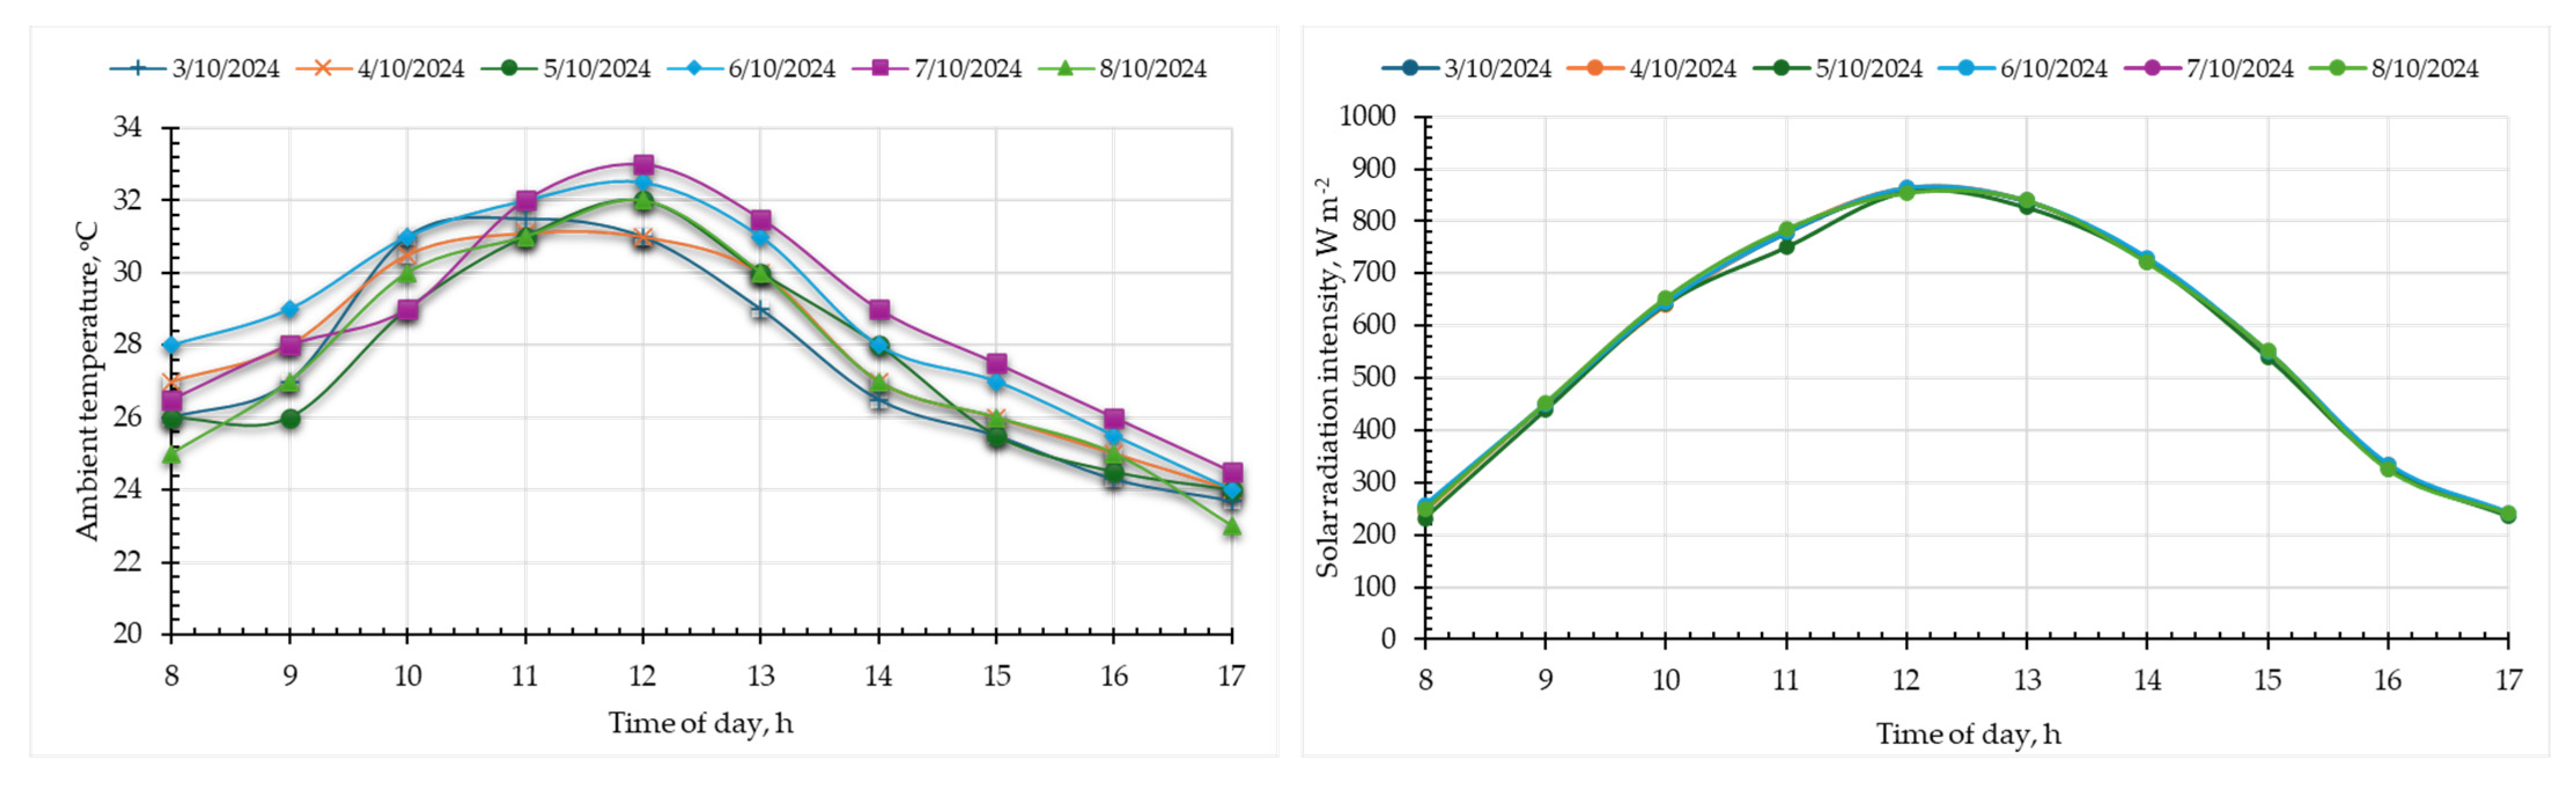
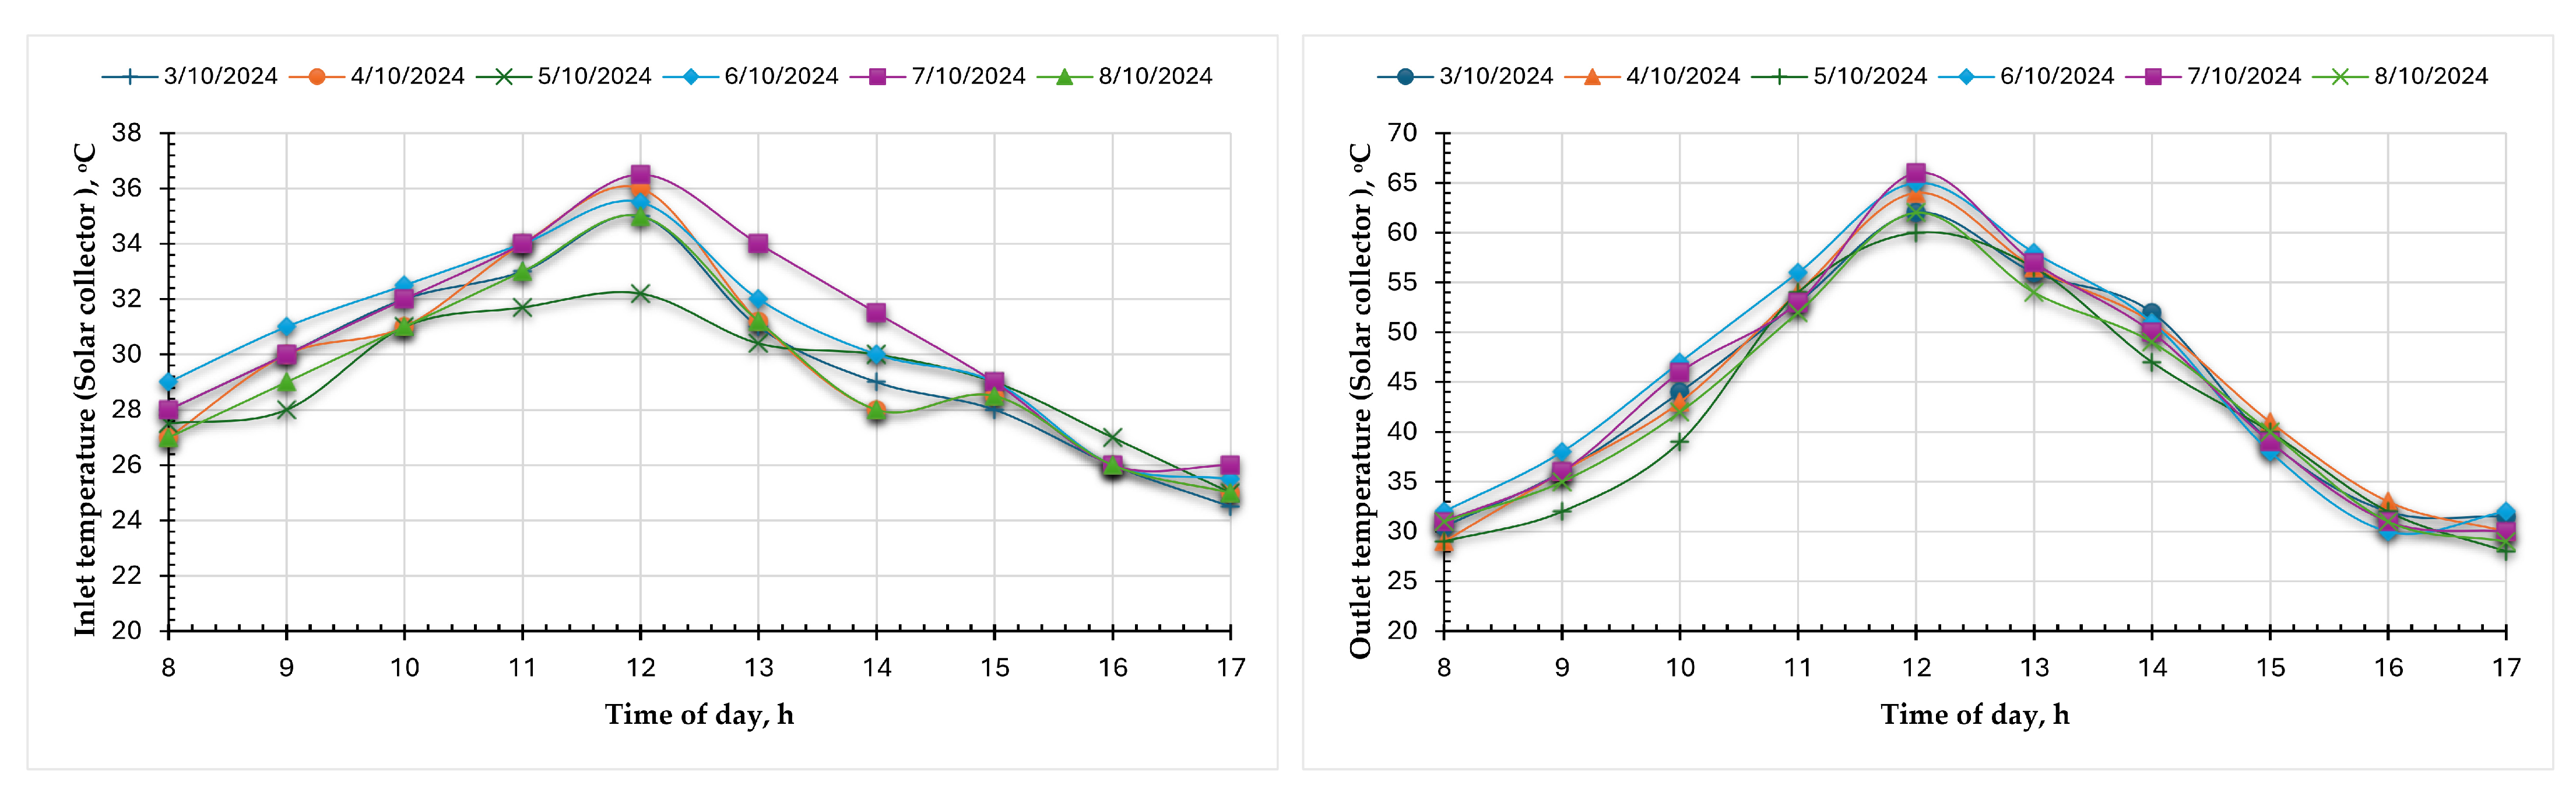
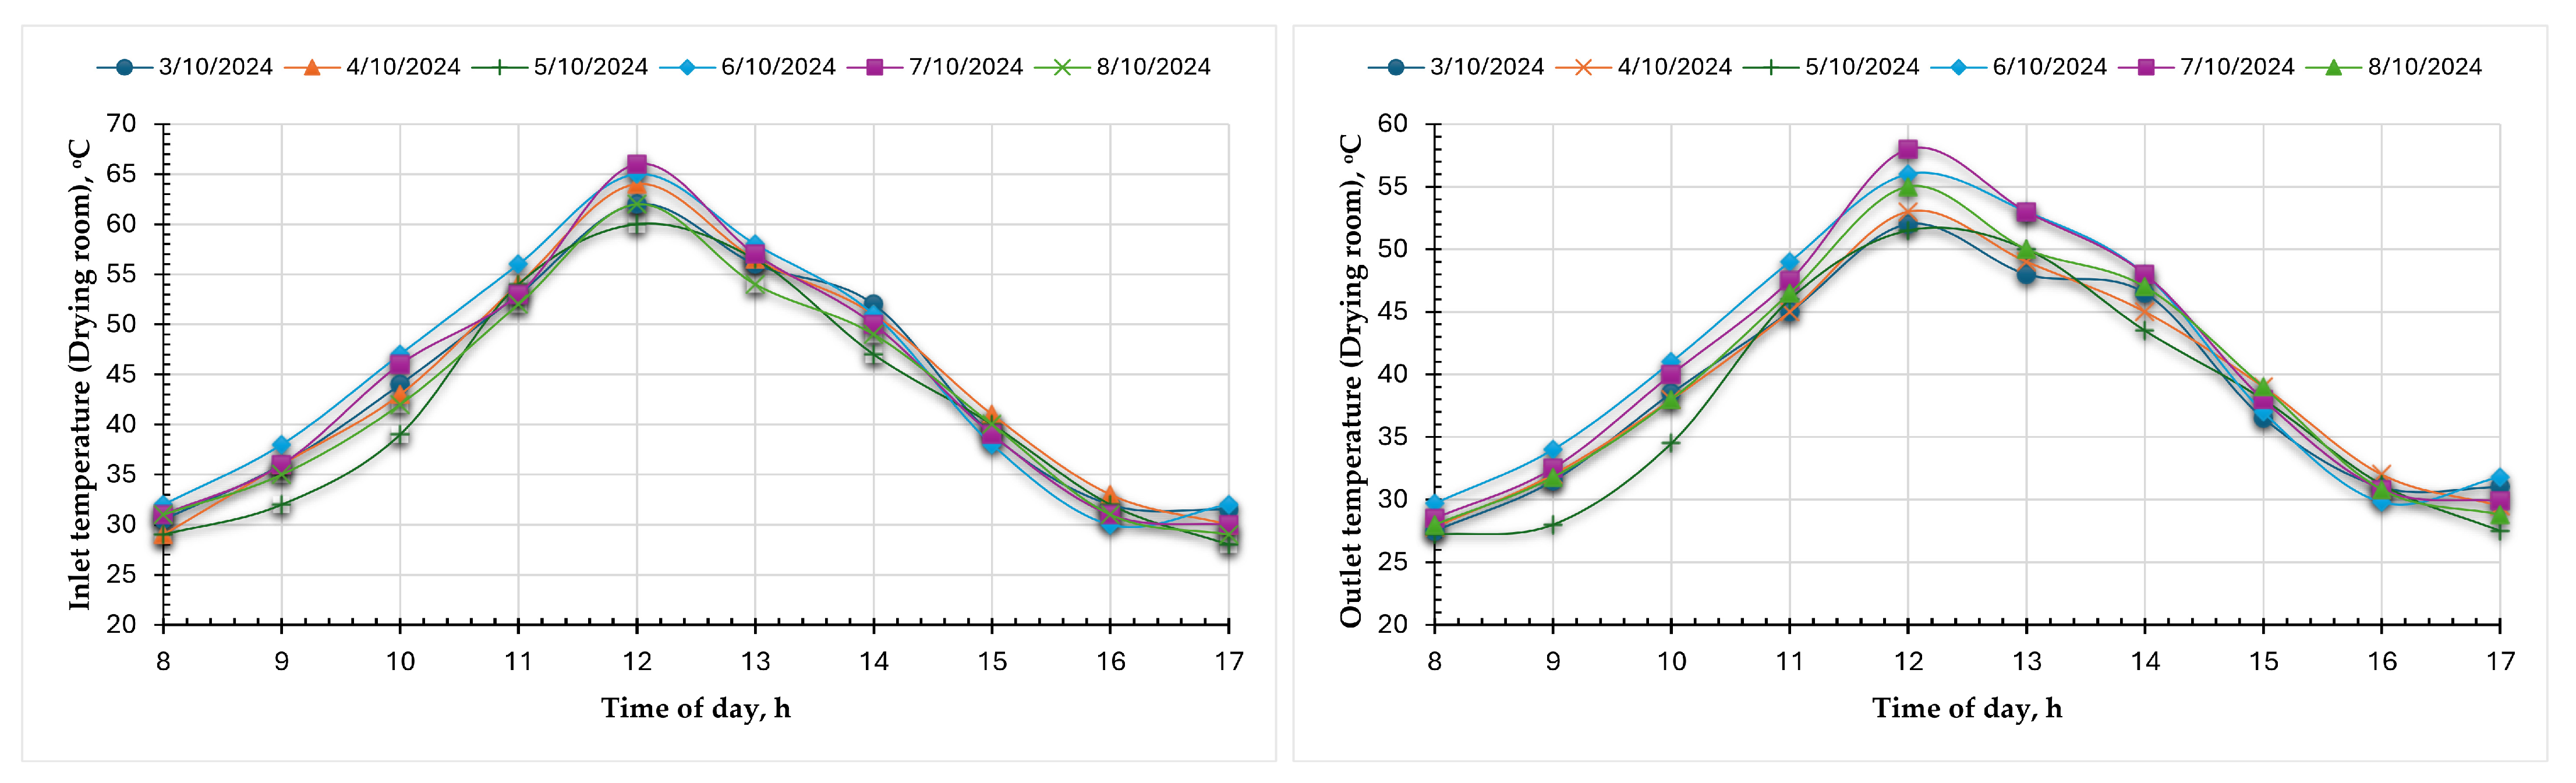
3.2. Weather Conditions During the Drying Experiments
3.3. Energy Analysis
3.3.1. Energy Analysis of the SAC
3.3.2. Energy Analysis of the Developed AMMISD
3.4. Exergy Analysis ()
3.4.1. Exergy Analysis of the SAC ()
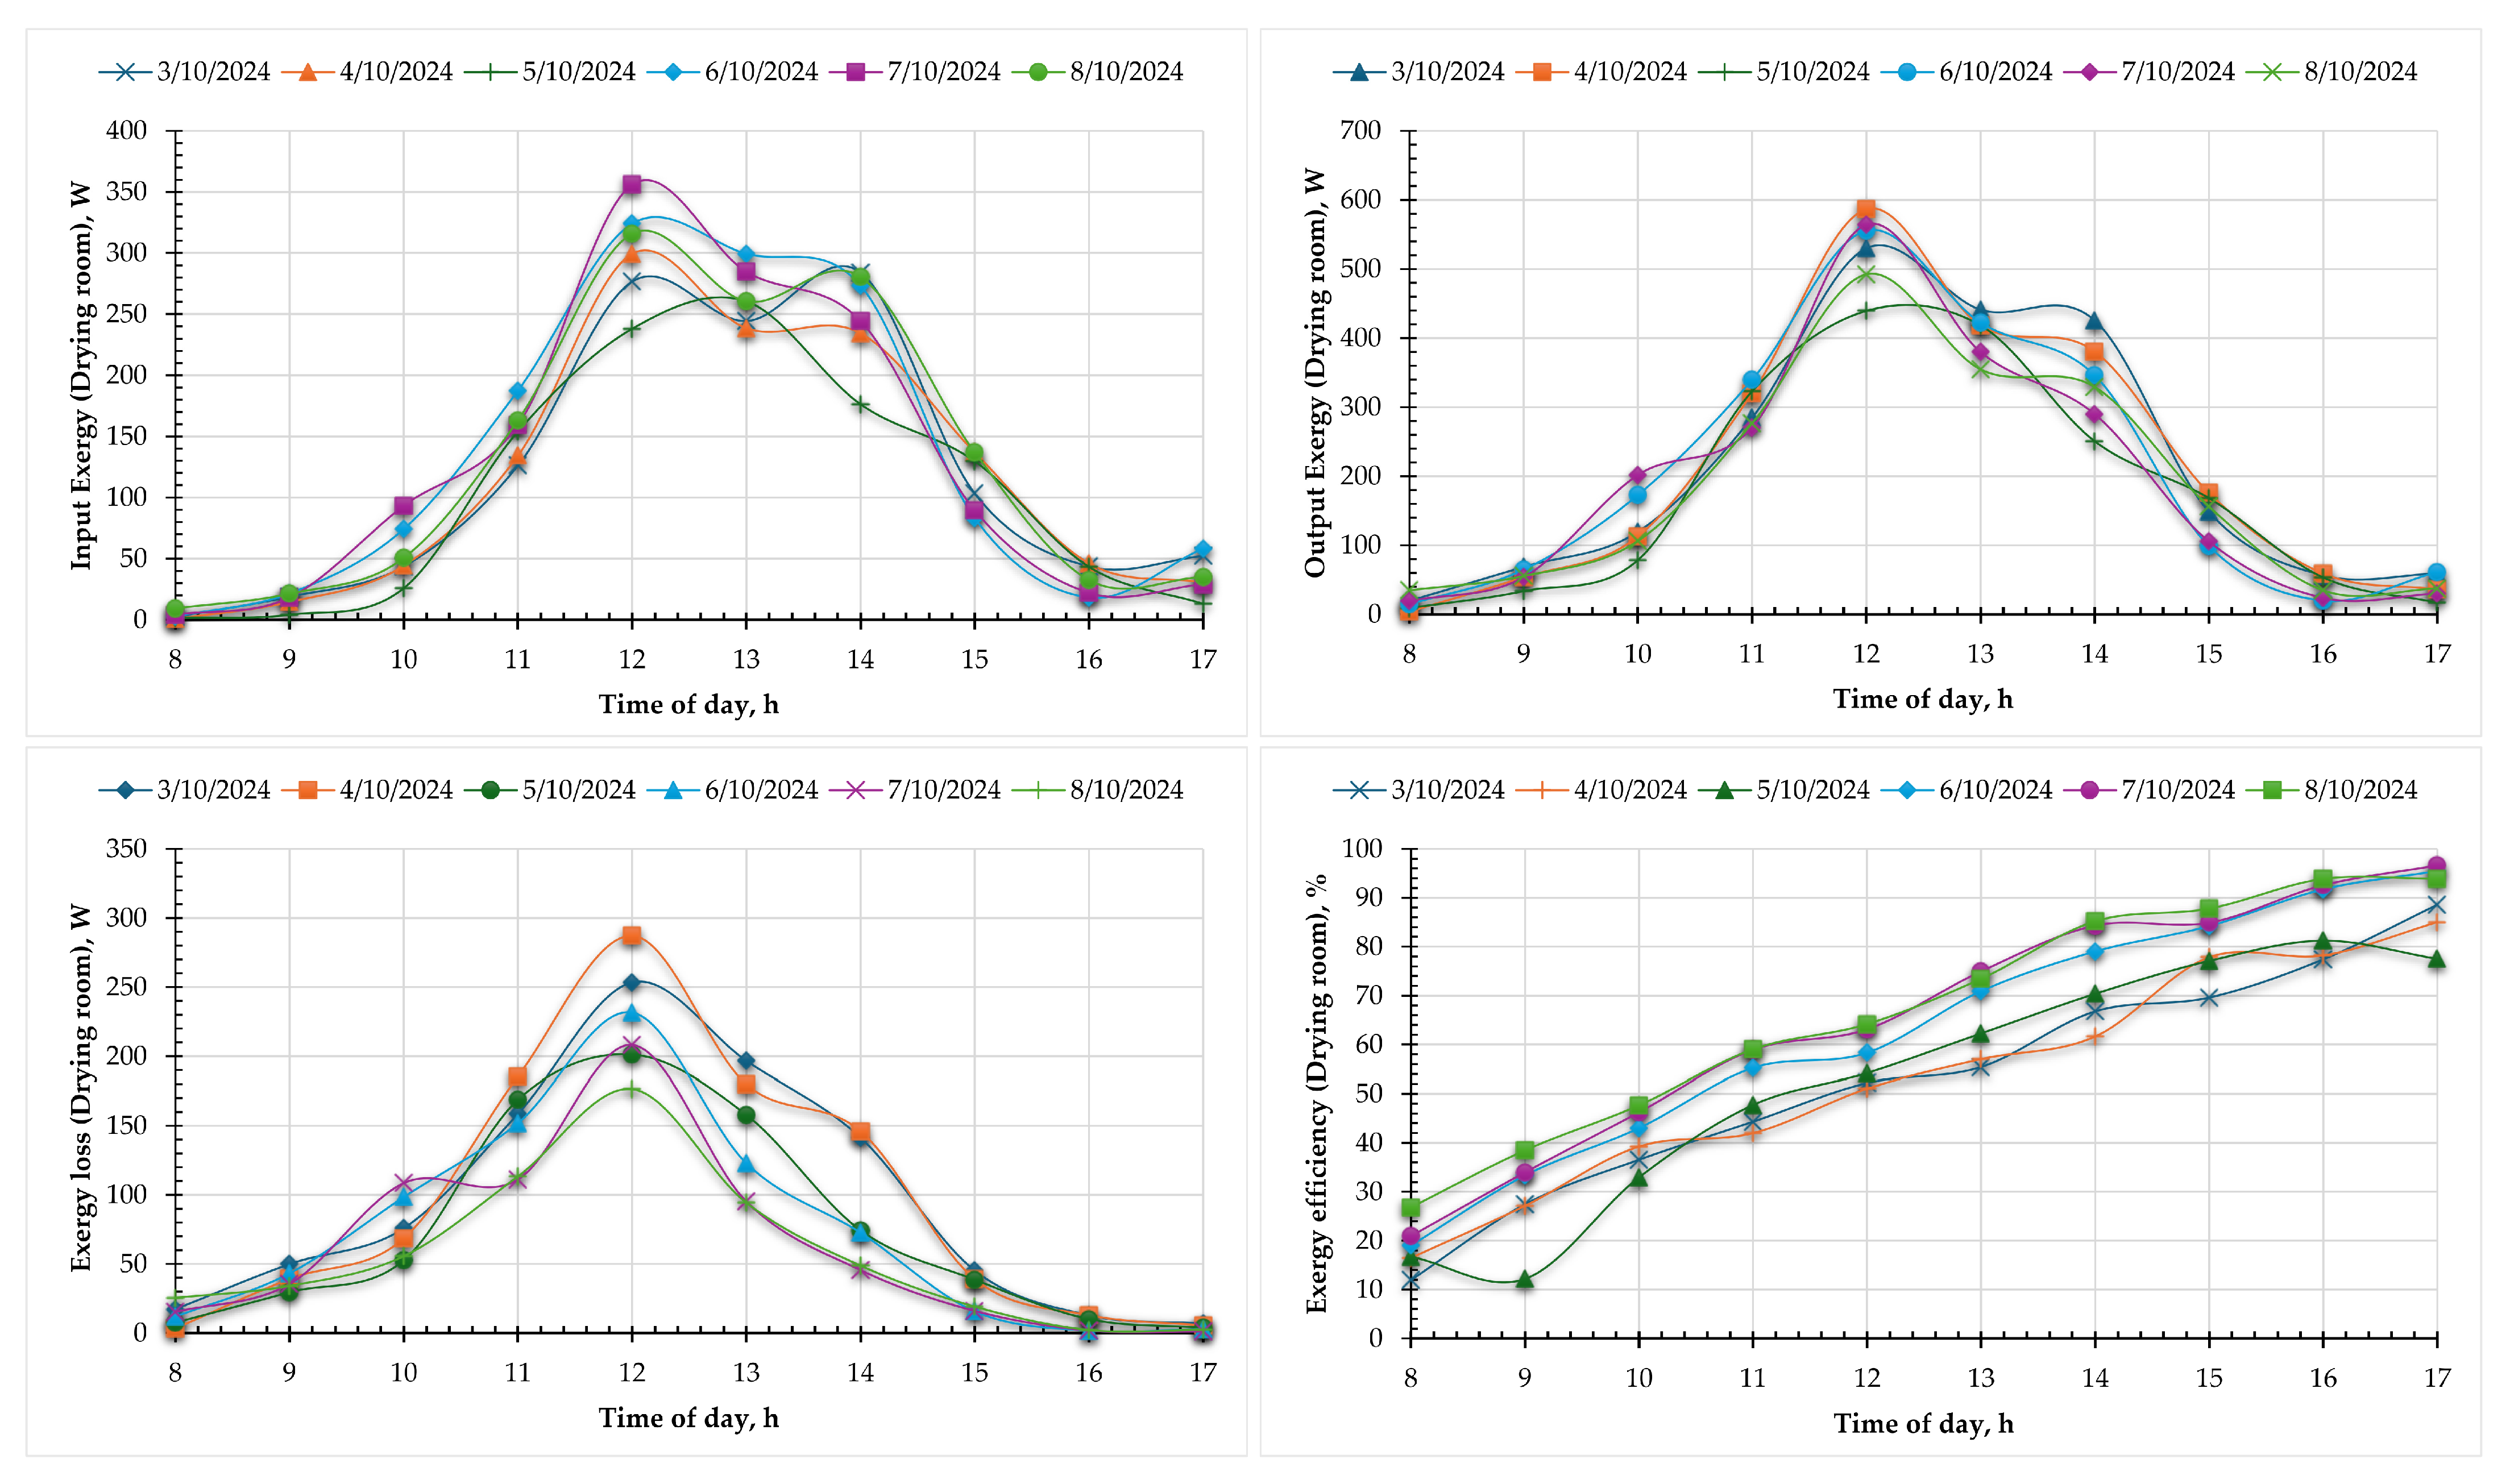
3.4.2. Exergy Analysis of the DR ()
3.5. Sustainable Indicators
3.6. Economic Analysis
4. Conclusions
- ➢
- The initial and final moisture content of date varieties ranged between 15.7% and 17.2% and 4.91% and 6.41%, respectively. And all date fruit varieties reached the equilibrium moisture content after 6 days (60 h);
- ➢
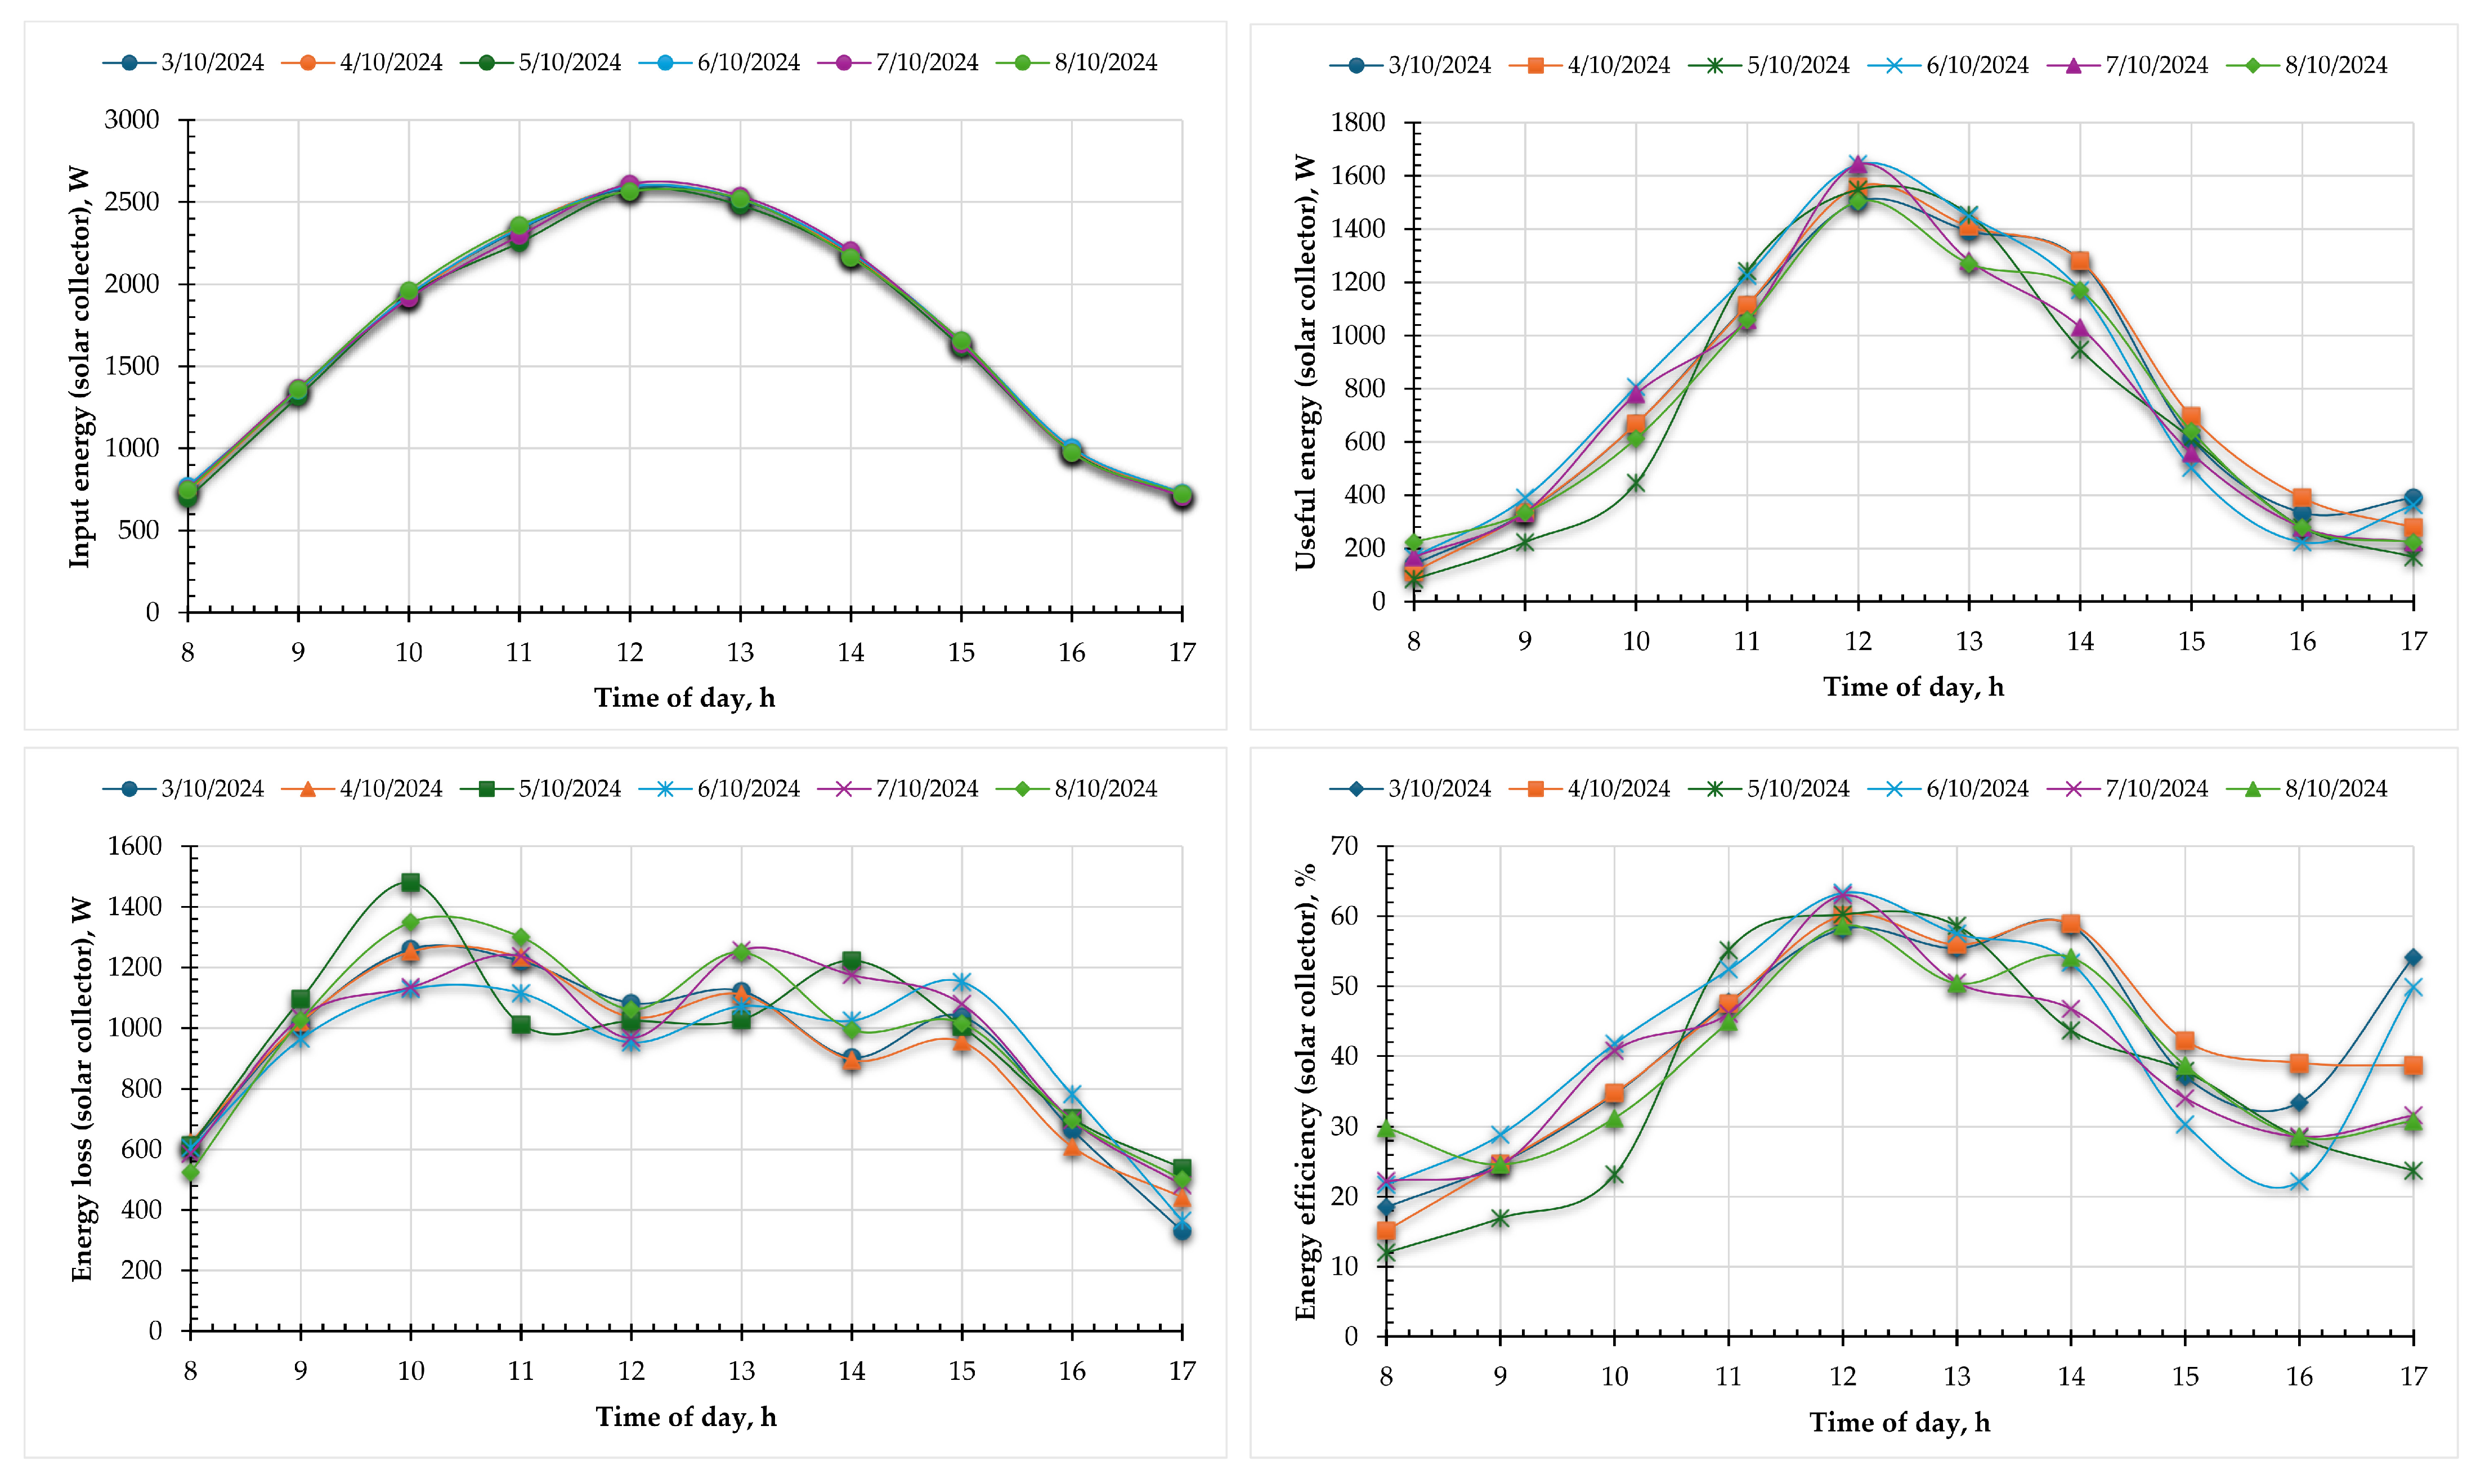
- The and ranged between 696 and 2610 W and 111.41 and 1643.35 W, respectively, depending on solar radiation, and the was in the range of 15.15%–63.33%. The maximum was observed at 12 p.m.;
- ➢
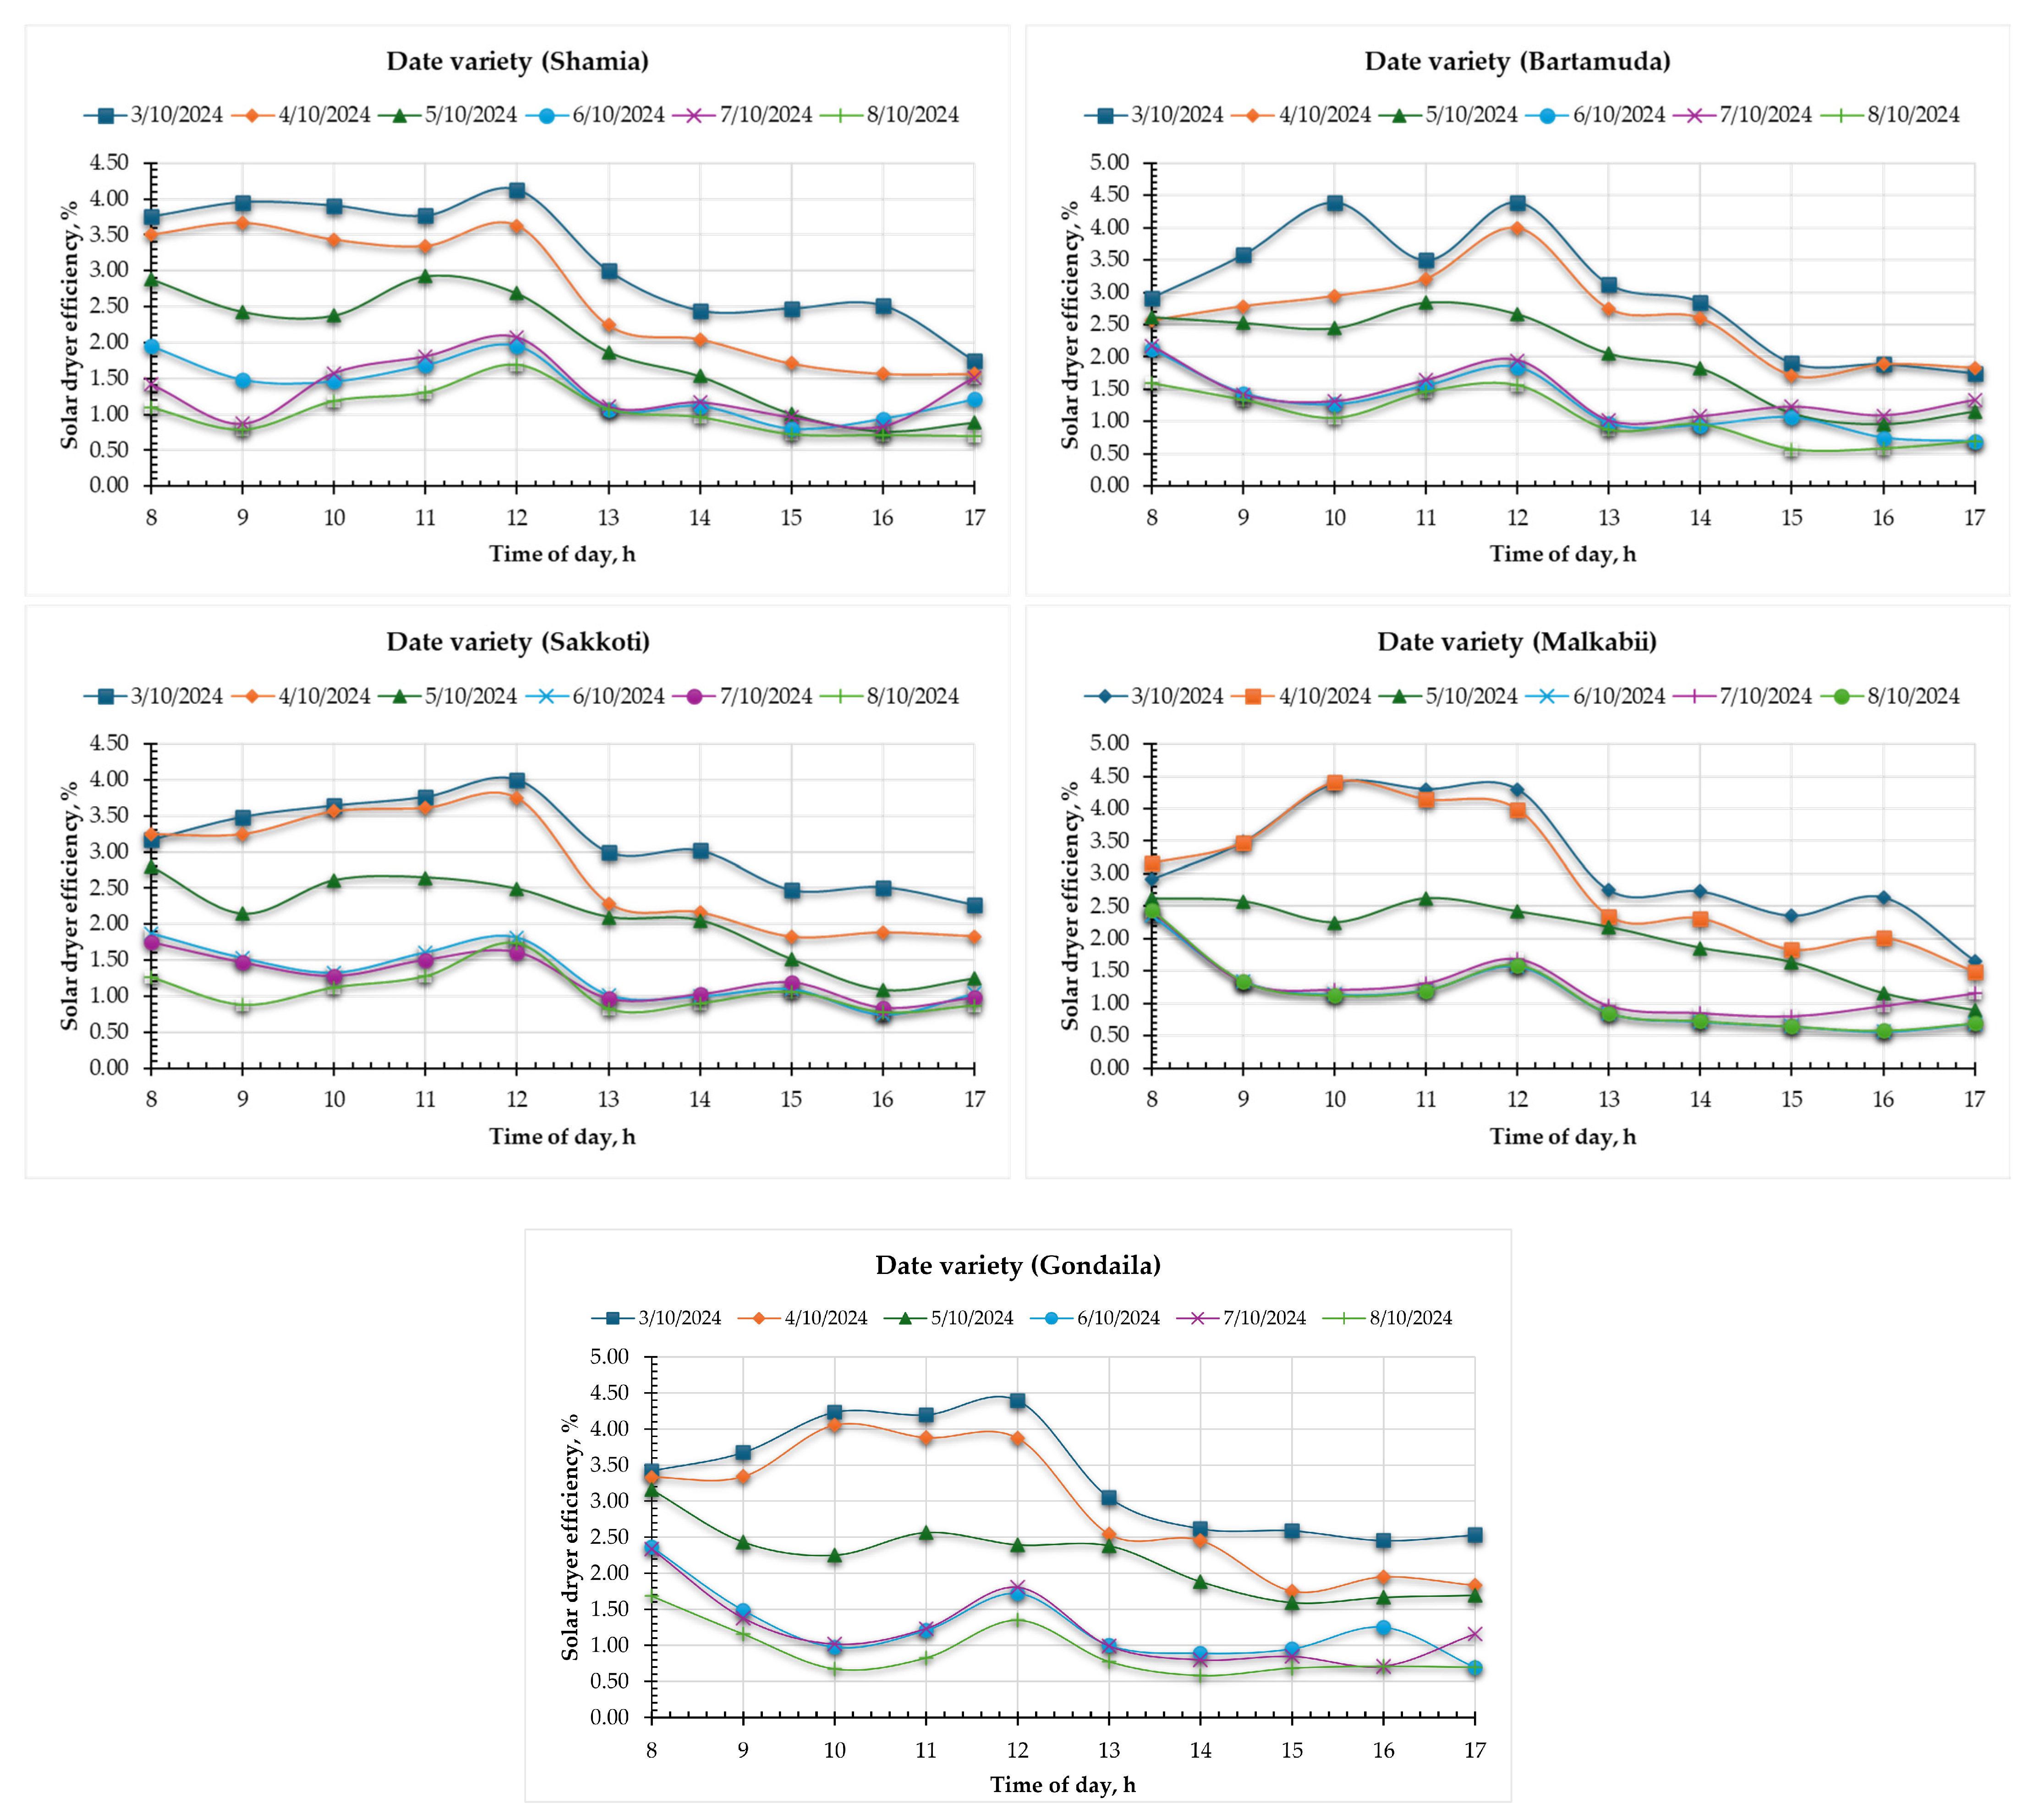
- The highest for each date variety was 4.13%, 4.39%, 4.01%, 4.41%, and 4.39% for Shamia, Bartamuda, Sakkoti, Malkabii, and Gondaila, respectively;
- ➢
- The , , and ranged between 552.67 and 2069.95 W, 3.93 W and 566.19 W, and 0.67 and 27.5%, respectively;
- ➢
- The IP was in the range of 4.62 to 13.64 W, while the SI and WER varied from 1.01 to 1.38 and 0.69 to 0.94, respectively;
- ➢
- The results of the economic analysis indicated substantial economic advantages for date fruit drying, yielding annual savings of approximately USD 236.9—realized within a 30-day validation period (harvesting season);
- ➢
- The investment recovery period was about 2.091years. This period constitutes merely 10.455% of the AMMISD’s 20-year lifespan and 9.5% of the PV system’s 25-year lifespan, demonstrating its significant cost effectiveness.
Supplementary Materials
Author Contributions
Funding
Institutional Review Board Statement
Informed Consent Statement
Data Availability Statement
Acknowledgments
Conflicts of Interest
Abbreviations
| Nomenclature | |||
| Moisture content | Exergy | ||
| Sample weight | Transmissivity of glass | ||
| Mass flow rate | Total cost of one kilogram of the dried date fruit | ||
| Drying time per batch | Cost of one kilogram of the fresh date fruit | ||
| Energy flow rate | Weight of fresh date fruit per batch | ||
| Enthalpy | Weight of dried date fruit per batch | ||
| Air velocity | Cost savings per one kilogram | ||
| Height | Selling price | ||
| Gravity acceleration | Cost savings | ||
| Work done | Inflation rate | ||
| Heat transfer | N | Payback time | |
| Useful energy | |||
| Input energy | |||
| Energy loss | Subscripts | ||
| Solar radiation intensity | Inlet | ||
| Surface area of the solar collector | Outlet | ||
| Specific heat of air | Solar air collector | ||
| Air temperature | Dryer | The solar dryer | |
| Efficiency | DR | Drying room | |
| Quantity of removed water from date sample | |||
| Latent heat of vaporization of water | Abbreviation | ||
| Drying time | AMMISD | Automatic mixed-mode indirect solar dryer | |
| Internal energy | SAC | Solar air collector | |
| Entropy | DR | Drying room | |
| Chemical energy | IP | Improvement potential | |
| Atmospheric temperature | WER | Waste exergy ratio | |
| Absorptivity of glass | SI | Sustainability index | |
| Annual capital cost | SDs | Solar dryers | |
| Annualized investment cost | PCM | Phase-change material | |
| Maintenance cost | AT | Air temperature | |
| Salvage value | RH | Relative humidity | |
| Total capital cost | SOS | Early warning system | |
| Capital recovery factor | PV | Photovoltaic | |
| ld | Interest rate | AC | Alternative current |
| n | Operational life | Li | Light intensity |
| Drying cost per kg of date fruit | MC | Moisture content | |
| Number of available drying days per year | SD | Solar dryer | |
References
- Elghazali, M.N.; Tawfeuk, H.Z.; Gomaa, R.; Abbas, A.A.; Tantawy, A.A.; Zakaria, H. Effect of Dehydration Methods on Physicochemical Properties of Aswan Dry Dates. Assiut J. Agric. Sci. 2020, 51, 50–64. [Google Scholar] [CrossRef]
- Elghazali, M.N.; Tawfeuk, H.Z.; Gomaa, R.; Tantawy, A.A. Technological Studies on Aswan Dry Dates Products After Dehydration. Assiut J. Agric. Sci. 2020, 51, 32–49. [Google Scholar] [CrossRef]
- Fernández-López, J.; Viuda-Martos, M.; Sayas-Barberá, E.; Navarro-Rodríguez de Vera, C.; Pérez-Álvarez, J.Á. Biological, nutritive, functional and healthy potential of date palm fruit (Phoenix dactylifera L.): Current research and future prospects. Agronomy 2022, 12, 876. [Google Scholar] [CrossRef]
- Fleck, A. The World’s Largest Producers of Dates. Available online: https://www.statista.com/chart/29563/biggest-producers-of-dates/ (accessed on 30 January 2025).
- Radojčin, M.; Pavkov, I.; Bursać Kovačević, D.; Putnik, P.; Wiktor, A.; Stamenković, Z.; Kešelj, K.; Gere, A. Effect of Selected Drying Methods and Emerging Drying Intensification Technologies on the Quality of Dried Fruit: A Review. Processes 2021, 9, 132. [Google Scholar] [CrossRef]
- Xu, B.; Tiliwa, E.S.; Yan, W.; Azam, S.M.R.; Wei, B.; Zhou, C.; Ma, H.; Bhandari, B. Recent Development in High Quality Drying of Fruits and Vegetables Assisted by Ultrasound: A Review. Food Res. Int. 2022, 152, 110744. [Google Scholar] [CrossRef]
- Bhattacharjee, S.; Mohanty, P.; Sahu, J.K.; Sahu, J.N. A Critical Review on Drying of Food Materials: Recent Progress and Key Challenges. Int. Commun. Heat. Mass. Transf. 2024, 158, 107863. [Google Scholar] [CrossRef]
- Thamkaew, G.; Sjöholm, I.; Galindo, F.G. A Review of Drying Methods for Improving the Quality of Dried Herbs. Crit. Rev. Food Sci. Nutr. 2021, 61, 1763–1786. [Google Scholar] [CrossRef]
- Elwakeel, A.E.; Oraiath, A.A.T.; Gameh, M.A.; Eissa, A.S.; Mahmoud, S.F.; Eid, M.H.; Moussa, A.; Mostafa, M.B.; Taha, M.F.; Abulmeaty, S.A.T.; et al. Quality Evaluation of Dried Tomato Fruit and Optimization of Drying Conditions Using a Modified Solar Dryer Integrated with an Automatic Solar Collector Tracker. Sci. Rep. 2025, 15, 7659. [Google Scholar] [CrossRef]
- Ghanem, T.H.M.; Nsasrat, L.S.; Younis, O.S.; Metwally, K.A.; Salem, A.; Orban, Z.; Eid, M.H.; El-Mesery, H.S.; Eldin, A.Z.; Elmolakab, K.M.; et al. Thin-Layer Modeling, Drying Parameters, and Techno-Enviro-Economic Analysis of a Solar Dried Salted Tilapia Fish Fillets. Sci. Rep. 2025, 15, 5073. [Google Scholar] [CrossRef]
- Elwakeel, A.E.; Wapet, D.E.M.; Mahmoud, W.A.E.; Abdallah, S.E.; Mahmoud, M.M.; Ardjoun, S.A.E.M.; Tantawy, A.A. Design and Implementation of a PV-Integrated Solar Dryer Based on Internet of Things and Date Fruit Quality Monitoring and Control. Int. J. Energy Res. 2023, 2023, 7425045. [Google Scholar] [CrossRef]
- Elwakeel, A.E.; Tantawy, A.A.; Alsebiey, M.M.; Elliby, A.K. The Date Fruit Drying Systems: Acritical over Review. Al-Azhar J. Agric. Eng. 2022, 2, 26–36. [Google Scholar] [CrossRef]
- Elwakeel, A.E.; El-Mesery, H.S.; Elbeltagi, A.; Salem, A.; Sabry, A.; Saleh, D.I.; Moustapha, M.E.; Abu-Taha, H.L.; Elkot, W.F. Development, Drying Characteristics, and Environmental Analysis of a PV Operated Automatic Solar Dryer for Drying Date. Front. Sustain. Food Syst. 2025, 9, 1531601. [Google Scholar] [CrossRef]
- Younis, O.S.; Oraiath, A.A.; Metwally, K.A.; Dessoky, E.S.; Mahmoud, S.F.; Rashed, M.N.; Tantawy, A.A.; Abdallah, S.E.; Eid, M.H.; Taha, M.F.; et al. Drying characteristics, environmental and economic analysis of a solar dryer with evacuated tube solar collector for drying Nile Tilapia slices. Sci. Rep. 2025, 15, 9822. [Google Scholar] [CrossRef]
- Bayrak, F.; Aktaş, M.; Aktaş, A.; Şevik, S.; Aktekeli, B.; Güven, Y. Analysis of a Novel PVT Dryer Using a Sustainable Control Approach. Renew. Energy 2025, 245, 122728. [Google Scholar] [CrossRef]
- Gupta, A.; Das, B.; Mondol, J.D. Utilizing a Novel Method of Sand-Filled Thermal Energy Storage System for Performance Enhancement in PVT Solar Dryer. Sol. Energy Mater. Sol. Cells 2025, 283, 113450. [Google Scholar] [CrossRef]
- Ceballos, L.A.V.; López-Vidaña, E.C.; Romero-Perez, C.K.; Escobedo-Bretado, J.; García-Valladares, O.; Domínguez, I.R.M. Techno-Economic and Environmental Assessment of a Photovoltaic-Thermal (PV-T) Solar Dryer for Habanero Chili (Capsicum Chinense): 4E (Energy, Economic, Embodied and Environmental) Analysis. Renew. Energy 2025, 245, 122758. [Google Scholar] [CrossRef]
- Panwar, N.L.; Kaushik, S.C.; Kothari, S. A Review on Energy and Exergy Analysis of Solar Dying Systems. Renew. Sustain. Energy Rev. 2012, 16, 2812–2819. [Google Scholar] [CrossRef]
- Sansaniwal, S.K.; Sharma, V.; Mathur, J. Energy and Exergy Analyses of Various Typical Solar Energy Applications: A Comprehensive Review. Renew. Sustain. Energy Rev. 2018, 82, 1576–1601. [Google Scholar] [CrossRef]
- Sinha, A.A.; Choudhary, T.; Ansari, M.Z. Estimation of Exergy-Based Sustainability Index and Performance Evaluation of a Novel Intercooled Hybrid Gas Turbine System. Int. J. Hydrogen Energy 2023, 48, 8629–8644. [Google Scholar] [CrossRef]
- Hassan, R.; Barua, H.; Das, B.K. Energy, Exergy, Exergo-environmental, and Exergetic Sustainability Analyses of a Gas Engine-based CHP System. Energy Sci. Eng. 2021, 9, 2232–2251. [Google Scholar] [CrossRef]
- Brahma, B.; Shukla, A.K.; Baruah, D.C. Energy, Exergy, Economic and Environmental Analysis of Phase Change Material Based Solar Dryer (PCMSD). J. Energy Storage 2024, 88, 111490. [Google Scholar] [CrossRef]
- Santander, M.; Chica, V.; Correa, H.A.M.; Rodríguez, J.; Villagran, E.; Vaillant, F.; Escobar, S. Unravelling Cocoa Drying Technology: A Comprehensive Review of the Influence on Flavor Formation and Quality. Foods 2025, 14, 721. [Google Scholar] [CrossRef] [PubMed]
- Villagran, E.; Henao-Rojas, J.C.; Franco, G. Thermo-Environmental Performance of Four Different Shapes of Solar Greenhouse Dryer with Free Convection Operating Principle and No Load on Product. Fluids 2021, 6, 183. [Google Scholar] [CrossRef]
- Veeramanipriya, E.; Sundari, A.R.U. Performance Evaluation of Hybrid Photovoltaic Thermal (PVT) Solar Dryer for Drying of Cassava. Sol. Energy 2021, 215, 240–251. [Google Scholar] [CrossRef]
- Bait, O. Exergy, Environ–Economic and Economic Analyses of a Tubular Solar Water Heater Assisted Solar Still. J. Clean. Prod. 2019, 212, 630–646. [Google Scholar] [CrossRef]
- Kumar, A.; Ranjan, S.; Prakash, O.; Shukla, A. Exergy Analysis of Solar Dryers. In Green Energy and Technology; Springer: Berlin/Heidelberg, Germany, 2017; pp. 239–262. [Google Scholar]
- Mugi, V.R.; Chandramohan, V.P. Energy and Exergy Analysis of Forced and Natural Convection Indirect Solar Dryers: Estimation of Exergy Inflow, Outflow, Losses, Exergy Efficiencies and Sustainability Indicators from Drying Experiments. J. Clean. Prod. 2021, 282, 124421. [Google Scholar] [CrossRef]
- Atalay, H.; Cankurtaran, E. Energy, Exergy, Exergoeconomic and Exergo-Environmental Analyses of a Large Scale Solar Dryer with PCM Energy Storage Medium. Energy 2021, 216, 119221. [Google Scholar] [CrossRef]
- Mugi, V.R.; Chandramohan, V.P. Energy, Exergy and Economic Analysis of an Indirect Type Solar Dryer Using Green Chilli: A Comparative Assessment of Forced and Natural Convection. Therm. Sci. Eng. Prog. 2021, 24, 100950. [Google Scholar] [CrossRef]
- Selimefendigil, F.; Şirin, C.; Ghachem, K.; Kolsi, L. Exergy and Environmental Analysis of an Active Greenhouse Dryer with Al2O3 Nano-Embedded Latent Heat Thermal Storage System: An Experimental Study. Appl. Therm. Eng. 2022, 217, 119167. [Google Scholar] [CrossRef]
- Ekka, J.P.; Muthukumar, P. Exergy Efficiency and Sustainability Indicators of Forced Convection Mixed Mode Solar Dryer System for Drying Process. Renew. Energy 2024, 234, 121256. [Google Scholar] [CrossRef]
- Şevik, S.; Aktaş, M.; Dolgun, E.C.; Arslan, E.; Tuncer, A.D. Performance Analysis of Solar and Solar-Infrared Dryer of Mint and Apple Slices Using Energy-Exergy Methodology. Sol. Energy 2019, 180, 537–549. [Google Scholar] [CrossRef]
- Chowdhury, M.M.I.; Bala, B.K.; Haque, M.A. Energy and Exergy Analysis of the Solar Drying of Jackfruit Leather. Biosyst. Eng. 2011, 110, 222–229. [Google Scholar] [CrossRef]
- Shringi, V.; Kothari, S.; Panwar, N.L. Experimental Investigation of Drying of Garlic Clove in Solar Dryer Using Phase Change Material as Energy Storage. J. Therm. Anal. Calorim. 2014, 118, 533–539. [Google Scholar] [CrossRef]
- Panwar, N.L. Experimental Investigation on Energy and Exergy Analysis of Coriander (Coriadrum sativum L.) Leaves Drying in Natural Convection Solar Dryer. Appl. Sol. Energy 2014, 50, 133–137. [Google Scholar] [CrossRef]
- Ndukwu, M.C.; Bennamoun, L.; Abam, F.I.; Eke, A.B.; Ukoha, D. Energy and Exergy Analysis of a Solar Dryer Integrated with Sodium Sulfate Decahydrate and Sodium Chloride as Thermal Storage Medium. Renew. Energy 2017, 113, 1182–1192. [Google Scholar] [CrossRef]
- Kesavan, S.; Arjunan, T.V.; Vijayan, S. Thermodynamic Analysis of a Triple-Pass Solar Dryer for Drying Potato Slices. J. Therm. Anal. Calorim. 2019, 136, 159–171. [Google Scholar] [CrossRef]
- Karthikeyan, A.K.; Murugavelh, S. Thin Layer Drying Kinetics and Exergy Analysis of Turmeric (Curcuma Longa) in a Mixed Mode Forced Convection Solar Tunnel Dryer. Renew. Energy 2018, 128, 305–312. [Google Scholar] [CrossRef]
- Tiwari, S.; Tiwari, G.N. Energy and Exergy Analysis of a Mixed-Mode Greenhouse-Type Solar Dryer, Integrated with Partially Covered N-PVT Air Collector. Energy 2017, 128, 183–195. [Google Scholar] [CrossRef]
- Abdelkader, T.K.; El Salem, A.; Zhang, Y.; Gaballah, E.S.; Makram, S.O.; Fan, Q. Energy and Exergy Analysis of Carbon Nanotubes-Based Solar Dryer. J. Energy Storage 2021, 39, 102623. [Google Scholar] [CrossRef]
- Fiorentino, C.; D’Antonio, P.; Toscano, F.; Capece, N.; Conceição, L.A.; Scalcione, E.; Modugno, F.; Sannino, M.; Colonna, R.; Lacetra, E. Smart Sensors and Artificial Intelligence Driven Alert System for Optimizing Red Peppers Drying in Southern Italy. Sustainability 2025, 17, 1682. [Google Scholar] [CrossRef]
- Walke, S.; Mandake, M.; Naniwadekar, M.; Tapre, R. Dehydration of Onion Slices for Food Processing Application Using Internet of Things-Based Smart Solar Drying System. J. Sol. Energy Eng. 2025, 147, 4065981. [Google Scholar] [CrossRef]
- AOAC. Official Method of Analysis, 18th ed.; Association of Officiating Analytical Chemists: Washington, DC, USA, 2005. [Google Scholar]
- Tesfaye, A.; Habtu, N.G. Fabrication and Performance Evaluation of Solar Tunnel Dryer for Ginger Drying. Int. J. Photoenergy 2022, 2022, 6435080. [Google Scholar] [CrossRef]
- Cengel, Y.A.; Boles, M.A. Thermodynamics: An Engineering Approach. Sea 2002, 1000, 287–293. [Google Scholar]
- Lingayat, A.B.; Chandramohan, V.P.; Raju, V.R.K.; Meda, V. A Review on Indirect Type Solar Dryers for Agricultural Crops–Dryer Setup, Its Performance, Energy Storage and Important Highlights. Appl. Energy 2020, 258, 114005. [Google Scholar] [CrossRef]
- Abhay, L.; Chandramohan, V.P.; Raju, V.R.K. Numerical Analysis on Solar Air Collector Provided with Artificial Square Shaped Roughness for Indirect Type Solar Dryer. J. Clean. Prod. 2018, 190, 353–367. [Google Scholar] [CrossRef]
- Lingayat, A.; Chandramohan, V.P.; Raju, V.R.K. Energy and Exergy Analysis on Drying of Banana Using Indirect Type Natural Convection Solar Dryer. Heat. Transf. Eng. 2019, 41, 551–561. [Google Scholar] [CrossRef]
- Akpinar, E.K. Drying of Mint Leaves in a Solar Dryer and under Open Sun: Modelling, Performance Analyses. Energy Convers. Manag. 2010, 51, 2407–2418. [Google Scholar] [CrossRef]
- ELkhadraoui, A.; Kooli, S.; Hamdi, I.; Farhat, A. Experimental Investigation and Economic Evaluation of a New Mixed-Mode Solar Greenhouse Dryer for Drying of Red Pepper and Grape. Renew. Energy 2015, 77, 1–8. [Google Scholar] [CrossRef]
- Mohammed, I.A.; Al Dulaimi, M.A.K. An Economic Analysis of The Costs of Producing Tomato Under Greenhouse in Anbar Governorate For the Agricultural Season 2019–2020. IOP Conf. Ser. Earth Environ. Sci. 2021, 904, 12061. [Google Scholar] [CrossRef]
- Singh, P.; Gaur, M.K. Environmental and Economic Analysis of Novel Hybrid Active Greenhouse Solar Dryer with Evacuated Tube Solar Collector. Sustain. Energy Technol. Assess. 2021, 47, 101428. [Google Scholar] [CrossRef]
- Atheaya, D. Economics of Solar Drying; Springer Nature: Dordrecht, The Netherlands, 2017. [Google Scholar] [CrossRef]
- Fudholi, A.; Sopian, K. A Review of Solar Air Flat Plate Collector for Drying Application. Renew. Sustain. Energy Rev. 2019, 102, 333–345. [Google Scholar] [CrossRef]
- Luan, N.T.; Phu, N.M. First and Second Law Evaluation of Multipass Flat-Plate Solar Air Collector and Optimization Using Preference Selection Index Method. Math. Probl. Eng. 2021, 2021, 5563882. [Google Scholar] [CrossRef]
- Rezaei, M.; Sefid, M.; Almutairi, K.; Mostafaeipour, A.; Ao, H.X.; Dehshiri, S.J.H.; Dehshiri, S.S.H.; Chowdhury, S.; Techato, K. Investigating Performance of a New Design of Forced Convection Solar Dryer. Sustain. Energy Technol. Assess. 2022, 50, 101863. [Google Scholar] [CrossRef]
- Lingayat, A.; Chandramohan, V.; Raju, V. Design, Development and Performance of Indirect Type Solar Dryer for Banana Drying. Energy Procedia 2017, 109, 409–416. [Google Scholar] [CrossRef]
- Hegde, V.N.; Hosur, V.S.; Rathod, S.K.; Harsoor, P.A.; Narayana, K.B. Design, Fabrication and Performance Evaluation of Solar Dryer for Banana. Energy Sustain. Soc. 2015, 5, 23. [Google Scholar] [CrossRef]
- Mugi, V.R.; Chandramohan, V.P. Shrinkage, Effective Diffusion Coefficient, Surface Transfer Coefficients and Their Factors during Solar Drying of Food Products—A Review. Sol. Energy 2021, 229, 84–101. [Google Scholar] [CrossRef]
- Akpinar, E.K.; Midilli, A.; Bicer, Y. Energy and Exergy of Potato Drying Process via Cyclone Type Dryer. Energy Convers. Manag. 2005, 46, 2530–2552. [Google Scholar] [CrossRef]
- Akpinar, E.K. Energy and Exergy Analyses of Drying of Red Pepper Slices in a Convective Type Dryer. Int. Commun. Heat. Mass. Transf. 2004, 31, 1165–1176. [Google Scholar] [CrossRef]
- Akpinar, E.K. Thermodynamic Analysis of Strawberry Drying Process in a Cyclone Type Dryer. J. Sci. Ind. Res. 2007, 66, 152–161. [Google Scholar]
- Akpinar, E.K.; Midilli, A.; Bicer, Y. Thermodynamic Analysis of the Apple Drying Process. Proc. Inst. Mech. Eng. Part E J. Process Mech. Eng. 2005, 219, 1–14. [Google Scholar] [CrossRef]
- Ghasemkhani, H.; Keyhani, A.; Aghbashlo, M.; Rafiee, S.; Mujumdar, A.S. Improving Exergetic Performance Parameters of a Rotating-Tray Air Dryer via a Simple Heat Exchanger. Appl. Therm. Eng. 2016, 94, 13–23. [Google Scholar] [CrossRef]
- Midilli, A.; Kucuk, H. Energy and Exergy Analyses of Solar Drying Process of Pistachio. Energy 2003, 28, 539–556. [Google Scholar] [CrossRef]
- Akpinar, E.K.; Midilli, A.; Bicer, Y. The First and Second Law Analyses of Thermodynamic of Pumpkin Drying Process. J. Food Eng. 2006, 72, 320–331. [Google Scholar] [CrossRef]
- Corzo, O.; Bracho, N.; Vásquez, A.; Pereira, A. Energy and Exergy Analyses of Thin Layer Drying of Coroba Slices. J. Food Eng. 2008, 86, 151–161. [Google Scholar] [CrossRef]
- Çolak, N.; Kuzgunkaya, E.; Hepbasli, A. Exergetic Assessment of Drying of Mint Leaves in a Heat Pump Dryer. J. Food Process Eng. 2008, 31, 281–298. [Google Scholar] [CrossRef]
- Akpinar, E.K.; Sarsilmaz, C. Energy and Exergy Analyses of Drying of Apricots in a Rotary Solar Dryer. Int. J. Exergy 2004, 1, 457. [Google Scholar] [CrossRef]
- Ndukwu, M.C.; Simo-Tagne, M.; Abam, F.I.; Onwuka, O.S.; Prince, S.; Bennamoun, L. Exergetic Sustainability and Economic Analysis of Hybrid Solar-Biomass Dryer Integrated with Copper Tubing as Heat Exchanger. Heliyon 2020, 6, e03401. [Google Scholar] [CrossRef]


| No. | Quantity | Component |
|---|---|---|
| 1. | 1 | Arduino Mega board (7–12 Vdc) |
| 2. | 1 | Li sensor |
| 3. | 1 | Relay kit (2—channel) |
| 6. | 1 | Linear resistor (10 kΩ) |
| 7. | 3 | DHT-22 sensor |
| 8. | 1 | LCD |
| 9. | 1 | Speed sensor |
| 10. | 1 | GSM module |
| Parameters | Device | Accuracy | Range | Error |
|---|---|---|---|---|
| Air temperature | DHT-22 sensor | ±1 °C | −10–80 °C | 0.1 °C |
| Relative humidity | DHT-22 sensor | ±2% | 0–100% | 0.1% |
| Solar radiation | Spectral pyranometers (model: SENTEC RS485, SenTec, Sichuan, China) | ±10 W/m2 | ------------ | 0.1 W/m2 |
| Weight of SF samples | Electronic digital balance | ±0.020 g | 0.0–50 kg | 5 g |
| Voltage and current (PV system) | Digital multi-meter | ------------ | 0.2–1000 V 20 µA–20 A | 0.01 V 0.01 A |
| Air speed | Digital anemometer (model: Extech AN100, EXTECH, Beijing, China) | ±0.1 m/s | 0.0–30 m/s | 0.1 m/s |
| Light intensity | LDR sensor | ±1 Lux | 0.0–1000 Lux | 0.1 Lux |
| Reference | Type | , % |
|---|---|---|
| Fudholi et al. [55] | Natural and forced SAC | 62% |
| Luan et al. [56] | Multi-pass SAC | 52.1% |
| Rezaei et al. [57] | SAC without phase-change material | 52.1% |
| Rezaei et al. [57] | Bobbin absorber plate without phase-change material | 36.3% |
| Rezaei et al. [57] | SAC with phase-change material | 12.9% |
| Lingayat et al. [58] | SAC with V-corrugated absorption plates | 31.50% |
| Hegde et al. [59] | Top and bottom flow SAC | 50.0% |
| Şevik et al. [33] | Double-pass SAC with and without infrared assistance | 1.15% to 26.46% |
| Chowdhury et al. [34] | Tunnel SD | 27.45% to 42.50% |
| Lingayat et al. [49] | Flat plate SAC | 45.32% |
| Current study | The developed AMMISD | 63.33% |
| Reference | Temperature | Airflow | Type | |
|---|---|---|---|---|
| Mugi and Chandramohan [60] | 32–63 °C | Not available | Forced convection indirect SD | 2.44% |
| 34–69 °C | Not available | Natural convection indirect SD | 2.03% | |
| Selimefendigil et al. [31] | 60 °C | 0.010–0.016 kg/s | Active greenhouse SD with Al2O3 nano-embedded latent heat thermal storage system | 3.45% |
| Chowdhury et al. [34] | 54.2 °C | Not available | Solar drying of jackfruit leather in a tunnel SD | 41.42% |
| Ekka et al. [32] | 36–62 °C | 0.018–0.062 kg/s | Mixed-mode SD with dual double-pass SACs | 18.8 to 41.4% |
| Tiwari and Tiwari [40] | 29–122.78 °C | Not available | Hybrid mixed-mode greenhouse SD, integrated with partially covered number of photovoltaic thermal (PVT) SACs | 19.11 to 28.96% |
| Chowdhury et al. [34] | 54.2 °C | Not available | Tunnel SD | 32 to 69% |
| Abdelkader et al. [41] | 26.3–60.3 °C | 0.031–0.0381 m3/s | Carbon nanotubes-based SD | 8.1 to 11.9% |
| Lingayat et al. [49] | 28–82 °C | Not available | Using indirect-type natural convection SD | 7.4 to 45.23% |
| Current study | 28–66 °C | 0.09 m3/s | The developed AMMISD | 27.5% |
| Reference | Temperature | Airflow | Type | |
|---|---|---|---|---|
| Mugi and Chandramohan [60] | 32–63 °C | Not available | Forced convection indirect SD | 16.19–97.75% |
| 34–69 °C | Not available | Natural convection indirect SD | 15.17–91.08% | |
| Shringi et al. [35] | 50.85–97.85 °C | Not available | SD using phase-change material as energy storage | 67.06–88.24% |
| Panwar [36] | 36–56 °C | Not available | Natural convection SD | 55.35–79.35% |
| Ndukwu et al. [37] | 30–45 °C | Not available | SD integrated with sodium sulfate decahydrate and sodium chloride as thermal storage medium | 66.67–96.09% |
| Kesavan et al. [38] | 62 °C | 0.062 kg/s | Triple-pass SD | 2.8–87.02% |
| Chowdhury et al. [34] | 54.2 °C | Not available | Tunnel SD | 41.42% |
| Akpiner et al. [61] | 60–80 °C | 1.0–1.5 m/s | Two-tray hot air cyclone dryer | 18–100% |
| Akpinar [62] | 55–70 °C | 1.5 m/s | Laboratory tray dryer | 67.27–97.29% |
| Akpinar [63] | 60–85 °C | 0.5–1.5 m/s | Experimental tray dryer | 24.81–100% |
| Akpinar et al. [64] | 60–80 °C | 1.5 m/s | Two-tray hot air cyclone type dryer | 32–100% |
| Ghasemkhani et al. [65] | 50–80 °C | 1.0–2.0 m/s | Rotating tray dryer equipped with heat exchanger | 23–96.1% |
| Midilli and Kucuk [66] | 40–60 °C | 1.23 m/s | Forced convection solar dryer | 15.65–100% |
| Akpinar et al. [67] | 60–80 °C | 1.0–1.5 m/s | Two-tray hot air cyclone type dryer | 19.4–100% |
| Corzo et al. [68] | 71–93 °C | 0.82–1.18 m/s | Thin-layer air dryer | 80–97% |
| Çolak et al. [69] | 40–50 °C | 0.01–0.05 kg/s | Ground source heat | 76.03–97.24% |
| Karthikeyan and Murugavelh [39] | 42.2–82.8 °C | Not available | Mixed-mode forced convection solar tunnel dryer | 23.25–73.31% |
| Current study | 28–66 °C | 0.09 m3/s | The developed AMMISD | 11.92 and 96.62% |
| Reference | Type | Crop | Sustainable Indicators | ||
|---|---|---|---|---|---|
| IP | WER | SI | |||
| Mugi et al. [30] | Natural convection SD | Okra | 0.035 to 12.75 W | 0.41 to 0.445 | 3.69 |
| Forced convection SD | Okra | 9.5 × 10³ to 10.51 W | 0.41 | 5.1 | |
| Akpinar et al. [70] | Forced convection SD | Pepper | 0 to 17 W | 0.38 to 0.55 | 0.393 to 6.156 |
| Ndukwu et al. [71] | Hybrid solar-biomass dryer | -- | 0.036 to 20.6 W | 0.38 to 0.55 | 2.3 to 6.11 |
| Ekka et al. [32] | Forced convection mixed-mode SD | Cluster figs | -- | -- | 1.26 to 1.71 |
| Current study | Developed AMMISD | 4.62 to 13.64 W | 0.69 to 0.94 | 1.01 to 1.38 | |
| Cost Parameters | AMMISD Integrated with PV System |
|---|---|
| Capital cost, USD | |
| I. Metal frame | 300 |
| II. PV system | 70 |
| III. Electronic and electrical components | 150 |
| Lifespan, years | 45 |
| Annual capital cost, USD | 106.56 |
| Annual maintenance cost, USD | 3.196 |
| Annual salvage value, USD | 8.525 |
| Annual investment cost, USD | 101.23 |
| Labor cost, USD/month | 100 |
| Economic Parameters | AMMISD Integrated with PV System |
|---|---|
| Mass of date fruit dried per batch, kg | 35 |
| Number of drying days per patch, day | 6 |
| Quantity of dried date fruit annually, kg | 210 |
| Drying cost of per kg of date fruit, USD | 0.48 |
| Cost of 1 kg fresh date fruit, USD | 1 |
| Total cost of 1 kg of crop dried date fruit, USD | 1.176 |
| Selling price per kg of date fruit, USD | 3 |
| Saving after 1 year, USD | 236.9 |
| Payback time, years | 2.091 |
Disclaimer/Publisher’s Note: The statements, opinions and data contained in all publications are solely those of the individual author(s) and contributor(s) and not of MDPI and/or the editor(s). MDPI and/or the editor(s) disclaim responsibility for any injury to people or property resulting from any ideas, methods, instructions or products referred to in the content. |
© 2025 by the authors. Licensee MDPI, Basel, Switzerland. This article is an open access article distributed under the terms and conditions of the Creative Commons Attribution (CC BY) license (https://creativecommons.org/licenses/by/4.0/).
Share and Cite
Elwakeel, A.E.; Villagran, E.; Rodriguez, J.; Aguilar, C.E.; Ahmed, A.F. Development, Thermodynamic Evaluation, and Economic Analysis of a PVT-Based Automated Indirect Solar Dryer for Date Fruits. Sustainability 2025, 17, 4571. https://doi.org/10.3390/su17104571
Elwakeel AE, Villagran E, Rodriguez J, Aguilar CE, Ahmed AF. Development, Thermodynamic Evaluation, and Economic Analysis of a PVT-Based Automated Indirect Solar Dryer for Date Fruits. Sustainability. 2025; 17(10):4571. https://doi.org/10.3390/su17104571
Chicago/Turabian StyleElwakeel, Abdallah Elshawadfy, Edwin Villagran, Jader Rodriguez, Cruz Ernesto Aguilar, and Atef Fathy Ahmed. 2025. "Development, Thermodynamic Evaluation, and Economic Analysis of a PVT-Based Automated Indirect Solar Dryer for Date Fruits" Sustainability 17, no. 10: 4571. https://doi.org/10.3390/su17104571
APA StyleElwakeel, A. E., Villagran, E., Rodriguez, J., Aguilar, C. E., & Ahmed, A. F. (2025). Development, Thermodynamic Evaluation, and Economic Analysis of a PVT-Based Automated Indirect Solar Dryer for Date Fruits. Sustainability, 17(10), 4571. https://doi.org/10.3390/su17104571