Article

Digital Economy and High-Quality Development of Fishery Economy: Evidence from China

1
School of Business, Ningbo University, Ningbo 315000, China
2
School of Economics and Management, Zhejiang Business Technology Institute, Ningbo 315012, China
3
Institute of Digital Economy and Industrial Innovation, Ningbo University of Finance and Economics, Ningbo 315175, China
*
Author to whom correspondence should be addressed.
Sustainability 2025, 17(10), 4338; https://doi.org/10.3390/su17104338
Submission received: 26 February 2025 / Revised: 28 April 2025 / Accepted: 6 May 2025 / Published: 11 May 2025
(This article belongs to the Special Issue Advanced Agricultural Economy: Challenges and Opportunities)

Abstract

:
The high-quality development of the fishery economy (HQDF) is crucial to ensuring the sustainable supply of aquatic products. This study first conducts a theoretical analysis of the potential impacts of the digital economy (DE) on the HQDF and explores the underlying mechanisms. By using provincial panel data of China from 2011 to 2022, comprehensive indicator systems are constructed to measure the development levels of the DE and the HQDF. A two-way fixed effects model is employed to empirically examine the impact of the DE on the HQDF, with a focus on the mediating roles of technological innovation and entrepreneurial activity. The findings reveal that the DE significantly and positively drives the fishery economy towards high-quality development, and these results remain robust across various robustness tests and endogeneity treatments. Additionally, the transmission mechanisms of technological innovation and entrepreneurial activity enhancement are empirically validated. The impact of the digital economy exhibits regional heterogeneity. This study provides a scientific basis for achieving high-quality and sustainable development in the fishery sector, suggesting that fostering the digital economy, technological innovation, and entrepreneurship should be prioritized in policy interventions.

1. Introduction

The State of World Fisheries and Aquaculture 2024 report [1] by the United Nations Food and Agriculture Organization (FAO) highlights that aquatic foods provide high-quality protein and are excellent sources of essential nutrients, playing a critical role in ensuring global food security. Since launching its Blue Transformation vision in 2021, the FAO constantly aims to maximize opportunities within aquatic food systems to enhance global food security, improve nutrition, eradicate poverty, and advance the 2030 Agenda for Sustainable Development [2]. The 2024 report emphasizes the need to support sustainable aquaculture expansion and intensification, the effective management of all fisheries and upgraded aquatic value chains to ensure the global demand for aquatic foods is met, and the need to guarantee the social, economic, and environmental sustainability of aquatic food systems.
China, as the world’s largest fishery producer and exporter, has proposed a distinctive high-quality development strategy for its fishery sector, aligning with the FAO’s Blue Transformation vision. Drawing on studies focusing on the high-quality development of industries [3,4,5,6], the high-quality development of fishery economy should encompass three core pillars: the achievement of quantitative and qualitative supply enhancements, economic efficiency optimization, and producer income growth. This initiative responds to pressing challenges shared globally in fishery production, including resource constraints, environmental degradation, low resource utilization efficiency, lagging modernization, and inadequate product diversity and quality to meet evolving market demands [7,8,9]. To ensure sustainable development, China has implemented stringent regulatory measures, such as resource management systems [10] (e.g., limiting fishing vessel numbers and engine power and enforcing minimum catch size requirements), and strict seasonal fishing moratoriums. Concurrently, China is leveraging advanced technologies to optimize resource utilization, enhance economic efficiency, and improve the quality and quantity of aquatic products while ensuring the prosperity of fishing communities, thereby fostering resilient, high-quality, and sustainable fisheries. Given China’s vast production scale, diverse practices, and regional disparities in fisheries, its experience in pursuing high-quality development offers valuable insights for other nations and regions navigating analogous sustainability challenges in aquatic resource governance.
The development of digital technologies, rooted in next-generation information and communication technology (ICT), is driving industrial revolutions and the transformation of the real economy. The term “digital economy (DE)”, first introduced by Tapscott [11], broadly refers to economic activities that leverage data elements, digital technologies, and internet platforms as key resources, driven by digital innovation to enhance efficiency and optimize macroeconomic structures. Existing studies demonstrate that the digital economy significantly enhances macroeconomic structures by facilitating knowledge generation and sharing [12] and stimulating innovation [13,14,15] and entrepreneurial activities [16,17]. At the enterprise level, it improves productivity [15,18,19,20,21], transforms production methods [22,23,24], promotes financial inclusivity for farmers and SMEs [25], and reduces production and transaction costs [12]. Structurally, it drives industrial upgrading [26,27] and boosts economic efficiency and growth [22,28,29].
Within fisheries, research has predominantly focused on micro-level case analyses of the digital economy’s impacts on aquaculture and capture fisheries. For instance, the utilization of emerging digital technologies such as big data, the Internet of Things (IoT), cloud computing, blockchain, and artificial intelligence (AI) enhances efficiency and mitigates risks across production–distribution chains. In production processes, the application of these technologies enables remote automated feeding [30], water quality monitoring [31], species identification and classification, aquatic animal behavior analysis, and decision making in production processes [32,33]. It also facilitates product quality inspection, logistics tracking, supply–demand matching data collection, and trading optimization in distribution processes [32,34,35].
While limited research explores the macro-level impact of fishery digitalization on fishery productivity or sustainable development [36,37] and assesses the levels and evolution of the high-quality development of the fishery sector [38,39,40] and a few studies theoretically address the digital economy’s implications for fisheries from a macroeconomic perspective [41,42], critical research gaps persist. First, in consideration of consumers’ higher demand for food products of high and consistent quality [43], the quality of the supply of aquatic products is vital. Thus, these critical gaps highlight the need for a comprehensive high-quality development framework with causal mechanism analysis.
Therefore, the research questions of this study include the following: (1) How does the digital economy (DE) influence the high-quality development of the fishery economy (HQDF)? (2) What role do technological innovation and entrepreneurial activity play in this relationship? (3) Does the impact of digital transformation vary across different regions in China? To address these questions, this study (1) theoretically analyzes the impacts of the digital economy (DE) on the high-quality development of fishery economy (HQDF) and explores the underlying mechanisms, (2) empirically examines the impact of the DE on the HQDF by using the provincial panel data in China from 2011 to 2022 based on a comprehensive measurement of the DE and the HQDF, and (3) empirically tests the transmission mechanisms of technological innovation and entrepreneurial activity in the DE–HQDF relationship while further analyzing regional heterogeneity to identify policy implications.
This study makes three key contributions: First, it extends research on the DE’s impact on high-quality industrial development to the fishery sector, theoretically analyzing and empirically validating the DE–HQDF linkage, studying a critical yet underexplored dimension of sustainable blue growth. Second, it innovatively investigates how the DE influences the HQDF through technological innovation and entrepreneurial activity, providing empirical evidence from the world’s largest fishery producer. Third, it improves the measurement of core indicators (e.g., high-quality fishery development, digital economy levels, fishery innovation, and regional entrepreneurial activity) by supplementing statistical yearbook data with manually collected, web-crawled, and text-mined datasets. For instance, patent data are used to represent fishery technological innovation—a more accurate proxy than the R&D expenditure metrics frequently used in the existing studies. These innovations address limitations in fishery economics research, offering replicable frameworks for assessing and advancing high-quality development in resource-dependent industries.

2. Theoretical Analysis and Research Hypotheses
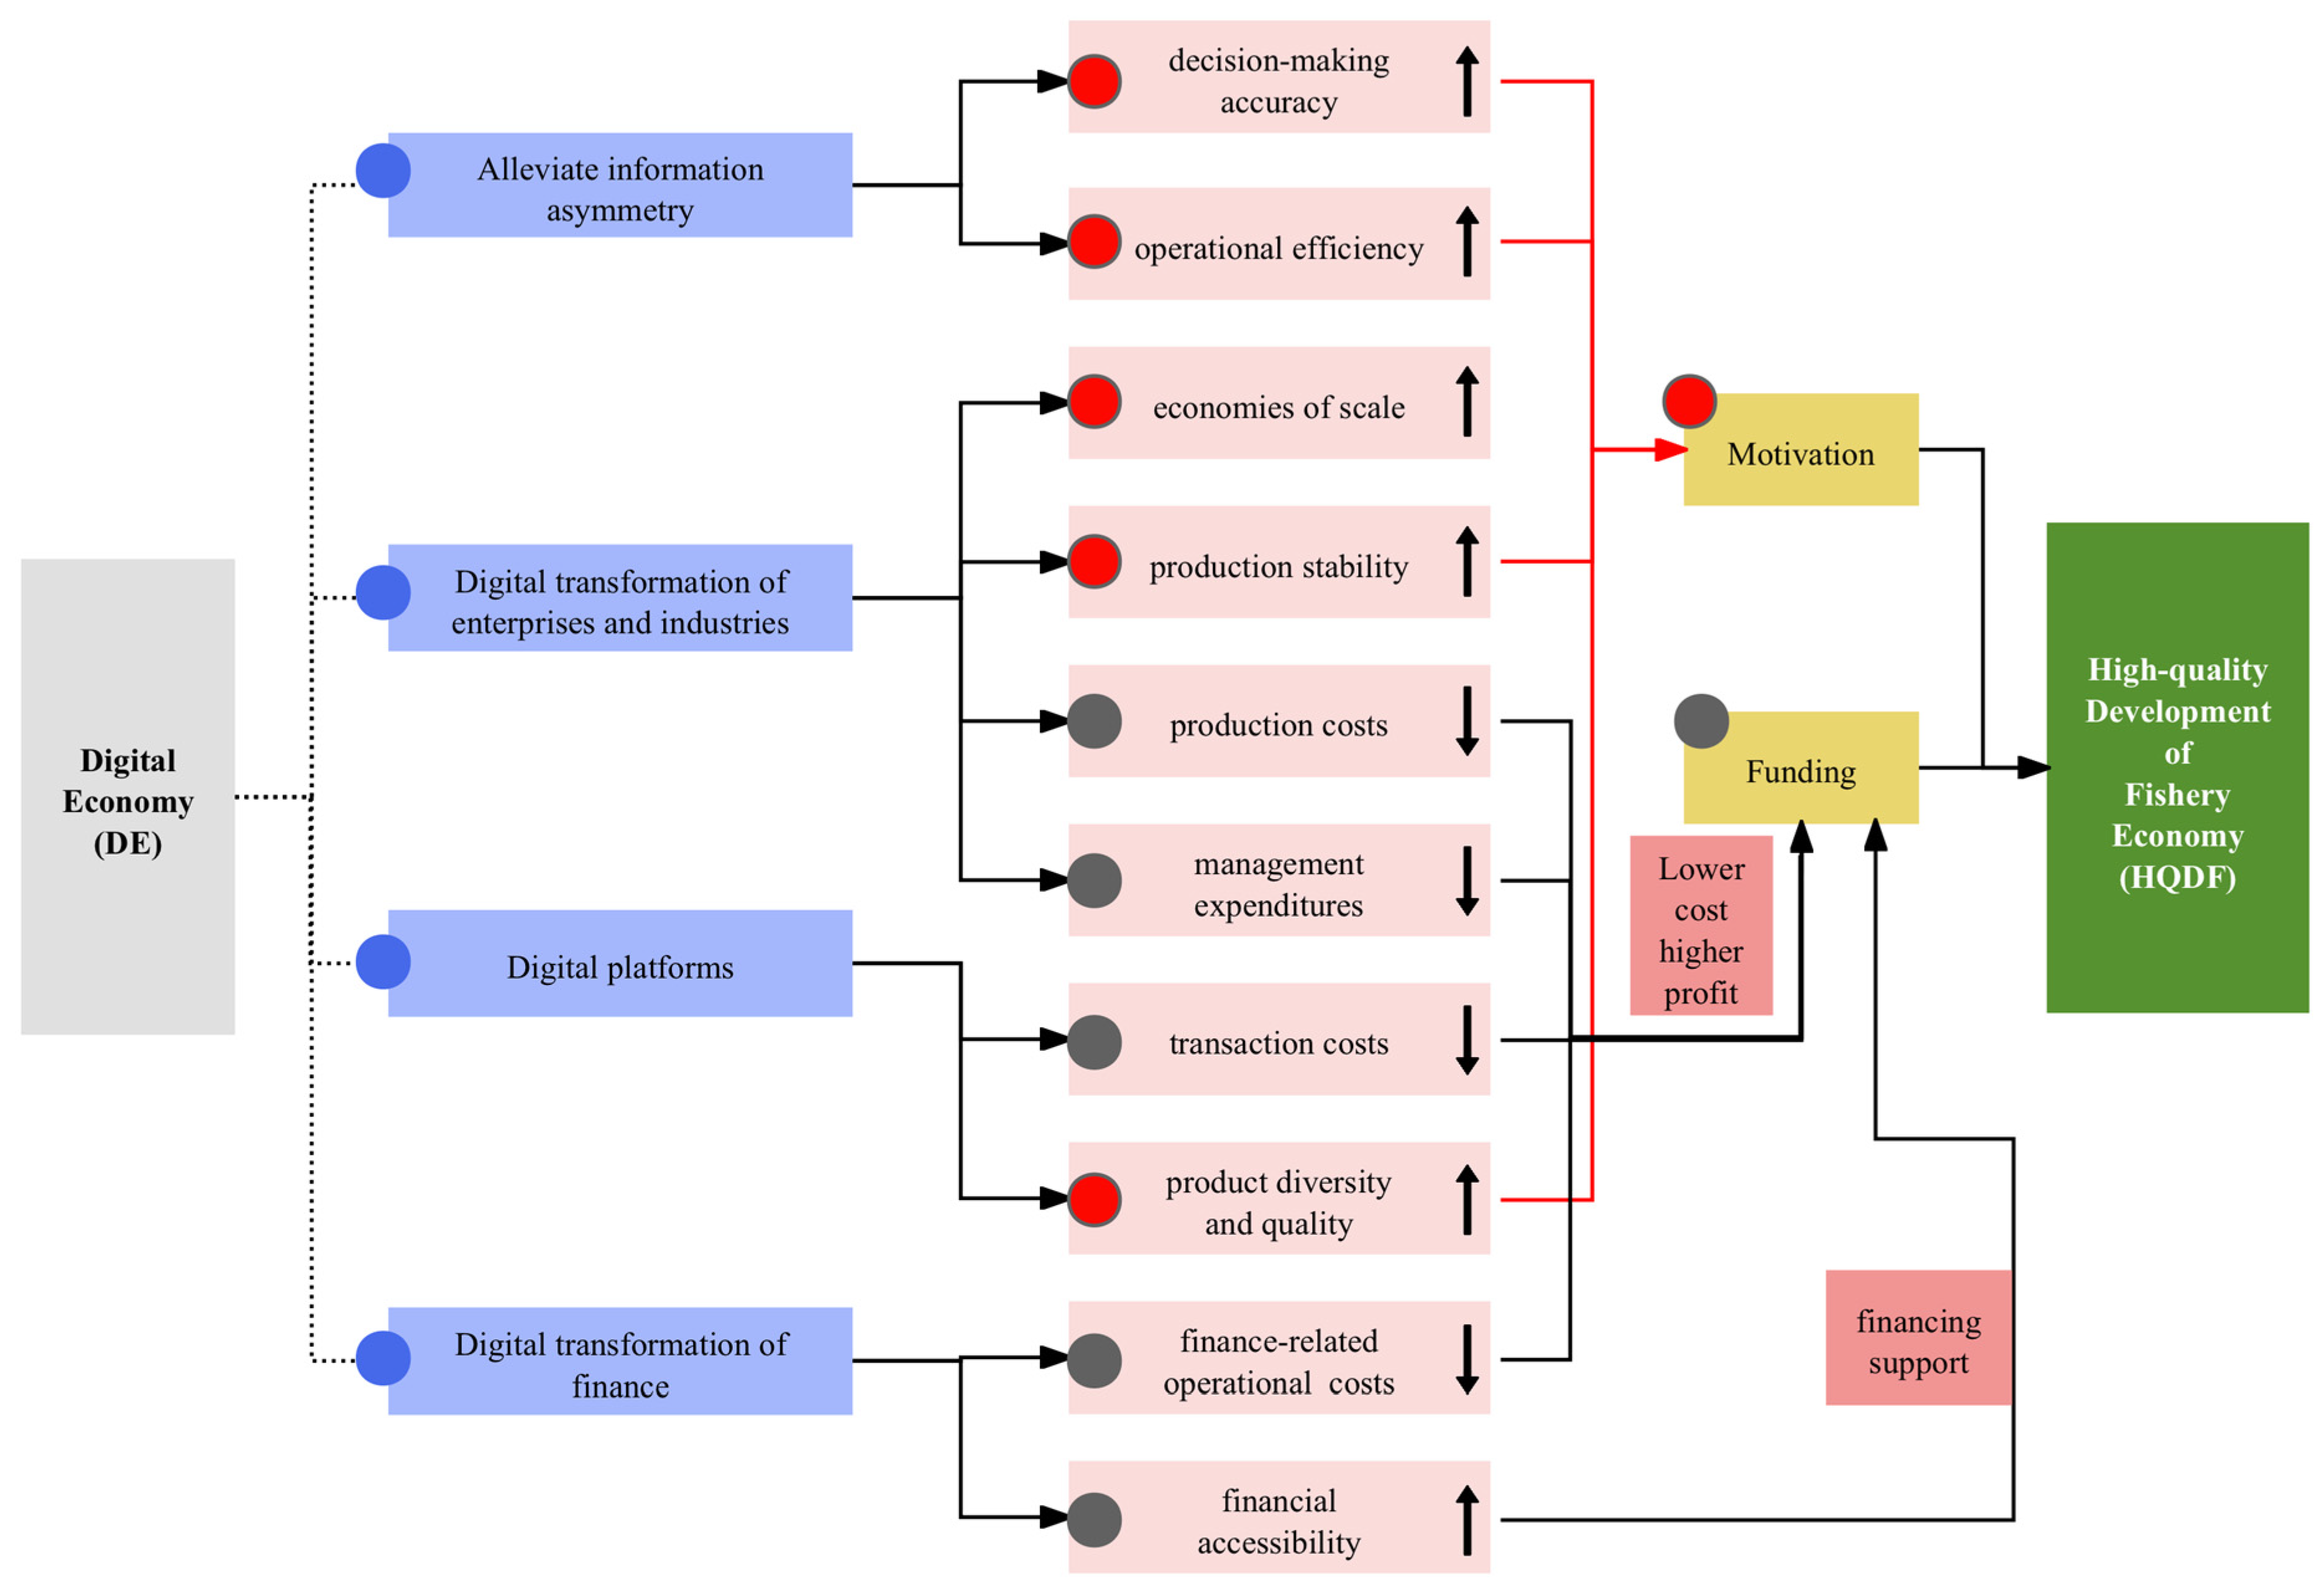
Based on the economic theory of innovation and endogenous economic growth theory, this study constructed an analysis framework that examines how the digital economy (DE) affects the high-quality development of the fishery economy (HQDF).

2.1. DE and HQDF

First, the DE can alleviate information asymmetry, thereby enhancing the accuracy of decision making and the efficiency of enterprises. David and Wright [44] highlighted that information and communication technologies (ICTs) play a crucial role in the generation, storage, and transmission of information. These technologies enhance the synergy among production factors, reduce information asymmetry, and improve decision-making accuracy through sufficient information availability. Additionally, they contribute to increasing the productivity and operational efficiency of enterprises and industries that utilize ICTs.
Furthermore, the digital transformation of enterprises and industries can substantially enhance the scale of fishery production, reduce production costs, and lower management expenses. For instance, the establishment of digital aquaculture bases involves replacing manual labor with automated technologies to enable scheduled feeding and the transfer of aquatic species between ponds [30,45]. Intelligent monitoring systems are utilized to oversee instant data on water temperature, dissolved oxygen levels, pH levels, and other parameters, with automated alerts for anomalies [28,31]. Staff at these aquaculture bases are primarily tasked with monitoring display screens and addressing any issues that arise. Within the Chinese context, existing studies have demonstrated that the integration of information and intelligent technologies, coupled with remote sensing integration technologies and big data analytics, enhances capabilities in ecological carrying capacity assessment, resource environmental monitoring, production process control, and disaster early-warning capabilities in aquaculture [41,46]. These advancements facilitate precision decision making, optimize management systems, and ensure the sustainable and high-quality development of the fishery sector. Although the initial fixed costs for setting up such digital aquaculture bases are substantial, they effectively enhance production stability, generate economies of scale, reduce labor costs and management expenditures, and eliminate the challenges associated with employee motivation and supervision.
Additionally, the digital economy facilitates the growth of digital platforms. Diverse digital platforms have enhanced the matching accuracy of supply and demand and lowered search costs, replication costs, transportation costs, tracking costs, and verification costs [47], thereby promoting the high-quality development of the fishery industry. Specifically, the reduction in search costs is likely to intensify competitive pressure among homogeneous products, prompting manufacturers to adopt differentiated strategies and enhance their innovation efforts. This, in turn, expands the variety of products available in the market, creating a long-tail effect and enriching consumer choices. Online communication and consumer feedback improve producers’ understanding of consumer needs and enable high-quality products to capture a larger market share, driving product quality improvements. Lower transaction costs enable producers to allocate capital toward innovation and transformative initiatives.
Finally, the digital economy is accompanied by the digital transformation of the financial sector. Financial institutions lower the cost of financial services and expand their reach by leveraging digital technologies to provide services such as investment, payment, financing, and information intermediation. Online behavioral and digital payment data can serve as creditworthiness indicators, mitigating collateral constraints for rural residents and small- and medium-sized enterprises (SMEs), such as fishers and fishery enterprises [25]. This enhances credit availability and improves financial accessibility for these groups in China [48,49]. On one hand, the increased accessibility and convenience of financial services can alleviate financing constraints for fishery practitioners, lower financing barriers, and provide financial support for fishery producers to transition to intelligent and large-scale production methods. This enhances production efficiency and drives the transformation and modernization of the fishery sector toward high-quality development. On the other hand, digital finance optimizes financial operations such as payment clearing, lending, and transaction settlement, helping fishery enterprises streamline internal organizational processes, reduce operational costs, and increase production profits. This, in turn, enhances their motivation and capability for transformation and upgrading.
In summary, the mechanisms of the effects are shown in Figure 1. Therefore, this paper puts forward the following research hypothesis:
Hypothesis H1. 
The digital economy (DE) may promote the high-quality development of the fishery economy (HQDF) in China.

2.2. The Transmission Mechanism of Technological Innovation and Entrepreneurial Activity

First, with the development of the digital economy, almost all traditional “Porter-style” competitive advantage barriers are difficult to sustain [50]. As customer demands and expectations change, enterprises or organizations must explore new ways to attract and satisfy evolving customer needs, which positively drives the initiative for technological innovation.
Driven by this innovative momentum, digital technologies can simultaneously advance scientific invention and technological innovation, as outlined in Schumpeter’s innovation theory [51]. On the one hand, the low replication costs and non-rivalrous characteristics of data accelerate the codification of knowledge and transform systems of knowledge creation and sharing. This facilitates the rapid dissemination of knowledge and information, lowering the barriers for enterprises, organizations, and individuals to access external resources and promoting knowledge accumulation [51,52]. Knowledge accumulation capabilities are critical to innovation performance [53]. Additionally, digital technologies enhance resource allocation efficiency by facilitating the digital transformation, thereby further supporting innovation activities of enterprises and organizations [54]. On the other hand, digital technologies can be combined and recombined by innovators to create new devices and applications [55]. Therefore, the integration of digital technology with the fishery sector can lead to induced innovation. Empirical studies [56,57] and case analyses collectively demonstrate that technological innovation plays a pivotal role in advancing fishery development. Improvements and innovations in fishing, aquaculture, processing, and sales methods can enhance the efficiency and profitability of the entire fishery industry chain, increase the added value of products, and alleviate the pressures caused by resource constraints while promoting the sustainable development of fishery resources. Moreover, the application of new technologies can enhance the quality of aquatic products in various aspects, such as freshness preservation, and meet the diversified demands of consumers, thereby contributing to the realization of the HQDF.
Second, the development of the digital economy enhances regional entrepreneurial activity motivation and success rates by enriching entrepreneurial resources, providing entrepreneurial opportunities, and reducing entrepreneurial costs. This, in turn, drives the HQDF through effects such as promoting the application of new technologies, revolutionizing product manufacturing, advancing industrial upgrading, and expanding employment. As discussed above, the digital economy reduces entrepreneurial costs by optimizing enterprise operational processes, lowering operational and financing costs, and innovating transaction procedures. Further to their role in fostering technological innovation, digital technologies also decrease the cost of accessing information resources for entrepreneurs [16]. Additionally, the alleviation of information asymmetry and the significant enhancement of information and resource flows stimulate entrepreneurial motivation, particularly among rural populations [17,58]. To be specific, substantial underutilized production factors in rural China—including dormant capital reserves, untapped human resources, and idle land assets—can be mobilized through digital economy initiatives to activate entrepreneurial ventures and employment opportunities, thereby enhancing resource allocation efficiency [59]. Furthermore, the deep integration of the digital economy with the real economy releases labor, capital, and technological resources for entrepreneurial activities by phasing out outdated production capacity and driving the optimization and upgrading of industrial structures. The digital economy also generates a “creative destruction” effect [60], innovates consumption scenarios, and catalyzes new consumer demands, thereby expanding entrepreneurial opportunities and market spaces while boosting entrepreneurial enthusiasm. Under the combined influence of the three core elements of traditional entrepreneurship theory—entrepreneurial resources, opportunities, and costs [61]—both entrepreneurial motivation and success rates are increased.
Based on the above analysis, this study proposes the following hypotheses:
Hypothesis H2. 
In China, the digital economy (DE) may positively drive the high-quality development of the fishery economy by fostering technological innovation.
Hypothesis H3. 
In China, the digital economy (DE) may positively drive the high-quality development of the fishery economy by enhancing regional entrepreneurial activity.

2.3. The Heterogeneous Impact of the DE on the HQDF

Existing research has pointed out that as a new generation of General Purpose Technologies (GPTs), digital technologies such as big data, blockchain, and artificial intelligence require sufficient technological accumulation or the establishment of necessary complementary systems to fully unleash their potential in driving productivity [62]. The widespread diffusion and effective utilization of digital technologies depend on compensatory investments that align with the region’s technological, organizational, and institutional frameworks. Due to differences in digital infrastructure, economic development, and resource endowments, compensatory investments vary across different geographical regions in the development of the fishery economy, leading to differential impacts of the DE on the HQDF in different regions. Furthermore, since the transformative effects of digital technologies on enterprises are not solely determined by the enterprises themselves but are also influenced by the “peer effects” within the region or industry [63,64], the impact of digital technologies exhibits regional homogeneity. Therefore, it can be inferred that the level of development and application of digital technologies in a region will influence the impact of the digital economy, thereby affecting the extent of changes in production methods and efficiency improvements across various industries. Regions with comprehensive ICT infrastructure and more advanced digital economies will experience greater efficiency improvements and industrial transformations driven by the digital economy. Furthermore, China’s vast territorial expanse encompasses provinces with divergent fishery resource endowments, varied histories of fishery development, distinct climatic conditions, and differentiated governance frameworks for fishery management [65]. Thus, the following hypothesis can be proposed:
Hypothesis H4. 
The impact of the digital economy (DE) on the high-quality development of the fishery economy (HQDF) exhibits geographical heterogeneity in China.

3. Study Design

3.1. Modeling

To further investigate the specific impact of the DE on the HQDF, the following baseline regression model was constructed:
D f i t = α 0 + α 1 D i g i t + k = 2 n α k X i t k + μ i + σ t + ε i t
where D f i t represents the level of high-quality development of the fishery economy (HQDF) in province i in year t , the core explanatory variable D i g i t expresses the development level of the digital economy (DE), X i t k represents other control variables, μ i represents the province-fixed effect, σ t represents the year-fixed effect, and ε i t is a random error term.
For mechanism analysis, this study draws on the existing literature. Following Jiang Ting’s analytical framework [66], this study prioritizes the empirical examination of the relationship between the independent variable and the mechanism variable (Equation (2)). However, while Jiang’s advocacy for using established theoretical or empirical evidence to explain how the mechanism variable influences the dependent variable, authoritative studies [67,68] employ interaction term analysis to rigorously test the joint effect of the mechanism variable and independent variable on the dependent variable. Thus, this paper employed the following model to discuss the potential transmission mechanisms through which the DE impacts the HQDF:
m e d i t = ρ 0 + ρ 1 D i g i t + k = 2 n ρ k X i t k + μ i + σ t + ε i t
D f i t = η 0 + η 1 D i g i t + η 2 D i g i t × m e d i t + η 3 m e d i t + k = 2 n η k X i t k + μ i + σ t + ε i t
where m e d i t represents the mechanism variables, including technical innovation and entrepreneurial activity and η 2 represents the core estimated parameter of the mechanism. If the DE indeed enhances the HQDF through the mechanism variable, the estimated coefficient of η 2 should be positive. The definitions of the other variables are the same as those in Equation (1). The methodology involves first examining whether the DE exerts a significant positive influence on the proposed mechanism variables. If such an impact is observed, it suggests the presence of relevant mechanisms; otherwise, these mechanisms can be ruled out. Subsequently, an interaction term between the DE and the mechanism variable is introduced into the baseline regression model to evaluate the transmission mechanism.

3.2. Selection of Indicators

3.2.1. High-Quality Development of Fishery Economy (HQDF)

Indicator System Construction of HQDF

Current research on evaluating the high-quality development of fishery economies predominantly adopts multidimensional comprehensive measurement, as the approach of single-index evaluations fails to adequately capture the essence of high-quality development.
Measurements with composite multidimensional systems typically align with China’s New Development Philosophy [38,39,40], structured around five pillars: innovation-driven growth, regional coordination, ecological sustainability, social equity, and openness. Comparative analyses reveal systemic limitations in existing fishery-specific frameworks. While the assessments of high-quality development in other industries systematically incorporate product quality and high-end development [69,70], fishery studies exhibit notable gaps. Only Jin et al. [38] have integrated the degree of product processing as a metric, while most neglect quality assurance mechanisms.
The unique challenges of fishery product quality further amplify these limitations. Aquatic products undergo rapid post-harvest degradation due to natural enzymatic activity, microbial proliferation, and lipid oxidation [71]. Their postmortem quality retention depends on species traits (e.g., muscle composition) and supply chain practices (e.g., handling and temperature control) [72,73]. Storage facilities are vital to ensuring stable quality throughout the supply chain. Further, genetic breeding centers play a pivotal role in preserving and cultivating superior germplasm resources.
To address these gaps, this study constructs an integrated multidenominational evaluation framework by synthesizing the three-pillar agricultural high-quality development framework by Du and Hu [6] with fishery-specific adaptations across four dimensions, as is presented in Table 1.

Data Processing

Considering the differences in the magnitude of various evaluation indicators within the indicator system, the direct usage of raw data may introduce errors in calculating indicator weights. Therefore, this study applied dimensionless standardization to the data. For positive indicators, the processing method is as follows: X i j = ( x i j x j m i n ) / ( x i j m a x x j m i n ) ; for negative indicators, the processing method is as follows: X i j = ( x j m a x x i j ) / ( x j m a x x j m i n ) , where x i j represents the original value of index j for province i and X i j is the dimensionless standardized value.
On the basis of data standardization, the weight of the indicators was calculated through a vertical–horizontal grading method as follows:
(1)
Construct the comprehensive evaluation function: Q i t = Σ j = 1 m w j x i j t * ;
(2)
Calculate the variance of Q i t , and measure inter-provincial disparities, using the following formula: σ 2 = Σ t = 1 T Q i t 2 = Σ t = 1 T w H t w = w Σ t = 1 T H t w = w H w , where H = Σ t = 1 T H t is a 6 × 6 symmetric matrix and H t equals A t A t ;
(3)
Determine the indicator weights: under the constraint w w = 1 , the eigenvector corresponding to the largest eigenvalue of matrix H is selected as the optimal weight vector. This is computed as m a x w T H ; s . t w = 1 ; w > 0.
Finally, the indicator weights obtained in step (3) are normalized and then multiplied by the standardized evaluation indicators to calculate the HQDF.

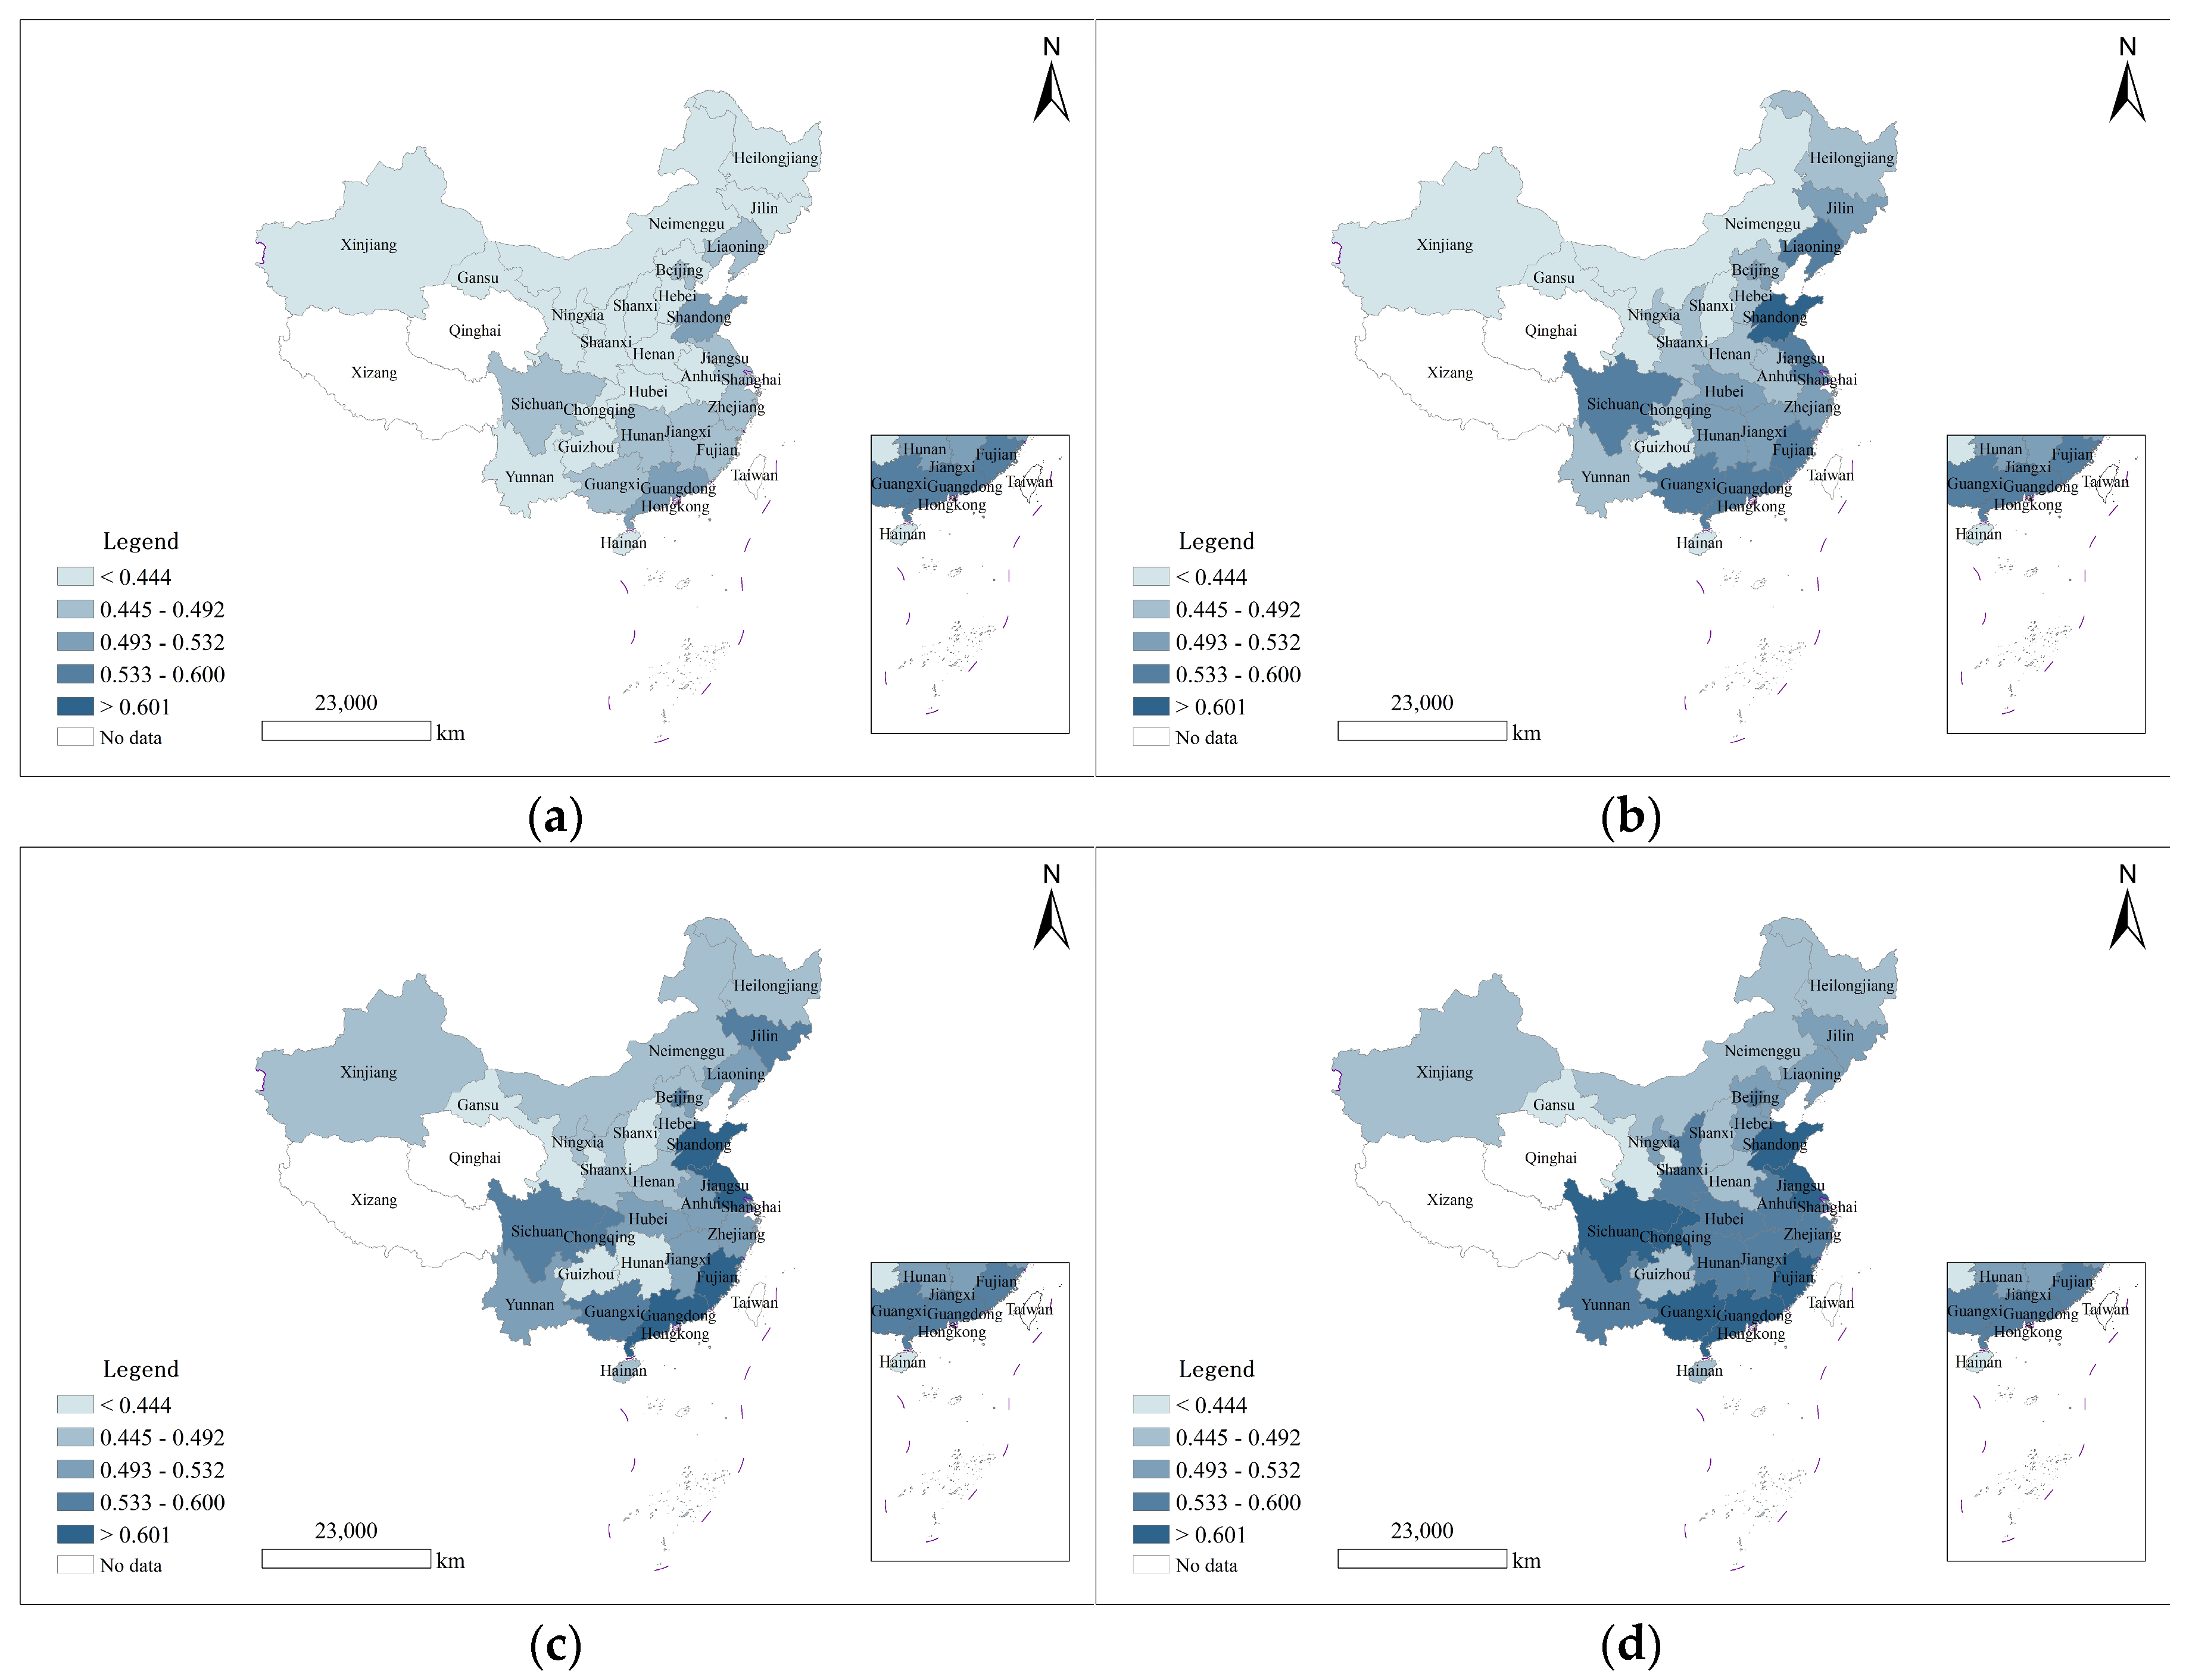
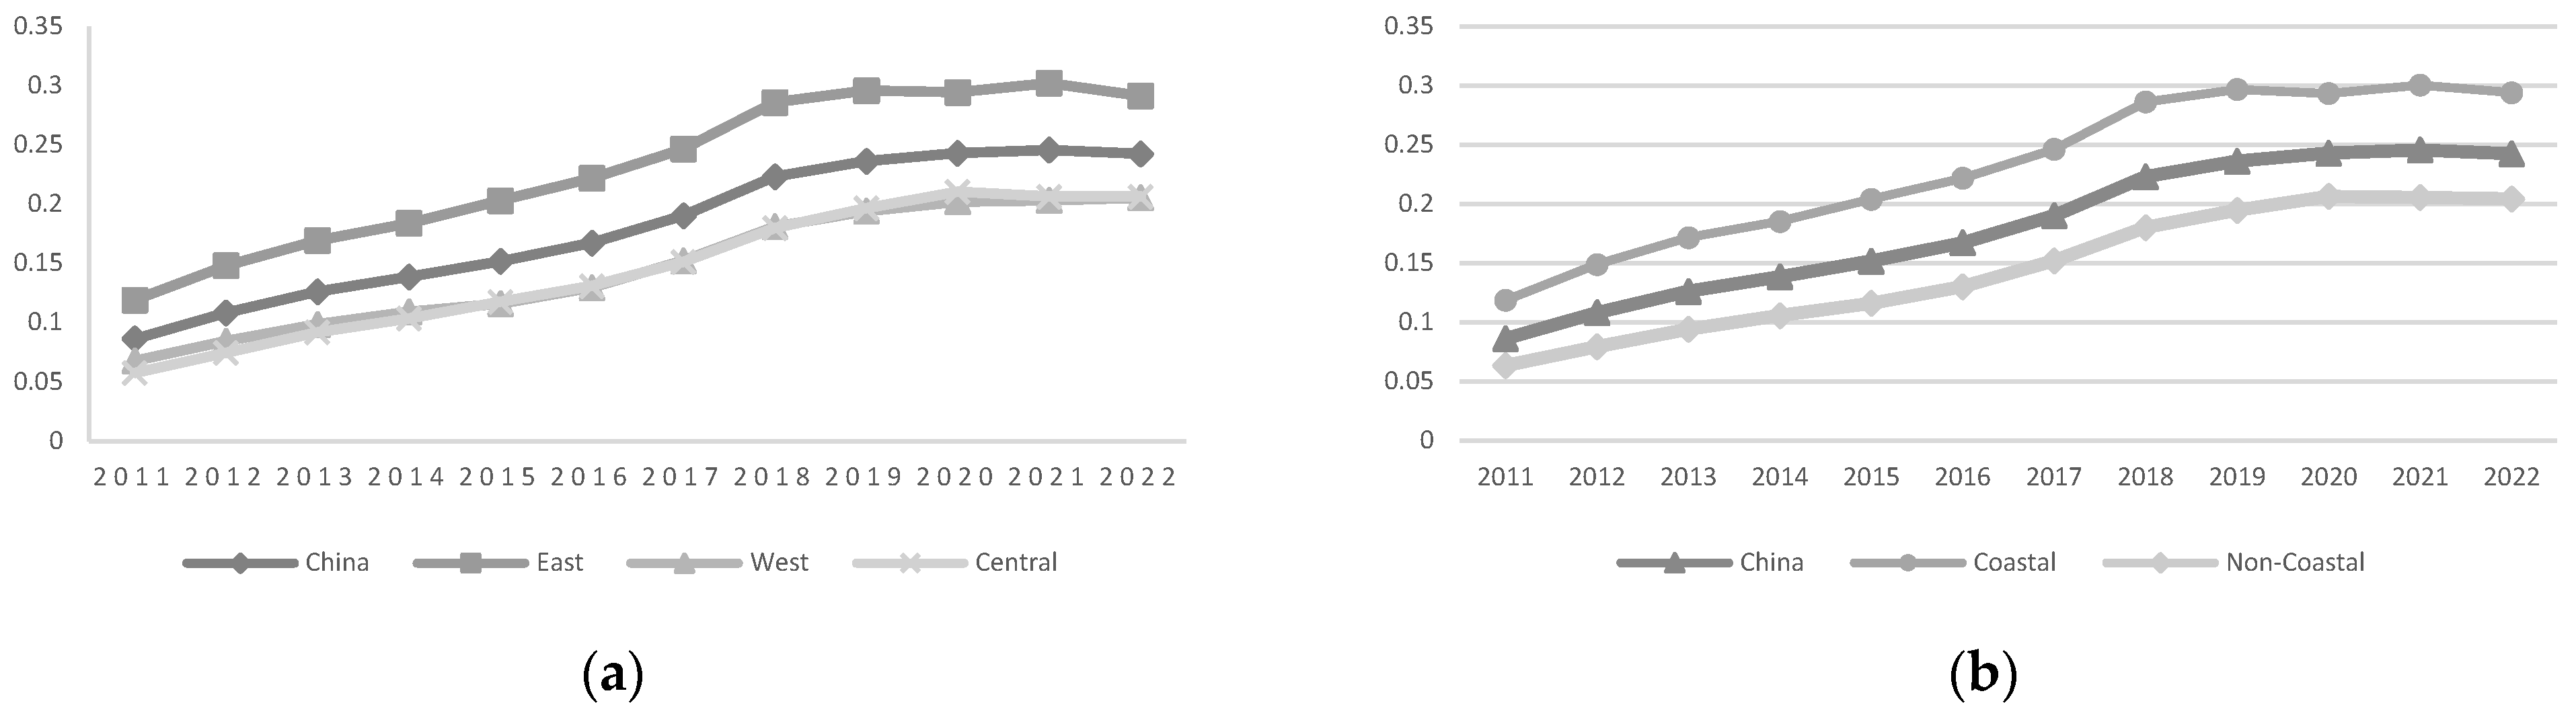
Characteristics of HQDF

The results indicate that the HQDF exhibits regional imbalances and an overall upward trend with fluctuations. To visualize the spatial characteristics of China’s HQDF, this study maps the levels of the HQDF in 2011, 2015, 2018, and 2022, as shown in Figure 2. The figure clearly reveals significant regional disparities. Specifically, the eastern regions outperform the western regions, and coastal areas generally exhibit higher development levels compared with non-coastal provinces. Regions with initially higher levels of development continue to maintain their leading positions and show significant upward trends.

3.2.2. Digital Economy (DE)

Indicator System Construction of DE

Drawing on the existing literature [70,74,75], this study constructs an evaluation indicator system for the development level of the DE across three dimensions as listed in Table 2. The methods and procedures for data processing and calculation are consistent with those outlined in the previous section.
Figure 3 illustrates the trend of the DE development level across regions. As is shown in the figure, distinct disparities are apparent in the pace and level of China’s DE. Notably, the eastern provinces and coastal regions exhibit a significantly accelerated pace and elevated levels in digital economy development when compared with their central, western, and non-coastal counterparts. This trend can be ascribed to the pre-existing technological resources and solid economic foundation in the eastern regions, in addition to the advantageous maritime conditions and openness to external interactions of coastal areas, which thus capitalize on their geographical advantages for digital economy development. Moreover, within the observed period, the discrepancy expands and subsequently contracts. These observations align fundamentally with previous findings depicted in reports such as the “Digital China Development Report (2021) [76]” sanctioned by the China National Internet Information Office and “China Digital Economy Development Research Report (2023) [77]” by the China Academy of Information and Communications Technology. Predominantly, provinces exhibiting advanced regional digital development, favorable digital advantages, and superior digital economies are primarily situated in the eastern and coastal regions.

3.2.3. Mechanism Variables

Technical Innovation

Technical innovation (TI) is represented by the number of fishery-related patents. Specifically, this paper uses Python 3.11 to obtain all patent information from the Chinese Patent Announcement Network since 1985 and filters fishery-related patents by using IPC class numbers following the existing literature [78,79]. Compared with conventional methods, using patent data can more accurately measure the output of technological innovation in fisheries, rather than the input of technological innovation. The IPC information of patents can more accurately depict the field features of innovation activities, which helps this paper to select fishery-related technological innovations.

Entrepreneurial Activity

Drawing on the methodologies of the Global Entrepreneurship Monitor (GEM) and relevant studies [16,80], this study employs the labor market approach to measure regional entrepreneurial activity (Entrep). Specifically, provincial-level data on newly registered enterprises from 2011 to 2022 were compiled by identifying the regional information of these enterprises. Using the working-age population (aged 15–64) as the standardization base, the regional entrepreneurial activity (Entrep) was calculated.

3.2.4. Control Variables

The control variables were selected as follows: (1) Fixed Asset Scale (Fix), represented by fixed capital stocks in provincial agriculture, forestry, animal husbandry, and fisheries. Provincial fixed asset stocks were calculated by deflating the total fixed asset investment in each province by using the fixed asset investment price index, followed by the perpetual inventory method: K t = 1 δ K t 1 + I t , where the depreciation rate δ is 9.6%. The fixed capital stock in the base period was calculated as K t 1 = I t / g + δ , with g representing the growth rate of capital. (2) Labor Input (Labor), measured as the number of employees in the fishery sector of each province; (3) Marketization level (Market), measured as the Fan Gang marketization index [81]; (4) Degree of government intervention (Gov), represented by the ratio of provincial general budgetary expenditure to regional GDP [82]; (5) Regional Education Level (Edu), represented by the average years of education of the provincial population, based on commonly used settings for Chinese educational years and the related literature [83,84]; (6) Government Environmental Concern (Eco): following the methodology of Chen et al. [85], this variable was proxied by the frequency of environment-related words in provincial government work reports, expressed as a proportion.

3.3. Data Source

This study utilized provincial panel data from 2011 to 2022, excluding Hong Kong, Macau, Taiwan, Qinghai, and Tibet due to extensive missing fishery-related data. The original data were sourced from the China Statistical Yearbook, the China Fishery Statistical Yearbook, the China Population Statistical Yearbook, the China Patent Database, the China Carbon Accounting Database, the National Enterprise Credit Information Publicity System, and the provincial annual government work reports. For some variables, tools such as Python were employed for identification. To avoid the influence of price fluctuations on regression estimates, all economic-related variables were deflated by using corresponding price indices. To reduce the scale and mitigate heteroscedasticity, logarithmic transformations were applied to the aforementioned variables. For missing values, this study first supplemented the data by consulting relevant government websites and news and further applied the linear interpolation method for estimation.

4. Empirical Analysis

4.1. Descriptive Statistics

Before analyzing the relationship between the DE and the HQDF, descriptive statistical analyses and related tests were conducted on each variable. The results of the descriptive statistical analysis are shown in Table 3. The minimum value of the HQDF is 0.242, the maximum is 0.749, the mean is 0.500, and the median is 0.488, indicating substantial regional variance in the level of the HQDF. The minimum value of the DE is 0.101, the maximum is 0.551, and the mean is 0.180, reflecting significant regional differences. The mean level of technical innovation is 0.066, with a minimum of 0.001 and a maximum of 0.509, suggesting notable disparities among provinces. Similarly, regional differences are also observed in the variable entrepreneurial activity and control variables.

4.2. Benchmark Regression Analysis

Based on Equation (1), this study first empirically examines the effect of the DE on the HQDF. Column (1) excludes control variables and does not control for fixed effects, column (2) introduces regional and year fixed effects, while columns (3) and (4) further incorporate control variables. The results show that the coefficients for the DE in columns (1) to (4) are 0.4425, 0.2322, 0.3107, and 0.2453, respectively, all of which are statistically significant at the 1% level (Table 4). This demonstrates that the DE has a significant positive impact on the HQDF, thereby supporting Hypothesis 1.

4.3. Robustness Tests

Robustness tests are conducted by replacing the core variable measurement method, changing the data sample, adding lagging effect tests, and changing the test model.
First, to address the potential insufficiency in the persuasiveness of regression results generated by solely using a single methodology, this study adopts the entropy method for weight calculation to recalculate the core explanatory and dependent variables (denoted as DE_2 and HQDF_2, respectively) and re-estimates the regression models. The results are as shown in Table 5. The data show that the coefficients of the level of digital economic development in column (1) to column (3) are 0.2147, 0.2483 and 0.2098, which are all positive and pass the test at the 1% significance level. The results demonstrate that altering the weighting methodology of the core variables supports robustness, thereby reinforcing the fundamental conclusion that the digital economy positively drives the sustainable high-quality development of the fishery sector.
Second, this study excludes samples of municipalities and re-runs the regression. This is due to the consideration that previous studies [16,86,87,88,89] have often noted that due to policy biases and locational advantages, municipalities and provincial capitals are more likely to obtain resources related to the development of the digital economy and the modernization of production, thus leading to disparities in development. To verify the robustness of the regression results, comparative tests are conducted by using core explanatory variables calculated by different weight estimation methods. The results remain robust. Specifically, the coefficients of DE and DE_2 are 0.2311 and 0.2332, and 0.2988 and 0.2012, respectively, which are all statistically significant at the 1% level, as shown in Table 6.
Third, considering that the impact of the digital economy on the real industrial economy requires a certain time lag, this study uses the one-period, two-period, and three-period lags of the DE as the core explanatory variables for re-estimation. As shown in Table 7, the results remain robust.
Fourth, drawing on the existing literature [90], this study employs the unconditional panel quantile regression method to re-estimate the model across different quantiles. This approach aims to explore whether the positive driving effect of the DE on the HQDF remains consistent on average or varies across quantiles. The results are displayed in Figure 4 and show that all confidence intervals exclude zero, indicating statistical significance at the 5% level across all quantiles. Besides, the coefficient of DE exhibits a positive and consistently increasing trajectory with higher quantiles. These robust empirical findings substantiate the fundamental conclusion.

4.4. Endogeneity Treatment

To address potential endogeneity issues, this study employs the instrumental variable (IV) approach. Drawing on the methodologies of relevant previous studies [16,91,92], a valid instrumental variable must satisfy the conditions of being correlated with the endogenous explanatory variable while remaining uncorrelated with the residuals [93]. Following the approach of Nunn and Qian [94], an interaction term is constructed by using the number of landline telephones per 100 people in each province in 1984 (related to individual variation) and the number of internet users in the previous year (related to temporal variation). This interaction term serves as the instrumental variable for the level of digital economic development. To ensure the robustness of the results, in addition to the exogenous instrumental variable, heteroskedasticity-based instrumental variables and combined instrumental variables are also utilized for endogeneity treatment (Table 8).

4.5. Mechanism Analysis

Based on the preceding theoretical analysis and analytical models, this section empirically investigates the influence mechanism between the DE and the HQDF. The results based on Equations (2) and (3) are presented in Table 9. It should be noted that in column (2) and column (4), only the coefficients of the interaction terms (i.e., DE × mechanism variable) are empirically meaningful. If these coefficients are significantly positive, this demonstrates that the joint effect is statistically valid.
As shown in Table 9, the coefficient of DE in column (1) is 0.6571, statistically significant and positive, indicating that the DE enhances technical innovation capabilities. Furthermore, the interaction term between the DE and technical innovation (DE × TI) in column (2) has a coefficient of 0.6797, which is also significantly positive, demonstrating a synergistic positive effect of DE and technical innovation on the HQDF, thus validating Hypothesis 2. Additionally, the coefficients of the DE on regional entrepreneurial activity in column (3) and the interaction term between the DE and entrepreneurial activities (DE × Entrep) in column (4) are 2.9223 and 0.2034, both statistically significant and positive. This implies that the DE stimulates regional entrepreneurial activity and that the DE and regional entrepreneurial activity collectively provide critical forces for advancing the HQDF. Thus, Hypotheses 3 is empirically supported. In summary, the DE drives high-quality development by stimulating technical innovation and fostering regional entrepreneurial activity.

4.6. Heterogeneity Analysis

According to the geographical location, the study sample was categorized into eastern, central, and western provinces, as well as coastal and non-coastal provinces.
As shown in Table 10, in columns (1) and (2), the coefficients for the DE are 0.3525 and −0.6613, respectively, both of which are statistically significant at the 1% level. However, the coefficient in column (3) is not statistically significant. The results indicate that the development of the DE effectively promotes the HQDF in the eastern provinces, while it negatively impacts the HQDF in the central region. In the western provinces, the DE has no significant effect on the HQDF. The results in columns (4) and (5) demonstrate that the development of the DE significantly promotes the HDQF in coastal provinces, while it exhibits no statistically significant effect in non-coastal provinces. The results support Hypothesis 4, indicating regional heterogeneity.
This divergence may be attributed to multifaceted regional disparities, which can be further analyzed through the lenses of unbalanced digital infrastructure, different climatic conditions, fishery management practices, and personnel support. First, as previously discussed, the promoting effect of the digital economy lies in integrating data into the production process, thereby enhancing the operational and transactional efficiency of micro-level entities and increasing the growth potential of industries. However, merely possessing data is insufficient. The data analysis capabilities of regions, industries, and enterprises, as well as supporting information and communication technology infrastructure, are essential to ensuring its effectiveness as a production factor and therefore improve micro- and macro-level operational efficiency [95]. The DE at the provincial level demonstrates a pronounced regional gradient: eastern regions consistently outperform central and western regions, while coastal provinces generally exhibit higher DE levels than their non-coastal counterparts. Similarly, the HQDF displays marked regional disparities, with provinces that initially led in fishery economic development persistently consolidating their leading positions and showing accelerated growth trajectories. This indicates that eastern and coastal regions benefit from better supporting digital infrastructure, larger fishery industry scales, and superior data analysis capabilities of enterprises, thereby ensuring a positive driving effect of the digital economy on the HQDF. Conversely, fishery enterprises in the central, western, and non-coastal regions may be constrained by regional supporting facilities and their own development limitations, lacking the funds, motivation, and industrial environment for digital transformation. This may lead to the insufficient usage of new technologies and ultimately an insignificant or even negative regional impact of the DE on the HQDF. Second, climatic factors further exacerbate this divide. The empirical data from the China Fishery Statistical Yearbook [96] on typhoon- and flood-induced losses reveal that despite frequent typhoon exposure, coastal regions have developed robust disaster mitigation strategies through accumulated experience, enabling effective risk adaptation. Annual economic losses generally remain controllable. In addition, stabler temperatures in coastal areas enhance synergies with digital technologies for precision aquaculture. In contrast, central and western provinces experience broader seasonal temperature fluctuations (e.g., Guizhou’s 2013 extreme freezing temperatures), which may disrupt the reliability of automated feeding systems and water quality sensors. Furthermore, as major climate disasters do not occur frequently, the defense experience in central and western regions is insufficient. For instance, Hunan’s 2021 mega-floods caused massive fishery losses. Third, disparities in fishery governance, policy frameworks, and personnel support exacerbate regional divergences in digital transformation outcomes. Eastern and coastal provinces, benefiting from geographically advantageous conditions and mature fishery industries, exhibit stricter regulatory enforcement of fisheries and greater capacity to achieve economies of scale. The fishery sector in these regions also benefits from prioritized policy support and attracts skilled professionals. For instance, the Smart Ocean Convergence Research Program (launched in 2020) led by Zhejiang University integrates maritime research institutions, enterprises, and coastal stakeholders to advance digital and automated fishery.

5. Discussion

This paper explores the impact of the DE on the HQDF in the context of China. First, the findings align with the theoretical analysis by Ma et al. [42]. They conducted a systematic analysis of the positive effects of digital technologies on the optimization and upgrading of marine economies, through the lens of four fundamental economic processes: production, distribution, exchange, and consumption. This study places a stronger emphasis on China’s high-quality fishery development, systematically investigates the underlying transmission mechanisms driving sectoral optimization, and provides empirical evidence for Ma et al. [42] through econometric testing. Second, compared with existing measurement frameworks of the HQDF [38,39,40], this study innovatively incorporates a supply quality dimension into the evaluation system, thereby constructing a more holistic framework for fishery high-quality development. Third, Existing studies have demonstrated the positive impact of digital economy on productivity [37] and sustainable development [36] and are consistent with our study. Li et al. [36]’s study substantiates these findings through the lens of talent development mechanisms in fisheries—a critical dimension that complements our study. Fourth, our research extends Li et al. [37]’s study through a comprehensive nationwide analysis, while they empirically validated the regional disparities in digital economy’s impact on fishery industry development in China’s coastal regions. We scrutinize the spatial heterogeneity across Chinese provinces and further analyze potential determinants, including variations in digital infrastructure endowment, divergent climatic conditions, disparities in fishery development stages, and different capacities for disaster resilience. This can be further discussed empirically. Finally, while the influence of the digital economy on regional entrepreneurial activities has been validated in existing studies [16,17], this research bridges their findings to the high-quality development of the fishery sector by elucidating its transmission mechanisms. Similarly, although existing studies have confirmed both the innovation-driven fishery development effect [56,57] and the mediating role of technological innovation in the driving mechanism of the digital economy on industrial upgrading [97], we innovatively employ patent output as a proxy for technological innovation in fisheries. Our analysis empirically demonstrates that the digital economy not only enhances technological innovation within the fishery sector but also promotes its high-quality development.
In summary, this study resonates with and extends existing research across multiple dimensions. Our empirical findings substantiate that the DE significantly contributes to the HQDF, with the mediating effects of technological innovation and regional entrepreneurial vitality being statistically robust. Our study extends the geospatial heterogeneity analysis to a national scale. Notably, the findings provide novel perspectives and empirical validation for prior theoretical frameworks and empirical studies. These insights offer actionable references for policymakers and practitioners.

6. Conclusions and Implications

6.1. Conclusions

This paper uses panel data from China from 2011 to 2022 to conduct theoretical research and empirical analysis, with the key findings as detailed below.
First, the digital economy (DE) significantly positively contributes to the high-quality development of the fishery economy (HQDF). The robustness and reliability of the results are verified through a series of robustness tests and endogeneity treatments.
Second, mechanism analysis shows that the DE can promote technological innovation and regional entrepreneurial activity and can jointly promote the HQDF with technological innovation and regional entrepreneurial activity.
Third, heterogeneity analysis shows that the digital economy has a more significant impact on the HQDF in the eastern and coastal areas. Enhanced digital economic development can significantly enhance the driving role of the DE on the HQDF. As digital technology deepens and digital infrastructure consolidates, the contribution of the digital economy grows.

6.2. Practical Implications

Based on the research findings, this study proposes a set of policy recommendations:
  • The digital economy and the digital transformation of fishing industry should be promoted. The aim is to expand the positive influence of the digital economy, making it a sustainable driving force for the high-quality evolution of the fishery economy. To achieve this, we encourage further advancements in constructing a digital society, encouraging investments in digital technologies, and fostering the development and application of technologies such as information technology, big data, cloud computing, blockchain, and artificial intelligence.
  • Technological innovation should be enhanced. Effective incentive policies should be formulated to guide resources towards technology innovation. For example, tax incentives and government grants can enhance the enthusiasm for innovative undertakings. Furthermore, the government should advocate for the development of patent platforms and encourage its application to foster effective applications and promotion of technological innovation, maintain the continuous endogenous growth effect of technological innovation, and create fresh impetus for the growth of the fishery sector.
  • To facilitate entrepreneurial activity, subsidies and fiscal policies for entrepreneurial pursuits can be introduced. Additionally, promoting successful local entrepreneurship case studies is essential. The implementation of digital, intelligent, large-scale entrepreneurial activities in the fishing industry can harness the combined benefits of the developing digital economy and entrepreneurship and then stimulate the fishing industry’s transition towards a modern, high-quality model.
  • Lastly, regarding the empirical evidence of interregional imbalances of the effects of the digital economy, it is crucial to leverage the digital economy in central and western China to enhance its positive effects. Measures such as advancing the construction of information infrastructure, increasing interspatial information sharing, and promoting the accumulation of digital technology reserves need to be adopted, laying the groundwork for the further positive contribution of the digital economy.

6.3. Research Limitations and Further Research

Although this study provides certain achievements in exploring the impact of the DE on the HQDF by using provincial data from China, it also faces several limitations that need to be addressed in future research.
First, while this study offers critical insights into China’s high-quality development of the fishery economy, it is conducted at the provincial level, which may not fully capture firm- or company-level heterogeneities in digital adoption and economic transformation. Future research could utilize micro-level data to explore these dynamics in more depth.
Second, while an instrumental variable approach was used to address potential endogeneity, challenges remain in ensuring the full exogeneity of the chosen instrument. Alternative methodologies, such as natural experiments or policy interventions, could provide additional robustness.
Third, the study finds that the impact of the DE on the HDQF is negative or limited in central and western regions. Thus, future research should systematically investigate structural barriers—such as digital infrastructure disparities, climate challenges for smart fisheries, and policy attention—and explore policy solutions to promote the positive effect of the DE. Additionally, although this study proposes reasonable policy recommendations based on the findings, their practical implementation requires rigorous evaluation. Subsequent work should prioritize longitudinal assessments of policy pilot zones (e.g., inland smart aquaculture hubs) to refine governance frameworks, ensuring that interventions are both actionable and adaptable to regional ecological, economic, and institutional contexts.

Author Contributions

Conceptualization, Z.X.; Formal analysis, Z.X. and X.C.; Investigation, Z.X.; Data curation, Z.X.; Writing—original draft, Z.X.; Writing—review & editing, Z.X., H.Z. and X.C.; Visualization, Z.X. and X.C.; Funding acquisition, Z.X. All authors have read and agreed to the published version of the manuscript.

Funding

This research study was funded by National Natural Science Foundation of China, grant number 72373078.

Institutional Review Board Statement

Not applicable.

Informed Consent Statement

Not applicable.

Data Availability Statement

The data presented in this study are available from the corresponding author upon reasonable request.

Conflicts of Interest

The authors declare no conflicts of interest.

References

  1. FAO. The State of World Fisheries and Aquaculture 2024—Blue Transformation in Action; Food and Agriculture Organization of the United Nations: Rome, Italy, 2024. [Google Scholar]
  2. FAO. Blue Transformation—Roadmap 2022–2030: A Vision for FAO’s Work on Aquatic Food Systems; Food and Agriculture Organization of the United Nations: Rome, Italy, 2022. [Google Scholar]
  3. Du, Z.; Jin, S. The formation and realization of the new goal of China’s agricultural policy. Dongyue Trib. 2016, 37, 24–29. [Google Scholar] [CrossRef]
  4. Xi, S.; Wang, X.; Lin, K. The Impact of Carbon Emissions Trading Pilot Policies on High-Quality Agricultural Development: An Empirical Assessment Using Double Machine Learning. Sustainability 2025, 17, 1912. [Google Scholar] [CrossRef]
  5. Xia, X.; Chen, Z.; Zhang, H.; Zhao, M. Agricultural High-quality Development: Digital Empowerment and Implementation Path. Chin. Rural. Econ. 2019, 12, 2–15. [Google Scholar]
  6. Du, Z.; Hu, L. The Achievements and Interpretations of the High-quality Agricultural Development in China Since the 18th National Congress of the Communist Party of China. Chin. Rural. Econ. 2023, 1, 2–17. [Google Scholar] [CrossRef]
  7. Zhang, Q.; Liu, S.; Liu, L.; Cheng, X.; Wei, S.; Zhu, D. Facilities and equipment status and development trend of deep sea aquaculture in China. Chin. Fish. Econ. 2023, 41, 71–77. [Google Scholar]
  8. Li, D.; Sun, W.; Yu, H.; Zhang, Y.; Han, L. The current characteristics and development suggestions of deep-sea aquaculture in China. Chin. Fish. Econ. 2023, 41, 39–49. [Google Scholar]
  9. Liang, S.; Han, L. Research on the Development Path of China’s Deep-Sea Fisheries from the Perspective of Building a Strong Maritime Country. Pac. J. 2023, 31, 69–81. [Google Scholar] [CrossRef]
  10. Han, Y. Marine Fishery Resources Management and Policy Adjustment in China Since 1949. Chin. Rural. Econ. 2018, 405, 14–28. [Google Scholar] [CrossRef]
  11. Tapscott, B.D.; Babu, R.; Tapscott, D. The Digital Economy: Promise and Peril in the Age of Networked Intelligence; McGraw-Hill: New York, NY, USA, 2003. [Google Scholar]
  12. Harris, R.G. The Internet as a GPT: Factor Market Implications; Discussion Papers; Department of Economics, Simon Fraser University: Burnaby, BC, Canada, 1996. [Google Scholar]
  13. Han, X.; Song, W.; LI, B. Can the Internet Become a New Momentum to Improve the Efficiency of Regional Innovation in China. China Ind. Econ. 2019, 7, 119–136. [Google Scholar] [CrossRef]
  14. Huang, B.; Li, H.; Liu, J.; Lei, J. Digital Technology Innovation and The High-quality Development of Chinese Enterprises: Evidence from Enterprise’s Digital Patents. Econ. Res. J. 2023, 58, 97–115. [Google Scholar]
  15. Zhao, C.; Wang, W.; Li, X. How Does Digital Transformation Affect the Total Factor Productivity of Enterprises? Financ. Trade Econ. 2021, 42, 114–129. [Google Scholar] [CrossRef]
  16. Zhao, T.; Zhang, Z.; Liang, S. Digital Economy, Entrepreneurship, and High-Quality Economic Development: Empirical Evidence from Urban China. J. Manag. World 2020, 36, 65–76. [Google Scholar] [CrossRef]
  17. Yin, Z.; Gong, X.; Guo, P.; Wu, T. What Drives Entrepreneurship in Digital Economy? Evidence from China. Econ. Model. 2019, 82, 66–73. [Google Scholar] [CrossRef]
  18. Chou, Y.-C.; Chuang, H.H.C.; Shao, B.B.M. The impacts of information technology on total factor productivity: A look at externalities and innovations. Int. J. Prod. Econ. 2014, 158, 290–299. [Google Scholar] [CrossRef]
  19. Teece, D.J. Profiting from innovation in the digital economy: Enabling technologies, standards, and licensing models in the wireless world. Res. Policy 2018, 47, 1367–1387. [Google Scholar] [CrossRef]
  20. Xia, Q.; Lou, H. Simulation of business model innovation based on business model rigidity: Comparison between traditional and internet firms. Syst. Eng. Theory Pract. 2018, 38, 2776–2792. [Google Scholar]
  21. Qi, Y.; Xiao, X. Transformation of Enterprise Management in the Era of Digital Economy. J. Manag. World 2020, 36, 135–152+250. [Google Scholar] [CrossRef]
  22. Stiglitz, J.E. Information and the Change in the Paradigm in Economics. Am. Econ. Rev. 2002, 92, 460–501. [Google Scholar] [CrossRef]
  23. Acemoglu, D.; Restrepo, P. The Race between Man and Machine: Implications of Technology for Growth, Factor Shares, and Employment. Am. Econ. Rev. 2018, 108, 1488–1542. [Google Scholar] [CrossRef]
  24. Guo, K.; Wang, Y.; Hang, J. Scale Effect of Data, Structural Change and Productivity Growth. China Ind. Econ. 2024, 8, 5–23. [Google Scholar] [CrossRef]
  25. Turegano, D.M.; Garcia-Herrero, A. Financial Inclusion, Rather Than Size, is the Key to Tackling Income Inequality; Working Papers; BBVA Research: Madrid, Spain, 2015. [Google Scholar]
  26. Cardona, M.; Kretschmer, T.; Strobel, T. ICT and productivity: Conclusions from the empirical literature. Inf. Econ. Policy 2013, 25, 109–125. [Google Scholar] [CrossRef]
  27. Zuo, P.; Jiang, Q.; Chen, J. Internet Development, Urbanization and the Upgrading of China’s Industrial Structure. J. Quant. Technol. Econ. 2020, 37, 71–91. [Google Scholar] [CrossRef]
  28. Czernich, N.; Falck, O.; Kretschmer, T.; Woessmann, L. Broadband Infrastructure and Economic Growth. Econ. J. 2011, 121, 505–532. [Google Scholar] [CrossRef]
  29. Fang, F.; Tian, G.; Zhang, X. Digital Infrastructure and the Intergenerational Income upward Mobility: The Quasi-natural Experiment Based on “Broadband China”. Econ. Res. J. 2023, 58, 79–97. [Google Scholar]
  30. Xu, C.; Zheng, N.; Sun, W.; Li, C.; Zhang, Y.; Zhou, Q. Research on Remote Control System of Automatic Feeding in Deep Sea Cage Based on PLC and HMI. J. Jiangsu Ocean. Univ. (Nat. Sci. Ed.) 2022, 31, 16–22. [Google Scholar]
  31. Huan, J.; Li, H.; Wu, F.; Cao, W. Design of water quality monitoring system for aquaculture ponds based on NB-IoT. Aquac. Eng. 2020, 90, 102088. [Google Scholar] [CrossRef]
  32. Wu, Y.; Duan, Y.; Wei, Y.; An, D.; Liu, J. Application of intelligent and unmanned equipment in aquaculture: A review. Comput. Electron. Agric. 2022, 199, 107201. [Google Scholar] [CrossRef]
  33. Zhang, H.; Gui, F. The Application and Research of New Digital Technology in Marine Aquaculture. J. Mar. Sci. Eng. 2023, 11, 401. [Google Scholar] [CrossRef]
  34. Ismail, S.; Reza, H.; Salameh, K.; Kashani Zadeh, H.; Vasefi, F. Toward an Intelligent Blockchain IoT-Enabled Fish Supply Chain: A Review and Conceptual Framework. Sensors 2023, 23, 5136. [Google Scholar] [CrossRef]
  35. Rowan, N.J. The role of digital technologies in supporting and improving fishery and aquaculture across the supply chain—Quo Vadis? Aquac. Fish. 2023, 8, 365–374. [Google Scholar] [CrossRef]
  36. Li, Y.; Ji, J. The digitalization of Chinese fisheries and its configuration path to empower fishery sustainable development. J. Clean. Prod. 2024, 466, 142807. [Google Scholar] [CrossRef]
  37. Li, L.C.; Jiang, S.; Lin, Y.T. The Impact of the Digital Economy on Sustainable Fisheries: Insights from Green Total Factor Productivity in China’s Coastal Regions. Sustainability 2025, 17, 2673. [Google Scholar] [CrossRef]
  38. Jin, J.; Quan, Y.; Qu, M. Measurement and Spatiotemporal Evolution of High-Quality Development in China’s Marine Fisheries. Mar. Sci. Bull. 2024, 6, 1–13. [Google Scholar]
  39. Shi, S.; Yin, W. Study on evaluation of fishery high quality development level in China’s coastal provinces and cities based on Entropy Weighted TOPSIS. Chin. Fish. Econ. 2023, 41, 31–39. [Google Scholar]
  40. Yan, Y.; Tian, P.; Li, J. Spatio-temporal evolution of high quality development level of China’s fishery industry. Chin. Fish. Econ. 2022, 40, 36–46. [Google Scholar]
  41. Yang, H.; Jiang, C.; Zhang, L.; Li, F.; Xu, Q.; Ren, H.; Lin, C. Digital empowerment promotes the construction of aquatic ecological ranching. J. Fish. China 2023, 47, 91–99. [Google Scholar]
  42. Ma, W.; Xing, W.; Gao, R. Research on Digital Economy Enabling High-quality Development of Marine Economy. Econ. Probl. 2024, 6, 42–50. [Google Scholar] [CrossRef]
  43. Trienekens, J.; Zuurbier, P. Quality and safety standards in the food industry, developments and challenges. Int. J. Prod. Econ. 2008, 113, 107–122. [Google Scholar] [CrossRef]
  44. David, P.; Wright, G. General Purpose Technologies and Productivity Surges: Historical Reflections on the Future of the ICT Revolution. In The Economic Future in Historical Perspective; Oxford University Press for the British Academy: Oxford, UK, 2005. [Google Scholar]
  45. Hao, Z.; Li, C.; Zhang, H.; Ren, W. Control and realization of intelligent fishing system based on PLC and fuzzy PID algorithm. J. Phys. Conf. Ser. 2022, 2246, 012042. [Google Scholar] [CrossRef]
  46. Ma, L.; Ma, Z.; Zeng, X.; Liu, D. Applied research on marine ranch based on ocean acousto-optic comprehensive detection technology. J. Ocean. Technol. 2020, 39, 89–98. [Google Scholar]
  47. Goldfarb, A.; Tucker, C. Digital Economics. J. Econ. Lit. 2019, 57, 3–43. [Google Scholar] [CrossRef]
  48. Li, L.; Zeng, Y.; Guo, H. Digital Countryside Construction: Underlying Logic, Practical Errors and Optimization Path. Chin. Rural. Econ. 2023, 39, 77–92. [Google Scholar] [CrossRef]
  49. Wang, X.; Zhao, Y. The Development of Digital Finance and Differences in Financial Availability Between Urban and Rural Households. Chin. Rural. Econ. 2022, 1, 44–60. [Google Scholar]
  50. Glavas, C.; Mathews, S. How international entrepreneurship characteristics influence Internet capabilities for the international business processes of the firm. Int. Bus. Rev. 2014, 23, 228–245. [Google Scholar] [CrossRef]
  51. Schumpeter, J.A. The Theory of Economic Development: An Inquiry into Profits, Capital, Credit, Interest, and the Business Cycle; Harvard Press: Cambridge, MA, USA, 1912. [Google Scholar]
  52. Lyytinen, K.; Yoo, Y.; Boland, R.J., Jr. Digital product innovation within four classes of innovation networks. Inf. Syst. J. 2016, 26, 47–75. [Google Scholar] [CrossRef]
  53. Forés, B.; Camisón, C. Does incremental and radical innovation performance depend on different types of knowledge accumulation capabilities and organizational size. J. Bus. Res. 2016, 69, 831–848. [Google Scholar] [CrossRef]
  54. Cui, T.; Ye, H.J.; Teo, H.-H.; Li, J. Information technology and open innovation: A strategic alignment perspective. Inf. Manag. 2015, 52, 348–358. [Google Scholar] [CrossRef]
  55. Varian, H.R. Computer Mediated Transactions. Am. Econ. Rev. 2010, 100, 1–10. [Google Scholar] [CrossRef]
  56. Lin, X.; Zheng, L.; Li, W. Measurement of the contributions of science and technology to the marine fisheries industry in the coastal regions of China. Mar. Policy 2019, 108, 103647. [Google Scholar] [CrossRef]
  57. Jin, D.; Hoagland, P.; Morin Dalton, T. Linking economic and ecological models for a marine ecosystem. Ecol. Econ. 2003, 46, 367–385. [Google Scholar] [CrossRef]
  58. Hao, Y.; Zhang, B. The impact of digital financial usage on resident’s income inequality in China: An empirical analysis based on CHFS data. J. Asian Econ. 2024, 91, 101706. [Google Scholar] [CrossRef]
  59. Wang, S.; Yu, N.; Fu, R. Digital Rural Construction: Action Mechanism, Realistic Challenge and Implementation Strategy. Reform 2021, 4, 45–59. [Google Scholar]
  60. Schumpeter, J.A. Capitalism, Socialism, and Democracy. Am. Econ. Rev. 1942, 3, 594–602. [Google Scholar]
  61. Spinelli, S.; Adams, R.J. New Venture Creation: Entrepreneurship for the 21st Century; McGraw-Hill Education: New York, NY, USA, 1999. [Google Scholar]
  62. Brynjolfsson, E.; Rock, D.; Syverson, C. The Productivity J-Curve: How Intangibles Complement General Purpose Technologies. Am. Econ. J. Macroecon. 2021, 13, 333–372. [Google Scholar] [CrossRef]
  63. Ni, K.; Liu, X. Digital Transformation and Enterprise Growth: Logic and Practice of China’s Capital Market. Bus. Manag. J. 2021, 43, 79–97. [Google Scholar] [CrossRef]
  64. Lian, Y.; Peng, Z.; Cai, J.; Yang, H. Peer Effect of Capital Structure in Business Cycle. Account. Res. 2020, 11, 85–97. [Google Scholar]
  65. Tian, P.; Li, J.; Cao, L.; Liu, Y.; Zhang, H. Evaluation of fishery economic efficiency and Development trend forecast in China. Chin. J. Agric. Resour. Reg. Plan. 2023, 44, 160–172. [Google Scholar]
  66. Jiang, T. Mediating Effects and Moderating Effects in Causal Inference. China Ind. Econ. 2022, 5, 100–120. [Google Scholar] [CrossRef]
  67. Guo, B.; Wang, Y.; Zhang, H.; Liang, C.; Feng, Y.; Hu, F. Impact of the digital economy on high-quality urban economic development: Evidence from Chinese cities. Econ. Model. 2023, 120, 106194. [Google Scholar] [CrossRef]
  68. Li, J.; Luo, N. Has the Opening of High-speed Rail Improved the Level of Urban Air Pollution? China Econ. Q. 2020, 19, 1335–1354. [Google Scholar] [CrossRef]
  69. Wang, L.; Wang, Z.; Ma, Y. Does environmental regulation promote the high-quality development of manufacturing? A quasi-natural experiment based on China’s carbon emission trading pilot scheme. Socio-Econ. Plan. Sci. 2022, 81, 101216. [Google Scholar] [CrossRef]
  70. Zhang, A.; Zhang, W.; Guo, X. The Digital Economy, Integration of Productive Services and Manufacturing, and High-Quality Development of the Manufacturing Sector: Evidence from China. Sustainability 2024, 16, 10258. [Google Scholar] [CrossRef]
  71. Yu, D.W.; Wu, L.Y.; Regenstein, J.M.; Jiang, Q.X.; Yang, F.; Xu, Y.S.; Xia, W.S. Recent advances in quality retention of non-frozen fish and fishery products: A review. Crit. Rev. Food Sci. Nutr. 2020, 60, 1747–1759. [Google Scholar] [CrossRef] [PubMed]
  72. Moretti, V.M.; Turchini, G.M.; Bellagama, F.; Caprino, F. Traceability issues in fishery and aquaculture products. Vet. Res. Commun. 2003, 27, 497–505. [Google Scholar] [CrossRef] [PubMed]
  73. Gopi, K.; Mazumder, D.; Sammut, J.; Saintilan, N. Determining the provenance and authenticity of seafood: A review of current methodologies. Trends Food Sci. Technol. 2019, 91, 294–304. [Google Scholar] [CrossRef]
  74. Ma, H.; Li, Z.; Dong, R.; Tang, D. Influence of Digital Economy on Urban Energy Efficiency in China. Sustainability 2024, 16, 10088. [Google Scholar] [CrossRef]
  75. Bo, P.; Zhang, Y. Digital Economy, Declining Demographic Dividends and the Rights and Interests of Low-and Medium-skilled Labor. Econ. Res. J. 2021, 56, 91–108. [Google Scholar]
  76. Cyberspace Administration of China, Digital China Development Report. 2021. Available online: https://www.cac.gov.cn/rootimages/uploadimg/1675765283208335/1675765283208335.pdf (accessed on 9 January 2025).
  77. CAICT. China Digital Economy Development Research Report. 2023. Available online: http://www.caict.ac.cn/english/research/whitepapers/202311/P020231101476013122093.pdf (accessed on 9 January 2025).
  78. Liu, Q.; Gao, L.; Lu, Y.; Ouyang, H.; Sun, Y.; Yan, X.; Cheng, J. Search strategy design and preliminary analysis of global fishery patent based on DII and TI database. Fish. Inf. Strategy 2017, 32, 19–24. [Google Scholar] [CrossRef]
  79. Wu, M.; Liu, C.; Huang, J. The Technological Innovation Effect of Special Economic Zones Policy—Evidence from Patent Data. China Econ. Q. 2021, 21, 1817–1838. [Google Scholar] [CrossRef]
  80. Ye, W.; Li, X.; Chen, Q. How Immigrant Populations Affect City Entrepreneurship Activity: Mechanisms and Evidence. Econ. Res. J. 2018, 53, 157–170. [Google Scholar]
  81. Fang, F.; Zhang, L.; Zhao, J. Multiple Paths of Agricultural Green Total Factor Productivity Improvement from the Perspective of Institutional Grouping: A Panel Data Analysis Based on Dynamic QCA. Chin. Rural. Econ. 2024, 2, 44–66. [Google Scholar] [CrossRef]
  82. Fu, Y.; Zhu, Y. The Impact of Digital Infrastructure Construction on Agricultural Product Market Segmentation: A Quasi-Natural Experiment Based on the “Broadband China” Strategic Pilot Program. Chin. Rural. Econ. 2024, 1, 62–81. [Google Scholar] [CrossRef]
  83. Liu, J.; Li, R.; Shi, Y. From “Semi-urbanization” to “Urbanization”: The Education Promotion Mechanism of Citizenization of Migrant Workers in China. J. Quant. Technol. Econ. 2023, 40, 138–156. [Google Scholar]
  84. Yang, J.; Li, X. Education Inequality, Human Capital and Economic Growth: An Empirical Study on China. J. Quant. Technol. Econ. 2007, 24, 37–45. [Google Scholar]
  85. Chen, Z.; Kahn, M.E.; Liu, Y.; Wang, Z. The consequences of spatially differentiated water pollution regulation in China. J. Environ. Econ. Manag. 2018, 88, 468–485. [Google Scholar] [CrossRef]
  86. Yue, H.; Zhou, Z.; Tan, Y.T. Mechanism and Empirical Study of Digital Economy on the Upgrading of Manufacturing Structure. Chin. J. Manag. 2024, 21, 670–681. [Google Scholar]
  87. Wang, F.; Sun, S.; Liu, T. Has the Development of Digital Economy Promoted Changes in Agricultural Production Methods? Evidence from Prefectures in the Yellow River Basin. Chin. Rural. Econ. 2023, 9, 122–143. [Google Scholar] [CrossRef]
  88. Liu, J.; Meng, Z. An empirical analysis of the effect of fishery technology extension on fishermen’s income: Based on panel data from 30 provinces in China. Chin. Fish. Econ. 2024, 42, 39–53. [Google Scholar]
  89. Jiang, Y. How Digital Economy Promotes Entrepreneurship Development: Based on Macro and Micro Perspectives. Bus. Manag. J. 2024, 46, 66–79. [Google Scholar] [CrossRef]
  90. Firpo, S.; Fortin, N.M.; Lemieux, T. Unconditional Quantile Regressions; NBER Working Paper Series; NBER: Cambridge, MA, USA, 2007. [Google Scholar]
  91. Huang, Q.; Yu, Y.; Zhang, S. Internet Development and Productivity Growth in Manufacturing Industry: Internal Mechanism and China Experiences. China Ind. Econ. 2019, 8, 5–23. [Google Scholar] [CrossRef]
  92. Yuan, C.; Xiao, T.; Geng, C.; Sheng, Y. Digital Transformation and Division of Labor between Enterprises: Vertical Specialization or Vertical Integration. China Ind. Econ. 2021, 9, 137–155. [Google Scholar] [CrossRef]
  93. Staiger, D.O.; Stock, J.H. Instrumental Variables Regression with Weak Instruments. Econometrica 1997, 65, 557–586. [Google Scholar] [CrossRef]
  94. Nunn, N.; Qian, N. US Food Aid and Civil Conflict. Am. Econ. Rev. 2014, 104, 1630–1666. [Google Scholar] [CrossRef]
  95. Xie, K.; Xia, Z.; Xiao, J. The Enterprise Realization Mechanism of Big Data Becoming a Real Production Factor: From the Product Innovation Perspective. China Ind. Econ. 2020, 5, 42–60. [Google Scholar] [CrossRef]
  96. Liu, X.Z.; Cui, L.F.; Li, S.M.; Han, X.; Jiang, K.Y.; Yuan, X.C.; Yu, X.J.; Wang, D.; Wu, F.X.; Song, D.D. China Fishery Statistical Yearbook (2011–2022); China Agriculture Press: Beijing, China, 2023. [Google Scholar]
  97. Lang, Y.; Fan, B.; Zeng, C.; Huang, S. The Driving Mechanism and Enhancement Path of Digital Economy for Industrial Leapfrogging: Based on the mediating role of science and technology innovation and the regulating effect of industrial ecology. Stud. Sci. Sci. 2024, 42, 1–18. [Google Scholar] [CrossRef]
Figure 1. The theoretical analysis framework of how DE affects HQDF. Note: Red circles denote motivation-related factors, while gray circles represent funding-related factors. The upward arrows indicate their increase, and downward arrows signify their decrease.
Sustainability 17 04338 g001
Figure 2. Geographical distribution of China’s HQDF over the specified period: (a) 2011; (b) 2015; (c) 2018; (d) 2022.
Sustainability 17 04338 g002
Figure 3. Distribution characteristics of level of DE. (a) Characteristics of level of DE in China and east, central, and west regions; (b) characteristics of level of DE in China and coastal and non-coastal regions.
Sustainability 17 04338 g003
Figure 4. Quantile regression result. Note: The gray shaded area represents the 95% confidence intervals for the estimated coefficients of digital technology; the red line denotes the coefficient of DE.
Sustainability 17 04338 g004
Table 1. Comprehensive evaluation indicator system for HQDF.
Primary IndexesSecondary IndicatorsFormulasMetric Attributes
Enhancement of supply quantity and qualityQuantityTotal fishery productionTotal fishery production+
QualityDegree of processing of aquatic productsTotal amount of aquatic products processed/total fishery production+
Storage facilitiesQuantity of aquatic cold storage+
Supply capacity of provenanceNumber of national aquaculture genetic breeding farms+
Development of pelagic fisheriesPelagic fishery output/total fishery production+
Economic benefits and producer incomeGross value of fishery economyGross value of fishery economy+
Economic losses due to natural disastersFishery economic loss due to natural disaster+
Economic loss due to pollutionFishery economic loss due to pollution
Net income of fishermen per capitaNet income of fishermen per capita
Innovation promotionAquatic technology promotion fundAquatic technology promotion fund+
Number of aquatic technology promotion institutionsNumber of aquatic technology promotion institutions+
Sustainable developmentFishing vessel efficiencyTotal fishery production/fishing boat machinery power+
Area cultivation efficiencyTotal fishery production/aquaculture area+
Employee efficiencyGross value of fishery economy/number of fishery employees+
Cultivation pollutionAquaculture contaminated area/total aquaculture area × 100%
Carbon emissions from fisheriesCarbon emissions from fishery department calculated from raw data published by CEADS
Note: ‘+’ denotes positive indicators, ‘−’ represents negative indicators.
Table 2. Comprehensive evaluation indicator system for DE.
Primary IndexesSecondary IndicatorsMetric Attributes
Digital infrastructure constructionInternet broadband access port+
Number of domains+
Number of webpages+
Number of internet broadband access users per 100 people+
Length of long-distance cable line+
Popularization rate of mobile telephones+
Digital industrializationTotal amount of telecom business+
Software operating revenue per capita+
Percentage of employees in digital industry+
Proportion of salaries of digital industry professionals+
Digital technology innovation outputNumber of invention patents related to digital technology+
Number of utility model patents related to digital technology+
Number of design patents related to digital technology+
Note: In the table, ‘+’ denotes positive indicators.
Table 3. The descriptive statistics.
VariablesObsMeanSDMinMedianMax
High-quality economic development of fisheries (HQDF)3480.5000.0720.2420.4880.749
Digital economy (DE)3480.1800.1010.0300.1620.551
Technical innovation (TI)3480.0660.0770.0010.0370.509
Entrepreneurial activity (Entrep)3484.8940.3704.0904.9196.187
Fixed assets (Fix)3488.0871.0394.6218.2909.773
Labor Input (Labor)3487.4411.7913.6437.8769.609
Marketization level (Market)348−2.5200.242−3.394−2.485−2.051
Government intervention (Gov)348−1.5020.335−2.238−1.504−0.773
Regional Education (Edu)3482.2100.0932.0052.1992.533
Government Environmental Concern (Eco)348−5.0310.280−5.821−5.017−4.388
Table 4. Results of benchmark regression results.
(1)(2)(3)(4)
HQDFHQDFHQDFHQDF
DE0.4425 ***0.2322 ***0.3107 ***0.2453 ***
(0.0385)(0.0616)(0.0258)(0.0638)
Fix 0.0038 *0.0133 **
(0.0022)(0.0066)
Labor 0.0120 ***0.0226 ***
(0.0018)(0.0076)
Market 0.1142 ***−0.0261
(0.0165)(0.0169)
Gov 0.0100−0.0201
(0.0140)(0.0221)
Edu −0.0719 *0.1209
(0.0375)(0.0793)
Eco 0.00090.0046
(0.0088)(0.0073)
_cons0.4202 ***0.4580 ***0.7904 ***−0.1603
(0.0066)(0.0111)(0.1122)(0.1988)
N348348348348
R20.37820.90130.65260.9074
Province F.E.NoYesNoYes
Time F.E.NoYesNoYes
Note: ***, **, and * indicate significance at the 1%, 5%, and 10% levels, respectively; the corresponding heteroskedasticity-robust standard errors are reported in parentheses.
Table 5. Results of robustness test by replacing core explanatory and dependent variables.
(1)(2)(3)
HQDFHQDF_2HQDF_2
DE 0.2483 ***
(0.0473)
DE_20.2147 *** 0.2098 ***
(0.0506) (0.0335)
Fix0.0158 **0.0146 ***0.0170 ***
(0.0067)(0.0053)(0.0054)
Labor0.0257 ***0.0110 *0.0139 **
(0.0079)(0.0061)(0.0059)
Market−0.0246−0.0376 **−0.0365 **
(0.0171)(0.0152)(0.0155)
Gov−0.0189−0.0293 *−0.0284 *
(0.0224)(0.0158)(0.0158)
Edu0.13020.06750.0759
(0.0799)(0.0597)(0.0597)
Eco0.0067−0.0052−0.0032
(0.0074)(0.0058)(0.0059)
_cons−0.1907−0.3706 **−0.0269 ***
(0.2023)(0.1646)(0.0043)
N348348348
R20.90810.97120.6246
Province F.E.YesYesYes
Time F.E.YesYesYes
Note: ***, **, and * indicate significance at the 1%, 5%, and 10% levels, respectively; the corresponding heteroskedasticity-robust standard errors are reported in parentheses.
Table 6. Results of robustness test by excluding parts of samples.
(1)(2)(3)(4)
HQDFHQDFHQDF_2HQDF_2
DE0.3211 *** 0.2332 ***
(0.0723) (0.0560)
DE_2 0.2988 *** 0.2012 ***
(0.0545) (0.0396)
Fix0.0221 **0.0271 ***0.0272 ***0.0308 ***
(0.0090)(0.0089)(0.0082)(0.0081)
Labor−0.0037−0.00260.01090.0121
(0.0084)(0.0083)(0.0085)(0.0085)
Market−0.0333 **−0.0307 *−0.0460 ***−0.0448 ***
(0.0168)(0.0168)(0.0161)(0.0164)
Gov0.01580.02230.00030.0042
(0.0263)(0.0262)(0.0202)(0.0199)
Edu0.03500.02760.0035−0.0047
(0.0837)(0.0811)(0.0673)(0.0659)
Eco0.00120.0032−0.0054−0.0042
(0.0077)(0.0076)(0.0063)(0.0064)
_cons0.15690.1689−0.3075 *−0.2980 *
(0.1993)(0.1977)(0.1761)(0.1781)
Province F.E.YesYesYesYes
Time F.E.YesYesYesYes
Note: ***, **, and * indicate significance at the 1%, 5%, and 10% levels, respectively; the corresponding heteroskedasticity-robust standard errors are reported in parentheses.
Table 7. Results of robustness test by applying period lags.
(1)(2)(3)
HQDFHQDFHQDF
L.DE0.2670 ***
(0.0608)
L2.DE 0.2847 ***
(0.0603)
L3.DE 0.2568 ***
(0.0828)
Fix0.0147 **0.0154 **0.0158 *
(0.0068)(0.0071)(0.0081)
Labor0.0194 ***0.0163 **0.0194 **
(0.0073)(0.0075)(0.0082)
Market−0.0213−0.0080−0.0102
(0.0158)(0.0171)(0.0215)
Gov−0.0232−0.0178−0.0256
(0.0183)(0.0196)(0.0209)
Edu0.10780.06430.0401
(0.0763)(0.0820)(0.0902)
Eco0.00110.00080.0052
(0.0066)(0.0072)(0.0077)
_cons−0.12610.03170.0749
(0.1979)(0.2101)(0.2281)
N319290261
R20.92190.92360.9259
Province F.E.YesYesYes
Time F.E.YesYesYes
Note: ***, **, and * indicate significance at the 1%, 5%, and 10% levels, respectively; the corresponding heteroskedasticity-robust standard errors are reported in parentheses.
Table 8. Endogeneity treatment by using instrumental variable approach.
StdIVGenInstGenExtInst
(1)(2)(3)(4)
First StageSecond Stage
VariablesDEHQDFHQDFHQDF
IV0.3672 ***
(0.00083)
DE 0.9154 ***0.2336 ***0.3016 ***
(0.172)(0.065)(0.066)
Fix 0.01310.0133 **0.0133 **
(0.008)(0.006)(0.006)
Labor 0.0320 ***0.0225 ***0.0234 ***
(0.011)(0.007)(0.007)
Market 0.0003−0.0265 *−0.0238
(0.018)(0.016)(0.016)
Gov 0.0033−0.0205−0.0181
(0.023)(0.020)(0.021)
Edu 0.1786 **0.11980.1257 *
(0.090)(0.074)(0.074)
Eco 0.0146 *0.00440.0054
(0.008)(0.007)(0.007)
_cons 0.4374 ***0.4857 ***0.4809 ***
(0.014)(0.009)(0.009)
Kleibergen-Paap rk LM statistic25.83 *** 100.87 ***153.21 ***
Kleibergen-Paap Wald rk F statistic18.88 139.4782.97
R-squared 0.86490.9070.907
Province F.E.YesYesYesYes
Time F.E.YesYesYesYes
Note: ***, **, and * indicate significance at the 1%, 5%, and 10% levels, respectively; the corresponding heteroskedasticity-robust standard errors are reported in parentheses.
Table 9. Results of mechanism analysis.
Mechanism Analysis of TIMechanism Analysis of Entrep
(1)(2) (3)(4)
TIHQDF EntrepHQDF
DE0.6571 ***0.0686DE2.9223 ***−0.8574 **
(0.1233)(0.0803) (0.3109)(0.3434)
TI −0.2066 **Entrep −0.0335 **
(0.0881) (0.0145)
DE×TI 0.6797 ***DE×Entrep 0.2034 ***
(0.1889) (0.0596)
Fix0.0191 ***0.0161 **Fix0.2445 ***0.0181 ***
(0.0063)(0.0066) (0.0530)(0.0067)
Labor0.0263 **0.0217 ***Labor−0.03530.0223 ***
(0.0121)(0.0078) (0.0619)(0.0075)
Market−0.0666 ***−0.0264Market0.1916−0.0265
(0.0208)(0.0175) (0.1787)(0.0168)
Gov0.0155−0.0249Gov0.3150 ***−0.0219
(0.0153)(0.0222) (0.0904)(0.0231)
Edu−0.2749 ***0.1222Edu0.13760.1210
(0.1048)(0.0797) (0.3509)(0.0793)
Eco0.00130.0075Eco0.1078 **0.0062
(0.0080)(0.0073) (0.0536)(0.0074)
_cons0.0666−0.1384_cons3.8478 ***−0.0119
(0.2696)(0.2003) (1.2564)(0.2113)
N348348N348348
R20.87360.9111R20.73160.9106
Province F.E.YesYesProvince F.E.YesYes
Time F.E.YesYesTime F.E.YesYes
Note: ***, and ** indicate significance at the 1%, and 10% levels, respectively; the corresponding heteroskedasticity-robust standard errors are reported in parentheses.
Table 10. Results of heterogeneity analysis.
(1)(2)(3)(4)(5)
EastCentralWestCoastalNon-Coastal
HQDFHQDFHQDFHQDFHQDF
DE0.3525 ***−0.6613 ***0.03450.4121 ***−0.1058
(0.0838)(0.2358)(0.1287)(0.0850)(0.0760)
Control
Variables
YesYesYesYesYes
N13296120132216
R20.93150.82030.93880.93590.8682
Province F.E.YesYesYesYesYes
Time F.E.YesYesYesYesYes
Note: *** indicates significance at the 1% level; the corresponding heteroskedasticity-robust standard errors are reported in parentheses.
Disclaimer/Publisher’s Note: The statements, opinions and data contained in all publications are solely those of the individual author(s) and contributor(s) and not of MDPI and/or the editor(s). MDPI and/or the editor(s) disclaim responsibility for any injury to people or property resulting from any ideas, methods, instructions or products referred to in the content.

