1. Introduction
With the rapid development of social economy and the acceleration of urban modernization, urban rail transit has been used as an important method in dealing with traffic problems in large and medium-sized cities with its large volume, safety, punctuality, and low pollution [
1]. Although urban rail transit is constantly developing and gradually meeting the needs of passengers, its high-density passenger flow brings some problems at the same time. Therefore, the key of its development is to improve the service quality of urban rail transit in order to retain passengers [
2]. Through evaluating the passengers’ satisfaction, we can find the weaknesses in current urban rail transit services. However, this is a kind of subjective feeling of those passengers. This survey is not only related to the service quality which is provided by the urban rail transit operator, but also closely related to the personal characteristics of those investigated passengers, such as gender, age, education background, and income [
3].
The study of satisfaction started in the field of economics. In 1965, the American scholar Richard N Cardozo first applied the theory of customer satisfaction to marketing, forecasting the study of customer satisfaction [
4]. With the deepening of this research, some scholars have begun to study passenger satisfaction in the field of urban rail transit. However, most of the researches focus on evaluation methods and indicator selection [
5,
6,
7], and the impact of personal characteristics on urban rail transit satisfaction is less mentioned. Aydin et al. evaluated the satisfaction of urban rail transit passengers in Istanbul and analyzed their travel preferences based on factors such as age, gender, and income [
8]. Ji et al. established a model for the impact of external dependent variables such as passenger personal attributes and travel characteristics on passenger satisfaction, taking the Nanjing tram as the object, and pointed out the shortcomings in the existing tram services [
9]. Seda Yanık et al. studied the relationship between passenger satisfaction and passenger characteristics, analyzed the factors affecting the selection of rail transit stations, and assessed the satisfaction of transit passengers with the rapid rail transit system [
10]. Mei et al. used the BP neural network method to determine the weight of the impact of passenger group attributes on the satisfaction of urban rail transit passengers. They found that for dissatisfied groups, the basic attributes that had a greater impact were gender, permanent residence, and income [
11]. Wen et al. studied the effects of gender, age, travel frequency, travel purpose, and travel time on passenger satisfaction based on survey data on Kunming Metro satisfaction [
12]. Adane Obsie et al. found, through their analysis of passenger satisfaction with the Addis Ababa Light Rail (AALRT), that passengers who ride the light rail during peak afternoon hours, have high household income and short travel time, and are shopping-oriented had negative views on the congestion level, schedules, ticketing, and information systems of the light rail [
13]. Ahmad used Mann–Whitney U and Kruskal–Wallis to test the impact of passenger gender and age on LRT service quality perception and overall satisfaction. It was found that there were significant differences in the factors affecting passenger satisfaction in terms of gender and age [
14]. Guo et al. conducted a survey on urban rail transit passengers in Xi’an and explored the personal characteristics of rail transit passengers [
15]. Papagiannakis and Yannakou used inferential statistical analysis and ordinal logistic regression to investigate changes in citizen cognition and found that age, income, and personal travel behavior were significantly correlated with the level of satisfaction with public transportation and the willingness to increase public transportation use due to the subway [
16]. Wang and Wu found in their analysis of passenger satisfaction with Wuhan Metro that male and female commuting groups believe that the transfer process is more crowded, and the transfer distance is longer. In addition, due to the high sensitivity of the two types of commuting groups to time, it is generally believed that the train interval after transfer is longer [
17]. Priyanka Prabhakaran et al. conducted a survey and analysis using the Chennai subway as an example and found that male commuters used subway services more than female commuters. In terms of age, commuters aged 25 to 35 had a high tendency to use subway services, while commuters aged 55 and above had a very low tendency to use subway services [
18]. The majority of studies in this area utilize structural equation models to streamline the relationship between different indicators into linear relationships or employ methods such as calculating the average satisfaction score to analyze the characteristics of urban rail transit passengers. The two aforementioned methods have shown promising results in practical research. However, as each passenger typically exhibits multiple characteristics, and not all characteristics are necessarily linked to passenger satisfaction, it is crucial to conduct a correlation analysis between passenger characteristics and satisfaction. This can effectively reduce data duplication and redundancy caused by passenger characteristics analysis and improve the accuracy of analysis results.
In order to study the influence of personal characteristics such as gender, age, income, and education on urban rail transit satisfaction under different social backgrounds, a questionnaire is designed, including the basic information of passengers and the assessment of satisfaction. Through the survey data, the passenger satisfaction score of Qingdao rail transit is calculated by using the fuzzy comprehensive assessment method, and the correlation between passenger personal characteristics and passenger satisfaction is analyzed by SPSS software 24.0. It provides a theoretical basis for rail transit operators to discover the different perceptions of different personal backgrounds on the operation service, find out the service defects, improve the weaknesses in the operation process, and enhance passenger satisfaction.
2. Establishment of PSA Index System
The passenger satisfaction assessment on urban rail transit is an important means to continuously improve the service of urban rail transit. Establishing a comprehensive, complete, scientific, and reasonable PSA Index System of a metro is the primary issue and key in carrying out the mechanism of PSA in metros. As a kind of travel service, urban rail transit can be divided into traffic service, ticketing service, personnel service, environmental service, passenger-oriented service, emergency management service, and so on. Therefore, the PSA Index System should include several assessment indexes of multiple dimensions. Based on the actual situation of Qingdao Metro in China, according to the principles of scientificity, comprehensiveness, representativeness, and applicability of the PSA Index System, and through consulting literature and combining with other scholars’ research on urban rail transit satisfaction, cluster analysis and factor analysis were used to select representative, independent, and easily distinguishable urban rail transit passenger satisfaction evaluation indicators, and an evaluation index system was constructed. The passenger satisfaction of metro was regarded as the first-level index, and safety, reliability, convenience, comfort, and caring were taken as second-level indicators. These five dimensions are expanded to form the three-level indicators with 39 specific indicators. The specific PSA Index System of urban rail transit is shown in
Table 1 for the later data processing summary.
3. Questionnaire and Verification
According to the established PSA Index System, the satisfaction questionnaire is designed as two parts: passenger basic information and satisfaction assessment. The passenger basic information includes age, gender, education, monthly income, occupation, frequency of metro ride, and whether they have a private car. Satisfaction assessment includes five dimensions: safety, reliability, convenience, comfort, and caring. It is expanded to form a three-level index with 39 specific evaluation indicators, which also created the questions on the questionnaire. The questionnaire adopts a Likert five-dimension scale; the passengers take their own feelings as judgment, and satisfaction is expressed by scoring each index.
The questionnaire is conducted in two ways: field investigation and online investigation. After screening and training investigators, field investigators form a postgraduate-oriented team with undergraduate students as supplements. From 1 October to 3 October 2023 (statutory holidays), 8 to 12 October (working days), and 14 to 15 October (normal weekends), a total of 4975 questionnaires are obtained through these 10 days of field investigations and online investigations. The online investigation adopts the way of issuing questionnaires on professional survey websites, which are filled out by the users who are confirmed to be passengers of the Qingdao rail transit line by setting up pre-questions. Through online investigation, 1558 questionnaires are collected. To ensure the quality of the questionnaire, the on-site random questionnaires and online questionnaires are screened individually, and the missing responses and other incomplete questionnaires are screened and eliminated. The number of valid questionnaires from the offline surveys is 4827, while the number of valid questionnaires from the online surveys is 1550. The total number of valid questionnaires was 6340.
The reliability and validity of the valid questionnaire are analyzed by SPSS24.0 statistical software. It should be noted that the PSA Index System of metros is a comprehensive assessment system with multi-level indicators. Therefore, the reliability analysis should be carried out in all dimensions, and the whole assessment system should not be analyzed directly. Cronbach’s Alpha is used to test the credibility of the data, evaluate the correlation between multiple satisfaction indicators, and verify the consistency and stability of the results. When the alpha coefficient is greater than or equal to 0.9, the intrinsic reliability of the questionnaire is extremely high; when the alpha coefficient is between 0.8 and 0.9, the intrinsic reliability of the questionnaire is acceptable; when the alpha coefficient is greater than or equal to 0.7 and less than 0.8, the questionnaire has some design problems, but it still has some reference value; and when the alpha coefficient is less than 0.7, there are many problems in the design of the questionnaire and revising the questions or increasing or decreasing the number of questions should be considered.
Cronbach’s Alpha coefficient is the most commonly used reliability coefficient. The formula for calculating this coefficient is as follows:
where
is the reliability coefficient,
is the total number of items assessed in the scale,
is the intratable variance of the score of the
ith item, and
is the variance of the total number of items.
Using SPSS24.0 software and Alpha model, the Cronbach’s Alpha values of all dimension data are obtained. The Alpha values of all dimensions are greater than 0.8, and the overall Alpha values are close to 1, which indicates the questionnaire is very reliable.
In terms of the validity test, KMO and Bartlett sphericity tests are commonly used before conducting factor analysis to determine whether survey data are suitable for factor analysis: KMO values can test whether there is partial correlation between various evaluation indicators; the Bartlett sphericity test can check the independence between evaluation indicators and further determine the correlation between evaluation indicators. KMO test and Bartlett’s test of sphericity are performed on the assessment index system; KMO value is 0.968 and significance probability p < 0.01, which is very suitable for factor analysis. Generally speaking, when the degree of commonality is greater than 0.4, the common factor can well explain the assessment index. The results show that the commonality of each index is greater than 0.7, indicating that each assessment index has a significant impact on passenger satisfaction, and the questionnaire is very valid and reliable.
4. Passenger Basic Information
Passengers’ basic information includes age, gender, education, monthly income, occupation, frequency of travel, and whether they have a private car. Through statistical analysis of the questionnaire results, the basic information of the passengers is shown in
Table 2.
(1) Gender distribution: Among the surveyed passengers, there were 3401 male passengers, accounting for 53.6%, and 2939 female passengers, accounting for 46.4%, which is a reasonable ratio between men and women.
(2) Age distribution: Among the surveyed passengers, the largest proportion of passengers aged 34 and below was 3659, accounting for 57.7%, while the proportion of survey respondents aged 55–59 and 60 and above was smaller, at 4.8% and 6.2%, respectively. The passengers were mainly young people and middle-aged people, which is a reasonable distribution of age from the perspective of proportion.
(3) Income distribution: Among the surveyed passengers, the proportion of those with a monthly income of 4000–5999 yuan was the highest, and the proportion of those with a monthly income of 6000–7999 yuan was the second highest, at 32.3% and 23.4%, respectively. The proportion of monthly income above 10,000 yuan was less, which shows that with the increase in income, the proportion of passengers who choose to travel by subway gradually decreases, and the mode of travel is more demanding.
(4) With or without a private car: Among the passengers surveyed, the number of passengers with a private car is 2714, accounting for 42.8%, and the number of passengers without a private car is 3626, accounting for 57.2%. In the subway travel passengers, nearly half of the people have their own cars, indicating that ground transportation is becoming increasingly congested, more convenient and efficient. The attraction of the subway to people with cars is greater.
(5) Distribution of education: Most of the passengers who participated in the questionnaire survey had an education level of a bachelor’s degree or above, accounting for 78.1%, while those with junior high school education or below accounted for only 5.7%, which shows that the overall education level of the respondents is relatively high.
(6) Occupation distribution: Among the passengers who participated in the questionnaire survey, the proportion of corporate employees was the highest, accounting for 46.8%, and their dependence on the subway was higher, and subway travel could effectively save their commuting time. The proportion of other occupations was small, and there is not much difference in the proportion of each occupation.
(7) Frequency distribution: Among the surveyed passengers, the proportion of those who take the subway more than three times a week was the largest, as high as 44.1%, and it can be seen from the proportion of each travel frequency that there are more medium and high-frequency passengers in terms of travel frequency.
5. Passenger Satisfaction Assessment (PSA)
There are many methods to assess passenger satisfaction, such as Principal Component Analysis, fuzzy comprehensive evaluation, Structural Equation Method, etc. The advantage of fuzzy comprehensive evaluation compared to other methods is that the results appear in the form of vectors, rather than a specific numerical point, which can accurately reflect the fuzzy situation of things themselves. It is suitable for problems with a moderate number of alternative solutions and standards [
19] and has a better evaluation effect on complex problems with multiple factors and levels [
20]. The comprehensive evaluation set is a fuzzy evaluation vector in fuzzy comprehensive evaluation, which can reflect the information of the membership degree of each evaluation level of the evaluated object in numerical form. This study uses the method of fuzzy comprehensive evaluation to evaluate passenger satisfaction.
5.1. Establishing a Comprehensive Assessment
Firstly, establish an assessment index set U = {U1, U2, …, Un}, where Ui is the indicator i in the PSA Index System, i = 1, 2, …, n; Ui = {ui1, ui2, …, uin}, uij is the indicator j under the i assessment index system of the PSA Index System, j = 1, 2, …, L. For Qingdao Metro passenger satisfaction, there are five second-level assessment indicators: U = {U1, U2, …, U5}, U1, U2, …, U5 consists of third-level indicators. Then, establish the assessment corpus: V = {V1, V2, …, Vm}. For the assessment set V, there are five levels: V = {V1, V2, V3, V4, V5} = {very dissatisfied, dissatisfied, generally satisfied, very satisfied} = {1, 2, 3, 4, 5}.
5.2. Calculation of Index Weight
In the PSA Index System urban rail transit, changes in indicators at each level will have different degrees of impact on passenger satisfaction. Therefore, in the PSA Index System, determining the weight of the assessment index is a key link. The commonly used methods to determine the weight are Delphi method, AHP method, factor analysis method, etc. This study uses the AHP method to determine the weight of each assessment index of passenger satisfaction. The AHP method, proposed by T. T. SAATY, a famous American operational research scientist, can be used to deal with complex problems with multi-objective, multi-criteria, multi-factor, and multi-level. It is a practical and effective method. The specific steps are as follows:
a. Construct the judgment matrix A; compare the Indicator factors in the index system, and assign their relative importance according to the judgment criteria to form the elements of the judgment matrix.
b. Compute the product
Ti of each row element of the judgment matrix:
For the
n-th power of
Ti, the weight
Wi of each row is obtained, and the weight
wi of each element is normalized:
c. In order to test whether the judgment matrix is usable, the consistency test of the judgment matrix should be carried out:
Among them,
CI is the consistency coefficient, and
λmax is the maximum eigenvalue of the judgment matrix. Then, according to the average random consistency index
RI, the consistency ratio
CR =
CI/
RI is calculated. When
CR < 0.1, the consistency of judgement matrix is acceptable. Otherwise, the elements of the judgment matrix should be adjusted until they pass the test. The weight distribution set can be determined by calculation
W = {
w1,
w2,
……,
wn}, and
Ui’s weight on
U is
wi,
;
wi = {
wi1,
wi2,
……,
wiL} and
Uij’ weight on
Ui is
wij,
. After calculation, the weight of each indicator in the PSA Index System of urban rail transit is shown in
Table 3.
5.3. Establishing a Fuzzy Judgment Matrix and Making a Fuzzy Comprehensive Assessment
According to the assessment level, the membership vector
rij = (
rij1,
rij2, …,
rijs) of the assessment set V can be calculated. As
rijh =
Vijh/n, n is the total number of passengers surveyed,
Vijh is the number of passengers whose evaluation index
Uij is
Vm, h = 1, 2,…, m. A fuzzy assessment matrix can be established as follows:
According to the fuzzy comprehensive evaluation formula B = W × R, B is the membership vector of U to V. The satisfaction value E is obtained by multiplying B with assessment level V = {V1, V2, V3, V4, V5}T.
The fuzzy comprehensive evaluation method is used to evaluate the passenger satisfaction. Firstly, the survey data are sorted out to obtain the fuzzy comprehensive evaluation set of three-level indicators. Then, the fuzzy comprehensive evaluation vectors of “safety”, “reliability”, “convenience”, “comfort”, and “caring” are calculated:
B1 = (0 0.0143 0.0367 0.1868 0.7599),
B2 = (0 0.0081 0.0385 0.1605 0.7899),
B3 = (0 0.0026 0.0238 0.1915 0.7822),
B4 = (0 0.0041 0.0291 0.1750 0.7920),
B5 = (0 0.0034 0.0214 0.1909 0.7843), and the comprehensive assessment set of second-level indicators is obtained. The second-level indicator fuzzy assessment set is transformed into the second-level assessment matrix, and its comprehensive assessment value is calculated:
Therefore, the degree of passenger satisfaction in Qingdao Metro can be calculated: E = BVT = (0 0.0073 0.0310 0.1804 0.7801)[1 2 3 4 5]T = 4.7297.
B is the membership vector of the assessment index set to the assessment set, which is the final result of the fuzzy comprehensive assessment. The maximum membership degree is 0.7801, and the corresponding assessment level is “very satisfied”. According to the formula, the passenger satisfaction value of Qingdao Metro is 4.7297, which indicates that most of the passengers surveyed are “very satisfied”. In order to display the satisfaction of Qingdao Metro more intuitively, it is converted into a percentage system, and the passenger satisfaction value of Qingdao Metro is 94.594 after conversion.
6. Investigation Results and Analysis
In order to know whether the socio-economic background of individual passengers has an impact on the satisfaction of urban rail transit in Qingdao, combined with the results of the questionnaire, statistical methods are used to analyze the relationship between gender, age, education, occupation, income, and passenger satisfaction in different dimensions.
Independent sample T test and one-way ANOVA are used to test the relationship between gender, age, and other variables (independent variables) and passenger satisfaction (dependent variables). Set the significance level to 0.05 and 0.01. If the probability p value is greater than the significance level, then accept the original hypothesis; the investigation result difference is not significant. If the probability p value is less than the significance level, reject the original hypothesis; the investigation result is significant. That is, when p < 0.01, reject the original hypothesis: the difference between the two variables is highly significant; when 0.01 ≤ p < 0.05, reject the original hypothesis: there is a significant difference between the two variables; when p ≥ 0.05, accept the original hypothesis: there is no significant difference between the two variables. When Variance Analysis (ANOVA) shows that the differences caused by various factors are significant, the Tukey method is used to find out the specific factors leading to the differences.
6.1. T Test Analysis
6.1.1. The Influence of Gender on Satisfaction
According to the fuzzy comprehensive assessment method introduced earlier, the satisfaction values of men and women with safety, reliability, convenience, comfort, and care are calculated as shown in
Figure 1. It can be seen that in terms of safety, reliability, convenience, and comfort, female satisfaction is higher than that of male, but in the caring aspect, the female score is lower than that of male. From the point of view of the score, there are some differences between men and women.
In order to obtain a more accurate conclusion, the independent sample
T test of gender and passenger satisfaction is carried out in SPSS24.0 software, and the results are shown in
Table 4. In terms of gender and satisfaction, the
p values of safety, reliability, convenience, and comfort are all above 0.05, that is, there is no significant difference. It shows that the overall satisfaction of urban rail transit travel is high, and the safety, comfort, punctuality, and convenience characteristics of the subway have been fully reflected. In terms of caring, the two
p values are less than 0.05, and there is a significant difference, that is, the satisfaction of female passengers is lower than that of male passengers, indicating that compared with male passengers, female passengers pay more attention to the details of life and have higher requirements for travel quality.
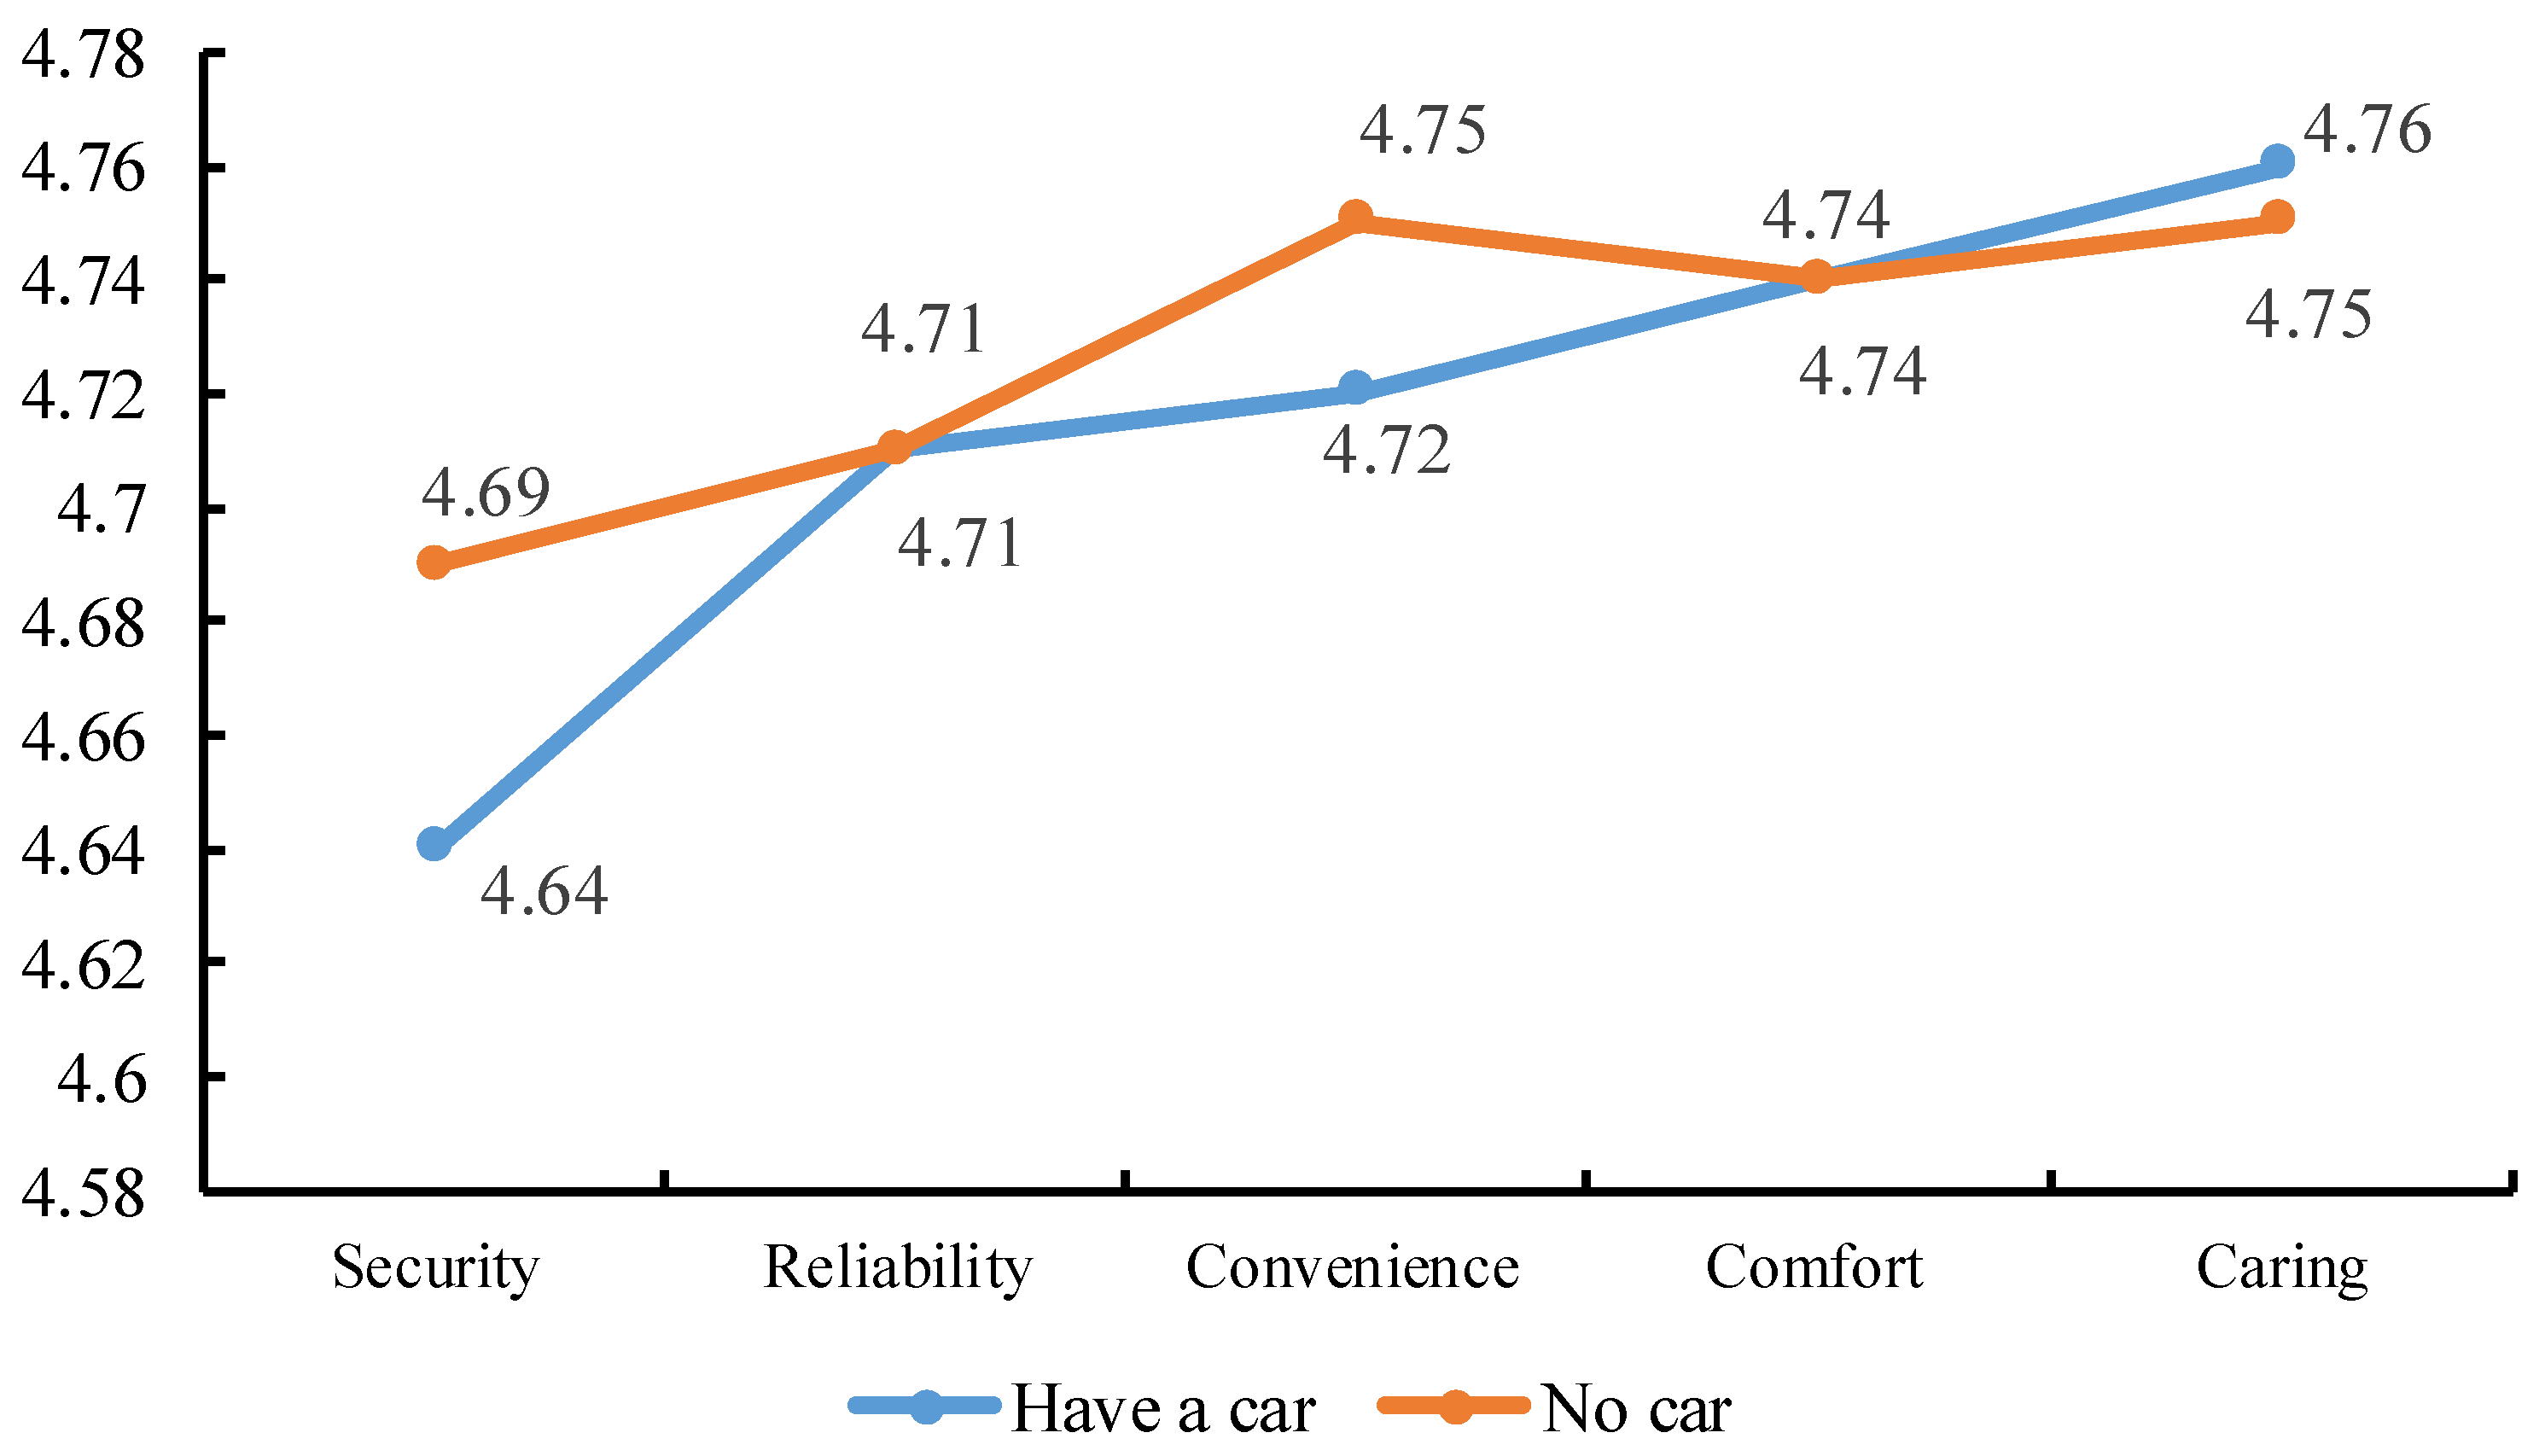
6.1.2. Whether There Is a Car or Not Has an Impact on Satisfaction
By using the fuzzy comprehensive assessment method, the satisfaction values of safety, reliability, convenience, comfort, and caring of cars are calculated as shown in
Figure 2. It can be seen that in terms of reliability and comfort, the two scores are the same; in the other three aspects, the difference is not significant.
Using SPSS24.0 software, an independent sample T test of whether there are cars and passenger satisfaction is carried out, the p-values of safety, reliability, convenience, comfort, and caring are all above 0.05, that is, there is no significant difference. Therefore, it can be determined that whether a family has a private car has a minimal impact on the travel satisfaction of urban rail transit passengers.
6.2. One-Way ANOVA
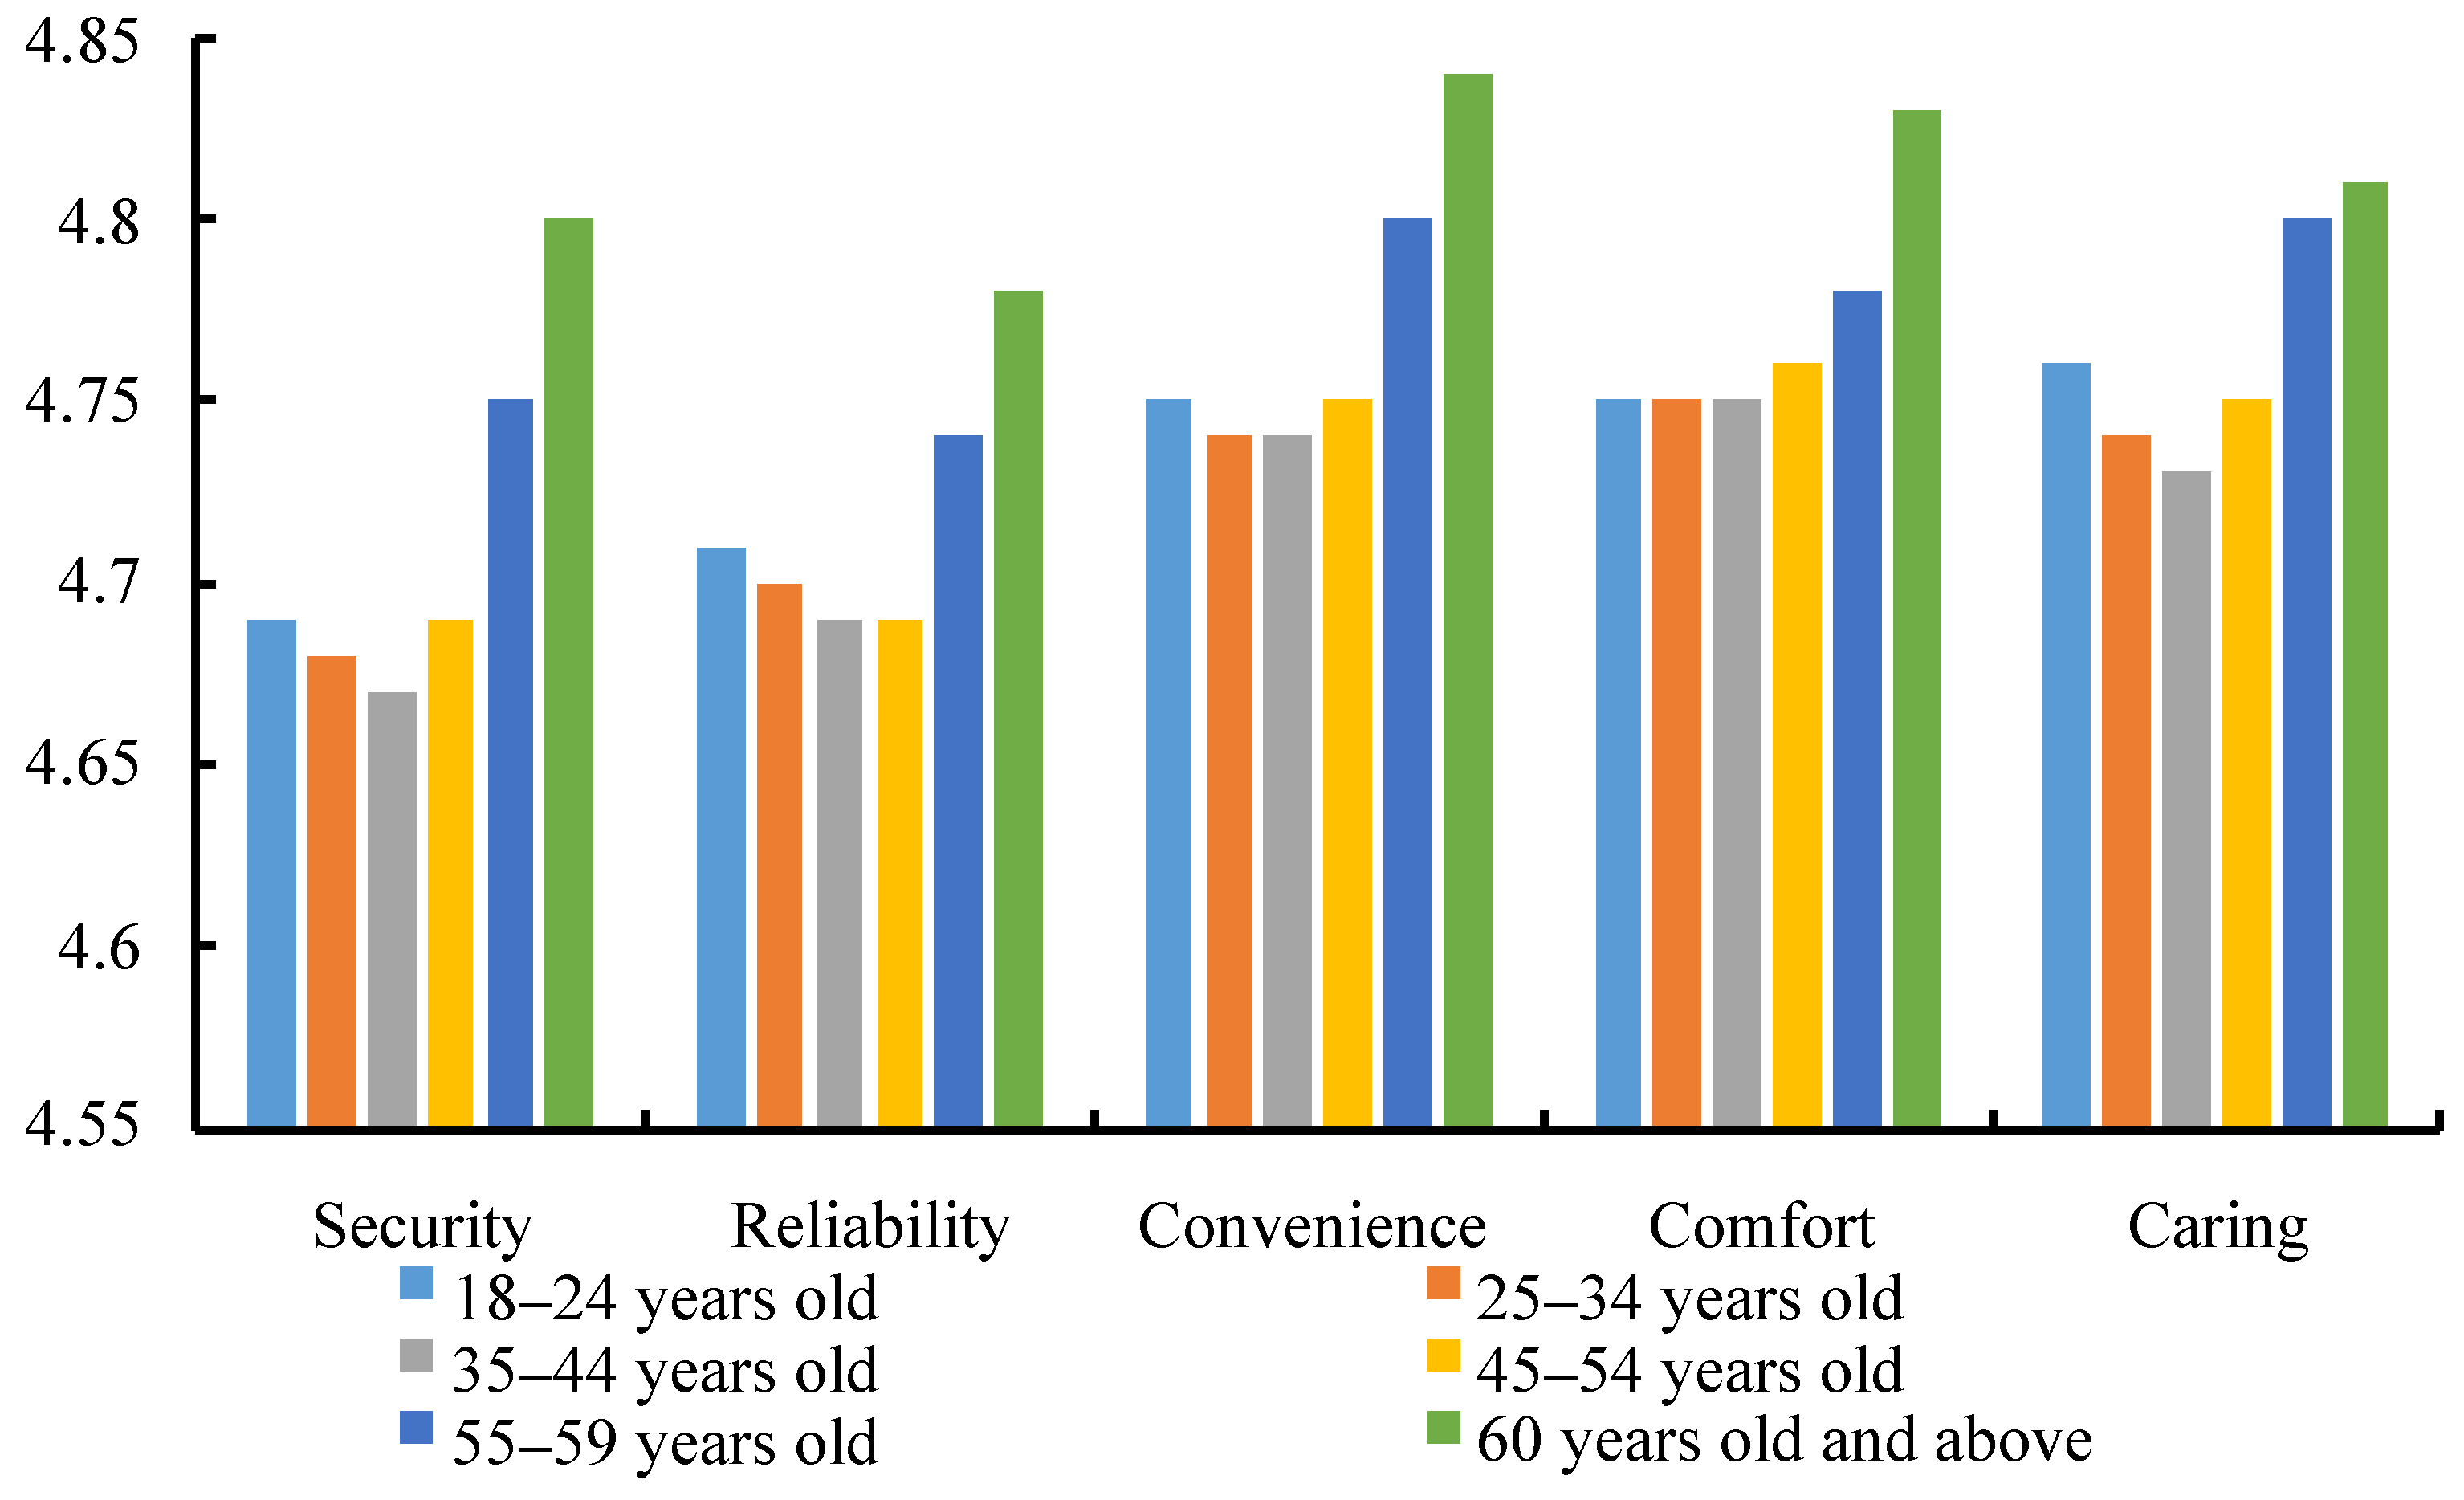
6.2.1. Variance Analysis (ANOVA) of Passenger Age and Satisfaction
In the survey, the age groups of passengers are divided into 18–24 years old, 25–34 years old, 35–44 years old, 45–54 years old, 55–59 years old, and 60 years old and above. Satisfaction values of safety, reliability, convenience, comfort, and care of each age group are calculated, respectively, as shown in
Figure 3.
Through the variance analysis (ANOVA) of age and satisfaction data, it is found that there are significant differences in safety, reliability, convenience, comfort, and caring. Using the Tukey method for post-test, combined with the satisfaction of all age groups calculated in
Figure 3, it is found that the satisfaction of passengers over 55 years old is the highest, that of passengers aged 18 to 34 is the second, and that of passengers aged 35 to 44 is the lowest.
As shown in
Table 5, the main reason is that when the elderly take the subway, which is faster and better served than the ground bus, it is easier to achieve a higher sense of satisfaction; at the same time, due to a series of preferential policies for them, the satisfaction is the highest.
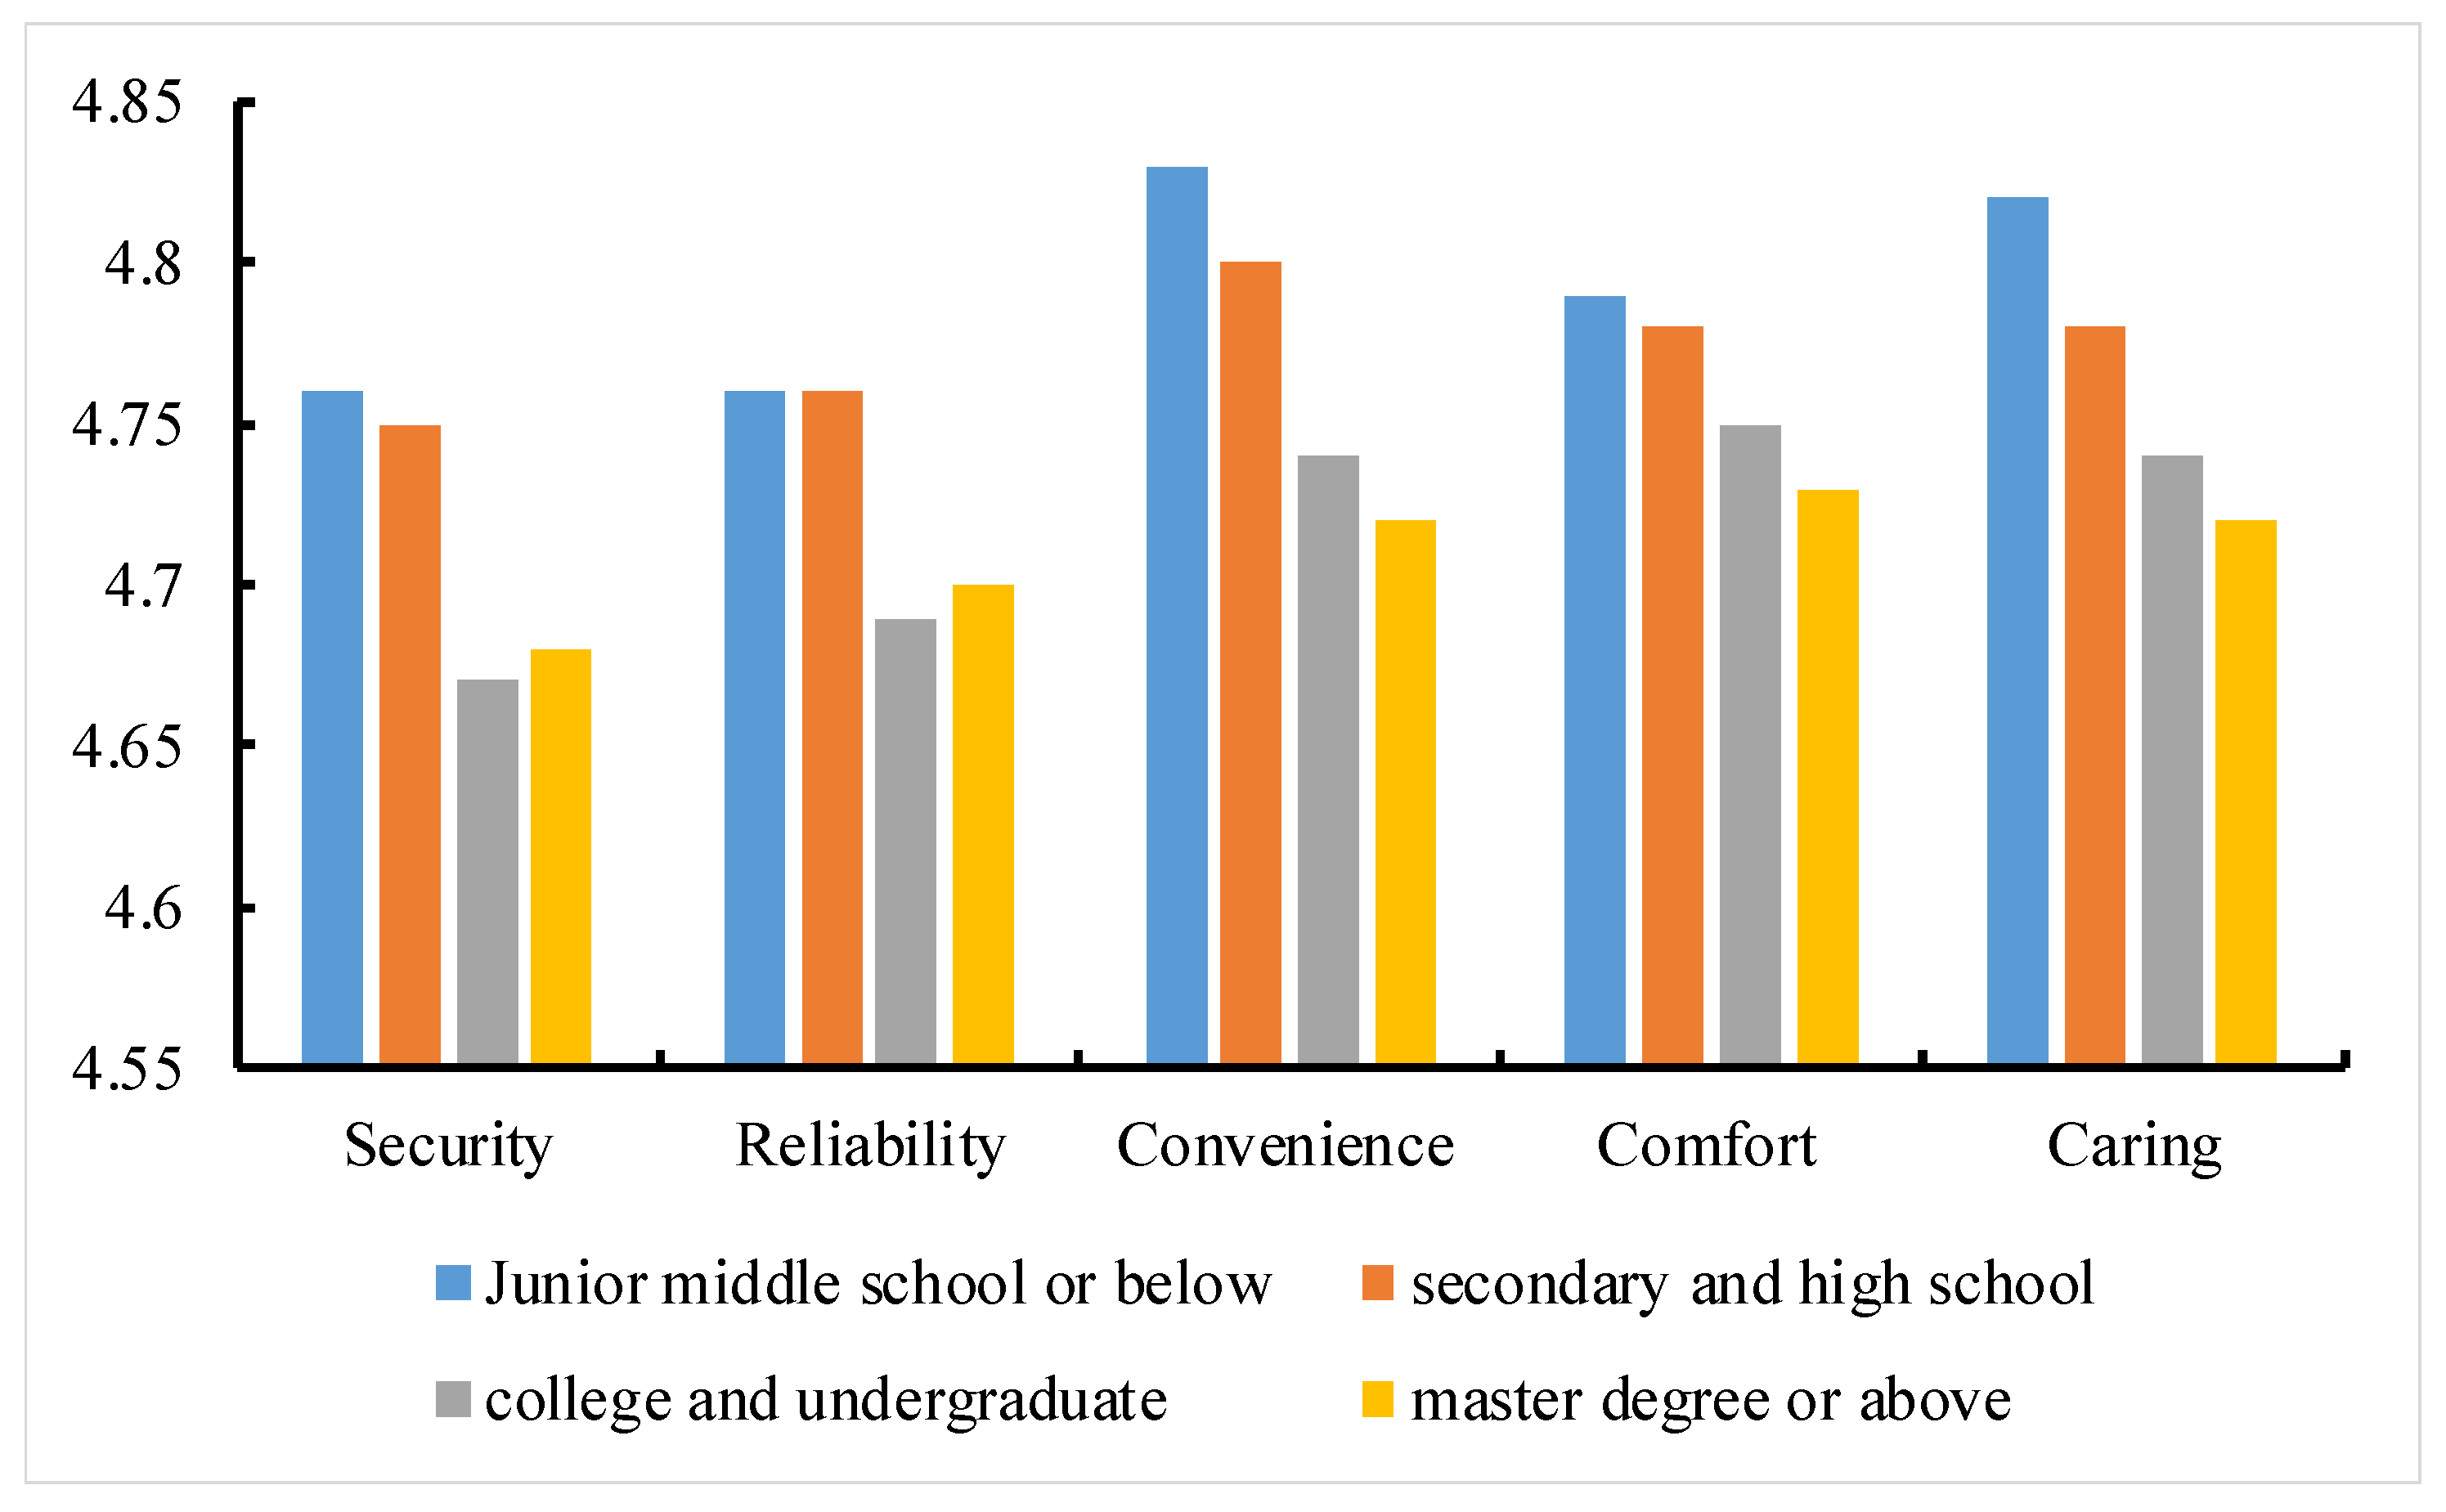
6.2.2. Variance Analysis (ANOVA) of Passenger Education and Satisfaction
In the survey, the passengers’ educational background is divided into four levels: junior middle school or below, secondary and high school, college and undergraduate, master degree or above. The satisfaction values of safety, reliability, convenience, comfort, and caring of different educational backgrounds are calculated by using the method of fuzzy comprehensive assessment as shown in
Figure 4.
The result of one-way ANOVA shows that there are no significant differences in reliability satisfaction among passengers with different academic qualifications, but there are significant differences in safety, convenience, comfort, and caring, as shown in
Table 6. The post-test is carried out by the Tukey method, and combined with the satisfaction score analysis calculated in
Figure 4, it is found that the satisfaction score of master degree or above is the lowest, and the satisfaction score of junior middle school or below is the highest. From the results of data analysis, the relationship between passenger education and satisfaction is that the higher the degree, the lower the satisfaction. The reason is that compared with passengers with relatively low academic qualifications, the highly educated groups have a wider knowledge reserve, richer experience, and higher requirements for the details of the travel process, such as guidance facilities, staff appearance, attitude, and so on; therefore, they pay more attention to travel quality.
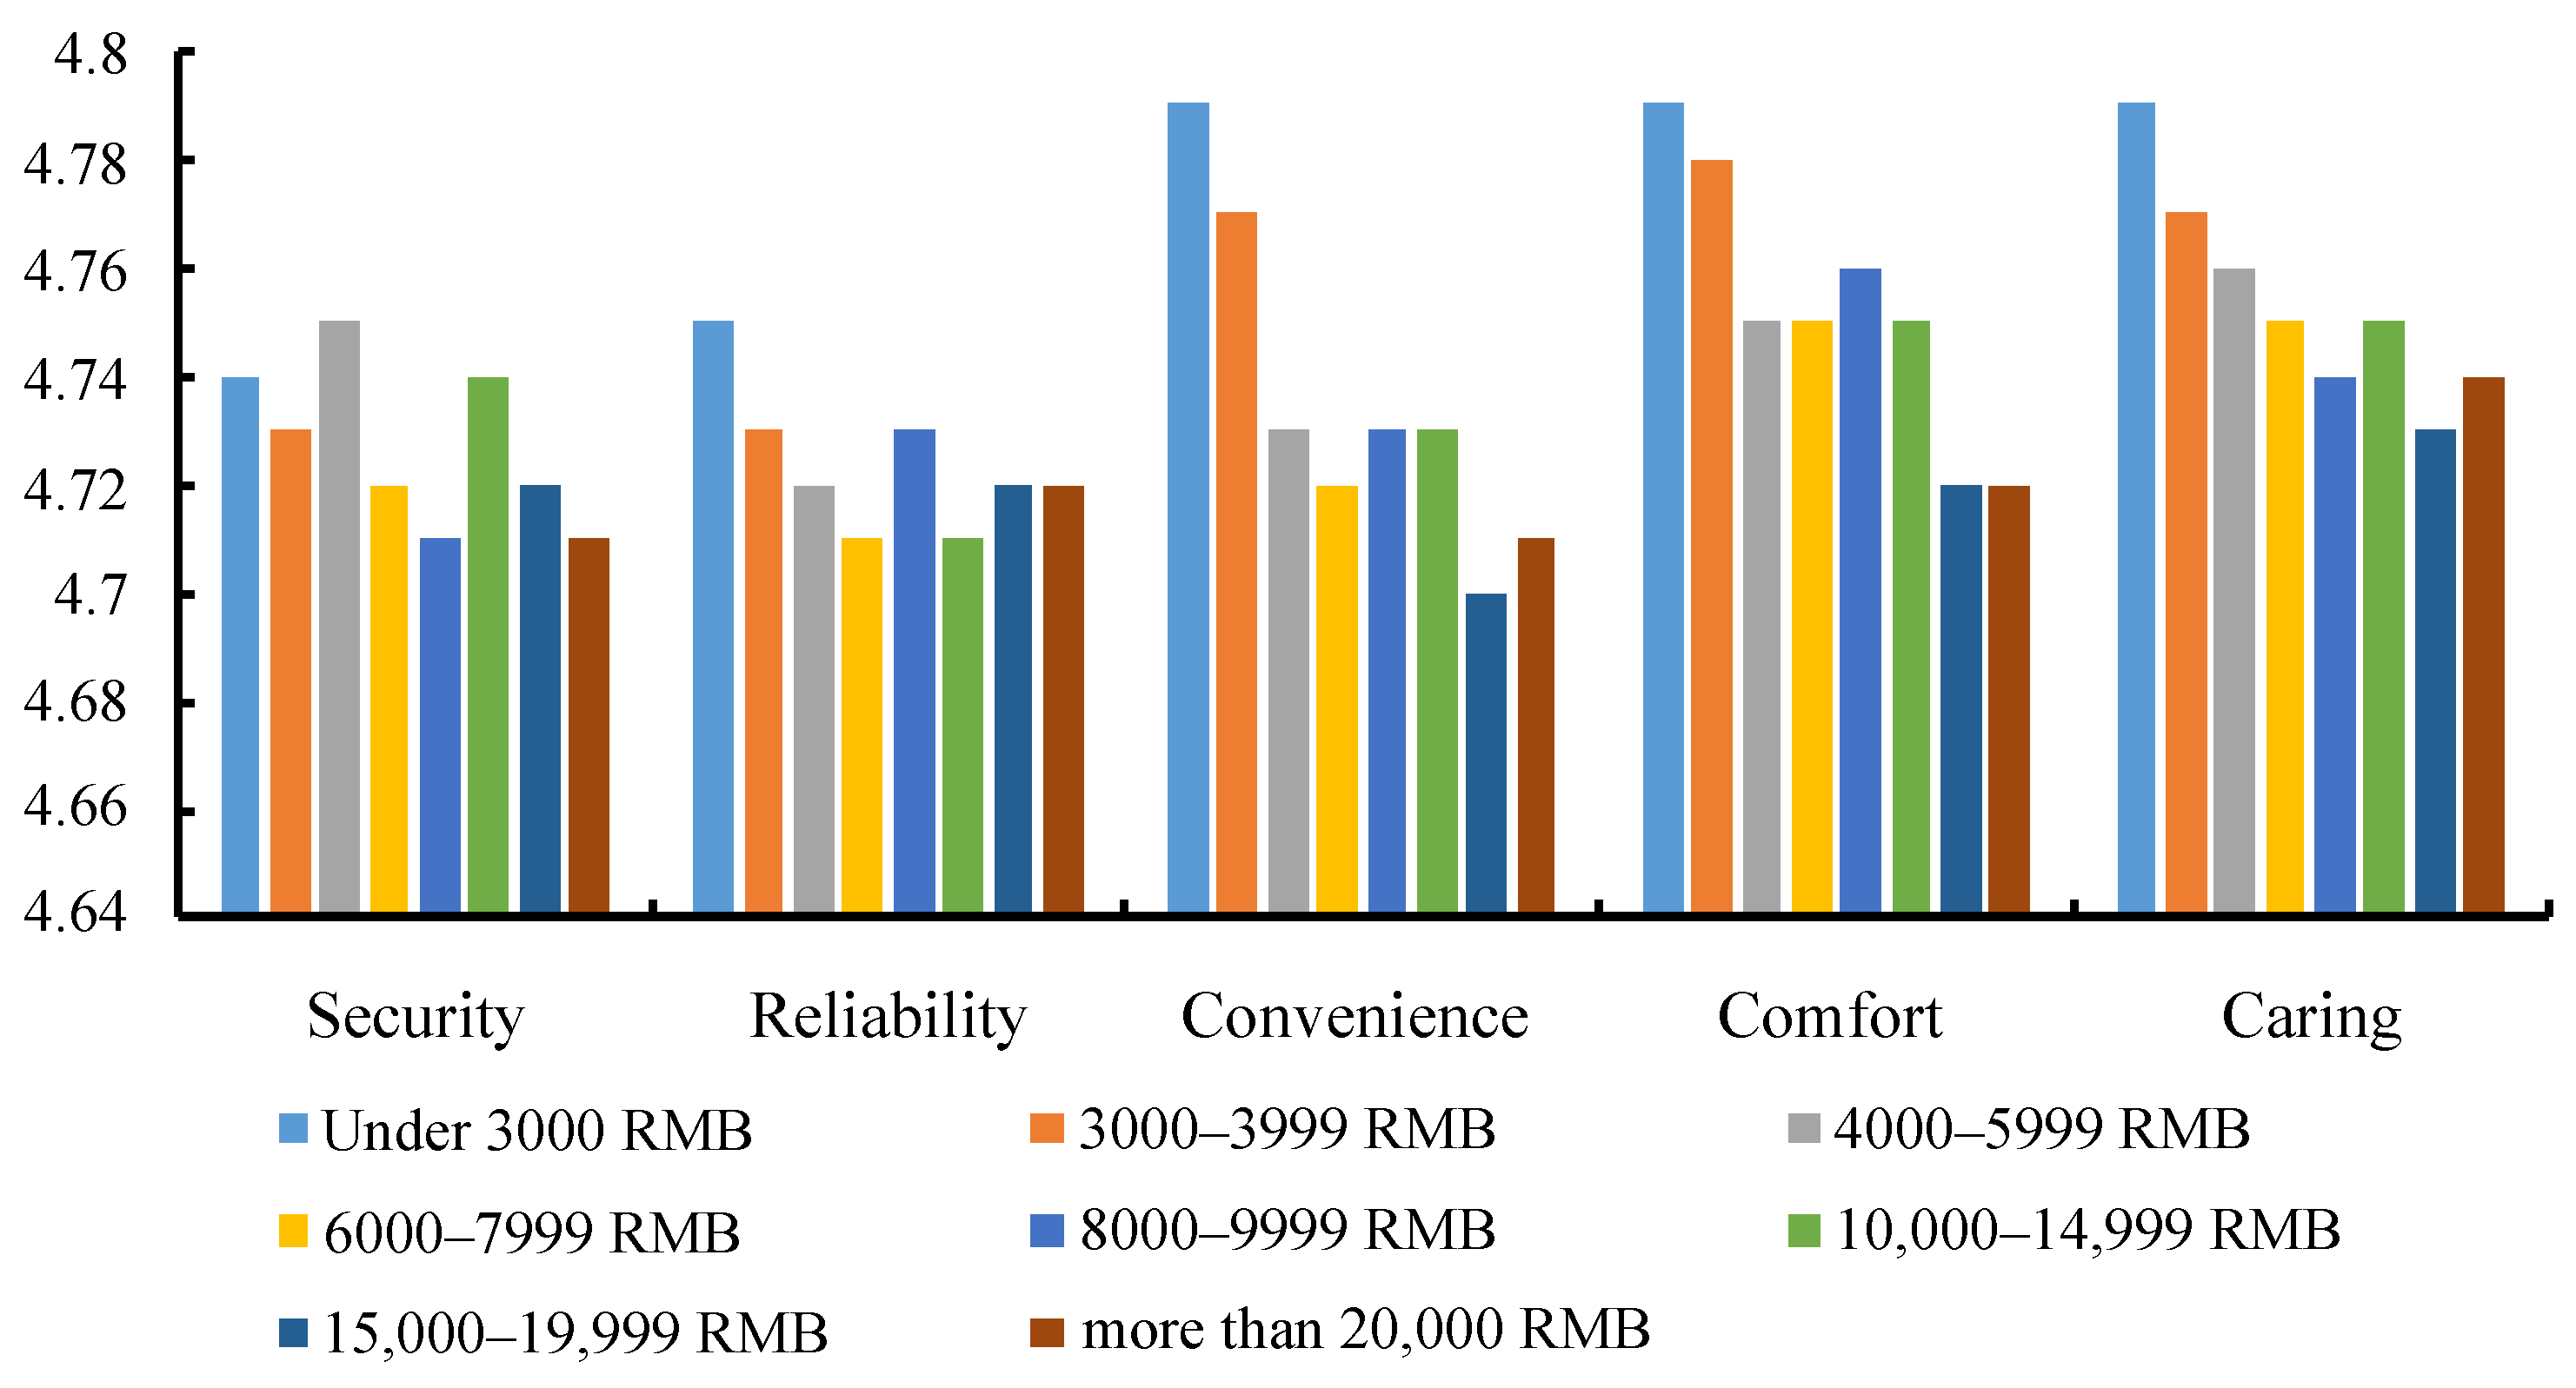
6.2.3. Variance Analysis (ANOVA) of Passenger Monthly Income and Satisfaction
Using the fuzzy comprehensive assessment method, the satisfaction values of passengers with different income levels for safety, reliability, convenience, comfort, and caring are calculated as shown in
Figure 5. There are some differences in the satisfaction of different income groups; from the graph, the satisfaction of high-income passengers is lower than that of low-income passengers. In order to obtain a more accurate conclusion, the monthly income and satisfaction of passengers are analyzed by one-way ANOVA.
The result of one-way ANOVA shows that there are no significant differences in safety and reliability among passengers with different monthly income, but there are significant differences in convenience, comfort, and caring, as shown in
Table 7. The post-test is carried out by the Tukey method, and combined with the passenger satisfaction score of different income calculated in
Figure 5, it is found that the passenger satisfaction with monthly income less than 3000 RMB is the highest. The passenger satisfaction with a monthly income of more than 15,000 RMB is the lowest, that is, passenger satisfaction decreases with the increase in passengers’ monthly income. The main reason for this difference is that among the travel modes chosen by low-income passengers, the subway has a better experience of travel than other modes, such as buses, so the satisfaction is higher. With the increase in income, the demand for travel is also increased, they pursue more convenient, more comfortable, and more high-quality means of transportation, so the satisfaction of high-income passengers is also reduced.
6.2.4. Variance Analysis (ANOVA) of Passenger Occupation and Satisfaction
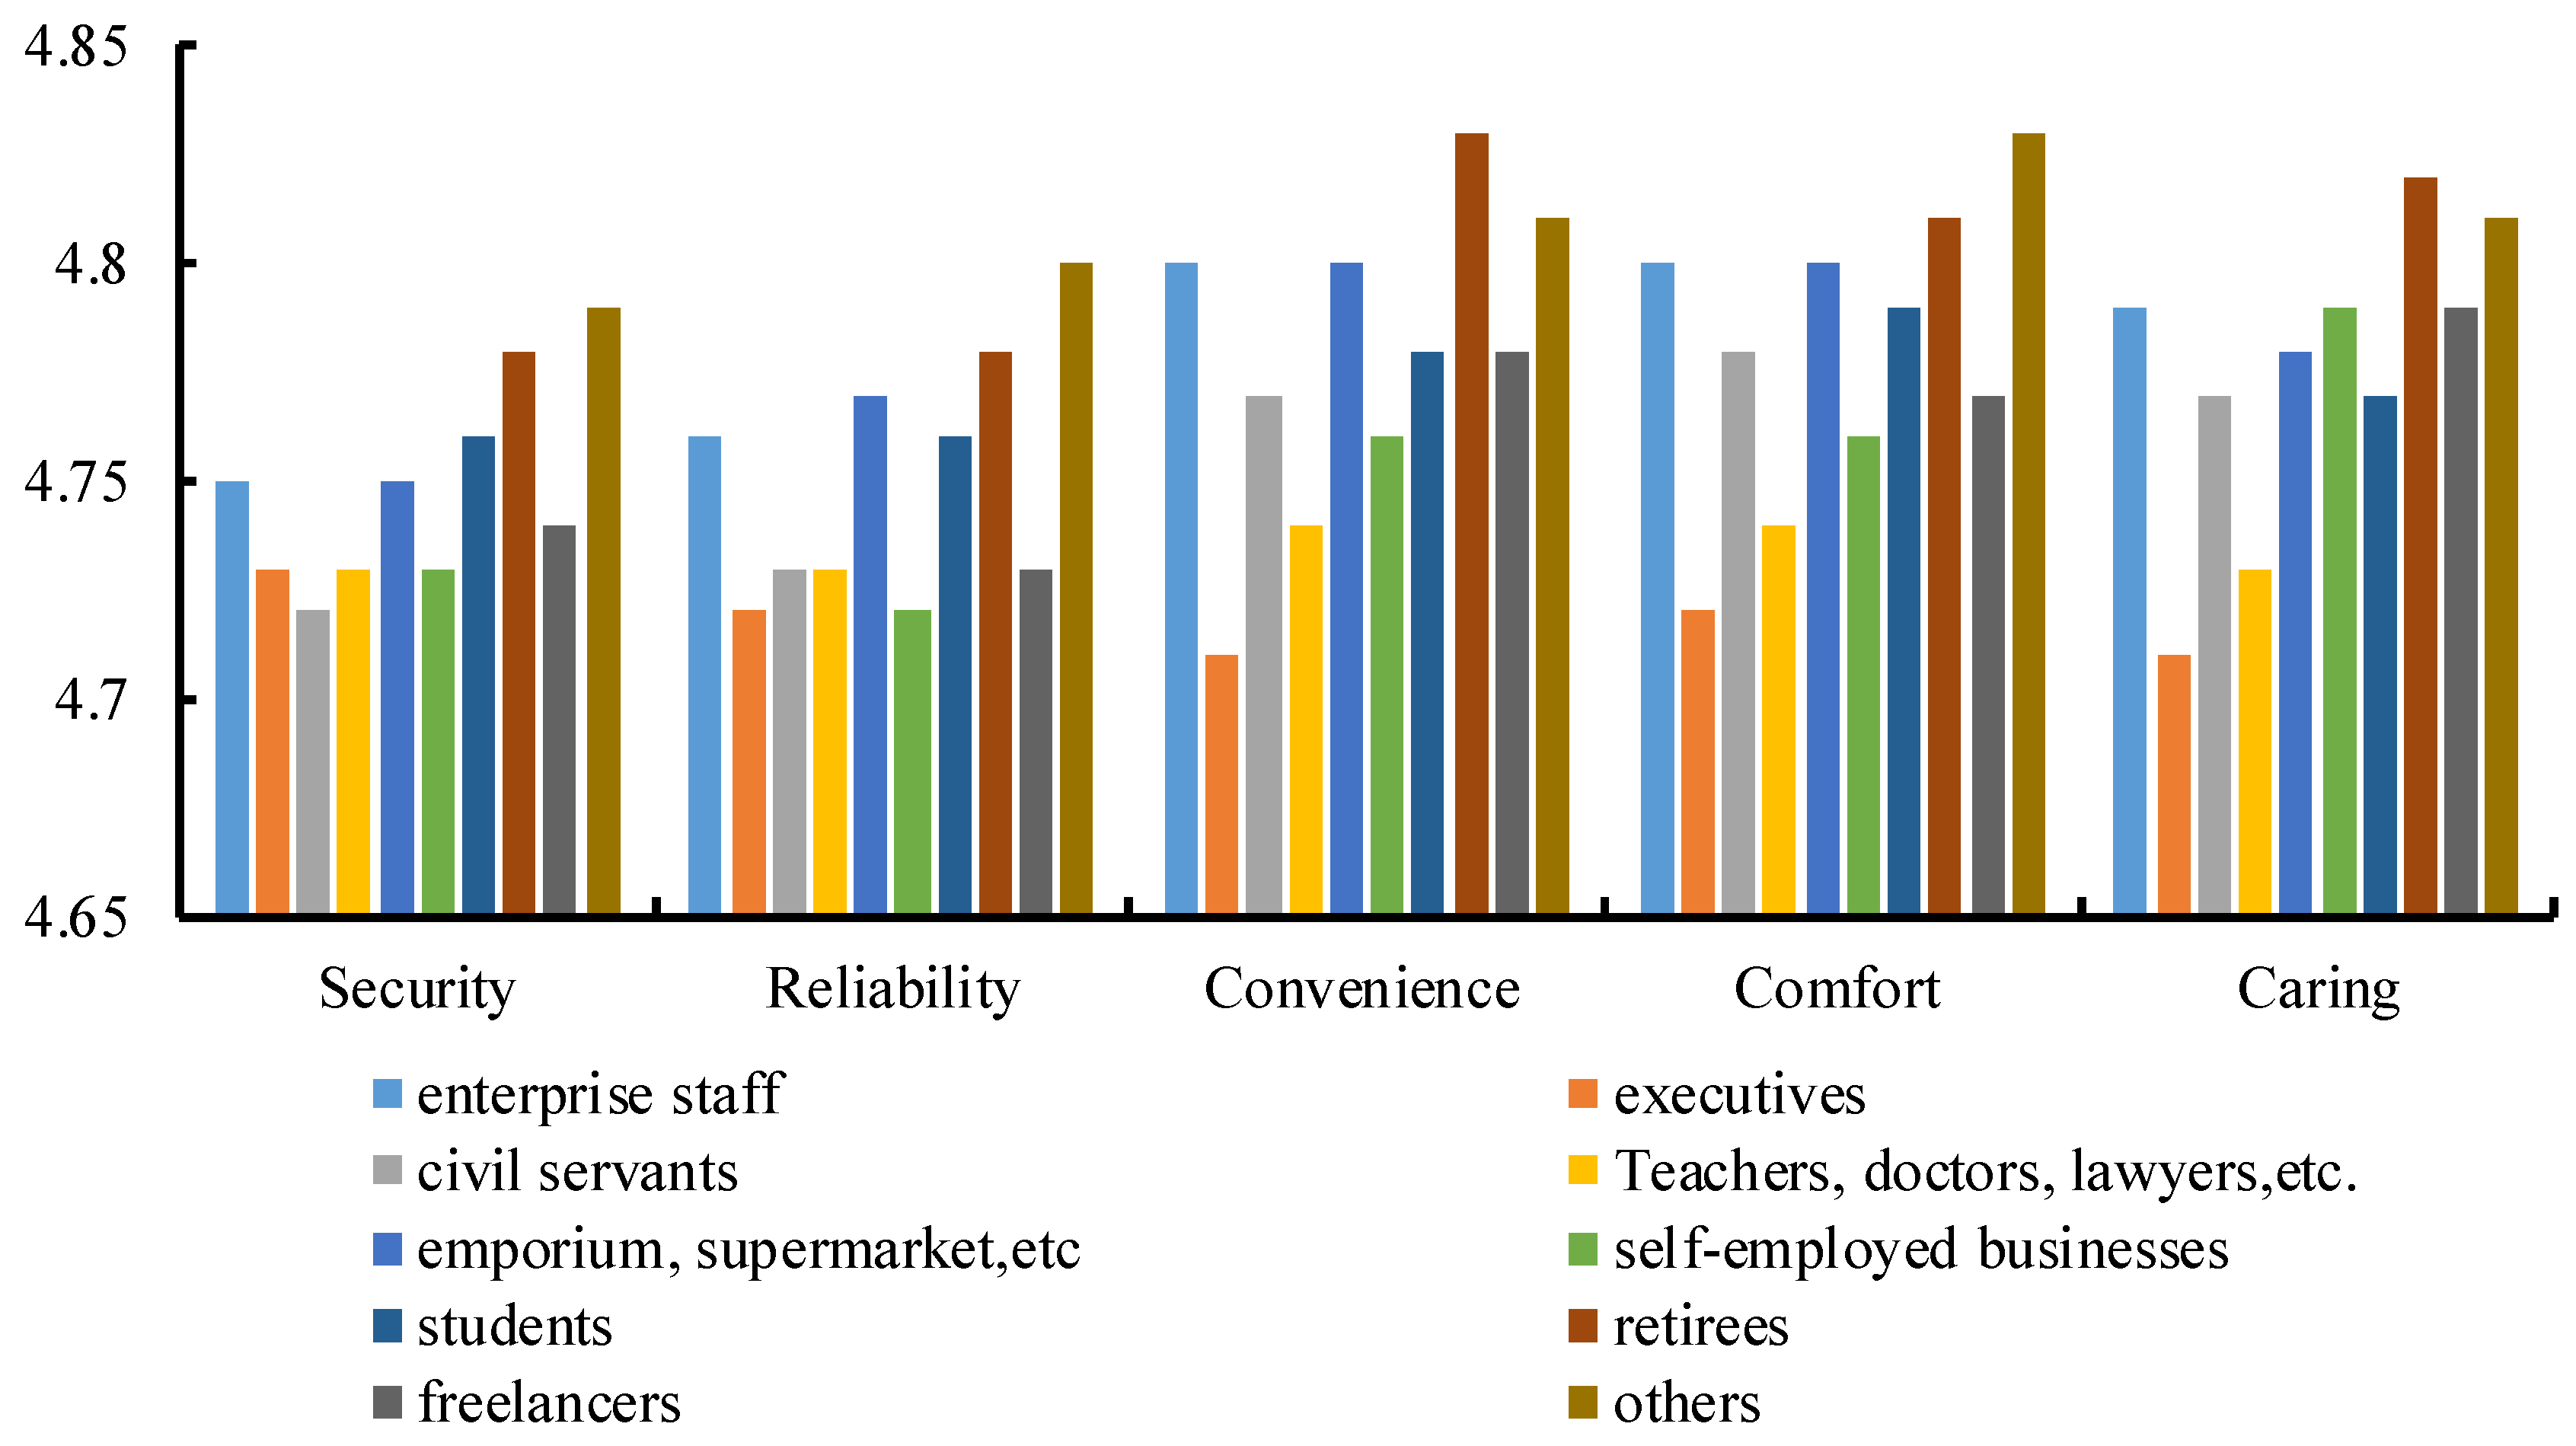
In the survey, all passenger occupations are divided into enterprise staff, executives, civil servants, doctors, lawyers, cultural and sports personnel, scientific research personnel (public institution staff) emporium, supermarket and hotel attendants, self-employed businesses, students, retirees, freelancers, and others. The satisfaction values of safety, reliability, convenience, comfort, and caring of each occupation are calculated by using the fuzzy comprehensive assessment method, as shown in
Figure 6.
Through the variance analysis (ANOVA) of occupation and satisfaction data, it is found that there is no significant difference in reliability, but there are significant differences in safety, convenience, comfort, and caring among different occupations, as shown in
Table 8. The post-test is carried out by the Tukey method, and combined with the satisfaction of all age groups calculated in
Figure 6, it is found that retirees and others’ satisfaction are the highest; the satisfaction of enterprise staff and emporium, supermarket and hotel attendants is relatively high, and executives, civil servants, teachers, doctors, lawyers, and sports and scientific research personnel’s satisfaction is the lowest.
Through the analysis, it can be found that the retirees are generally older, and their high satisfaction is consistent with the aforementioned test results of the passenger age. In general, compared with executives, doctors, lawyers, and other professions, the income of enterprise staff and service personnel is lower, and their relatively high satisfaction is consistent with the results of the previous monthly income test. Executives, teachers, doctors, lawyers, and other professions belong to high academic qualifications and high-income groups, and their low satisfaction is consistent with the above-mentioned academic qualifications and monthly income test results.
7. Conclusions
7.1. Conclusions
This study takes into account the personal characteristics of passengers and fully considers the comprehensiveness and scalability of the evaluation. The evaluation indicators used have strong objectivity and can be dynamically adjusted and changed with the actual situation of passengers over time, making them more targeted. Through the questionnaire survey of passengers in Qingdao rail transit in China, this study calculates the passenger satisfaction by using the method of fuzzy comprehensive assessment and performs cross-analyses on the relationship between different genders, ages, whether they have a private car, educational backgrounds, monthly incomes, occupations, and satisfaction. The following conclusions are drawn:
(1) Through the data processing and calculation of the questionnaire, it is concluded that the passenger satisfaction value of Qingdao Metro is 4.7297, which is converted to 94.594.
The corresponding assessment level is “very satisfied”, indicating that most of the surveyed passengers are “very satisfied” with Qingdao Metro.
(2) There are significant differences in passenger satisfaction in the caring aspect between different genders. Female passengers have higher requirements on travel quality, and caring satisfaction is significantly lower than male passengers.
(3) There is no significant difference in passenger satisfaction between private car-owners and car-free passengers.
(4) There are significant differences in passenger satisfaction in safety, reliability, convenience, comfort, and caring between different ages. Passengers aged over 55 have the highest satisfaction, followed by those aged 18 to 34, and those aged 35 to 44 have the lowest satisfaction.
(5) There is no significant difference in passenger satisfaction in reliability with different educational backgrounds, but there are significant differences in safety, convenience, comfort, and caring. Education is negatively correlated with satisfaction, that is, the higher the education, the lower the satisfaction.
(6) There is no significant difference in passenger satisfaction in safety and reliability between different monthly incomes, but there are significant differences in convenience, comfort, and caring. Passenger satisfaction decreases with the increase in passengers’ monthly income.
(7) There is no significant difference in passenger satisfaction in reliability between different occupations, but there are significant differences in safety, convenience, comfort, and caring. The older retirees’ high satisfaction is consistent with the test results of the passenger age. The low-income enterprise staff and service personnel have relatively high satisfaction, which is consistent with the results of the monthly income test. Executives, teachers, doctors, lawyers, and other professions with high academic qualifications and high-income, their low satisfaction is consistent with the test results of education and monthly income.
7.2. Recommendations
Improving passenger satisfaction is an important prerequisite for achieving efficient operation of urban rail transit. In order to improve the quality of operation, provide passengers with a more satisfactory and comfortable travel experience, and achieve the sustainable development of urban rail transit, this study proposes improvement measures and suggestions for urban rail transit operation enterprises based on the evaluation results of passenger personal characteristics and satisfaction, starting from secondary indicators such as safety, reliability, and convenience.
(1) In terms of safety, emphasis should be placed on training drivers to become more proficient in driving safety, ensuring that passengers arrive at their destination on time and conducting safety checks and necessary work on passenger coaches. Publicity work for consumers should be strengthened and information on traffic safety and travel precautions should be conveyed to them, in order to make passengers more vigilant and take safety precautions when riding. Regular inspection of vehicles and tracks should be conducted to ensure safe travel for passengers. In addition, the operation department should dynamically optimize the boarding process based on the actual situation, including optimizing the train schedule, setting reasonable intervals between trains, and avoiding passenger congestion and stampede caused by transfer.
(2) In terms of reliability, intelligent dispatching is implemented through the use of advanced technology and equipment to predict and estimate passenger flow, minimize train operation delays, enhance equipment maintenance and overhaul, and guarantee the reliability of urban rail transit operations during peak hours.
(3) In terms of convenience, the following can be implemented: formulating a more reasonable rail transit network, improving station accessibility, planning transfer hub structures reasonably, saving passenger transfer time, enhancing wireless communication signals within the station to ensure smooth mobile communication, introducing advanced technologies such as facial recognition and intelligent image recognition to enhance the efficiency of security checks. Furthermore, increasing the quantity of self-service ticket machines and optimizing their placement will reduce passenger wait times for ticket purchases and recharges.
(4) In terms of comfort, it is recommended that the urban rail transit operation management department adopt a differentiated operation strategy with corresponding price discounts for different income groups, such as low peak discounts and average ride environments and a higher price and better riding environment, further strengthen the training of employees, improve their professional knowledge and skills, and enhance the adaptability and communication skills of internal staff when facing public inquiries.
(5) In terms of caring, female passengers pay more attention to the quality of travel compared to male passengers. Therefore, from the perspective of female passengers, “women’s care packages”, maternal and child care products, love raincoats, and other supplies can be introduced at all stations on the entire network, providing more convenience for female passengers to travel.
8. Discussion
People’s intuitive feelings are a complex phenomenon, which is affected by a variety of factors, such as the old and new subway lines, the professional level of staff, subway ticket prices, and so on. Under the same assessment index system, passengers in different cities will have different feelings because of the different opening time and number of lines. By using the comprehensive fuzzy evaluation method, the passenger satisfaction with Qingdao Metro is “very satisfied”, and the overall satisfaction score is 4.73. This indicates that passengers are positive about the urban rail transit services in Qingdao. The survey subjects of this study include local residents of Qingdao. During the survey process, it was found that residents of Qingdao feel proud of the opening and operation of local urban rail transit, and the evaluation results may be influenced by local protective emotions and other factors, resulting in a phenomenon of false high scores. Therefore, there may be differences in the specific conclusions of the study in different cities. As an important embodiment of service level, a scientific and accurate passenger satisfaction assessment will provide an important reference for the development and improvement of urban rail transit. In order to further understand the impact of passengers’ personal characteristics on their satisfaction, researchers can further use a variety of research methods to carry out their study and make a comparative analysis of the conclusions.


