Article

Sector-Level Inter-Provincial Virtual Water Trade in China: Implications for Regional Water Stress

School of Economics and Management, Jiangxi Agricultural University, Nanchang 330045, China
*
Author to whom correspondence should be addressed.
Sustainability 2024, 16(9), 3666; https://doi.org/10.3390/su16093666
Submission received: 25 December 2023 / Revised: 16 April 2024 / Accepted: 19 April 2024 / Published: 27 April 2024

Abstract

:
China faces severe water resource shortages due to the uneven distribution of water resources and ever-increasing water demand driven by rapid industrialization and urbanization. The virtual water trade (VWT) is a potential solution to conserve water resources by transferring water from water-abundant/water-productive regions to water-scarce/less water-productive regions. Based on the inter-provincial input-output model, the provincial VWT of China was estimated at the sectoral level. The relationship of VWT with water resources in 30 provinces was analyzed in relation to the water stress index (WSI). It was found that (1) total inter-provincial VW trade showed a downward trend during the study period, with 363.91 km3 in 2002, 283.72 km3 in 2007, and 285.23 km3 in 2012. Overall, the primary industry dominated the VWT for most provinces. (2) China’s virtual water flowed from the relatively underdeveloped central and western regions to the east with a relatively developed economy from the inter-provincial level. This trend became increasingly prominent. (3) In many instances, VW was transferred from water-poor to water-rich areas. These results imply that China needs to improve its water use efficiency and optimize its regional industrial structure. Additionally, establishing an ecological compensation mechanism is considered a valuable measure for China to alleviate regional water resource pressure.

1. Introduction

Water is an indispensable and strategic asset for ecosystem functions, human survival, and socio-economic development [1]. Globally, water shortages are increasing in severity due to climate change and human production activity [2,3,4]. China, the largest freshwater consumer globally [5], also faces serious water resource shortages due to its ever-increasing water demand driven by rapid industrialization and urbanization [6]. Meanwhile, water endowment distribution is uneven in the country. Generally speaking, Southern China has abundant water resources, while the Northern parts face scarcity [7]. Spatial redistribution is a critical element of Chinese policy on water resources to alleviate uneven water resource distribution [4].
Two different water redistribution options can be observed in China, i.e., actual and virtual water transfers from one region to another. For example, through the South-North Water Transfer Project, one of the world’s largest inter-watershed water diversion projects, China aims to transfer ~45 cubic kilometers (km3) of water annually from Southern to Northern China, costing over $77 billion by 2050 [8]. Despite the benefits of reducing water stress in the water shortage areas, the project has considerable economic, ecological, and environmental costs [4]. On the other hand, virtual water transfer [9] occurs through regional trade, where products/services carry the water used in their production in the virtual form. The virtual water trade (VWT) can save water resources if water is transferred from water-abundant or more water-productive regions to water-scarce or less water-productive regions [10,11].
On a global scale, VWT can solve global water scarcity by allowing countries to import water-intensive products from countries with more water resources. VWT can help countries conserve their water resources and reduce their water footprint. For example, VWT has helped save water globally [12], in Japan, Mexico, Egypt [13], Brazil, the USA, and Argentina [14].
In recent years, several China-focused studies have evaluated VWT on different spatial scales (see Appendix A Table A1 for a detailed literature review), such as cities [15,16], provinces [17,18], basins [19,20,21] and multi-province level [22,23,24,25,26]. These studies have used various methods, covering different periods, and have produced a variety of conclusions. For example, several scholars used the multi-regional input-output (MRIO) model to analyze inter-provincial VWT in China [6,27,28]. Some studies have also incorporated the effects of VWT on the stress on local water resources, such as [25], who analyzed the interprovincial food trade in 2012 combined with the water stress analysis. They found that water moved from provinces with high water productivity and low water supply to provinces with low water productivity but high water supply. Liu [24] used the MRIO model to evaluate VWT among various provinces of China in 2007 and 2012 and found that although VWT helps coastal provinces meet their total water demand, it may increase water scarcity in provinces where water is already particularly scarce.
However, the existing studies on China’s internal VWT also have some limitations. First, they used a single input-output model to analyze VWT for a region or partial sectoral coverage like agricultural or cereal crops [4]. Nevertheless, a country’s economic and administrative regions are interlinked, and changes in one region can produce ripple effects in the whole country. The input-output of an individual region cannot determine the specific sources and destinations of virtual water. Second, they analyzed interregional VWT using the multi-regional input-output method without considering the impact of VWT on local water resources using any measure of water stress (WS). Third, most studies analyzed VWT for a single year without considering the evolution of VWT and WS over time. To address these research gaps, we use the MRIO approach to analyze VWT for three main sectors (see Appendix A Table A3 for the detailed classification of sectors) for China’s provinces in 2002, 2007, and 2012. We also constructed the water stress index (WSI) for all the provinces over the years to understand the relationship between VWT and local water resources clearly.
Using the method described above, we can find changes in the VWT over time that can provide important references for Chinese sustainable water resource use. In this study, we address the following main questions: (1) How has the interprovincial VWT evolved over the years in terms of the number of connections and volume of VWT? (2) Has the interprovincial VWT moved in line with provincial water stress? (3) Which sectors or provinces should be targeted to alleviate regional water pressure without harming regional/sectoral production levels?
This study presents novel insights into China’s virtual water trade (VWT) by conducting a comprehensive analysis across various spatial scales and periods, utilizing a multi-regional input-output (MRIO) model. While previous studies have tackled this topic, they often exhibit limitations. For instance, some studies focused solely on specific aspects, such as grains [29], or restricted their analysis to certain years, like 2010 [30], 2007 and 2030 [31], or 2012 [32]. Additionally, some research was geographically limited, concentrating only on urban areas of the Yangtze River Delta [33] or solely on Beijing [34]. Moreover, certain studies failed to incorporate considerations of water stress altogether [6,10]. In contrast, our study addresses these gaps by providing a more comprehensive and nuanced analysis of VWT dynamics in China, incorporating the WSI, and offering insights across various dimensions and timeframes. By addressing previous limitations and considering the evolution of VWT and water stress over time, this study provides a more holistic understanding of VWT dynamics in China, shedding light on the interlinkages between regions and sectors in virtual water flows over time.
The rest of the article is divided into four sections. Section 2 introduces the basic methodology of the MRIO model and data used in this study. The results are presented in Section 3 in three aspects: (i) virtual water trade at the industry level, (ii) VW trade at the provincial level, and (iii) virtual water flows in relation to provincial water stress. Section 4 discusses the dynamics of the virtual water flow among China’s provinces. In Section 5, we summarize the findings and suggest some policy implications.

2. Methodology and Data

2.1. Using the MRIO to Calculate Interprovincial Virtual Water Trade

The MRIO model, based on input-output analysis, was first proposed by Leontief [35] and can efficiently trace the environmental impacts of consumption between sectors within an economic region and between sub-regions [20]. Because of its ability to reflect the direct and indirect connection of production activities in various industrial sectors in the national economic system [36] and analyze the interdependencies of sectors in an economy, this method has been widely used for the assessment of virtual water trade between regions [22,31,37].
For the MRIO analysis framework used in this study, we first assume that the system consists of m provinces, each containing n sectors. The mathematical structure of the input-output model consists of ( m × n ) linear equations. According to the structure of the model, the total input into production activities of each sector in province r is equal to its total output, i.e., the total input of each sector is equal to the sum of the intermediate and final uses and exports (the basic form of the interregional input-output model is shown in Appendix A Table A2). The calculation equation is as follows:
X i r = s = 1 m j = 1 n x i j r s + s = 1 m F i r s + E i r
where, X i r is the total input of sector i in province r . x i j r s is the intermediate input provided by sector i in province r to sector j in province s . F i r s is the input for the final use of province s from sector i in province r . E i r is the international export of sector i from region r .
The direct input coefficient, a i j r s , refers to the direct input from sector i in province r to sector j in province s in producing each unit of product. It can be calculated by using Equation (2):
a i j r s = x i j r s x j s
Then, Equation (1) can be transformed into Equation (3) as:
X i r = s = 1 m j = 1 n a i j r s x j s + s = 1 m F i r s + E i r
The matrix form of Equation (3) is:
X = A X + F + E
Equation (4) is transformed to obtain:
X = I A 1 ( F + E )
where I is the identity matrix, and A is the direct intermediate input coefficients. In order to convert the economic data into the corresponding water-related data, this study uses the direct water consumption coefficient, W , which refers to the amount of water consumed per unit of total output in a region. It is expressed as the ratio of water consumption to the total output in each province and sector. The calculation equation is as follows:
w i r = σ i r x i r
where, σ i r is the water consumption of sector i in province r . W = w is the row vector for the direct water coefficient.
Based on the above information, the complete water consumption coefficient can be obtained using the following equation:
Q = W ^ ( I A ) 1
W ^ is the diagonal matrix of vector W .
Then, virtual water trade can be calculated by using Equation (8):
V W T = W ^ I A 1 F + E
where F is the matrix of final use.

2.2. Water Stress Index (WSI)

The environmental impact of water consumption varies greatly in each region by water resource endowment [38]. Trade can potentially generate water savings when commodities flow from regions with high productivity to regions with low productivity. However, the water-saving generated from this trade may occur at the expense of increasing water scarcity in exporting regions and exert a limited impact on water stress alleviation in the importing regions [39]. Therefore, evaluating how VWT is connected with water stress among the trading regions is crucial.
Previous studies have used several methods to calculate WSI, with different advantages and drawbacks. For example, they estimated WSI just for the agricultural sector [40] rather than the whole industry, presenting a partial picture of the stress on water resources. Using data for one year to estimate the WSI for another year ignores the temporal variation in water stress (as done by [25]), where they used 2007 data to estimate WSI in 2012). In order to present a holistic analysis and incorporate temporal changes, we calculate WSI covering all the sectors of the economy over 2002, 2007, and 2012 for every province of China.
According to [30], WSI refers to water stress arising from water withdrawal from available local water sources and can be calculated as:
W S I = W U Q
where W U is the local water withdrawal by agriculture, industry, and households. Q is renewable freshwater availability. Based on existing work [31], we divide the value of WSI into four levels: 0 < W S I 0.2 , no stress; 0.2 < W S I 0.4 , moderate stress; 0.4 < W S I 1 , severe stress; W S I > 1 , extreme stress. Being a ratio of two water volumes, W S I does not have a unit.

2.3. Data

The 30 provinces we study include 22 provinces, four province-level metropolitans (Beijing, Tianjin, Shanghai, and Chongqing), and four autonomous regions. Due to the lack of relevant data, this study did not include Tibet, Taiwan, Hong Kong, and Macau. The industry division is based on [31], where the primary industry comprises the agricultural sector. The secondary industry covers industrial sectors, while the services sectors are aggregated in the tertiary industry (see Appendix A Table A3 for the detailed aggregation of sectors).
In this study, China’s regional I/O tables were obtained from [41,42,43]. These are the most widely used and reliable data sets for China’s provincial MRIOs. However, there is a slight mismatch between the estimation methods used for 2002 and later years. Before 2003, the primary industry classification (i.e., agriculture sector) did not include ‘agriculture, forestry, animal husbandry, and fishery service industry’ and was added to the primary industry in later years’ I/O tables. To account for this change, we estimate the proportion of the ‘agriculture, forestry, animal husbandry, and fishery service industry’ in the primary industry for 2003 and distribute it to the primary industry for each province in 2002. The data for ‘agriculture, forestry, animal husbandry, and fishery services’ in various provinces were obtained from the statistical yearbooks of the provinces.
The data for provincial water withdrawal are collected from [44]. Renewable freshwater availability for each province and water use data for agriculture are from the provincial-level Water Resources Bulletins [45,46]. Due to limited data availability, we use industrial withdrawal water as industrial water use. For water use data for the secondary and tertiary industries, we estimated the proportion of water used in the secondary and tertiary industries from [47]. Then, we regard the economic growth rate as a growth rate in water use to get water use data for the secondary and tertiary industries for other years. This relation is based on previous studies that have recognized a positive relation between water consumption and economic growth (e.g., [48,49,50]).

3. Results

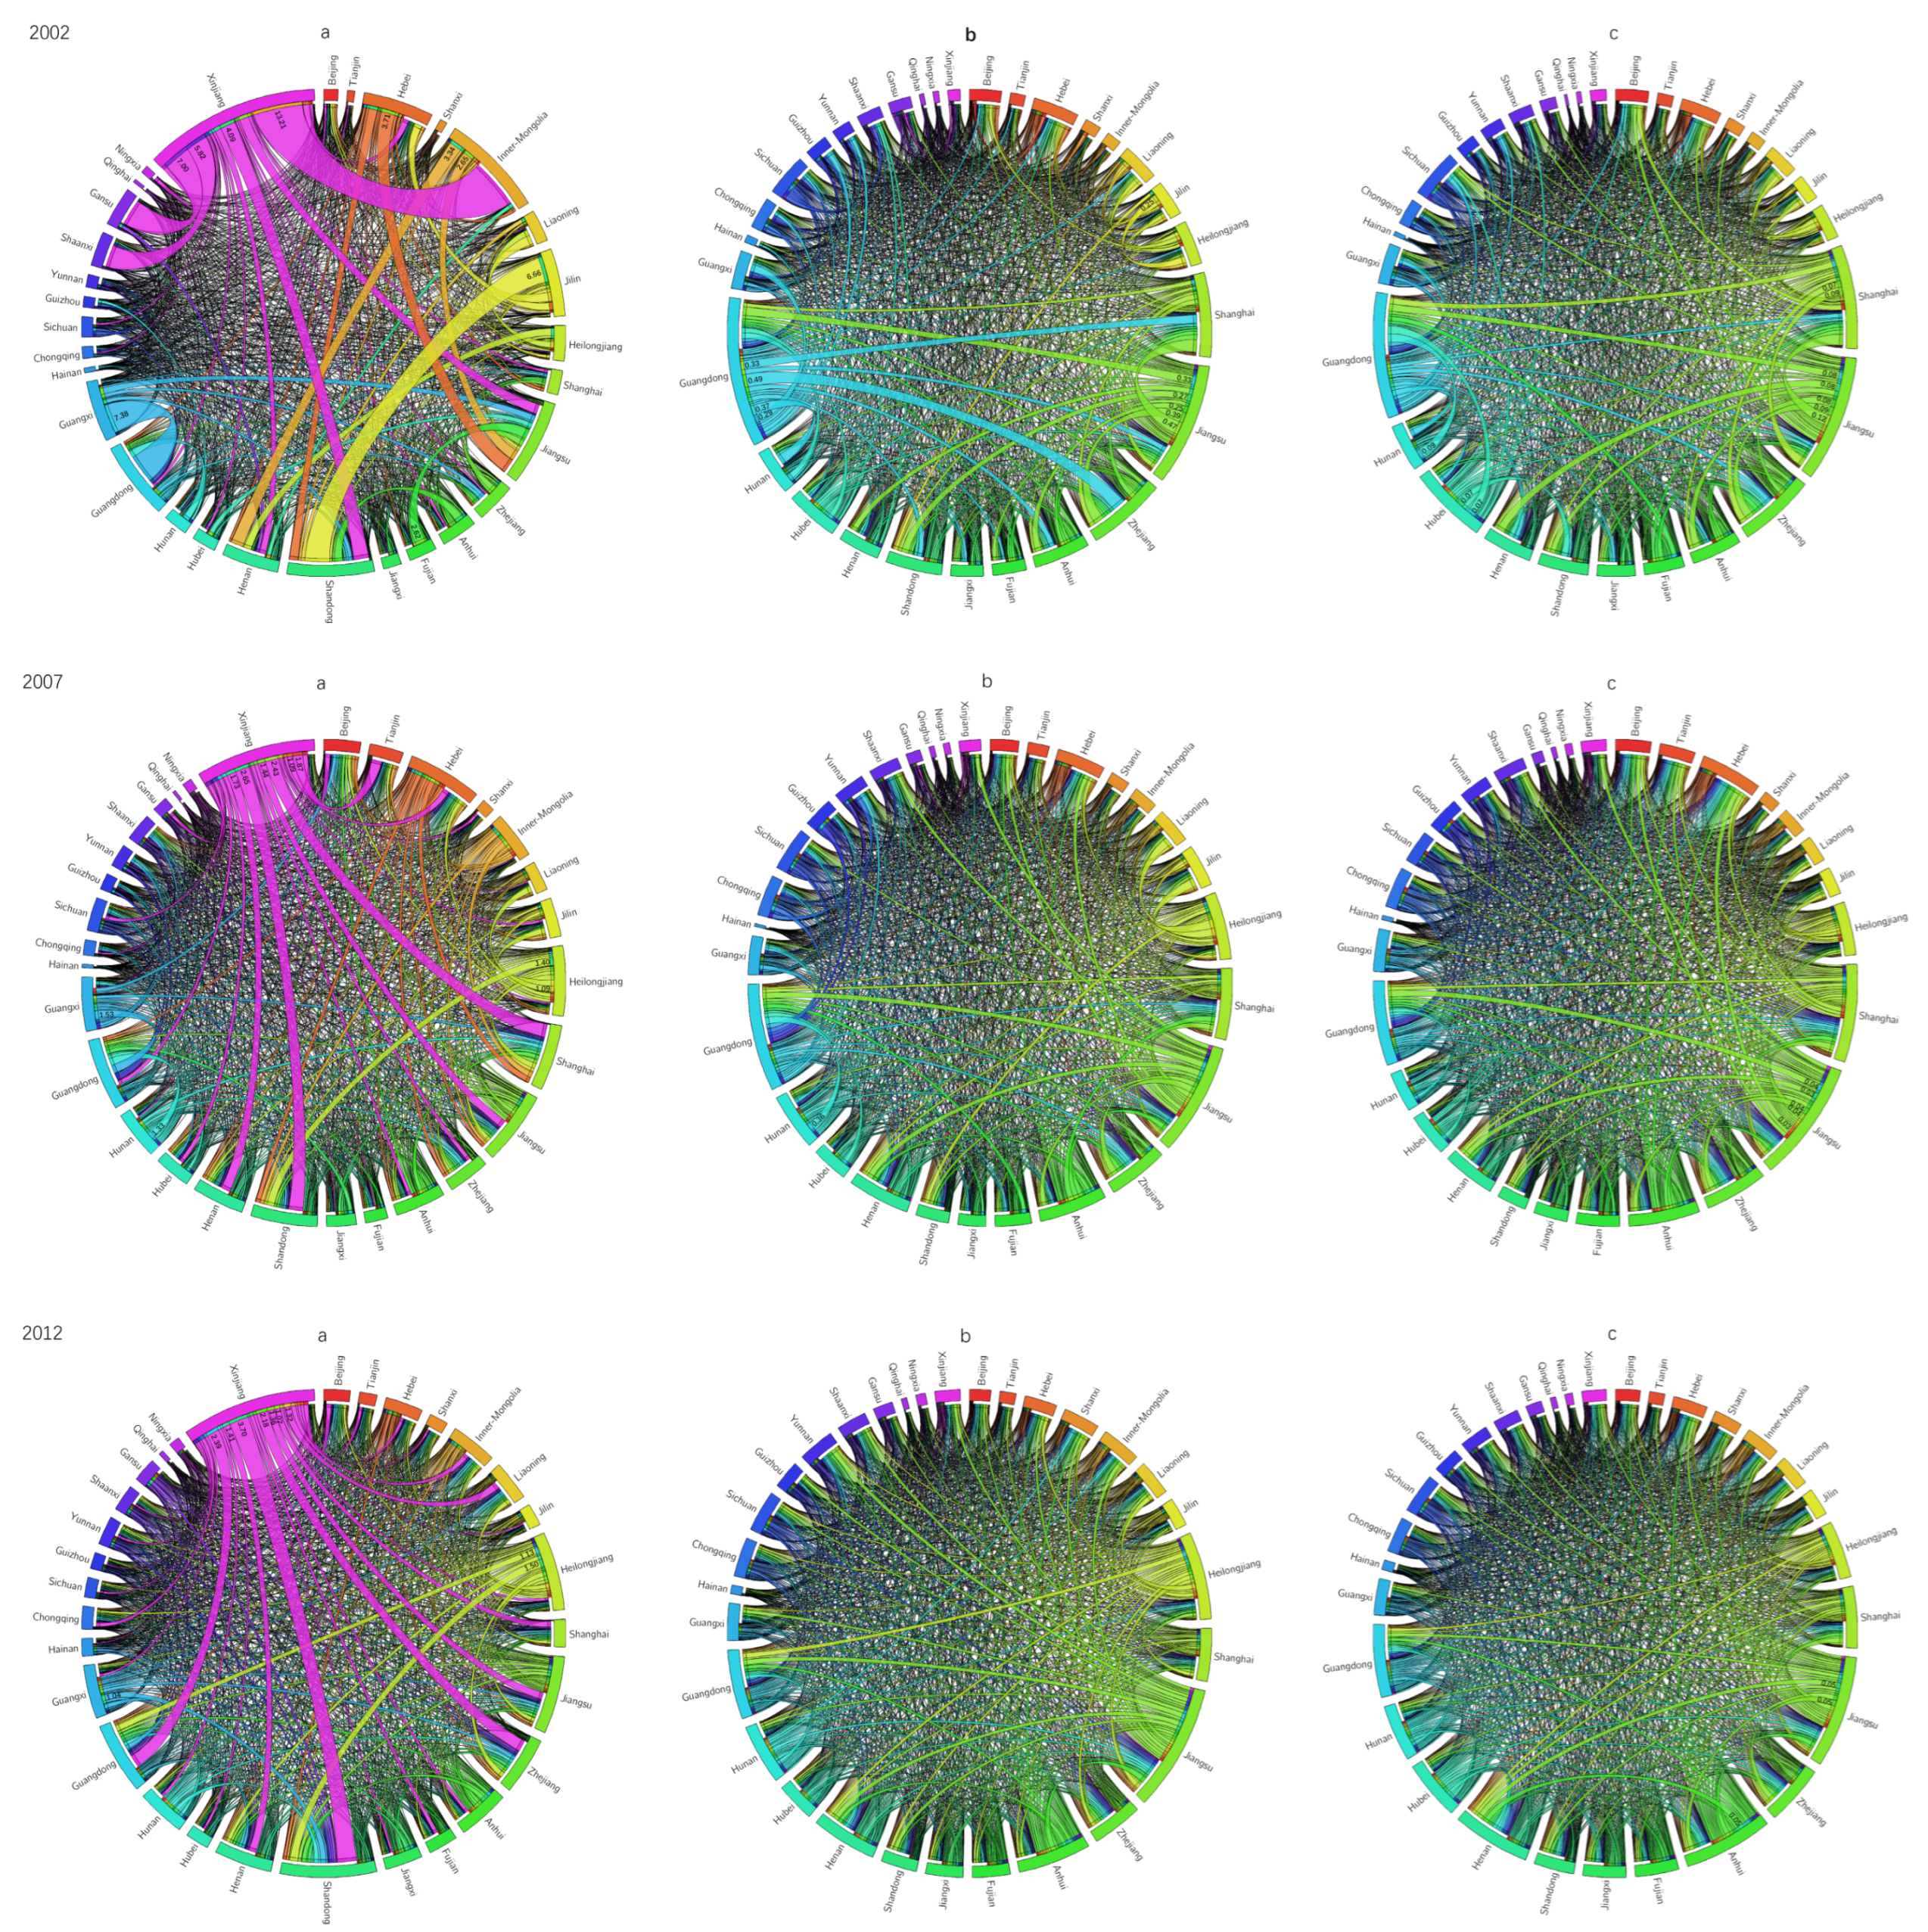
3.1. Virtual Water Trade in Three Industries

The computational analysis of virtual water trade (VWT) at the industry level reveals intricate patterns and disparities across regions and years. Through Figure 1 and Supplementary Materials (SM) Table S1, which showcases variations in virtual water outflows and inflows, we gain insights into the significant role played by the primary industry in shaping VWT dynamics. This dominance is particularly evident in regions like Inner Mongolia, Gansu, Shandong, Jiangsu, and Shaanxi in 2002, where primary industry involvement is prominent. However, by 2012, we observe a shift in top inflow regions to Shandong, Zhejiang, Guangdong, Liaoning, and Beijing, reflecting changing economic activities and trade dynamics.
Conversely, provinces with lower proportions of primary industry virtual water inflows, such as Guangxi, Xinjiang, Jilin, Hunan, and Sichuan, are mainly situated in less developed regions of western or southern China. This disparity underscores the unequal distribution of economic activities and resource utilization across the country.
A deeper examination of virtual water outflows unveils a consistent trend of high primary industry shares in regions with significant agricultural economies, primarily located in western and southern China. For instance, Xinjiang’s consistent leadership in primary industry virtual water outflows highlights its heavy reliance on agricultural production, further emphasized by the substantial contribution of primary industry trade to its GDP. On the other hand, regions like Shanghai, Jiangsu, and Beijing exhibit more diversified economies with a lower reliance on agriculture but still show high shares of primary industry in virtual water outflows, pointing to complex trade dynamics and resource imbalances. Other studies, like [51], also found that agriculture represented 76% of the virtual water inflows for Flagstaff City (Arizona).
The analysis further reveals spatial disparities in virtual water outflow ratios of secondary and tertiary industries, particularly in eastern coastal areas. Provinces like Shanghai and Jiangsu stand out with high proportions of virtual water outflows attributed to secondary and tertiary industries, reflecting their well-developed industrial systems.
Surprisingly, provinces like Qinghai and Guizhou, despite being in less economically developed regions, demonstrate substantial virtual water outflows from secondary and tertiary industries. This suggests that economic landscapes are crucial in shaping VWT dynamics, even in less developed regions.
We observe lower proportions of virtual water outflows from secondary and tertiary industries in economically less developed areas like Xinjiang, Inner Mongolia, and Jilin. However, significant changes have been observed over the years, indicating evolving economic structures and trade dynamics.
Additionally, identifying eight provinces with significant virtual water outflows exceeding 6.22 km3, predominantly driven by primary industry contributions, underscores the importance of industry composition in VWT. Xinjiang’s consistent leadership in virtual water outflows highlights its reliance on primary industries, while provinces like Jiangsu heavily rely on secondary industries for virtual water outflows. China’s inter-provincial VWT is much larger than the VWT of 900 million m3 among the Nile Basin countries [52].
Furthermore, despite abundant rainfall in southern China, provinces in this region demonstrate relatively lower virtual water outflows. However, primary industry virtual water inflows remain relatively high in central-eastern provinces, reflecting changing trade dynamics and economic priorities. Mayer [53] showed that many U.S. counties of the Great Lakes basin, particularly rural ones, are net exporters of virtual water, especially in the commercial and thermoelectric sectors.
In conclusion, the total VWT in the primary industry among all provinces shows a downward trend, closely related to improvements in agricultural water efficiency. The total national VWT of the secondary and tertiary industries has changed little over the years.
Overall, the analysis underscores the complex interplay of economic structures, trade patterns, and regional disparities in shaping virtual water trade dynamics. These insights are essential for formulating targeted water management policies and enhancing water resource sustainability across regions and industries.

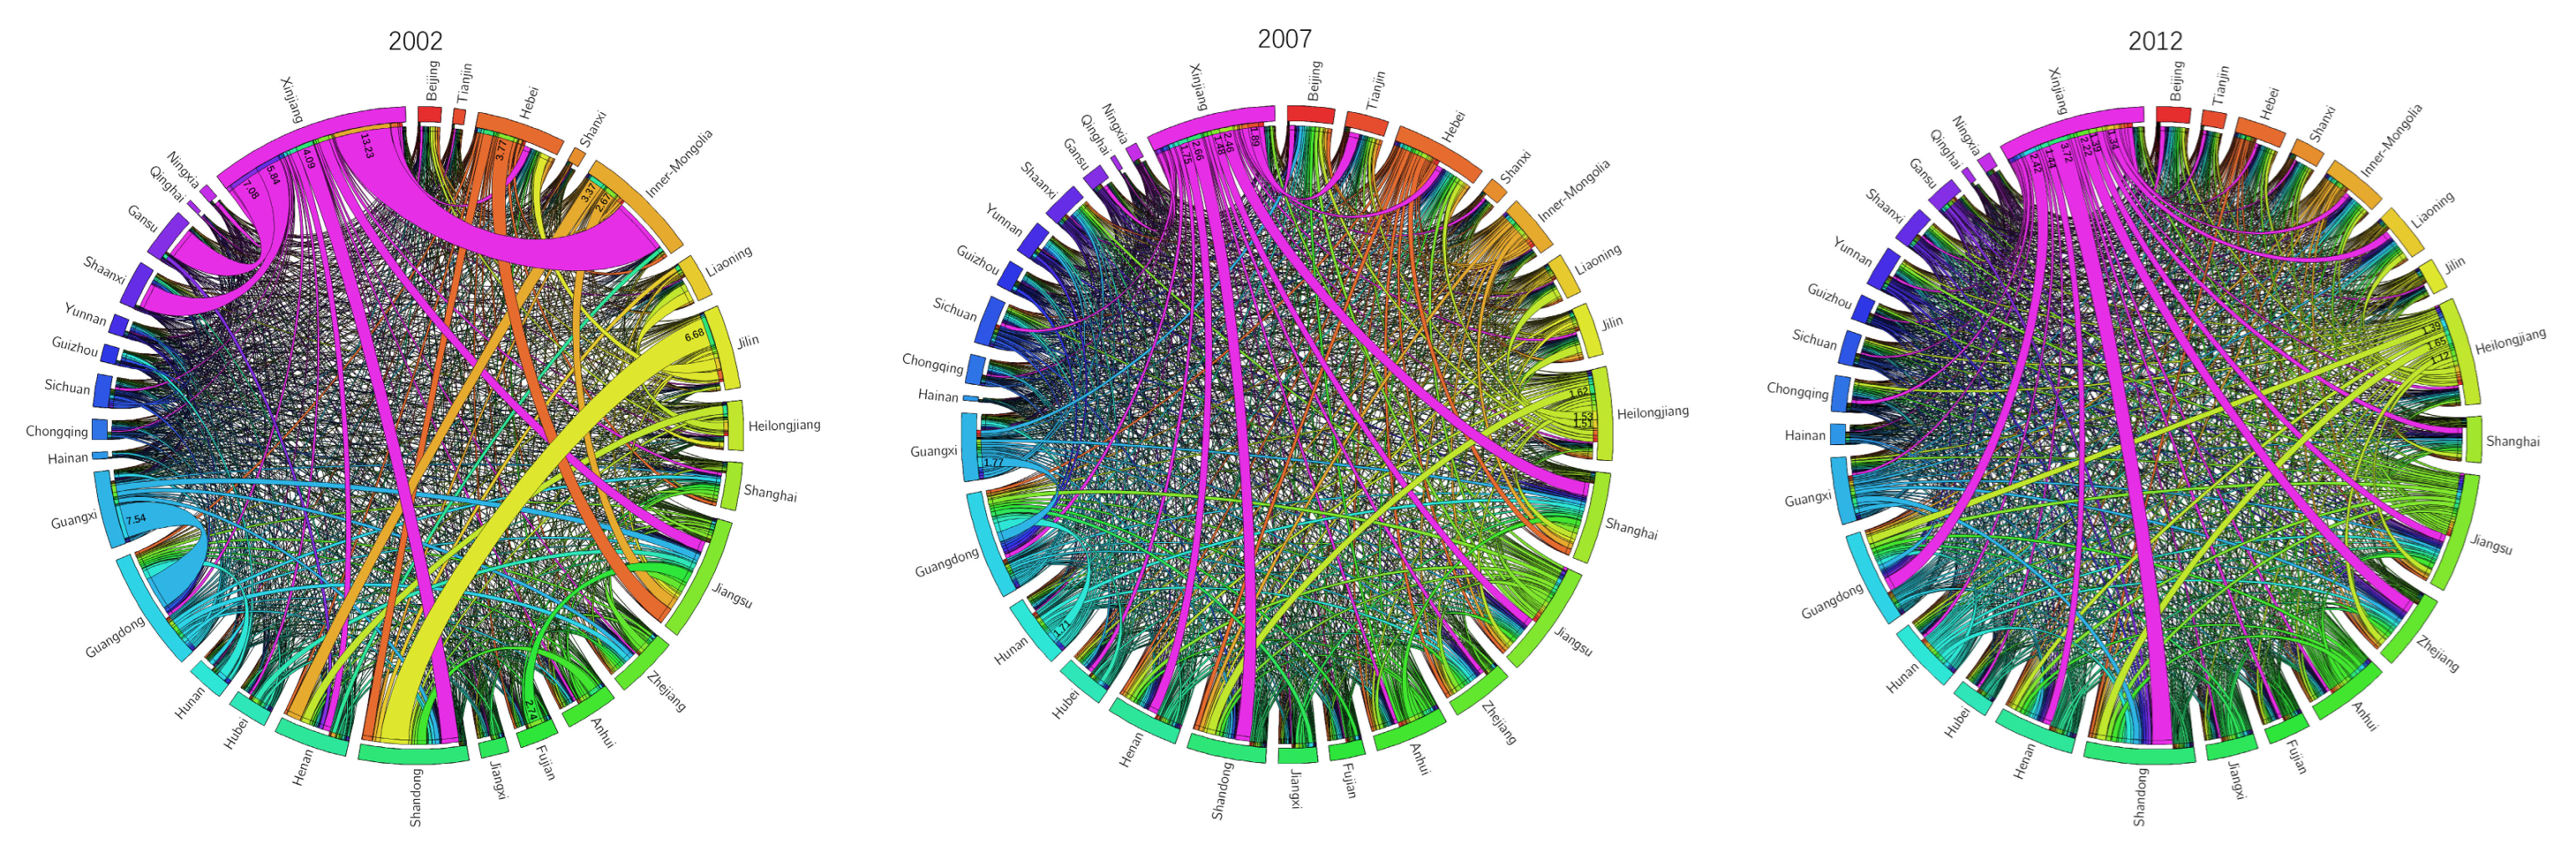
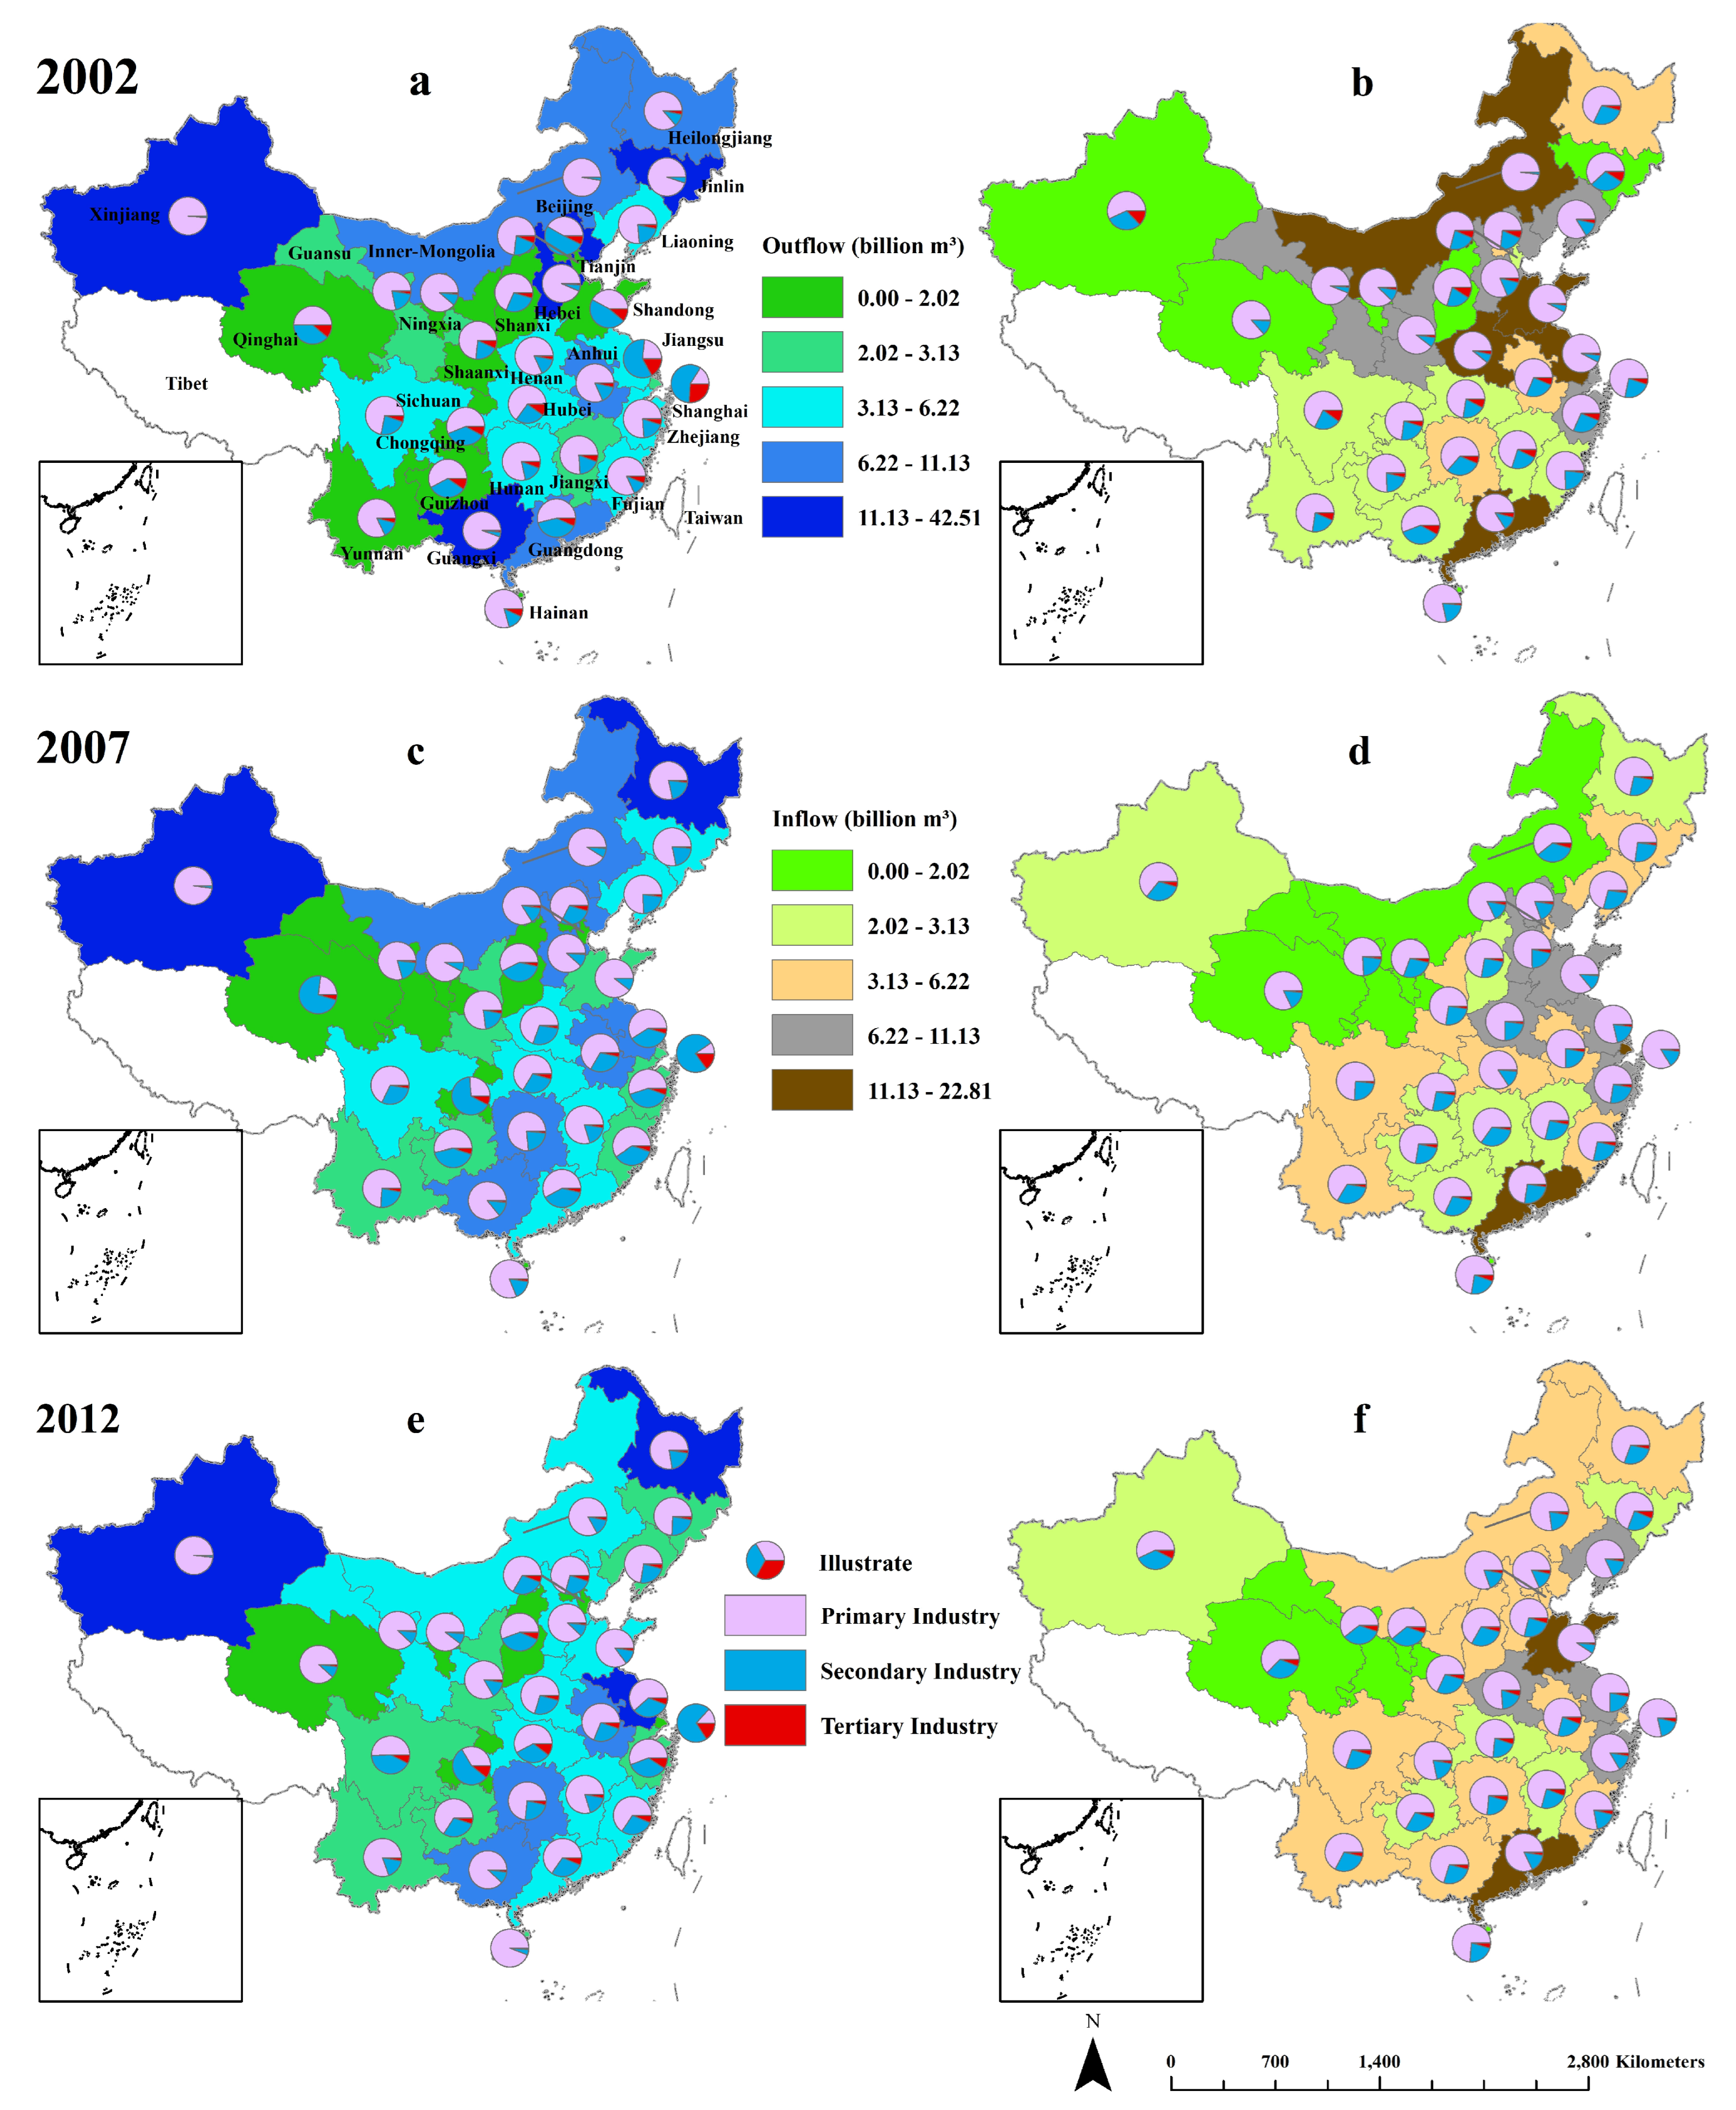
3.2. Provincial Virtual Water Trade

Total inter-provincial VWT shows a downward trend during the study period, with 363.91 km3 in 2002, 283.72 km3 in 2007, and 285.23 km3 in 2012. These results are similar to the findings of other studies in China [27,46,54]. Rathore [55] also found decreasing VWT among the US counties through cereal and milled grain products. The observed downward trend in total inter-provincial virtual water trade over the study period highlights changing dynamics in water resource utilization and trade patterns. Provincial production and consumption structures vary widely in China due to differences in development and endowments of various production factors, which lead to an active inter-provincial exchange of goods and services [6]. The volumes of VWT vary significantly across provinces (Appendix A Figure A1). The VWT of a region consists of two parts: virtual water inflow and virtual water outflow. Overall, economically developed areas (such as Beijing, Tianjin, and Shanghai) account for a large proportion of VW inflow. They have many common features, e.g., dense populations and highly developed economies with major manufacturing hubs [27], and thus VW outflows of the secondary and tertiary industries account for a large proportion of total VW outflow, and VW of the first industry has a large share in VW inflow. The relatively underdeveloped areas mainly engaged in the primary industry are the main sources of virtual water outflow. These areas have low GDPs, smaller populations, and production scales.
The number and size of VW outflow and inflow connections among provinces have also varied significantly over the years (Appendix A Figure A1). Xinjiang was the largest source of VW outflow for Inner Mongolia (13.23 km3) in 2002, Shandong (2.66 km3) in 2007, and again for Shandong (3.72 km3) in 2012. The provincial outflows of virtual water in 2002 were large while relatively small and almost the same magnitudes in 2007 and 2012. Moreover, the virtual water outflow areas became more concentrated from 2002 to 2012 (Appendix A Figure A1). In 2002, for example, six provinces (i.e., Xinjiang, Guangxi, Jilin, Inner-Mongolia, Hebei, Fujian) covered the top 10 virtual water outflow volumes. This number was reduced to four provinces in 2007 (i.e., Xinjiang, Heilongjiang, Guangxi, Hunan) and finally to two, i.e., Xinjiang and Heilongjiang, in 2012. These flows suggest that Xinjiang and Heilongjiang gradually occupy an increasingly important position in China’s virtual water outflow (Appendix A Figure A2). Xinjiang was one of the top sources of virtual water outflow in 2002, 2007, and 2012, mainly because it engaged in the production and trade of the primary industry. The provinces have the largest water consumption in China, with more than 90% of VWT in the primary industry. This results from its dry climate, long sunshine duration, and low irrigation efficiency [4]. Like Xinjiang, Heilongjiang is China’s largest commodity grain base [56], making it the second-largest source of virtual water outflow.
Overall, these findings underscore the complex interplay between economic, environmental, and regional factors in shaping virtual water trade dynamics in China, emphasizing the need for targeted policies to promote sustainable water resource management and reduce disparities across regions.

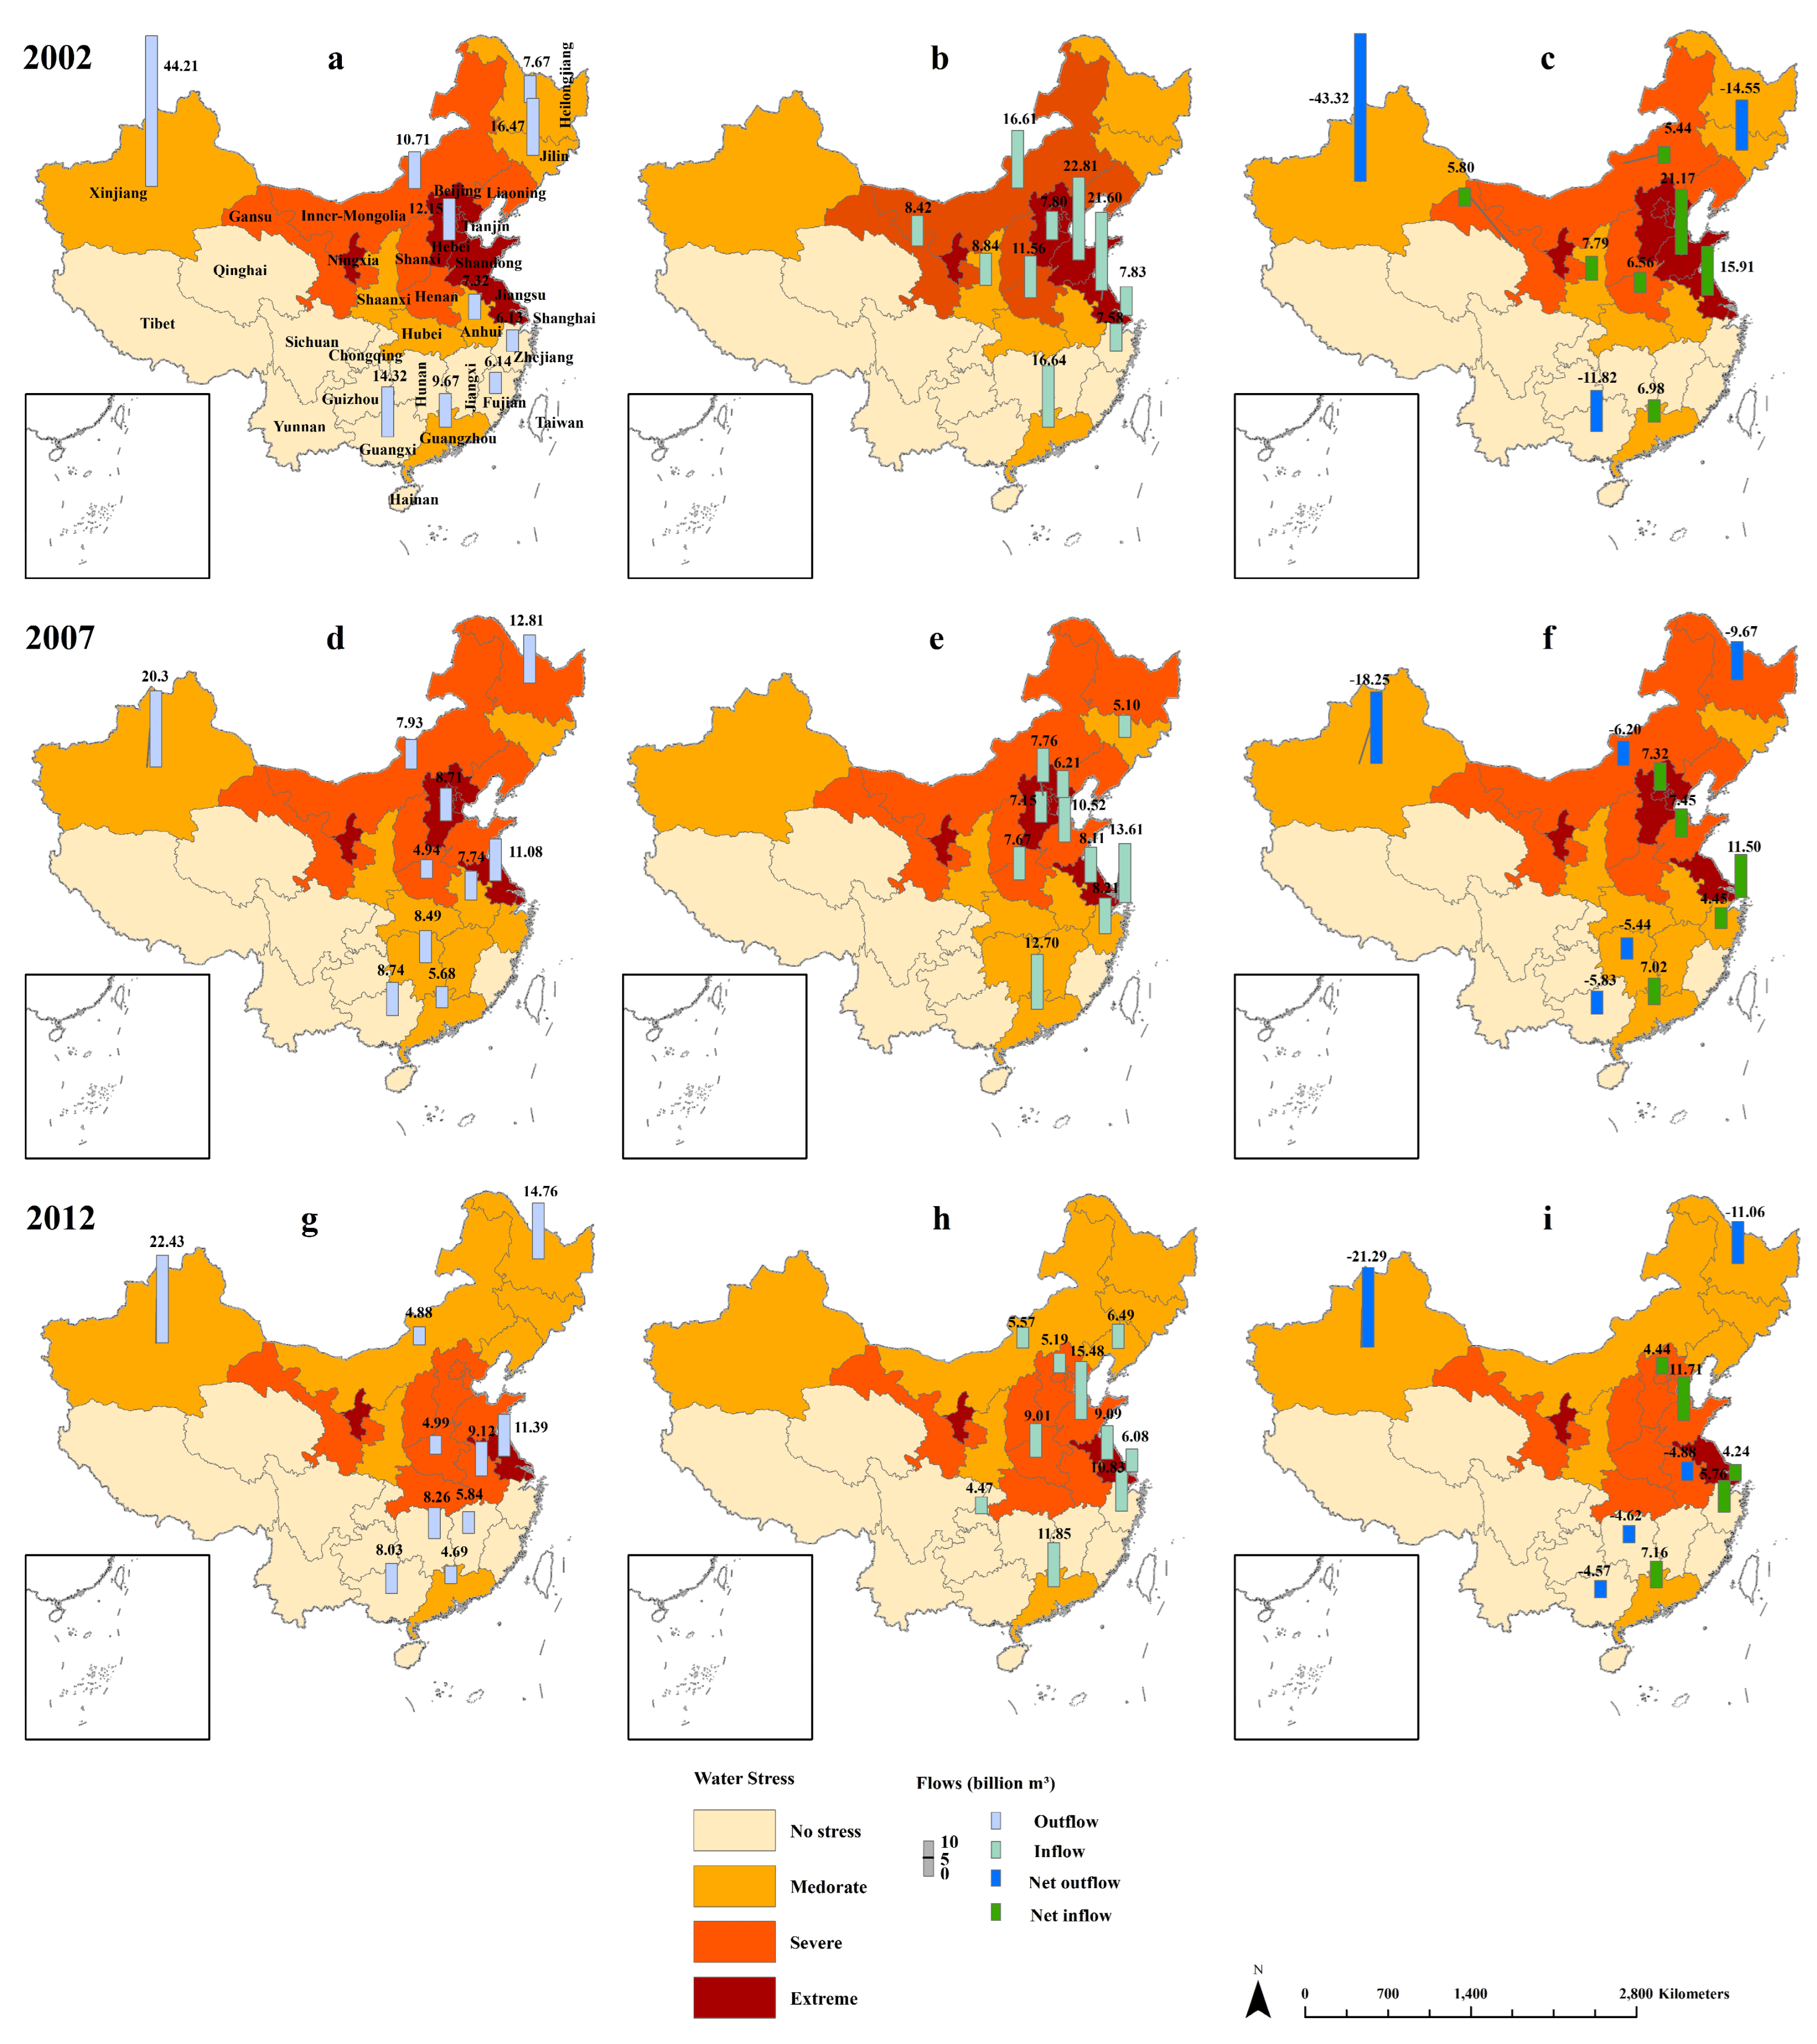
3.3. Virtual Water Flows Relative to Provincial Water Stress (WSI)

Our results show a noticeable difference between the water stress in different regions and over the study period, with a downward trend overall in China (Figure 2 and SM Tables S2–S5). Starting in 2002, we found 19 provinces with at least moderate water stress (WSI > 0.2); i.e., they consumed more than the available annual renewable amount of freshwater. Among them, seven provinces, i.e., Beijing, Tianjin, Hebei, Shanghai, Jiangsu, Shandong, and Ningxia, had extreme water stress, with WSI > 1. In 2007, the number of Chinese provinces with at least moderate water stress increased to 22, with six provinces (Beijing, Tianjin, Hebei, Shanghai, Jiangsu, and Ningxia) showing extreme water stress. In 2012, 19 of the 30 Chinese provinces had at least moderate water stress, with three provinces (Shanghai, Jiangsu, and Ningxia) showing extreme water stress. Although they belonged to similar moderate or severe water stress categories, the WSI scores for most moderately or severely stressed provinces decreased from 2002 to 2007 and 2012. Tianjin, Shandong, and Hebei experienced the most significant drop in WSI between 2002 and 2012, showing significant progress in these places. Meanwhile, the WSI for Ningxia, Xinjiang, and Henan either remained the same or decreased very little during the same period.
Due to the inter-provincial VWT, a large amount of virtual water is transferred, and existing studies have shown a pronounced increase in water stress in VW export areas due to VWT [30,40]. Our results indicate that Xinjiang, Guangxi, Guangdong, Anhui, Inner Mongolia, and Heilongjiang have been among the top ten VW exporters for three years. These provinces have had at least moderate water stress, except Guangxi, which had no water stress in the studied periods. Therefore, large VW outflows from Guangxi seem more environmentally beneficial than those from the rest of the above provinces. Jiangsu is another example of a major VW export region with extreme water stress in all three years, yet it still exported significant volumes of VW: 11.08 km3 in 2007 and 11.39 km3 in 2012. A study on virtual water flows among US counties [55] showed that the number of counties importing cereals and milled grains from water-scarce counties increased during the study period.
Water stress can be attributed to different factors in different provinces. For example, water stress in Inner Mongolia, Heilongjiang, Anhui, and Xinjiang might have increased due to the virtual water export from these places. For Ningxia and Gansu, the moderate or higher levels of WSI were due to water resource shortages. Our results show that WSI in Ningxia is much higher than in other provinces (>6.5) for three years (several other studies found similar results [24,54]). The reason is that the local water endowment in Ningxia is extremely poor: the gross amount of water resources was only 1.04 km3 in 2007 and 1.08 km3 in 2012. Also, the temporal distribution of water resources in Ningxia is highly uneven, with less annual precipitation and significant differences in annual precipitation.
Water stress can be alleviated in import regions due to virtual water import [23,24,29,39]. Without virtual water imports, places like Beijing, Tianjin, and Shanghai will likely face more severe water stress. As shown in Figure 2, the water stress of Beijing and Tianjin decreased year by year. However, water stress in Shanghai rose first during 2002–2007 and then fell during 2007–2012. Our results also show that the inflow for Shanghai in 2007 was the largest compared with 2002 and 2012. The reason was that water withdrawal was larger in 2007 than in the other two periods. The water withdrawal of the secondary and tertiary industries in Shanghai increased more than in Beijing and Tianjin, meaning the secondary and tertiary industries developed rapidly from 2002 to 2007 (industrial water withdrawal increased by 0.88 km3 in Shanghai). In contrast, water withdrawal in Beijing and Tianjin was relatively stable.
Based on inter-provincial VW outflow and inflow, we also estimated the virtual water net inflow and net outflow for each province (Figure 2c,f,i). Provinces in eastern China are the leading net inflow areas, while Central and Western China provinces are the main net outflow areas. The overall trend of VWT in China indicates that VW is transferred from water-poor areas to water-rich areas and from backward economic areas to economically developed areas. This trend is harmful and unsustainable from a water and food security perspective. A study in India [57] found that states with depleted groundwater reserves accounted for 41% of cereal exports. Thirty-one out of 35 Indian states rely partly on cereals from groundwater-depleted areas. It showed that interstate trade encourages the production of less water-intensive crops but increases groundwater use slightly.
Our study unveils novel insights into virtual water trade (VWT) dynamics compared to existing research, revealing significant regional shifts in the dominance of virtual water inflow areas across provinces and industries over time. We highlight the impact of industrial development on virtual water outflows, particularly in economically developed regions like Shanghai and Jiangsu, emphasizing the fluctuating ratios of secondary and tertiary industries. Furthermore, our analysis indicates a decline in VWT associated with the primary industry, attributed to improvements in agricultural water efficiency, underscoring the correlation between water efficiency, economic growth, and changes in VWT patterns. Examining inter-provincial VWT trends, we observe a downward trend over the study period, reflecting evolving water resource utilization and trade patterns, with certain provinces such as Xinjiang and Heilongjiang gaining prominence. Additionally, our findings shed light on the complex relationship between water stress levels, virtual water trade, and economic development, underscoring the importance of targeted policies for sustainable water resource management and addressing regional disparities.

4. Discussion

With China’s worsening water shortage, VWT can be a vital mode to relieve regional water stress within China. Although inter-regional VWT has received wide attention in China [6,58,59,60,61], little attention has been paid to evaluating VWT over time, covering three industries and in conjunction with the water stress indicator. Here, we quantify China’s VWT at a provincial and industrial level using an MRIO model. We divided the national economy into three industries and analyzed the evolution of VWT in 2002, 2007, and 2012. We find that the primary industry’s virtual water accounts for more than half of VWT (also found in previous studies like [5,46]). This is related to the primary industry’s water consumption, which is consistently above 60% [28,62,63].
The spatial pattern of inter-regional VWT is largely inconsistent with the spatial distribution of water endowment, similar to what other studies indicated [6]. The water-abundant provinces in Southern China do not export much virtual water. Many studies show that the driving mechanism of VWT depends on water endowments [27,64,65]. Therefore, water is not recognized as an important factor in China’s economic production due to the meager cost of water utilization in most production [66]. Our results show that the main flows are from water-poor areas to water-rich areas and from backward areas to economically developed areas, which might be because land productivity is the primary determinant of the pattern of VWT across major regions, with limited roles from other resources such as water and labor endowments [67]. The value of the land can be fully reflected in the product’s price, thus affecting the choice of production. Therefore, inter-regional trade flows from land-rich, water-poor areas to land-poor, water-rich areas. Other important drivers for inter-regional trade are the availability of fossil fuel resources, differences in regional economic development, and consumption patterns.
Our study also shows that the eastern coast relied heavily on virtual water imports, and this dependence severely affects the water shortage in the inland regions [22]. With further economic development and urbanization in the future, their reliance might be further strengthened. For example, as the biggest virtual water exporter, Xinjiang exported a large volume of virtual water to other provinces, especially eastern coastal provinces, such as Jiangsu, Zhejiang, Shanghai, and Jiangsu. This result is similar to the observations in other studies like [4,22,39]. Future demand for virtual water could drive the outflow of virtual water in Xinjiang, increasing water pressure in the province.
Several limitations exist in our study, representing crucial future research directions. First, our approach is based on an environment-extended input-output modeling framework, which brings some inherent limitations. Since the input-output table was updated in five years, we could only study until 2012. There is an unavoidable lag in temporal coverage, but the MRIO approach is still a common technical tool for calculating inter-regional trade data. The unavailability of more recent datasets is a limitation of our work, which could have provided further insights into current trends and developments. Second, detailed data on China’s water consumption are limited. Employing a multivariate statistical approach could be helpful in similar studies. However, using multivariate techniques is beyond the scope of our current study. Future studies in this field can employ this method. The WSI in this paper is calculated based on provincial administrative units, which ignores the spatial heterogeneity of WSI in the province. It is important to note that more detailed water consumption data at finer sectoral and regional disaggregation could significantly strengthen the analysis and policy recommendations. The absence of uncertainty ranges for the calculated inflow and outflow volumes is a limitation in our analysis, underscoring the need for future studies to address this aspect.

5. Conclusions

This paper employs the MRIO approach to analyze China’s inter-provincial virtual water trade (VWT) in 2002, 2007, and 2012 across three industries in relation to the water stress index. The findings offer insights for optimizing water resource allocation in China. Key findings include the dominance of the primary industry in VWT, with Shandong (91%), Zhejiang (83%), Guangdong (82%), Liaoning (82%), and Beijing (82%) leading in inflow shares in 2012 due to low water efficiency. Additionally, Xinjiang (98%), Guangxi (88%), Ningxia (89.40%), and Qinghai (88.24%) emerge as major outflow regions for the primary industry. The secondary and tertiary industries contribute significantly to virtual water outflows from developed regions like Shanghai (average ratio 87.19%) and Jiangsu (average ratio 51.45%) over 2002–2012. Furthermore, the study highlights the directional flow of virtual water from less developed central and western regions to more developed eastern regions, such as Beijing, Tianjin, and Shanghai. Lastly, the analysis underscores the transfer of virtual water from high-water-pressure regions to low-water-pressure regions, potentially exacerbating local water pressures in exporting regions.

6. Policy Suggestions

Based on our results, we recommend that it is crucial to promote water conservation in all regions further. The government should set up special funds that can be used to improve the utilization efficiency of water resources through technological upgrading and production structure adjustment. Second, the regional industrial structure should be optimized by combining ecological and economic benefits. Therefore, the low virtual water exporting and water-rich areas (e.g., Jiangxi, Yunnan, Sichuan) should be encouraged to export more VW. They can also expand primary industry production. While improving the economy, these provinces can also fully use water resources.
Moreover, the high virtual exports and water-scarce areas (e.g., Xinjiang, Hebei, Inner-Mongolia) should reduce high water consumption industries and use virtual water through imports. The government can also establish an ecological compensation mechanism through which virtual water inflow areas can provide some ecological compensation to the outflow areas. The compensation recipient (usually developing provinces) can use these funds to supplement water resources protection investment and actively promote water-saving management to improve water efficiency. It can also stimulate compensation suppliers (often developed provinces) to change consumption patterns and have a more pro-environment consumption structure.

Supplementary Materials

The following supporting information can be downloaded at https://www.mdpi.com/article/10.3390/su16093666/s1, Table S1: VW outflows, inflows, and net inflows for all provinces of China for 2002, 2007, and 2012. Table S2: WSI for all provinces of China for 2002, 2007, and 2012. Table S3: VWF of all industries, the primary industry, the secondary industry, and the tertiary industry for all provinces of China for 2002. Table S4: VWF of all industries, the primary industry, the secondary industry, and the tertiary industry for all provinces of China for 2007. Table S5: VWF of all industries, the primary industry, the secondary industry, and the tertiary industry for all provinces of China for 2012.

Author Contributions

Conceptualization, T.A. and B.Z.; methodology, Y.L. and T.A.; software, Y.L.; validation, B.Z. and T.A.; formal analysis, Y.L.; resources, B.Z.; writing—original draft preparation, T.A. and Y.L.; writing—review and editing, B.Z., T.A. and Y.L.; visualization, Y.L.; supervision, B.Z. and T.A. All authors have read and agreed to the published version of the manuscript.

Funding

This research received no external funding.

Institutional Review Board Statement

Not applicable.

Informed Consent Statement

Not applicable.

Data Availability Statement

Data used in this can be requested from the corresponding author.

Conflicts of Interest

The authors declare no conflict of interest.

Appendix A

Figure A1. Virtual water flows between Chinese provinces in 2002, 2007, and 2012. Numbers indicate the volume of water in cubic kilometers, and the link color corresponds to the exporting province.
Sustainability 16 03666 g0a1
Figure A2. Virtual water flows of each industry in 2002, 2007, and 2012, (a) indicates the primary industry, (b) indicates the secondary industry. (c) indicates the tertiary industry.
Sustainability 16 03666 g0a2
Table A1. A detailed literature review on China’s VWT.
LiteratureTarget RegionYearMethodsKey Findings
City Level
[16]Beijing2010IOABeijing’s total water demand comes mainly from more than 60% of domestic imports, some from about 20% of foreign imports.
[15]Beijing2002, 2007SRIOBeijing is a net virtual water importer. Furthermore, Beijing is advanced in water use efficiency compared to other provinces in China. Adjustments in the industrial structure should be prioritized.
Province level
[18]Yunnan2007MRIOYunnan is a net virtual water exporter with a value of 1.18 km3. Making use of its advantage in green water, adjusting trade structure by considering provincial water intensity is proposed when exporting.
[17]Liaoning2007SRIOLiaoning is a net water export region, although water shortages are becoming a more serious concern. Therefore, industrial and trade structures should be adjusted.
Basin level
[21]Yellow river basin2012MRIOVWT has exacerbated water shortages in the Yellow River basin. Therefore, exports should be reduced, and an effective virtual water compensation mechanism should be established.
[20]Haihe river basin2007MRIO, WSIHaihe River Basin is a net water export region. While importing more virtual water from the water-rich areas is desirable, caution needs to be taken when importing the virtual water shortage, as the latter will cause greater water pressure in other water shortage areas.
[19]Yellow river basin2007MRIOAll three reaches (the upper, middle, and lower) are net virtual water exporters. The lower reach should increase the import of water-intensive goods.
Multi-province level
[25]30 provinces2012MRIO, WSI, CropwatWater is moved from provinces with high water productivity but lacking water to provinces with low water productivity but abundant water. An inter-provincial compensation mechanism is established by taking blue water and gray water as the primary water conservation.
[24]30 provinces2007, 2010, 2012MRIO, WSIWater use increased substantially from 2007–2012 due to greater shipment volumes of water-intensive products. Policies on water distribution and protection are urgently needed to consider the type of trade and water shortage.
[23]31 provinces and the rest of the world2005a general equilibrium welfare model and linear programming optimizationDry, irrigation-intensive provinces tend to export to wetter, less irrigation-intensive ones.
[22]30 provinces2007MRIOConsumption in highly developed coastal provinces largely relies on water resources in the water-scarce northern provinces, such as Xinjiang, Hebei, and Inner Mongolia, thus significantly contributing to the water scarcity in these regions.
Table A2. The basic form of the interregional input-output model.
Intermediate InputFinal ConsumptionExportTotal Output
Province 1Province mProvince 1 Province m
S1SnS1Sn
Intermediate inputProvince 1S1 X 11 11 X 1 n 11 X 11 1 m X 1 n 1 m F 1 11 F 1 1 m E 1 1 X 1 1
Sn X n 1 11 X n n 11 X n 1 1 m X n n 1 m F n 11 F n 1 m E n 1 X n 1
Province mS1 X 11 m 1 X 1 n m 1 X 11 m m X 1 n m m F 1 m 1 F 1 m m E 1 m X 1 m
Sn X n 1 m 1 X n n m 1 X n 1 m m X n n m m F n m 1 F n m m E n m X n m
Import I M 1 1 I M n 1 I M 1 m I M n m F M 1 F M m
Added value
Total input
V 1 1 V n 1 V 1 m V n m
X 1 1 X n 1 X 1 m X n m
Table A3. Classification of sectors in MRIO analysis.
Classification of Sectors with Three IndustriesSector
The primary industryAgriculture
The secondary industryCoal Mining and Dressing
Petroleum and Natural Gas Extraction
Metals Mining and Dressing
Nonmetal Minerals Mining and Dressing
Food and Tobacco Processing
Textile Industry
Garments, Leather, Furs, Down, and Related Products
Timber Processing and Furniture Manufacturing
Papermaking, Cultural, Educational, and Sports Articles
Petroleum Processing and Coking
Chemicals
Nonmetal Mineral Products
Smelting and Pressing of Metals
Metal Products
General and Specialized Machinery
Transportation Equipment
Electric Equipment and Machinery
Electronic and Telecommunications Equipment
Instruments, Meters, Cultural and Office Machinery
Other Manufacturing Products
Electricity and Heating Power Production and Supply
Gas and Water Production and Supply
Construction
The tertiary industryFreight Transport and Warehousing
Wholesale and Retail Trade
Hotels, Food and Beverage Places
Real Estate and Social Services
Scientific Research
Other Services

References

  1. Zhang, S.; Taiebat, M.; Liu, Y.; Qu, S.; Liang, S.; Xu, M. Regional water footprints and interregional virtual water transfers in China. J. Clean. Prod. 2019, 28, 1401–1412. [Google Scholar] [CrossRef]
  2. Vörösmarty, C.J.; Green, P.; Salisbury, J.; Lammers, R.B. Global water resources: Vulnerability from climate change and population growth. Science 2000, 289, 284–288. [Google Scholar] [CrossRef]
  3. Murray, S.J.; Foster, P.N.; Prentice, I.C. Future global water resources with respect to climate change and water withdrawals as estimated by a dynamic global vegetation model. J. Hydrol. 2012, 448, 14–29. [Google Scholar] [CrossRef]
  4. Chen, W.; Wu, S.; Lei, Y.; Li, S. China’s water footprint by province, and inter-provincial transfer of virtual water. Ecol. Indic. 2017, 74, 321–333. [Google Scholar] [CrossRef]
  5. Hoekstra, A.Y.; Mekonnen, M.M. The water footprint of humanity. Proc. Natl. Acad. Sci. USA 2012, 109, 3232–3237. [Google Scholar] [CrossRef] [PubMed]
  6. Zhang, C.; Anadon, L.D. A multi-regional input-output analysis of domestic virtual water trade and provincial water footprint in China. Ecol. Econ. 2014, 100, 159–172. [Google Scholar] [CrossRef]
  7. Wang, X.; Xin, L.; Tan, M.; Li, X.; Wang, J. Impact of spatiotemporal change of cultivated land on food-water relations in China during 1990–2015. Sci. Total Environ. 2020, 716, 137119. [Google Scholar] [CrossRef]
  8. Chen, Y.; Tian, L. Canal surface evaporation along the China’s South-to-North Water Diversion quantified by water isotopes. Sci. Total Environ. 2021, 779, 146388. [Google Scholar] [CrossRef]
  9. Allan, J.A. Fortunately there are substitutes for water otherwise our hydro-political futures would be impossible. In Proceeding of the Conference on Priorities for Water Resources Allocation and Management; Natural Resources and Engineering Advisers Conference, Southampton, UK, July 1992; Natural Resources Institute: London, UK, 1993; Volume 13, pp. 13–26. Available online: https://www.ircwash.org/sites/default/files/210-93PR-11967.pdf#page=18 (accessed on 21 November 2022).
  10. Dalin, C.; Hanasaki, N.; Qiu, H.; Mauzerall, D.L.; Rodriguez-Iturbe, I. Water resources transfers through Chinese interprovincial and foreign food trade. Proc. Natl. Acad. Sci. USA 2014, 111, 9774–9779. [Google Scholar] [CrossRef]
  11. Wu, P.; Zhuo, L.; Liu, Y.; Gao, X.; Sun, S. Assessment of regional crop-related physical-virtual water coupling flows. Chin. Sci. Bullet. 2019, 64, 1953–1966. [Google Scholar] [CrossRef]
  12. Dalin, C.; Konar, M.; Hanasaki, N.; Rinaldo, A.; Rodriguez-Iturbe, I. Evolution of the global virtual water trade network. Proc. Natl. Acad. Sci. USA 2012, 109, 5989–5994. [Google Scholar] [CrossRef] [PubMed]
  13. Chapagain, A.K.; Hoekstra, A.Y.; Savenije, H.H. Water saving through international trade of agricultural products. Hydrol. Earth Syst. Sci. 2006, 10, 455–468. [Google Scholar] [CrossRef]
  14. Konar, M.; Reimer, J.J.; Hussein, Z.; Hanasaki, N. The water footprint of staple crop trade under climate and policy scenarios. Environ. Res. Lett. 2016, 11, 035006. [Google Scholar] [CrossRef]
  15. Wang, Z.; Huang, K.; Yang, S.; Yu, Y. An input-output approach to evaluate the water footprint and virtual water trade of Beijing, China. J. Clean. Prod. 2013, 42, 172–179. [Google Scholar] [CrossRef]
  16. Han, M.Y.; Chen, G.Q.; Mustafa, M.T.; Hayat, T.; Shao, L.; Li, J.S.; Xia, X.H.; Ji, X. Embodied water for urban economy: A three-scale input-output analysis for Beijing 2010. Ecol. Model. 2015, 318, 19–25. [Google Scholar] [CrossRef]
  17. Dong, H.; Geng, Y.; Sarkis, J.; Fujita, T.; Okadera, T.; Xue, B. Regional water footprint evaluation in China: A case of Liaoning. Sci. Total Environ. 2013, 442, 215–224. [Google Scholar] [CrossRef] [PubMed]
  18. Dong, H.; Geng, Y.; Hao, D.; Yu, Y.; Chen, Y. Virtual water flow feature of water-rich province and the enlightenments: Case of Yunnan in China. J. Clean. Prod. 2019, 235, 328–336. [Google Scholar] [CrossRef]
  19. Feng, K.; Siu, Y.L.; Guan, D.; Hubacek, K. Assessing regional virtual water flows and water footprints in the Yellow River Basin, China: A consumption-based approach. Appl. Geogr. 2012, 32, 691–701. [Google Scholar] [CrossRef]
  20. White, D.J.; Feng, K.; Sun, L.; Hubacek, K. A hydro-economic MRIO analysis of the Haihe River Basin’s water footprint and water stress. Ecol. Model. 2015, 318, 157–167. [Google Scholar] [CrossRef]
  21. Zhang, F.; Jin, G.; Liu, G. Evaluation of virtual water trade in the Yellow River Delta, China. Sci. Total Environ. 2021, 784, 147285. [Google Scholar] [CrossRef]
  22. Feng, K.; Hubacek, K.; Pfister, S.; Yu, Y.; Sun, L. Virtual scarce water in China. Environ. Sci. Technol. 2014, 48, 7704–7713. [Google Scholar] [CrossRef] [PubMed]
  23. Dalin, C.; Qiu, H.; Hanasaki, N.; Mauzerall, D.L.; Rodriguez-Iturbe, I. Balancing water resource conservation and food security in China. Proc. Natl. Acad. Sci. USA 2015, 112, 4588–4593. [Google Scholar] [CrossRef] [PubMed]
  24. Liu, X.; Du, H.; Zhang, Z.; Crittenden, J.C.; Lahr, M.L.; Moreno-Cruz, J.; Zuo, J. Can virtual water trade save water resources? Water Res. 2019, 163, 114848. [Google Scholar] [CrossRef] [PubMed]
  25. Deng, C.; Zhang, G.; Li, Z.; Li, K. Interprovincial food trade and water resources conservation in China. Sci. Total Environ. 2020, 737, 139651. [Google Scholar] [CrossRef] [PubMed]
  26. Deng, J.; Li, C.; Wang, L.; Yu, S.; Zhang, X.; Wang, Z. The impact of water scarcity on Chinese inter-provincial virtual water trade. Sustain. Prod. Consum. 2021, 28, 1699–1707. [Google Scholar] [CrossRef]
  27. Jiang, Y.; Cai, W.; Du, P.; Pan, W.; Wang, C. Virtual water in interprovincial trade with implications for China’s water policy. J. Clean. Prod. 2015, 87, 655–665. [Google Scholar] [CrossRef]
  28. Deng, G.; Ma, Y.; Li, X. Regional water footprint evaluation and trend analysis of China—Based on interregional input-output model. J. Clean. Prod. 2016, 112, 4674–4682. [Google Scholar] [CrossRef]
  29. Sun, S.; Wang, Y.; Engel, B.A.; Wu, P. Effects of virtual water flow on regional water resources stress: A case study of grain in China. Sci. Total Environ. 2016, 550, 871–879. [Google Scholar] [CrossRef]
  30. Zhao, X.; Li, Y.P.; Yang, H.; Liu, W.F.; Tillotson, M.R.; Guan, D.; Yi, Y.; Wang, H. Measuring scarce water saving from interregional virtual water flows in China. Environ. Res. Lett. 2018, 13, 054012. [Google Scholar] [CrossRef]
  31. Zhao, X.; Liu, J.; Liu, Q.; Tillotson, M.R.; Guan, D.; Hubacek, K. Physical and virtual water transfers for regional water stress alleviation in China. Proc. Natl. Acad. Sci. USA 2015, 112, 1031–1035. [Google Scholar] [CrossRef]
  32. Zhao, H.; Qu, S.; Liu, Y.; Guo, S.; Zhao, H.; Chiu, A.C.; Liang, S.; Zou, J.P.; Xu, M. Virtual water scarcity risk in China. Resour. Conserv. Recycl. 2020, 160, 104886. [Google Scholar] [CrossRef]
  33. Zhu, M.; Wang, J.; Zhang, J.; Xing, Z. The impact of virtual water trade on urban water scarcity: A nested MRIO analysis of Yangtze River Delta cities in China. J. Clean. Prod. 2022, 381, 135165. [Google Scholar] [CrossRef]
  34. Zhao, Y.; He, G.; Wang, J.; Gao, X.; Li, H.; Zhu, Y.; Jiang, S. Water stress assessment integrated with virtual water trade and physical transfer water: A case study of Beijing, China. Sci. Total Environ. 2020, 708, 134578. [Google Scholar] [CrossRef] [PubMed]
  35. Leontief, W.W. Quantitative Input and Output Relations in the Economic Systems of the United States. Rev. Econ. Statis. 1936, 18, 105. [Google Scholar] [CrossRef]
  36. Tian, G.; Li, J.; Li, L. Pattern of virtual water flow in the Yangtze River Economic Belt based on multi-regional input-output model. China Pop. Resour. Environ. 2019, 29, 81–88. [Google Scholar]
  37. Cai, B.; Wang, C.; Zhang, B. Worse than imagined: Unidentified virtual water flows in China. J. Environ. Manag. 2017, 196, 681–691. [Google Scholar] [CrossRef]
  38. Pfister, S.; Koehler, A.; Hellweg, S. Assessing the Environmental Impacts of Freshwater Consumption in LCA. Environ. Sci. Technol. 2009, 43, 4098–4104. [Google Scholar] [CrossRef] [PubMed]
  39. Zhao, D.; Hubacek, K.; Feng, K.; Sun, L.; Liu, J. Explaining virtual water trade: A spatial-temporal analysis of the comparative advantage of land, labor and water in China. Water Res. 2019, 153, 304–314. [Google Scholar] [CrossRef]
  40. An, T.; Wang, L.; Gao, X.; Han, X.; Zhao, Y.; Lin, L.; Wu, P. Simulation of the virtual water flow pattern associated with interprovincial grain trade and its impact on water resources stress in China. J. Clean. Prod. 2021, 288, 125670. [Google Scholar] [CrossRef]
  41. Shi, M.; Zhang, Z. China’s Provincial Input-Output Model and Interregional Economic Relations; Science Press: Beijing, China, 2012; ISBN 978-7-03-033606-4. (In Chinese) [Google Scholar]
  42. Liu, W.; Chen, J.; Tang, Z.; Liu, H.; Han, D.; Li, F. Theory and Practices of Chinese 2007 Interregional Input-Output Table between 30 Provinces; China Statistics Press: Beijing, China, 2012; ISBN 9787503784521. (In Chinese)
  43. Liu, W.; Tang, Z.; Han, M. Theory and Practices of Chinese 2012 Interregional Input-Output Table between 31 Provinces; China Statistics Press: Beijing, China, 2018; ISBN 9787503784521. (In Chinese)
  44. Zhou, F.; Bo, Y.; Ciais, P.; Dumas, P.; Tang, Q.; Wang, X.; Yin, Z. Deceleration of China’s human water use and its key drivers. Proc. Natl. Acad. Sci. USA 2020, 117, 7702–7711. [Google Scholar] [CrossRef]
  45. Zeng, Z.; Liu, J.; Savenije, H.H.G. A simple approach to assess water scarcity integrating water quantity and quality. Ecol. Indic. 2013, 34, 441–449. [Google Scholar] [CrossRef]
  46. Dong, H.; Geng, Y.; Fujita, T.; Fujii, M.; Hao, D.; Yu, X. Uncovering regional disparity of China’s water footprint and inter-provincial virtual water flows. Sci. Total Environ. 2014, 500, 120–130. [Google Scholar] [CrossRef] [PubMed]
  47. China Statistical Bureau. China Statistical Yearbook; China Statistics Press: Beijing, China, 2008; Volume 11, pp. 35–36. Available online: https://www.stats.gov.cn/sj/ndsj/2008/indexeh.htm (accessed on 21 November 2022).
  48. Cole, M.A. Economic growth and water use. Appl. Econ. Lett. 2004, 11, 1–4. [Google Scholar] [CrossRef]
  49. UNEP, United Nations Environment Programme, & International Resource Panel. Options for Decoupling Economic Growth from Water Use and Water Pollution: A Report of the Water Working Group of the International Resource Panel—Summary for Policy Makers; UNEP: Nairobi, Kenya, 2015; Available online: https://wedocs.unep.org/bitstream/handle/20.500.11822/7539/Decoupling_Options_SPM_EN.pdf?sequence=1&isAllowed=y (accessed on 2 December 2022).
  50. Wang, Q.; Jiang, R.; Li, R. Decoupling analysis of economic growth from water use in City: A case study of Beijing, Shanghai, and Guangzhou of China. Sustain. Cities Soc. 2018, 41, 86–94. [Google Scholar] [CrossRef]
  51. Rushforth, R.R.; Ruddell, B.L. The vulnerability and resilience of a city’s water footprint: The case of Flagstaff, Arizona, USA. Water Resour. Res. 2016, 52, 2698–2714. [Google Scholar] [CrossRef]
  52. Zeitoun, M.; Allan, J.T.; Mohieldeen, Y. Virtual water ‘flows’ of the Nile Basin, 1998–2004: A first approximation and implications for water security. Glob. Environ. Change 2010, 20, 229–242. [Google Scholar] [CrossRef]
  53. Mayer, A.; Mubako, S.; Ruddell, B.L. Developing the greatest Blue Economy: Water productivity, fresh water depletion, and virtual water trade in the Great Lakes basin. Earth Future 2016, 4, 282–297. [Google Scholar] [CrossRef]
  54. Cai, B.; Zhang, W.; Hubacek, K.; Feng, K.; Li, Z.L.; Liu, Y.; Liu, Y. Drivers of virtual water flows on regional water scarcity in China. J. Clean. Prod. 2019, 207, 1112–1122. [Google Scholar] [CrossRef]
  55. Rathore, L.S.; Aziz, D.; Demeke, B.W.; Mekonnen, M.M. Sustainability assessment of virtual water flows through cereal and milled grain trade among US counties. Environ. Res. Infrastruct. Sustain. 2023, 3, 025001. [Google Scholar] [CrossRef]
  56. The Central People’s Government of the People’s Republic of China. The Total Grain Output of Heilongjiang, China’s Largest Commercial Grain Base, Exceeds 100 Billion Kilograms. 2010. Available online: http://www.gov.cn/jrzg/2010-10/28/content_1732598.htm (accessed on 4 December 2022). (In Chinese)
  57. Harris, F.; Dalin, C.; Cuevas, S.; Lakshmikantha, N.R.; Adhya, T.; Joy, E.J.M.; Scheelbeek, P.F.D.; Kayatz, B.; Nicholas, O.; Shankar, B.; et al. Trading water: Virtual water flows through interstate cereal trade in India. Environ. Res. Lett. 2020, 15, 125005. [Google Scholar] [CrossRef]
  58. Wang, Y.B.; Wu, P.T.; Zhao, X.N.; Engel, B.A. Virtual water flows of grain within China and its impact on water resource and grain security in 2010. Ecol. Eng. 2014, 69, 255–264. [Google Scholar] [CrossRef]
  59. Zhai, M.; Huang, G.; Liu, L.; Xu, X.; Li, J. Transfer of virtual water embodied in food: A new perspective. Sci. Total Environ. 2019, 659, 872–883. [Google Scholar] [CrossRef]
  60. Qian, H.; Engel, B.A.; Tian, X.; Sun, S.; Wu, P.; Wang, Y. Evaluating drivers and flow patterns of inter-provincial grain virtual water trade in China. Sci. Total Environ. 2020, 732, 139251. [Google Scholar] [CrossRef] [PubMed]
  61. Qi, H.; Zeng, S.; Shi, L.; Dong, X. What the reclaimed water use can change: From a perspective of inter-provincial virtual water network. J. Environ. Manag. 2021, 287, 112350. [Google Scholar] [CrossRef]
  62. Statistics Bureau of the People’s Republic of China. China Statistical Yearbook; China Statistics Press: Beijing, China, 2013. (In Chinese)
  63. Wu, P.; Sun, S.; Wang, Y.; Li, X.; Zhao, X. Study on quantitative method and evaluation of water footprint of crop production. J. Water Conser. 2017, 48, 651–660+669. (In Chinese) [Google Scholar]
  64. Tamea, S.; Carr, J.A.; Laio, F.; Ridolfi, L. Drivers of the virtual water trade. Water Resour. Res. 2014, 50, 17–28. [Google Scholar] [CrossRef]
  65. Song, J.; Yin, Y.; Xu, H.; Wang, Y.; Wu, P.; Sun, S. Drivers of domestic grain virtual water flow: A study for China. Agric. Water Manag. 2020, 239, 106175. [Google Scholar] [CrossRef]
  66. Guan, D.; Hubacek, K. Assessment of regional trade and virtual water flows in China. Ecol. Econ. 2007, 61, 159–170. [Google Scholar] [CrossRef]
  67. Ansink, E. Refuting two claims about virtual water trade. Ecol. Econ. 2010, 69, 2027–2032. [Google Scholar] [CrossRef]
Figure 1. Virtual water outflows and inflows of China’s provinces in 2002, 2007, and 2012. (a,c,e), inflow, (b,d,f) are outflows in 2002, 2007 and 2012, respectively. The pie charts on top of the maps show the proportion of three industries in outflow and inflow areas.
Sustainability 16 03666 g001
Figure 2. Detailed virtual water outflows and inflows for the top ten Chinese provinces under respective water stress levels in 2002, 2007, and 2012 (km3). (a,d,g) are outflows, (b,e,h) are inflows, and (c,f,i) are net outflows/inflows during 2002, 2007, and 2012, respectively. See SM Table S2 for the detailed numbers on WSI.
Sustainability 16 03666 g002
Disclaimer/Publisher’s Note: The statements, opinions and data contained in all publications are solely those of the individual author(s) and contributor(s) and not of MDPI and/or the editor(s). MDPI and/or the editor(s) disclaim responsibility for any injury to people or property resulting from any ideas, methods, instructions or products referred to in the content.

