Article

Towards Sustainable Metal-to-Polymer Joining: A Comparative Study on Friction Stir Welding, Self-Piercing Riveting, and Adhesive Bonding

Department of Mechanical Engineering, American University of Sharjah, Sharjah 26666, United Arab Emirates
*
Author to whom correspondence should be addressed.
Sustainability 2024, 16(9), 3664; https://doi.org/10.3390/su16093664
Submission received: 27 February 2024 / Revised: 19 April 2024 / Accepted: 23 April 2024 / Published: 26 April 2024

Abstract

:
Friction stir welding (FSW) has gained increasing prominence in the realm of metal–plastic hybrid joints, yet its long-term sustainability remains a subject of uncertainty. This research investigates the sustainability aspect of FSW, positioning it against conventional techniques like adhesive bonding (AB) and self-piercing riveting (SPR). A comprehensive evaluation framework encompassing environmental, social, economic, and physical factors was employed, through which specified criteria were applied to select pertinent sustainability indicators across all dimensions to ensure a thorough assessment. In this study, two advanced multi-criteria decision-making methods (MCDM) were deployed for data normalization and aggregation. Sensitivity analysis was conducted to examine the robustness of the results. The outcomes yielded a sustainability rating system, facilitating a direct and insightful comparison with traditional methods. Based on the results of this study, SPR outperforms both FSW and AB in terms of overall sustainability with comparative average sustainability scores of 75.3%, 54.2%, and 35.3%, respectively. This study not only sheds light on the current state of FSW sustainability but also provides a valuable benchmark for decision-makers in selecting environmentally conscious methods for metal–plastic hybrid joints.

1. Introduction

Sustainability has become an integral part of modern industrial practices as it integrates economic, environmental, and social dimensions. Sustainability assessment has emerged as an effective decision-making methodology in a variety of industries, including manufacturing. Despite the increased efforts to implement green manufacturing and achieve sustainable manufacturing practices, the manufacturing sector lacks comprehensive sustainability assessment tools [1,2].
A key technology for building lightweight and hybrid structures is dissimilar material joining. Because of their excellent strength-to-weight ratios, adaptability in design, resistance to corrosion, and ability to insulate both electrically and thermally, metal–plastic hybrid structures are becoming increasingly common in various sectors, including aerospace, automotive, and electrical. It can be difficult to join materials that have radically different mechanical, thermal, and chemical properties. Conventional techniques, such as mechanical joining and adhesive bonding, exhibit disadvantages like unplanned failure or being deteriorated by environmental conditions.
Friction stir welding (FSW) has received increased attention in recent years as a potential alternative to traditional joining methods for metal–plastic hybrid structures. In contrast to traditional methods that require consumables or adhesives, FSW allows for the direct creation of high-quality bonds without the use of external materials. Furthermore, FSW does not emit fumes or require shielding gas, which could result in lower manufacturing costs and better sustainability outcomes. FSW melts thermoplastic materials by creating frictional heat at the tool–workpiece interface using a non-consumable rotating tool. Dissimilar material structures, such as aluminum alloys and polymers, can result in more complex, but highly optimized, designs. These material combinations may be utilized in a broad range of applications, including aviation, aerospace, and automotive vehicles, consumer or industrial goods, with the aim of achieving lightweight, versatile, and sustainable constructions [3,4]. Many investigations have examined the application of FSW in combining different materials. For instance, Dalwadi et al. used FSW to weld polymethyl methacrylate (PMMA) and AA6061 to achieve a relative joint strength of 20% [5]. Using FSW, Patel et al. [6] successfully joined polycarbonate (PC) and AA6061 [6]. Khodabakhshi et al. achieved FSW joint (AA5059 to HDPE) efficiency of 50% relative to HDPE [7]. Derazkola [8], Sahu et al. [9], and Zhao et al. [10] investigated the influences of different FSW parameters on the characteristics of dissimilar joints produced by friction stir lap welding (FSLW). Although FSW is now being used more often to join metal–plastic hybrid structures, there is a dearth of information regarding the sustainability of the process and a comprehensive analysis contrasting FSW with traditional methods for metal-to-plastic joints.
This work aims to evaluate FSW of metal/polymer hybrid structures based on a multi-dimensional sustainability assessment model and compare it to traditional methods like adhesive bonding and self-piercing riveting. In this work, we used a comprehensive sustainability assessment approach that accounts for the three sustainability pillars (environmental, social, and economic) in addition to the physical performance of the joint. The use of advanced multi-criteria decision-making methods (MCDM) for data normalization and aggregation improves the analytical robustness. Furthermore, the inclusion of sensitivity analysis confirms the accuracy of the results. This study is intended to address a research gap by providing a thorough investigation of the sustainability performance of FSW in joining metal–plastic hybrid structures, which will contribute to improving decision-making processes involving the adoption of sustainable joining techniques in the manufacturing industry.

2. Sustainability Assessment Framework

The following sections present a detailed description of the developed assessment framework. The main steps of the framework used in this study are summarized in Figure 1. The first step implements a systematic indicator selection algorithm to guide the users in selecting the indicators; the algorithm steps are discussed in Section 2.1. Once an indicator set is obtained, weights are assigned to each indicator. This is achieved through either subjective or objective weight assignment methods such as the Entropy method and Analytical Hierarchy Process (AHP), which are presented in Section 2.2. An objective indicator presents an unbiased, balanced observation based on verifiable facts while a subjective indicator displays personal beliefs and perceptions without any verified facts. Afterward, the weighted indicators are assessed through normalization and aggregation by different methods such as grey relational analysis (GRA), Technique for Order Preferences by Similarity to Ideal Solutions (TOPSIS), and other MCDM methods, which are explained in Section 2.3. Subsequently, sensitivity analysis is performed using Regression Analysis (LRA) and the sensitivity index methods, as discussed in Section 2.4.

2.1. Indicator Selection

Indicators are a key tool for tracking progress over time, identifying challenges for performance improvement, and identifying concerns that may have been omitted in preceding analyses. Nowadays, business performance is assessed by more than just financial or economic statistics. Sustainability indicators can provide a more comprehensive measurement [11]. Sustainability indicators can help to simplify, measure, analyze, and disseminate information from the viewpoints of the environment, economy, and society [12]. Indicators are one form of tool and approach for assessing sustainability [13]. Indicators should always be presented clearly, and their use should be obvious. To facilitate industries’ understanding and use of indicators, an effort has been made to define them in terms of four key elements (Figure 2) [14]:
According to a thorough examination of the present frameworks, most publications do not disclose their indicator selection procedure. In general, the considered indicators should have the following three qualities [1]:
  • Understandable: non-experts should be able to comprehend, use, and adopt.
  • Applicable: should be applicable to the industry and highlight significant process problems.
  • Relevant: should be connected directly to the continued development of sustainability.
Using the elements and qualities listed above, a technique is constructed to give a systematic algorithm for indicator recognition and selection. Figure 1 illustrates this procedure. Irrelevant indicators are first removed using the three previously mentioned qualities. Rather than “reinventing the wheel,” the purpose of filtering is to find regularly used indicators and expand on the work of prior organizations and associations. The process begins with the selection of indicators, which are then merged and classified into different dimensions. To ensure proper classification, efforts are made to gather process inputs, including experimental data and literature reviews. A feedback process is used to refine the selected indicators into a more suitable collection for industry use. Joung et al. (2012) identified 11 easily accessible indicator sets designed to assess the sustainability of industrial operations [15]. From these sets, four indicator models were chosen for further assessment and analysis, as shown in Table 1.

2.2. Weighting Process

After obtaining the indicator set, each indicator needs to be assigned a weight, either before or after it is quantified. Weight assignment can be performed using both subjective and objective approaches. Subjective procedures, like the Analytic Hierarchy Process (AHP), rely on expert decisions and/or experience. Objective approaches, like the Entropy Weight method, use quantitative values for the weights. Unlike subjective approaches, objective methods are not subject to uncertainties [17]. To overcome this issue, a combination of both weighting approaches are used in the proposed framework. The Entropy method and AHP are discussed in the following subsections.

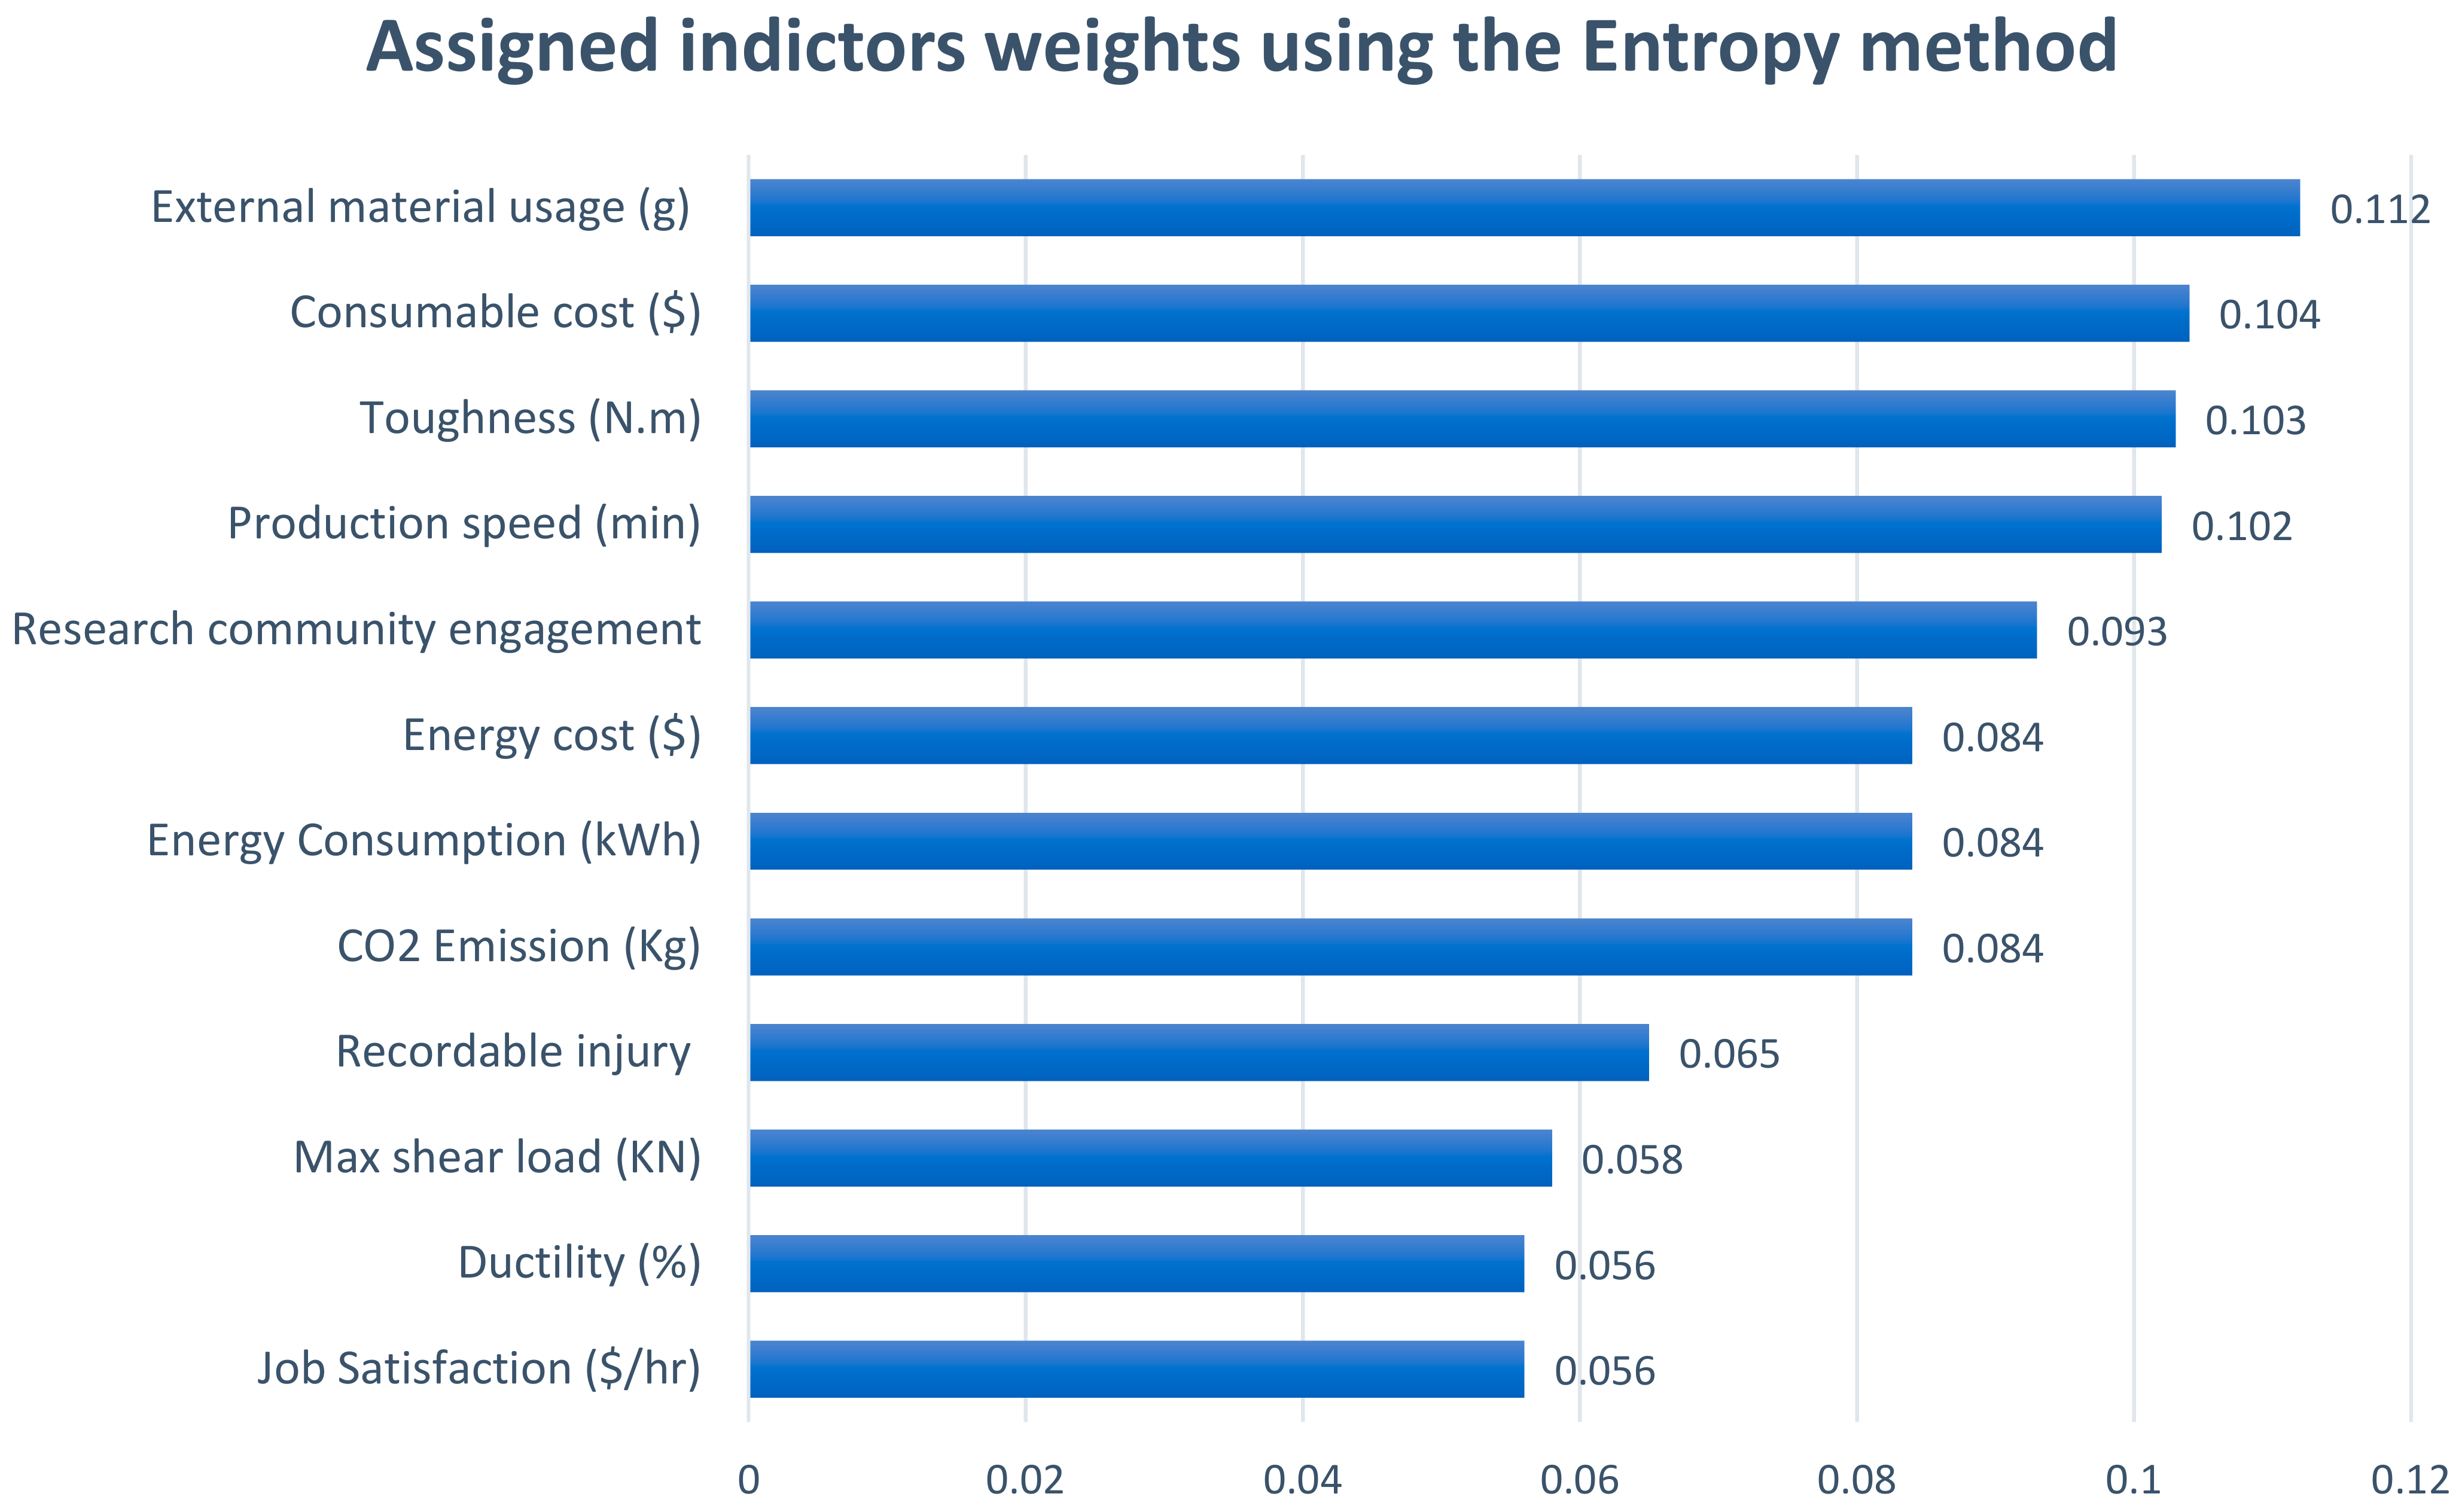
2.2.1. Entropy Method

The Entropy method is an effective way to prevent any uncertainties and inconsistencies related to weights of subjective decisions. In this strategy, indicators with vastly varying performance values have a larger significance as they have a stronger impact on final ranks of the alternatives. Equation (1) is used to assign the weights.
w j = 1 H j n j = 1 m H j
where: H j = k i = 1 m f i j · ln ( f i j ) , H j is the entropy, k = 1 ln ( m ) , and f i j = x i j j = 1 n x i j .

2.2.2. Analytical Hierarchy Process (AHP)

The AHP method is a widely used subjective decision-making technique for evaluating weights [18]. AHP breaks down the complexity of the original problem into a hierarchical structure beginning with the primary objective, then through criteria, sub-criteria (if applicable), and options or alternatives. The AHP typically involves three main steps: problem decomposition, pairwise comparison, and priority calculation [19]. In the pairwise comparison step, policymakers and experts assign relative values to each indicator. The same indicators are assigned a relative importance of 1. Additional indicators are assigned values between 2 and 9, with reciprocals assigned when the order is reversed, as shown in Table 2. While renowned for its simplicity, versatility, and ability to address various problem scales, the AHP has its own limitations. For example, it does not consider the interdependence between criteria and options at the same level of the hierarchy. It can also cause some variations between judgment and ranking [20].

2.3. Weighted Indicators Assessment

The third step in the framework is assessing the indicators. Weight vectors derived from methods like AHP or entropy are then applied to MCDM methods such as GRA and TOPSIS, which are recommended for normalization and aggregation.
Given that the weighted indicators may have various physical units, it is imperative to convert them all into dimensionless values for evaluation and comparison purposes.

2.3.1. Grey Relational Analysis (GRA)

The GRA is a quantitative decision-making approach based on evaluating the correlation between two separate sequences. It determines the level of similarity or disparity, with a stronger grey relational connection indicating greater similarity and vice versa. The GRA approach comprises four steps, as outlined below:
  • Step 1: Generating (Normalization).
In this initial step, normalization is performed, whereby various variables or indicators are scaled into the range of [0–1] using Equations (2)–(4).
x i j = y i j M i n y i j ,   i = 1,2 , , m M a x y i j ,   i = 1,2 , , m M i n y i j ,   i = 1,2 , , m
x i j = M a x y i j ,   i = 1,2 , , m y i j M a x y i j ,   i = 1,2 , , m M i n y i j ,   i = 1,2 , , m
x i j = 1 y i j y j * M a x y i j ,   i = 1,2 , , m y j * , y j * M i n y i j ,   i = 1,2 , , m
where i and j are the number of alternatives and indicators, respectively. For attributes where a higher numerical value signifies superior performance, Equation (2) is used. Conversely, when a smaller numerical value means superior performance, Equation (3) is employed. Equation (4) is utilized when being closer to the target value ( y j * ) indicates superior performance.
  • Step 2: Reference Sequence Definition.
Once all indicator values are normalized, an ideal scenario would have all performance indicator values equal to or near one. However, this is unlikely to occur. The main goal of this step is to identify the alternative that has a value closest to unity. A reference sequence, denoted as X 0 and defined as ( x 01 , x 02 , , x 0 j , , x 0 n ) = (1, 1, …, 1, …, 1), is used.
  • Step 3: Grey Relational Coefficient Calculation.
The coefficient is calculated based on Equation (5), representing the proximity of x i j to x 0 j . A larger coefficient indicates closer values.
γ x 0 j , x i j = m a x + ζ m i n   i j + ζ m a x
where γ x 0 j , x i j represents the grey relational coefficient between ( x 0 j , x i j ) ,   a n d   ζ is the distinguishing coefficient used to adjust the range of the grey relational coefficient.
Where:
i j = x i j x 0 j
m i n = M i n     i j
m a x = M a x   i j
  • Step 4: Grey Relational Grade Calculations.
To rank the considered alternatives, a single score is generated by the GRA approach using Equation (6).
Γ X 0 , X i = j = 1 n w j γ x 0 j , x i j
where Γ X 0 , X i is the degree of how close the comparability sequence to the reference sequence, and w j is the indicator’s weight based on AHP or the Entropy method.

2.3.2. Technique for Order Preference by Similarity to the Ideal Solution (TOPSIS)

This approach requires an understanding of the level of importance of all indicators, which can be achieved through methods such AHP and the Entropy method. This technique is utilized for normalization of the weighted indicators and to aggregate the scores into one sustainability score, which will then be utilized for ranking the considered processes. The TOPSIS method consists of four main steps as follows [21]:
  • Step 1: Normalization of the Score Matrix Using Equation (7).
R I J = x i j j = 1 n x i j 2
where n is the number of alternatives, and x i j in the score, the matrix represents the value of the jth indicator in real values for the i th alternative process.
  • Step 2: Calculate Weighted Normalized Score Matrix.
Multiply the weight assigned to each indicator by the normalized values in order to get the weighted normalized score matrix (WNDM). This value is then used to determine the ideal best ( V j + ) and ideal worst ( V j ) scores for the indicators.
  • Step 3: Calculate Euclidean Distance.
Obtain the Euclidean distance, which represents the deviation from the ideal case, using Equations (8) and (9).
S i + = j = 1 m V i j V j + 2
S i = j = 1 m V i j V j 2
  • Step 4: Calculate The Performance Score Using Equation (10).
P i = S i S i + + S i
The score is used for the ranking of the considered alternatives.

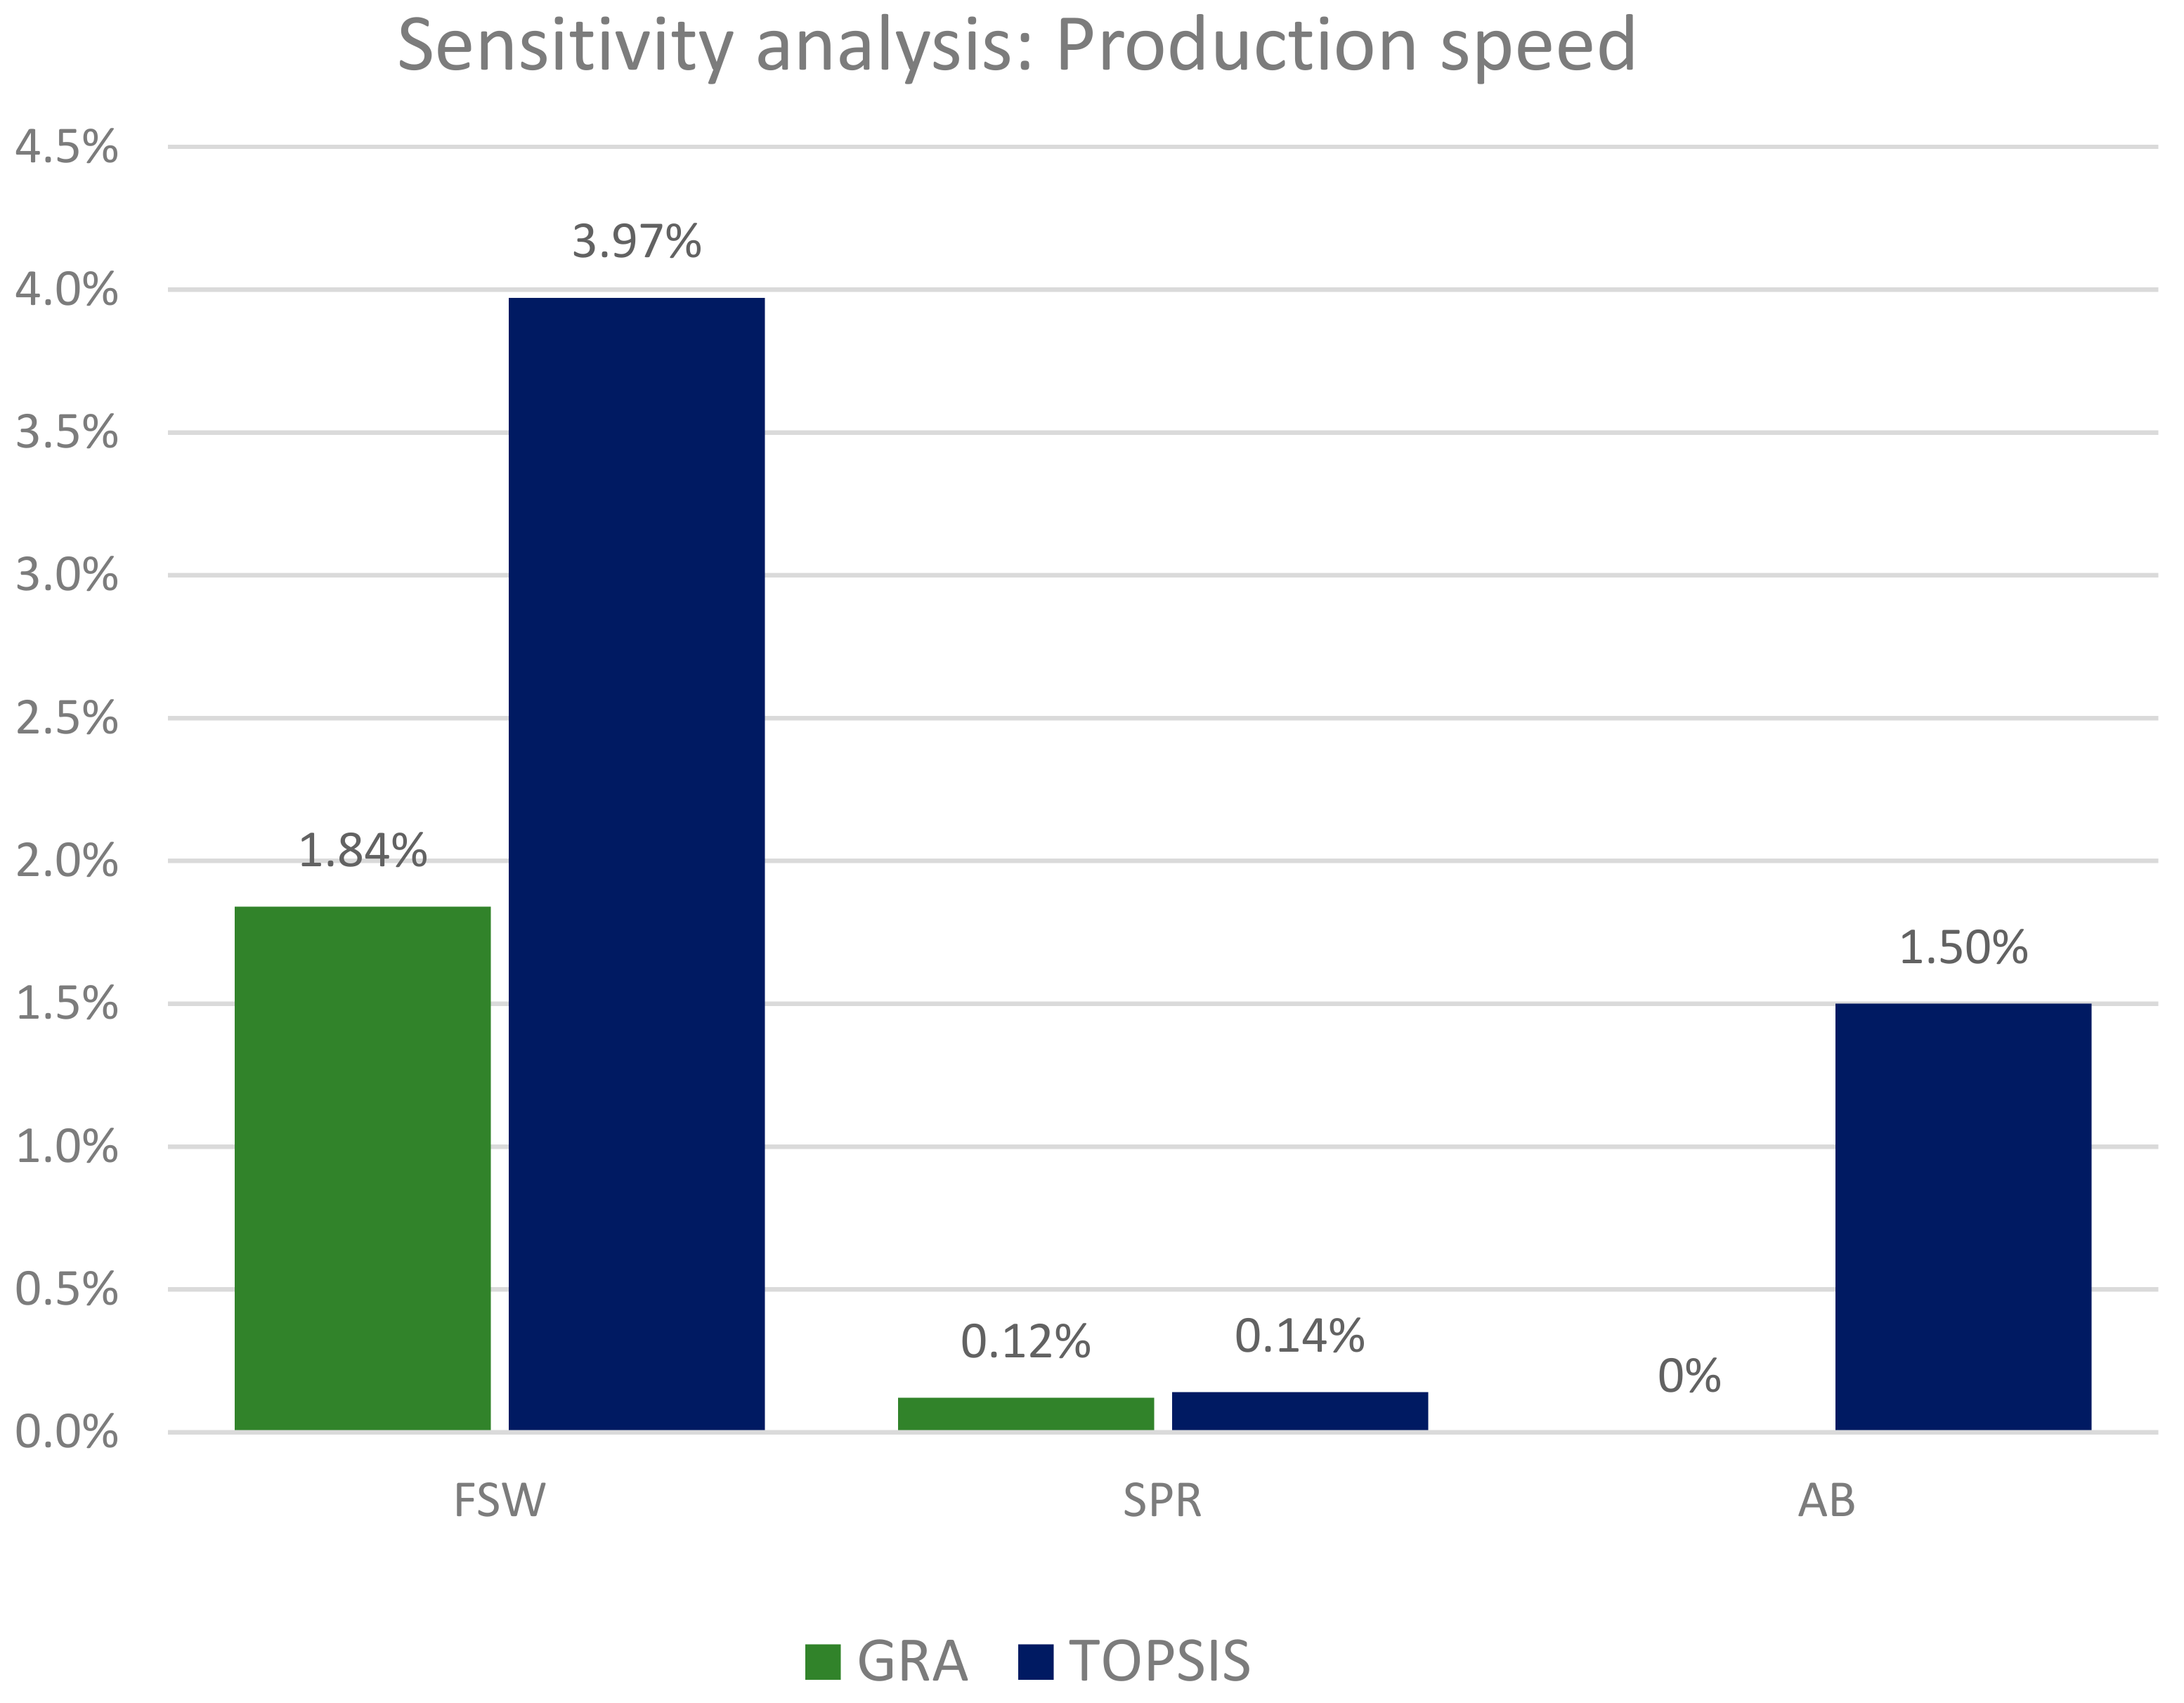
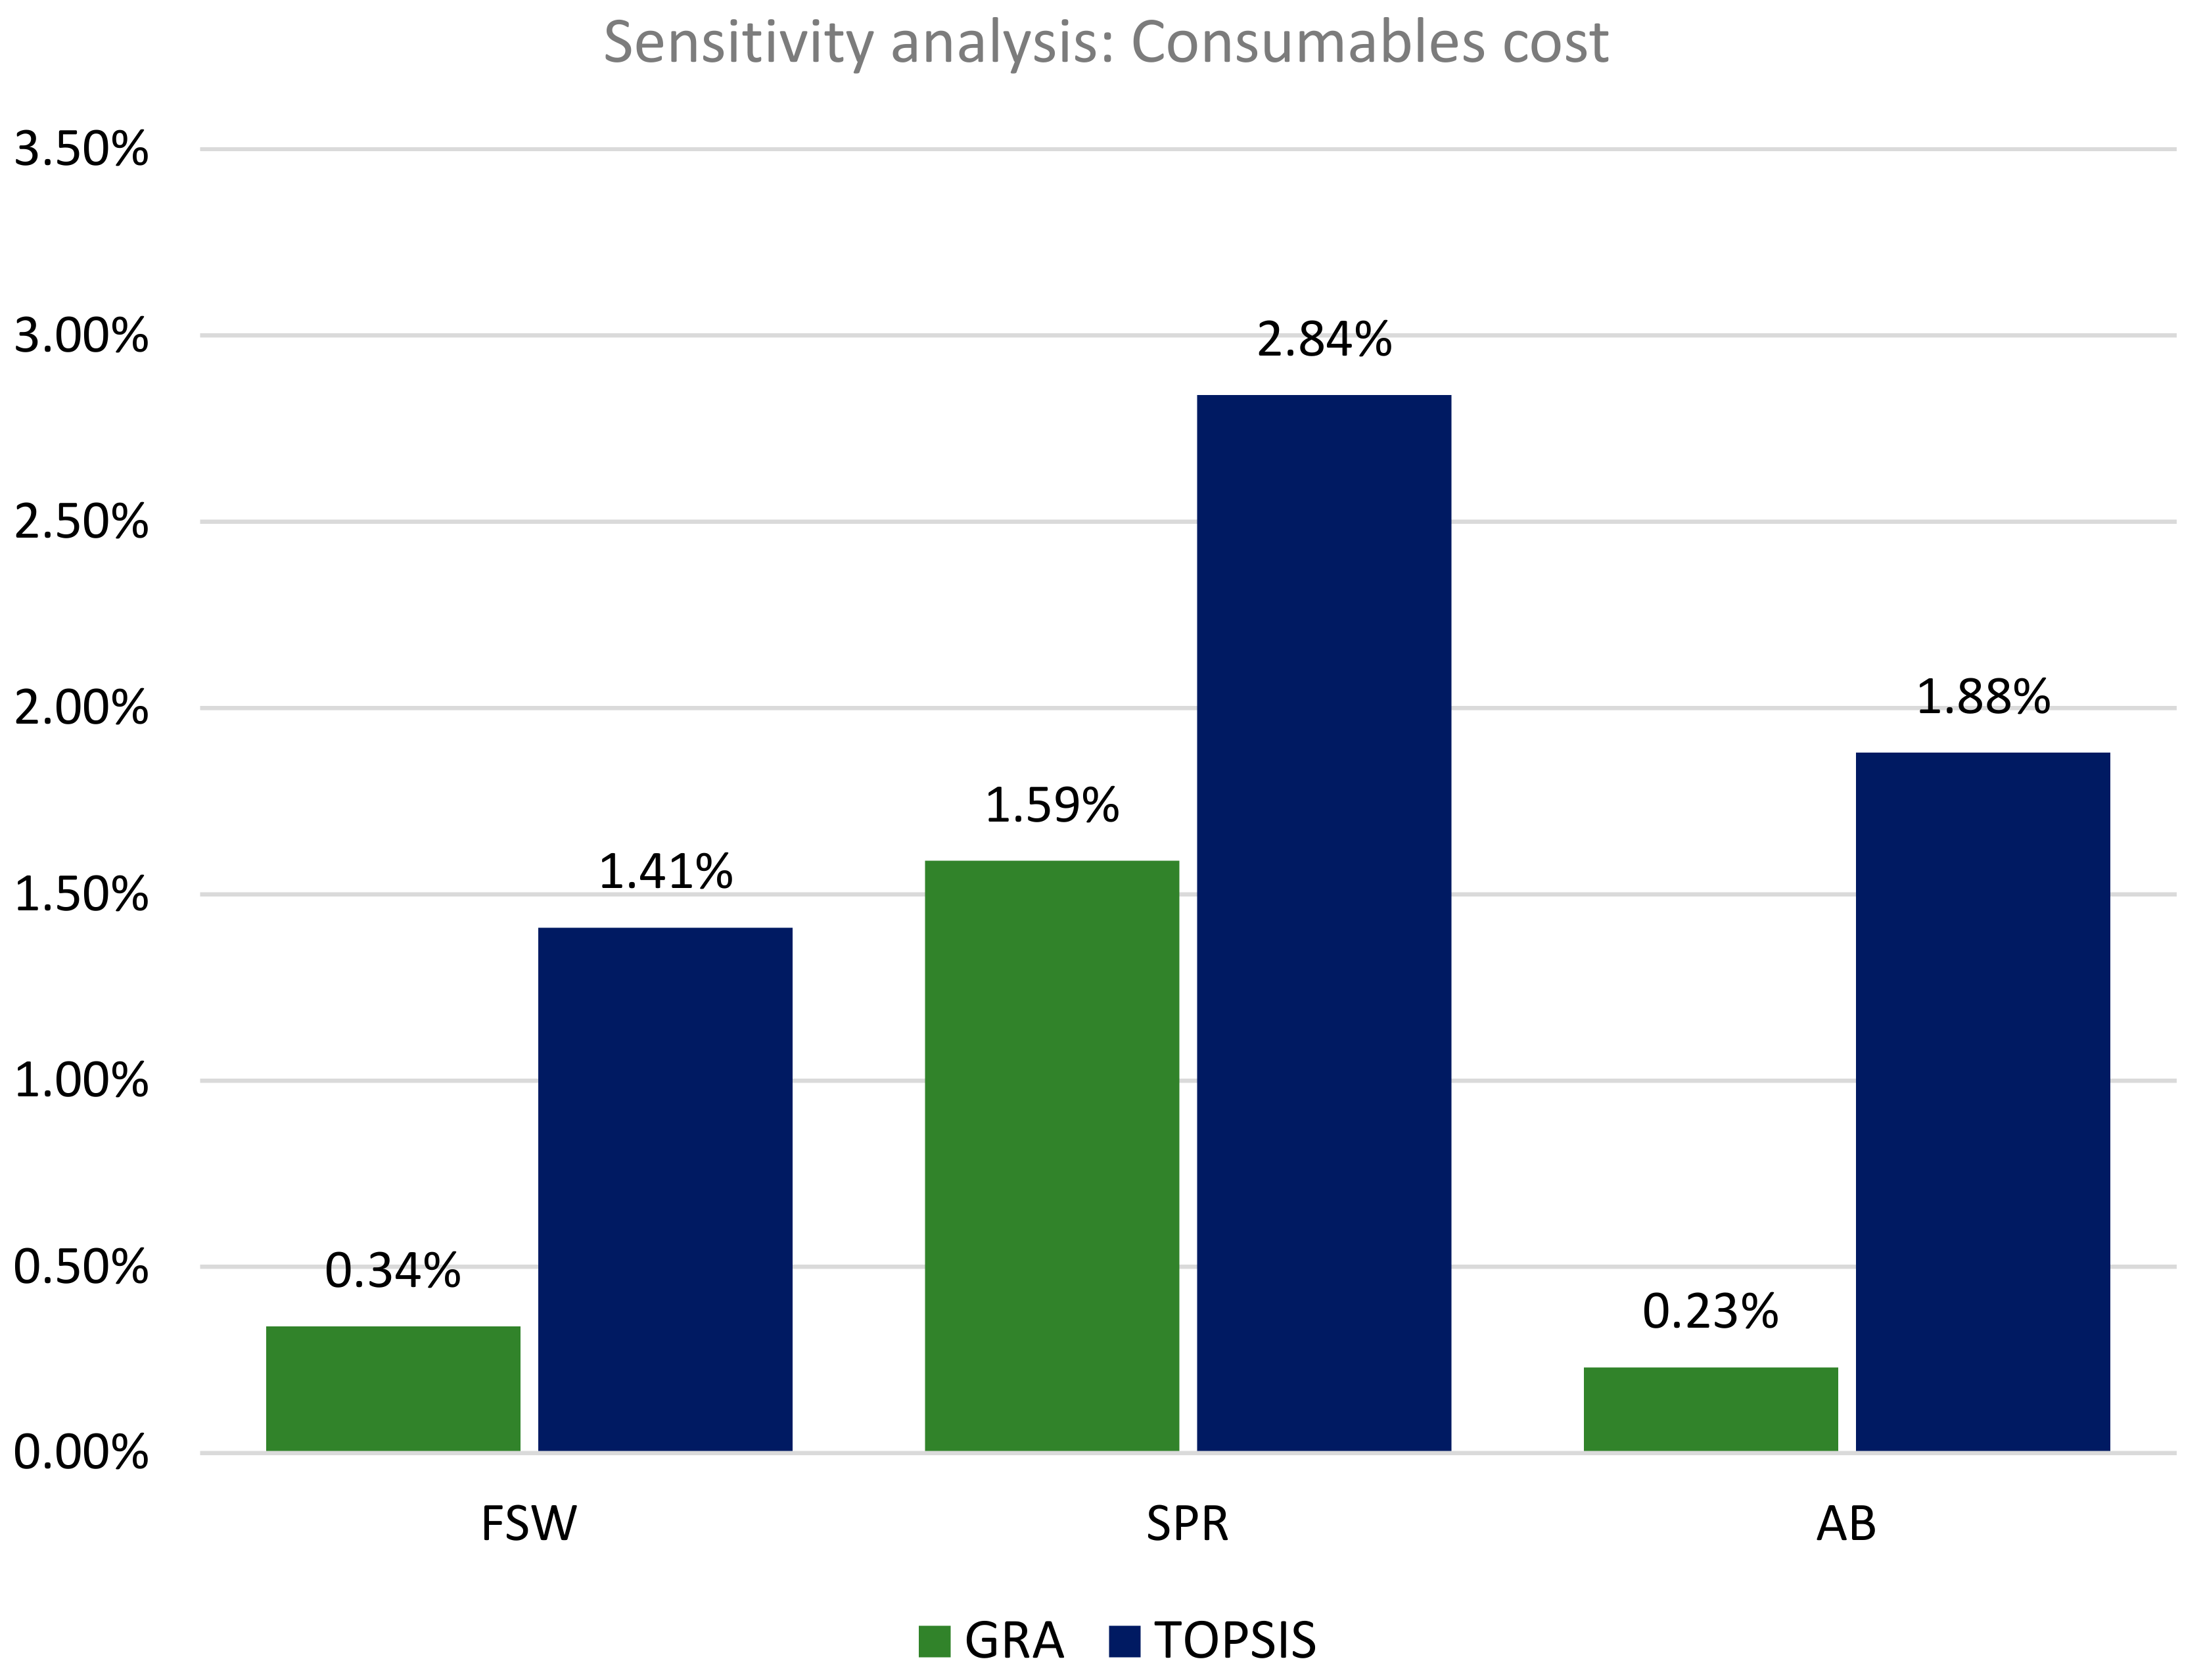
2.4. Sensitivity Analysis

In MCDM approaches, the input data, encompassing indicator weights and values, are typically presumed to be deterministic, forming the basis for calculating the final scores. However, due to the nature of industrial processes, fluctuations in input data are inevitable. Hence, performing sensitivity analysis becomes necessary for resultant score validation. If minor alterations in an input indicator lead to notable alterations in the resulted scores, it indicates sensitivity of the process to that specific indicator. This suggests that more precise calculation of the indicator is needed or that there is a need to adjust the MCDM method used to ensure the validity of the results [22]. Once satisfaction is achieved based on sensitivity analysis, decision-makers can proceed to ranking the processes based on their aggregated scores. Several frequently used sensitivity analysis methodologies can be employed to analyze the sustainability of industrial processes.

2.4.1. Linear Regression Analysis (LRA)

LRA is widely used due to its simplicity. However, it is not suitable when there are non-linear or non-monotonic relationships, and or when indicators have a high level of interaction and interdependence. The fundamental concept of this method is to linearly correlate the indicators to the output [23]. The LRA approach has two main steps:
Step 1: Estimating the regression coefficients that offer a measure of the model’s sensitivity to an indicator by Equation (11).
y = b 0 + i = 1 n b i x i
where b i represents the regression coefficients for indicator x i ( i = 1, 2, …, n).
Step 2: Obtaining the absolute standardized regression coefficient (SRC) by Equation (12).
S R C i = b i S i S
The S R C i is taken as the sensitivity score, where S i and S are the standard deviations estimated for i th indicator and the output y , respectively.

2.4.2. Sensitivity Index

The sensitivity index method requires the decision-maker to determine the relative variation in the output resulting from adjusting the input over its range. It is calculated using Equation (13).
S I = U m a x U m i n U m a x
where SI represents the sensitivity index. U m a x   a n d   U m i n reflect the maximum and minimum output values that result from modifying the input within its whole range of values, respectively.

3. Case Study

This study utilized the proposed framework to compare three metal-to-plastic joining processes: adhesive bonding (AB), self-piercing riveting (SPR), and friction stir welding (FSW). AB is a conventional joining method that employs a polymeric adhesive ingredient to establish a joint between the joining surfaces, the adhesion of two surfaces caused by intermolecular forces, whereas cohesion refers to the bonding strength of the adhesive material itself as shown in Figure 3. SPR is a high-speed mechanical fastening procedure used to bind sheet material at several points [24], as shown in Figure 4. FSW is a relatively new promising solid-state welding technique, which is illustrated in Figure 5. The main objective is to determine the most sustainable process for the application of joining one-meter-long aluminum 6061 to nylon 6/6 sheets.
To perform the assessment, the framework shown in Figure 1 is implemented. The indicator selection technique outlined in Section 2.1 is used to identify twelve sustainability indicators for manufacturing processes. These indicators were picked from publicly accessible indicator sets to quantify sustainability in manufacturing processes after multiple rounds of thorough brainstorming and research [15]. The indicators were then classified into four groups as shown in Figure 6. Physical performance adds another dimension to traditional sustainability, which is frequently mentioned in the literature [2,21]. This dimension is required to highlight the significance of measuring the product quality of a process in terms of sustainability. The technique for indicator classification is mostly based on NIST’s indicator categorization framework, with modifications to suit this case study [28]. The indicators chosen for this case study are as the following.
  • CO2 emission is determined based on the total energy consumed during the process. A mass of 0.371 kg of CO2 is produced per kWh of energy consumed [29].
  • Energy consumption: for FSW, it is the power consumption data for the CNC milling; for SPR, it is the energy consumption of each rivet joint (which is 0.003 kWh/joint based on welding institute data [30]) multiplied by the number of rivets (which is forty for this study); and for AB, the power consumption was obtained from the literature [31].
  • External material usage (g): the materials used to produce the joints in each process. FSW is a direct joining method and does not require external materials. In the case of SPR, the rivets are assumed to be external material.
  • Energy cost ($) is calculated based on the electric power charge rate in UAE [29].
  • Production speed (min) represents the time needed to join the materials. The average time for implementing one rivet is estimated to be 1.5 s [32], which results in a total time of one minute to implement 40 rivets. For the FSW case, the time is calculated based on the welding speed used to join the materials at 40 mm/min. For AB, the processing time is obtained by timer.
  • The Consumable cost ($) for SPR and AB processes is the cost of the rivets and bonding adhesive, respectively. For FSW, the welding tool is assumed to be consumable using Equation (14), and the tool life length used for this study is 2000 m [33].
T o o l c o s t × w e l d   l e n g t h t o o l   l i f e   l e n g t h
  • Recordable injury: the recordable injuries reported by the US Bureau of Labor Statistics for the year 2020 are used to symbolize safety in this analysis [34].
  • Job satisfaction ($/h): in this case study, the average hourly wage for the workers in each process is taken as the primary indicator of job satisfaction [35,36,37].
  • Research community engagement: scientific articles released by R&D personnel serve as a model for future efforts to the scientific community to improve product reliability and performance. The number of published articles for each process was obtained for the time 2013 to present (2023) from a Scopus search for the keywords “Friction stir welding” for FSW, “Self-piercing riveting” for SPR, and “Adhesive bonding” for AB [38,39,40].
  • Max shear load: the ultimate tensile shear strength is represented by the highest load in the force-displacement curve. The force–displacement curves shown in Figure 7 for FSW and AB data were acquired experimentally using the tensile test. The SPR data were obtained from the literature [41].
  • Ductility: ductility is another joint characteristic that reflects the joint ability to be deformed without losing toughness. Ductility is expressed in terms of elongation percent in Equation (15).
    E l o n g a t i o n % = l l 0 l 0 × 100
    where   l 0 and l are the specimen length before and after running the tensile test, respectively.
  • Toughness (Nm): a material’s capacity to absorbed energy and deform plastically without fracturing. The area under the curve is used to obtain this value.
Table 3 shows the quantification method and type of each indicator, and the matrix used to obtain the assessment results is illustrated in Table 4.

4. Assessment Model and Results

The main steps of the assessment are illustrated in Figure 8. Initially, each of the selected indicators was quantified as per Table 3. Objective weight assignment was then conducted using the entropy method; Figure 9 displays the assigned weights assigned. Notably, toughness received the highest weighting due to significant differences in indicator values among FSW, SPR, and AB. Conversely, job satisfaction received the lowest weighting due to similar indicator values. In next step, the normalization was performed using both GRA and TOPSIS methods for comparison. Table 5 and Table 6 show the normalized decision matrix based on GRA and TOPSIS methods. Subsequently, the results were aggregated, and the processes were ranked in descending order of scores; the aggregated scores are shown in Figure 10. According to the MCDM findings, SPR had the highest aggregated score, followed by FSW and AB in both methods used in the study.
Finally, sensitivity analysis was conducted using the sensitivity index. Figure 11 and Figure 12 illustrate the changes in sustainability scores due to variations in production speed and consumable cost indicators, respectively. The changes for both methods were relatively small and did not affect the ranking of the alternatives. This suggests that the GRA, TOPSIS, and Entropy methods employed in this study were sufficient for evaluating the processes’ sustainability. Nonetheless, each process performed differently when compared across different indicators. For instance, FSW is the best process based on the consumable cost indicator since it has the lowest value. However, it is the worst based on toughness values. AB is the safest process since it has the least number of injuries reported. However, in terms of energy usage, it is the worst. Ultimately, the decision between AB, SPR, and FSW will be based on the demands of the application and the priorities of the stakeholders. A sustainability assessment utilizing MCDM techniques can provide stakeholders with a general sustainability score that they may employ to base their decisions on their requirements and objectives.

5. Conclusions

A thorough sustainability examination of friction stir welding (FSW) was conducted through a comprehensive sustainability assessment model, which involved comparative analyses with established joining techniques such as adhesive bonding (AB) and self-piercing riveting (SPR). The evaluation included rigorous methodologies, including indicator quantification, weight determination through the Entropy method, normalization employing both GRA and TOPSIS methods, as well as result aggregation and sensitivity analysis. The MCDM results emphasized the higher sustainability performance of the SPR process scoring an average sustainability score of 75.3%, with FSW and AB closely trailing, scoring an average sustainability score of 54.2% and 35.3% respectively.
In the context of conventional joining methods such as SPR and AB, and despite coming second in the sustainability assessment, FSW still emerges as a promising and sustainable alternative to similar joining methods. Moreover, its confirmed ability to proficiently unite hybrid structures, spanning diverse material combinations like metals to polymers, introduces avenues for innovative and sustainable manufacturing practices. This inherent versatility holds transformative potential for reshaping product designs across a spectrum of industries.
In conclusion, the presented comprehensive sustainability assessment has provided valuable insights into the environmental performance of various joining techniques, notably emphasizing the promising sustainability prospects of friction stir welding (FSW). It is crucial to outline potential avenues for future research that could contribute to an improved understanding of sustainable joining processes and their implications.
  • There exists an opportunity to delve deeper into the optimization of process parameters within the FSW technique. Future studies could uncover ways to further enhance the sustainability performance of FSW by systematically exploring the impact of different process parameters. This optimization attempt aims to improve the process for increased efficiency and reduced environmental impact.
  • Integrating a comprehensive life cycle assessment (LCA) into the evaluation framework represents a promising direction for future research. Such integrated approach will lead to more informed decision-making for sustainable manufacturing practices.
Incorporating these future research directions will foster the ongoing development of sustainable manufacturing practices, offering solutions that align with both environmental and industrial needs.

Author Contributions

All authors took part in both the conception and development of the methodology for this study. Experimentation, material preparation, and data collection were performed by A.A.B. under the supervision of B.M.D. and M.A.N. All authors contributed to the analysis and discussion. The first draft write-up was prepared by A.A.B. and A.A.A. All authors commented and gave feedback on previous versions of the manuscript. All authors have read and agreed to the published version of the manuscript.

Funding

This work was funded by American University of Sharjah under grants FRG21-M-90, FRG21-M-91 and FRG23-C-E20. The work in this paper was supported, in part, by the Open Access Program from the American University of Sharjah.

Institutional Review Board Statement

Not applicable.

Informed Consent Statement

Not applicable.

Data Availability Statement

Data is contained within the article.

Acknowledgments

The support of American University of Sharjah through research grants FRG21-M-90, FRG21-M-91 and FRG23-C-E20 is acknowledge.

Conflicts of Interest

The authors declare no competing interests.

References

  1. Tan, H.X.; Yeo, Z.; Ng, R.; Tjandra, T.B.; Song, B. A Sustainability Indicator Framework for Singapore Small and Medium-Sized Manufacturing Enterprises. Procedia. CIRP 2015, 29, 132–137. [Google Scholar] [CrossRef]
  2. Saad, M.H.; Darras, B.M.; Nazzal, M.A. Evaluation of Welding Processes Based on Multi-dimensional Sustainability Assessment Model. Int. J. Precis. Eng. Manuf.-Green Technol. 2021, 8, 57–75. [Google Scholar] [CrossRef]
  3. Shahmiri, H.; Movahedi, M.; Kokabi, A.H. Friction stir lap joining of aluminium alloy to polypropylene sheets. Sci. Technol. Weld. Join. 2017, 22, 120–126. [Google Scholar] [CrossRef]
  4. Haghshenas, M.; Khodabakhshi, F. Dissimilar friction-stir welding of aluminum and polymer: A review. Int. J. Adv. Manuf. Technol. 2019, 104, 333–358. [Google Scholar] [CrossRef]
  5. Dalwadi, C.G.; Patel, A.R.; Kapopara, J.M.; Kotadiya, D.J.; Patel, N.D.; Rana, H.G. Examination of Mechanical Properties for Dissimilar Friction Stir Welded Joint of Al Alloy (AA-6061) to PMMA (Acrylic). Mater. Today Proc. 2018, 5, 4761–4765. [Google Scholar] [CrossRef]
  6. Patel, A.R.; Kotadiya, D.J.; Kapopara, J.M.; Dalwadi, C.G.; Patel, N.P.; Rana, H.G. Investigation of Mechanical Properties for Hybrid Joint of Aluminium to Polymer using Friction Stir Welding (FSW). Mater. Today Proc. 2018, 5, 4242–4249. [Google Scholar] [CrossRef]
  7. Khodabakhshi, F.; Haghshenas, M.; Sahraeinejad, S.; Chen, J.; Shalchi, B.; Li, J.; Gerlich, A.P. Microstructure-property characterization of a friction-stir welded joint between AA5059 aluminum alloy and high density polyethylene. Mater. Charact. 2014, 98, 73–82. [Google Scholar] [CrossRef]
  8. Derazkola, H.A.; Elyasi, M. The influence of process parameters in friction stir welding of Al-Mg alloy and polycarbonate. J. Manuf. Process. 2018, 35, 88–98. [Google Scholar] [CrossRef]
  9. Sahu, S.; Mypati, O.; Pal, S.K.; Shome, M.; Srirangam, P. Effect of weld parameters on joint quality in friction stir welding of Mg alloy to DP steel dissimilar materials. CIRP J. Manuf. Sci. Technol. 2021, 35, 502–516. [Google Scholar] [CrossRef]
  10. Zhao, Y.; Luo, Y.; Lu, Y.; He, Y.; Guo, X.; Wang, S.; Cui, H.; Zhang, Y.; Wang, Z. Effect of welding parameters on the microstructures and mechanical properties of double-pass aluminum/magnesium dissimilar metal friction stir lap welding joint. Mater. Today Commun. 2021, 26, 102132. [Google Scholar] [CrossRef]
  11. Veleva, V.; Hart, M.; Greiner, T.; Crumbley, C. Indicators of sustainable production. J. Clean. Prod. 2001, 9, 447–452. [Google Scholar] [CrossRef]
  12. Singh, R.K.; Murty, H.R.; Gupta, S.K.; Dikshit, A.K. An overview of sustainability assessment methodologies. Ecol. Indic. 2012, 15, 281–299. [Google Scholar] [CrossRef]
  13. Ness, B.; Urbel-Piirsalu, E.; Anderberg, S.; Olsson, L. Categorising tools for sustainability assessment. Ecol. Econ. 2007, 60, 498–508. [Google Scholar] [CrossRef]
  14. Veleva, V.; Ellenbecker, M. Indicators of sustainable production: Framework and methodology. J. Clean. Prod. 2001, 9, 519–549. [Google Scholar] [CrossRef]
  15. Joung, C.B.; Carrell, J.; Sarkar, P.; Feng, S.C. Categorization of indicators for sustainable manufacturing. Ecol. Indic. 2013, 24, 148–157. [Google Scholar] [CrossRef]
  16. ISO 14031:2021; Environmental Management—Environmental Performance Evaluation Guidelines. ISO: Geneva, Switzerland, 2021.
  17. Jahan, A.; Mustapha, F.; Sapuan, S.M.; Ismail, M.Y.; Bahraminasab, M. A framework for weighting of criteria in ranking stage of material selection process. Int. J. Adv. Manuf. Technol. 2012, 58, 411–420. [Google Scholar] [CrossRef]
  18. Zhao, R.; Su, H.; Chen, X.; Yu, Y. Commercially available materials selection in sustainable design: An integrated multi-attribute decision making approach. Sustainability 2016, 8, 79. [Google Scholar] [CrossRef]
  19. Janic, M.; Reggiani, A. An Application of the Multiple Criteria Decision Making (MCDM) Analysis to the Selection of a New Hub Airport. Eur. J. Transp. Infrastruct. Res. 2002, 2. [Google Scholar] [CrossRef]
  20. Velasquez, M.; Hester, P.T. An analysis of multi-criteria decision making methods. Int. J. Oper. Res. 2013, 10, 56–66. [Google Scholar]
  21. Ahmed, A.A.; Nazzal, M.A.; Darras, B.M.; Deiab, I.M. A comprehensive multi-level circular economy assessment framework. Sustain. Prod. Consum. 2022, 32, 700–717. [Google Scholar] [CrossRef]
  22. Simanaviciene, R.; Ustinovichius, L. Sensitivity analysis for multiple criteria decision making methods: TOPSIS and SAW. Procedia-Soc. Behav. Sci. 2010, 2, 7743–7744. [Google Scholar] [CrossRef]
  23. Yang, J. Convergence and uncertainty analyses in Monte-Carlo based sensitivity analysis. Environ. Model. Softw. 2011, 26, 444–457. [Google Scholar] [CrossRef]
  24. Vignesh, N.J. Analytical Approach for modelling of Heat generation in low-speed friction riveting of polymer/Aluminium joints. Mater. Today Proc. 2021, 47, 6835–6838. [Google Scholar] [CrossRef]
  25. Czakaj, J.; Sztorch, B.; Romanczuk-Ruszuk, E.; Brząkalski, D.; Przekop, R.E. Organosilicon Compounds in Hot-Melt Adhesive Technologies. Polymers 2023, 15, 3708. [Google Scholar] [CrossRef]
  26. Chen, G.; Zeng, K.; Xing, B.; He, X. Multiple nonlinear regression prediction model for process parameters of Al alloy self-piercing riveting. J. Mater. Res. Technol. 2022, 19, 1934–1943. [Google Scholar] [CrossRef]
  27. El-Sayed, M.M.; Shash, A.Y.; Abd-Rabou, M.; ElSherbiny, M.G. Welding and processing of metallic materials by using friction stir technique: A review. J. Adv. Join. Process. 2021, 3, 100059. [Google Scholar] [CrossRef]
  28. Shaw, F.; Prabir, S.; Che, J.; John, C. Computers and Information in Engineering Conference, W.D.C. Sustainable Manufacturing Indicator Repository. In Proceedings of the ASME 2011 Design Engineering Technical Conferences & Computers and Information in Engineering Conference, Washington, DC, USA, 29–31 August 2011. [Google Scholar]
  29. Carbon Dioxide Emissions from Electricity Usage. Available online: https://carbonfund.org/calculation-methods/ (accessed on 31 March 2023).
  30. Cost of Setup and Running Self-Piercing System. Available online: https://www.twi-global.com/technical-knowledge/faqs/faq-how-much-does-it-cost-to-set-up-and-run-a-self-piercing-riveting-system (accessed on 31 March 2023).
  31. Packham, D.E.; Pacheco-Torgal, F.; Cabeza, L.F.; Labrincha, J.; de Magalhães, A. 15—The environmental impact of adhesives. In Eco-Efficient Construction and Building Materials; Woodhead Publishing: Cambridge, UK, 2014; pp. 338–367. [Google Scholar] [CrossRef]
  32. Ang, H.Q. An Overview of Self-piercing Riveting Process with Focus on Joint Failures, Corrosion Issues and Optimisation Techniques. Chin. J. Mech. Eng. 2021, 34, 2. [Google Scholar] [CrossRef]
  33. Jamal, J.; Darras, B.; Kishawy, H. A study on sustainability assessment of welding processes. Proc. Inst. Mech. Eng. Part B J. Eng. Manuf. 2019, 234, 501–512. [Google Scholar] [CrossRef]
  34. U.S. Bureau of Labor Statistics. Number of Nonfatal Occupational Injuries and Illnesses. Available online: https://www.bls.gov/web/osh/cd_r44.htm (accessed on 4 April 2023).
  35. CNC Set Up Technician Salary. Available online: https://www.mymajors.com/career/computer-numerical-control-set-up-technician-cnc-set-up-technician-/salary/ (accessed on 7 April 2023).
  36. Rivet Machine Operator Salary. Available online: https://www.mymajors.com/career/rivet-machine-operator/salary/ (accessed on 7 April 2023).
  37. Adhesive Bonding Machine Operators. Available online: https://www.mymajors.com/career/adhesive-bonding-machine-operators-and-tenders/salary/ (accessed on 7 April 2023).
  38. Friction Stir Welding Keyword Search. Available online: https://data.mendeley.com/research-data/?repositoryType=NON_ARTICLE_BASED_REPOSITORY&from=2013&search=(Friction%20stir%20welding) (accessed on 20 August 2023).
  39. Adhesive Bonding Keyword Search. Available online: https://data.mendeley.com/research-data/?repositoryType=NON_ARTICLE_BASED_REPOSITORY&from=2013&search=(adhesive%20bonding) (accessed on 20 August 2023).
  40. Self Piercing Riveting Keyword Search. Available online: https://data.mendeley.com/research-data/?repositoryType=NON_ARTICLE_BASED_REPOSITORY&from=2013&search=(self%20piercing%20riveting) (accessed on 20 August 2023).
  41. Wang, J.; Zhang, G.; Zheng, X.; Li, J.; Li, X.; Zhu, W.; Yanagimoto, J. A self-piercing riveting method for joining of continuous carbon fiber reinforced composite and aluminum alloy sheets. Compos. Struct. 2021, 259, 113219. [Google Scholar] [CrossRef]
  42. Karathanasopoulos, N.; Pandya, K.S.; Mohr, D. Self-piercing riveting process: Prediction of joint characteristics through finite element and neural network modeling. J. Adv. Join. Process. 2021, 3, 100040. [Google Scholar] [CrossRef]
  43. United Arab Emirates Electricity Costs. Available online: https://www.globalpetrolprices.com/United-Arab-Emirates/electricity_prices/ (accessed on 31 March 2023).
Figure 1. Sustainability assessment framework.
Sustainability 16 03664 g001
Figure 2. Elements of an indicator [12].
Sustainability 16 03664 g002
Figure 3. Adhesive bonding process [25].
Sustainability 16 03664 g003
Figure 4. Self-piercing process [26].
Sustainability 16 03664 g004
Figure 5. FSW process [27].
Sustainability 16 03664 g005
Figure 6. Sustainability dimensions and selected indicators.
Sustainability 16 03664 g006
Figure 7. Force–displacement curves for the joining processes.
Sustainability 16 03664 g007
Figure 8. Sustainability assessment procedure.
Sustainability 16 03664 g008
Figure 9. Assigned indicator weights using the Entropy method.
Sustainability 16 03664 g009
Figure 10. Aggregated sustainability scores of friction stir welding (FSW), adhesive bonding (AB), and self-piercing riveting (SPR) obtained through GRA and TOPSIS methods.
Sustainability 16 03664 g010
Figure 11. Sensitivity analysis of the effects of production speed on sustainability scores.
Sustainability 16 03664 g011
Figure 12. Sensitivity analysis of the effects of consumables cost on sustainability scores.
Sustainability 16 03664 g012
Table 1. A summary of some of the available indicator models adapted from [1].
Indicator SetOrganizationNumber of IndicatorsLevelDimensions Covered
ISO 14031 [16]International Organization for Standardization (ISO)155GlobalEconomic Environmental Social
Sustainable Manufacturing Indicator Repository (SMIR)National Institute of Standards and Technology (NIST)212GlobalEconomic Environmental Social
OECD Sustainable Manufacturing ToolkitOrganization for Economic Cooperation and Development18ProductEnvironmental
Environmental Performance Index (EPI)Yale University20CountryEconomic Environmental Social
Table 2. AHP intensity of importance [18].
Assigned ValueLevel of Importance
1Equal
3Moderate
5Strong
7Very strong
9Extreme
2, 4, 6, 8Intermediate values
ReciprocalsIf activity i is ascribed to one of the above non-zero numbers when compared to activity j , then j has the reciprocal value when compared to i .
Table 3. Summary of selected indicator types and quantification method.
DimensionIndicatorTypeQuantification Methods
Environmental ProtectionCO2 emission (Kg)Non-beneficialPower consumption × 0.371 [29]
Energy consumption (kWh)Non-beneficialFSW: Power data logger
SPR and AB: Literature [30,31]
External material usage (g)Non-beneficialFSW and AB: Experimental data
SPR: Literature [42]
Economic GrowthEnergy costNon-beneficialEnergy consumption × 0.11 [43]
Production speed (min)Non-beneficialFSW and AB: Experimental data
SPR: Literature [32]
Consumable costNon-beneficialFSW: T o o l   c o s t × w e l d   l e n g t h t o o l   l i f e   l e n g t h
SPR and AB: Joining material cost
Social Well-beingRecordable injuryNon-beneficialLiterature [34]
Job satisfactionBeneficialLiterature [35,36,37]
Research community engagementBeneficialLiterature [38,39,40]
Physical PerformanceMax shear load (KN)BeneficialFSW and AB: Experimental data
SPR: Literature [41]
Ductility (%)BeneficialFSW and AB: Experimental data
SPR: Literature [41]
Toughness (N·m)BeneficialFSW and AB: Experimental data
SPR: Literature [41]
Table 4. Case study indicator matrix.
DimensionIndicatorFSWRivetingAdhesive Bond
Environmental ProtectionCO2 emission (Kg)0.2650.0450.323
Energy consumption (kWh)0.7140.120.87
External material usage (g)02434
Economic GrowthEnergy cost ($)0.0790.0130.096
Production speed (min)25135
Consumable cost ($)0.161.65.45
Social Well-beingRecordable injury6201340430
Job satisfaction ($/h)19.0317.216.64
Research community engagement13,119146,316155,688
Physical PerformanceMax shear load (KN)1.0451.531.125
Elongation (%)8.28.336.48
Toughness (N·m)1.0948.040.974
Table 5. Normalized matrix using GRA.
IndicatorFSWSPRAB
CO2 emission (Kg)0.2091.0000.000
Energy consumption (kWh)0.2081.0000.000
External material usage (g)1.0000.2940.000
Energy cost ($)0.2051.0000.000
Production speed (min)0.2941.0000.000
Consumable cost ($)1.0000.7280.000
Recordable injury0.7910.0001.000
Job satisfaction ($/h)1.0000.2340.000
Research community engagement0.0000.9341.000
Shear load (KN)0.0001.0000.165
Ductility (%)0.9301.0000.000
Toughness (N·m)0.0171.0000.000
Table 6. Normalized matrix using TOPSIS.
IndicatorFSWSPRAB
CO2 emission (Kg)0.6310.1070.769
Energy consumption (kWh)0.6310.1060.769
External material usage (g)0.0000.5770.817
Energy cost ($)0.6320.1040.768
Production speed (min)0.5810.0230.814
Consumable cost ($)0.0280.2820.959
Recordable injury0.4030.8710.280
Job satisfaction ($/h)0.6220.5630.544
Research community engagement0.0610.6840.727
Shear strength (MPa)0.4820.7060.519
Ductility (%)0.6140.6230.485
Toughness (N·m)0.1340.9840.119
Disclaimer/Publisher’s Note: The statements, opinions and data contained in all publications are solely those of the individual author(s) and contributor(s) and not of MDPI and/or the editor(s). MDPI and/or the editor(s) disclaim responsibility for any injury to people or property resulting from any ideas, methods, instructions or products referred to in the content.

