Article

Simultaneous Removal of Arsenate and Fluoride Using Magnesium-Based Adsorbents

Geological Survey of Japan, National Institute of Advanced Industrial Science and Technology (AIST), Central 7, 1-1-1 Higashi, Tsukuba 305-8567, Japan
*
Author to whom correspondence should be addressed.
Sustainability 2024, 16(5), 1774; https://doi.org/10.3390/su16051774
Submission received: 27 December 2023 / Revised: 15 February 2024 / Accepted: 16 February 2024 / Published: 21 February 2024
(This article belongs to the Special Issue Wastewater Treatment and Purification)

Abstract

:
In this study, arsenate, As(V), and fluoride (F) were simultaneously removed from contaminated water using MgO, Mg(OH)2, and MgCO3 as Mg-based adsorbents, as existing studies only focus on their individual removal. The removal performance of As(V) and F followed the order MgCO3 < Mg(OH)2 < MgO. Under the test conditions, MgO and Mg(OH)2 met the environmental standards for As and F (0.01 and 0.8 mg/L, respectively), but MgCO3 did not. The As(V) removal performance was not significantly affected by an increase in the initial F concentration. It was concluded that As(V) was adsorbed and removed more preferentially than F by Mg-based adsorbents because a considerable amount of F remained even when the majority of As(V) was removed. Most arsenic (As)-adsorption data for MgO fit the Langmuir and Freundlich models, whereas those for Mg(OH)2 did not fit either model well. Additionally, the As-adsorption data for MgCO3 fit the Freundlich model but not the Langmuir model. Most of the F-adsorption data for the Mg-based adsorbents fit the Langmuir and Freundlich models. The removal mechanisms of As(V) and F using Mg-based adsorbents were assumed to be predominantly caused by ion-exchange and chemical-adsorption reactions on the adsorbent surface because no magnesium arsenate, magnesium fluoride, or magnesium hydroxide fluoride species were observed in the X-ray diffraction analysis. This research advances the sustainable As–F simultaneous treatment method using inexpensive adsorbents.

1. Introduction

Arsenic (As) and fluoride (F) contamination, both anthropogenic and natural, occur worldwide, with high levels of contamination reported in countries such as China, Pakistan, India, Mexico, Argentina, and Chile [1,2,3,4,5,6,7]. One of the studies on the anthropogenic co-contamination of As and F was conducted by Farooqi et al. (2008), in which the sources of the contamination were fertilizers, combusted coal, and industrial waste [3]. Alarcón-Herrera et al. (2013) studied the co-contamination of As and F in arid and semi-arid regions of Latin America [5]. According to them, As and F contamination results from water–rock interactions were found, where high As concentrations often show a direct relationship with high F concentrations. The origin of As and F in groundwater in Latin America is mainly geogenic by nature, with the primary source identified as volcanic glass and, to a lesser extent, hydrothermal minerals. Additionally, the secondary source was Fe-, Mn-, and Al-oxides/hydroxides and clays [5]. Furthermore, according to Navarro et al. (2017), most of the large-scale contamination of groundwater is of geological origins, such as the oxidation reaction of sulfide minerals in metasedimentary rocks for As and the water–rock interaction with fluorite (CaF2) for F [6].
Toxic substances are often found in industrial effluents, mine effluents, and natural groundwater. Many people in developing regions directly drink contaminated groundwater. The World Health Organization (WHO) guidelines on drinking water quality set a provisional value of 0.01 mg/L for As and introduced the concept of toxic effects on the human body [8]. In Japan, the environmental and effluent standards for As have been established as 0.01 at 0.1 mg/L, respectively. The prevention of As health hazards can only be achieved by properly treating As-contaminated water. Various methods for purifying As-contaminated water have been researched and developed, such as the coprecipitation method using flocculants; the ion-exchange method using ion-exchange resins; adsorption methods using adsorbents such as activated carbon, silica gel, iron-based adsorbents, and aluminum-based adsorbents; microfiltration methods using microfiltration membranes, nanofiltration membranes, ultrafiltration membranes, and reverse osmosis filtration membranes; chemical or biological oxidation methods; and electrocoagulation methods [9,10,11,12]. Despite these various As-removal methods, in developing countries, As treatment methods using inexpensive adsorbents have high potential because of their low cost and easy operation. Among these adsorbents, magnesium (Mg)-based adsorbents are expected to exhibit high As-removal performance.
Yu et al. (2011) investigated the removal of As using MgO- and MgCO3-based adsorbents [13]. They created two types of hydromagnesite (MgCO3-based adsorbents) using Mg(NO3)2 and K2CO3 as raw materials. Each hydromagnesite was then fired to create two types of MgO-based adsorbents. The specific surface areas of the two types of hydromagnesite were approximately 21 and 18 m2/g, respectively, whereas those of the two types of MgO-based adsorbents were approximately 25 and 33 m2/g, respectively. They conducted adsorption tests for arsenite As(III) and arsenate As(V) using the adsorbents. MgO-based adsorbents were shown to have a higher adsorption performance for both As(III) and As(V) than hydromagnesites. Therefore, subsequent studies have only focused on MgO-based adsorbents. The adsorption data for MgO-based adsorbents were applied to the Langmuir and Freundlich models. The adsorption data for As(III) fit the Freundlich model better than that of the Langmuir model. The As(III)-adsorption capacities of the two types of MgO-base adsorbents reached approximately 644 and 252 mg/g at equilibrium concentrations of 7.8 and 4.5 mg/L, respectively. The As(V) adsorption data for MgO-based adsorbents fit the Langmuir model better than the Freundlich model. The maximum capacities of these two types of MgO-based adsorbents for As(V) were approximately 344 and 379 mg/g, respectively [13].
Lin et al. (2023) investigated As-removal using Mg(OH)2-based adsorbents [14]. They conducted As(V) removal tests using monodispersed porous pinecone-like Mg(OH)2, a type of Mg(OH)2-based adsorbent. The Mg(OH)2-based adsorbent was prepared by dissolving MgSO4 and mannitol (C6H14O6) in ultrapure water, sonicating, collecting the precipitate under alkaline conditions, and freeze-drying. The adsorbent consisted of monodispersed pinecone-like spheres with a size of approximately 3 μm and a surface area of 63.1 m2/g. They reported that after As(V) adsorption, the diffraction peaks of Mg(OH)2 completely disappeared, and only the characteristic peak of Mg3(AsO4)2·8H2O was present. Standard adsorption tests were conducted at an adsorbent concentration of 0.5 g/L. Approximately 38% of As was removed at an initial As concentration of 1254 mg/L, corresponding to 945.8 mg/g at equilibrium. The As-removal ratio at 1.1 mg/L was approximately 100%, corresponding to 2.2 mg/g at equilibrium. The As-removal efficiency decreased under acidic and basic conditions. In the pH range of 3–12, the As-removal efficiency was neutrally symmetric after the adsorption equilibrium. Research on the effects of coexisting anions showed that Cl, NO3, and SO42− had little effect on the adsorbent, whereas CO32− and PO43− significantly inhibited As(V) removal. However, in adsorption tests using industrial wastewater, the influence of competing ions on adsorption was not significant. Therefore, they concluded that it is an excellent adsorbent that can be applied to industrial wastewater treatment [14].
However, both As and F are eluted from marine sediments, which may lead to the contamination of the surrounding groundwater and soil. Although F is an essential substance for the human body, its excessive intake is known to cause various health hazards, and the WHO has set a guideline value of 1.5 mg/L for drinking water [8]. Japan has an environmental standard of 0.8 mg/L and effluent standards of 8 mg/L (outside of marine areas) with 15 mg/L (in marine areas) for F. Many studies have reviewed different methods for F-removal, such as coagulation–precipitation, ion-exchange, membrane separation, and adsorption [15,16,17,18]. Pillai et al. (2021) also described that membrane and ion-exchange methods are not regularly used in developing countries such as India because of their high cost and maintenance, whereas coagulation–precipitation, and adsorption are predominantly used in India [18]. Aluminum-, carbon-, and natural-based adsorbents, nanoparticles, and other materials have been investigated for use as adsorbents for F-removal [15,16,17,18]. In addition, much research has been conducted on Mg-based adsorbents for F-removal.
Jin et al. (2015) investigated the removal of F using MgO-based adsorbents [19]. They created porous MgO nanoplates with a BET (Brunauer–Emmett–Teller)-specific surface area of 47.4 m2/g via heating and cooling a mixed aqueous solution of MgCl2 with urea and calcining the resulting precipitate. Additionally, adsorption tests were conducted using MgO-based adsorbents. They reported that when the F-equilibrium concentration was 114.5 mg/L at a pH of 7.0, the F-adsorption capacity was 185.5 mg/g. Moreover, the F-adsorption behavior was better suited to the Freundlich model than the Langmuir model. In addition, they reported that the F-removal rate hardly changed in the pH range of 2 to 11 but rapidly decreased above a pH of 12. They attributed this to the competition for adsorption sites between hydroxide and F ions. Regarding the influence of coexisting anions, they reported that Cl, SO42−, and NO3 had little effect on F-adsorption but inhibited F-removal in the order of HCO3 < CO32− < PO43−. Furthermore, FTIR (Fourier Transform Infrared Spectroscopy) analysis revealed peaks due to the formation of Mg(OH)2 via the reaction with water, the binding of MgO molecules on the adsorbent surface to CO2 molecules in the air, and a new peak that appears to indicate the formation of MgF. Because the carbonate peak was lost in F solutions above 300 mg/L, they concluded that not only surface hydroxyl groups but also surface carbonate can be ion-exchanged with F [19].
Wallace et al. (2019) investigated F-removal using Mg(OH)2-based adsorbents [20]. They conducted fluorine adsorptive removal tests on 11 types of nanomaterials, including brucite (a Mg(OH)2-based adsorbent), and reported that brucite was an adsorbent with excellent F-removal performance comparable to that of ferrihydrite and apatite. A negative relationship was found between the F-adsorption capacity and the specific surface area of the selected nanomaterials. The specific surface area of brucite was reported to be 104.9 m2/g, whereas the F-adsorption capacity at an adsorption equilibrium time of 48 h was 0.59 mg/g, and the F-adsorption capacity relative to the specific surface area was 0.037 mg/m2. They concluded from batch test results that the F-adsorption behavior fit the Freundlich and Redlich–Petrson models better than the Langmuir model. Desorption tests were also performed during the column tests; however, the F-desorption efficiency (4–9%) was low, suggesting the difficulty in reusing the adsorbent [20].
Investigations on the simultaneous removal of As and F have also attracted attention in recent years. Ingallinella et al. (2011) conducted laboratory and pilot scale studies using natural water with As concentrations from 60 to 90 μg/L and F concentrations ranging from 2.4 to 3.2 mg/L [4]. They used polyaluminum chloride (PACl) as a flocculant and, in addition, initially also used sulfuric acid for pH adjustment. After the process, sodium hydroxide was added to reduce residual aluminum in the treated water below a limit value (0.20 mg/L). They reported that their optimized process achieved removal efficiencies of 75–85% for As and 50–55% for F [4]. López-Guzmán et al. (2019) performed the simultaneous removal of As and F from well water using an electrocoagulation process with iron and aluminum electrodes [21]. Although F was removed due to aluminum species generated in the aluminum electrode, the F-removal efficiency decreased in the presence of As because As competed with F for the adsorption sites of the formed aluminum hydroxide, while the high removal efficiency of As was obtained without being affected by F, probably because As was removed due to the coagulant species generated in the iron electrode. They reported that the optimum conditions for their process were a current density of 4.5 mA/cm2, an initial pH of 5, and a treatment time of 15 min, when initial concentrations of As and F were 0.08 mg/L and 5 mg/L, respectively, and under these conditions, the removal ratios of As and F were achieved at approximately 100% and 86%, respectively [21]. Tolkou et al. (2023) investigated the removal of As(III) and F using manganese oxides supported on graphene nanostructures (GO-MnO2) [22]. According to the results, the fluoride removal efficiency increased with increasing arsenic concentrations, and arsenic removal increased with increasing fluoride concentrations, mainly at a neutral pH value. Subsequently, the adsorption behavior of As(III) and F was evaluated using adsorption isotherms. They reported that the Langmuir isotherm model better fit the adsorption of As(III) in the presence of F-, and the Freundlich isotherm model better fit the adsorption of F- in the presence of As(III). Furthermore, their study confirmed the reuse of the GO-MnO2 adsorbent for four cycles of As(III) removal and three cycles for F ions after regeneration treatment using NaOH [22].
As mentioned above, many studies have been conducted on the removal of As and F using Mg-based adsorbents; however, little research has been conducted on the simultaneous removal of As and F. Therefore, the purpose of this study was to obtain basic information on the simultaneous removal of As(V)–F using various types of Mg compounds as Mg-based adsorbents. Simultaneous As(V)–F-removal tests were performed using multiple synthetic contaminated waters in which As(V) and F coexist using three types of Mg-based adsorbents (MgO, Mg(OH)2, and MgCO3). Based on the results obtained from the removal tests, we report the As(V)- and F-removal performance of each Mg-based adsorbent and the analytical results of the As(V)- and F-adsorption behavior using adsorption isotherms.

2. Materials and Methods

The reagents listed in this article were purchased from FUJIFILM Wako Pure Chemical Corporation (formerly Wako Pure Chemical Industries, Ltd., Osaka, Japan) unless specified otherwise.

2.1. Mg-Based Adsorbents

Commercial powder reagents of MgO, Mg(OH)2, and MgCO3 (FUJIFILM Wako Chemical Co.) were used as Mg-based adsorbents. The measured Mg content αMg (%), reagent purity (obtained from αMg and αCa) P (%), median particle size Dp50 (μm), and BET surface area SBET (m2/g) are listed in Table 1. The data in Table 1 were obtained from a previous study [23]. The primary reason for P not equaling 100% was the adsorbed water.

2.2. Synthetic As(V)–F in Multi-Contaminated Water

An aqueous solution of As(V) was prepared by dissolving the Na2HAsO4·7H2O powder reagent in ion-exchanged water. Synthetic As(V)–F-contaminated water was prepared by mixing and diluting the As(V) aqueous solution, a sodium fluoride aqueous solution (F standard solution for ion chromatography analysis), and ion-exchange water at a predetermined ratio. The pH was adjusted to approximately 7 using aqueous HNO3 and NaOH. The initial As concentration CAS0 was 1 mg/L, and the initial F concentration CF0 was 15, 30, or 60 mg/L in synthetic As(V)–F-contaminated water. The pH and ORP, immediately after pH adjustments, are referred to as the initial pH (pH0) and initial ORP (ORP0), respectively.

2.3. As–F Simultaneous Removal Tests

A given amount of the adsorbent was placed in a TPX (polymethylpentene) beaker, and 100 mL of synthetic-contaminated water was added. The maximum adsorbent addition concentration WAd0/V (where WAd0 is the amount of adsorbent added, and V is the liquid volume [L]) in this study was 1–5 g/L for MgO (depending on CF0) and 60 g/L for Mg(OH)2 and MgCO3. The solution was stirred for 24 h. The solution was then centrifuged, filtered (0.45 μm), and stored in a polypropylene bottle. The pH and ORP of the filtered solution were measured using pH and ORP meters (LAQUA F-72, HORIBA, Ltd., Kyoto, Japan), respectively. The As, Mg, and F in the solutions were analyzed using inductively coupled plasma–mass spectrometry (Agilent 7700X, Agilent Technologies, Inc., Hachioji, Japan), inductively coupled plasma–atomic emission spectrometry (SII SPS3500DD, Thermo Fisher Scientific K.K., Tokyo, Japan), and ion chromatography (Thermo Scientific Dionex Integrion RFIC, Seiko Instruments Inc., Chiba, Japan).
The reasons for the difference in WAS0/V between MgO and the other two adsorbents in the removal test are as follows: preliminary tests showed that the MgO adsorbent has a higher As-removal performance than the other two adsorbents and can remove almost 100% of As(V) even at a fairly low WAd0/V. One of the objectives of this study is to confirm whether fluoride affects the As-removal performance of Mg-based adsorbents. To facilitate this confirmation, in this study, the WAd0/V for MgO was set to a lower concentration range than that for the other two adsorbents.

2.4. Preparation of Samples for X-ray Diffraction (XRD) Analysis

To examine the forms of As(V) and F adsorbed with Mg-based adsorbents, MgO, Mg(OH)2, and MgCO3 were adsorbed with As(V) and F, respectively. Synthetic As(V)-contaminated water with a CAS0 value of 10 mg/L was used to prepare As-adsorbed Mg-based adsorbents. Synthetic F-contaminated water with CF0 = 60 mg/L was used to prepare F-adsorbed Mg-based adsorbents. Thereafter, Mg-based adsorbents were added to WAd0/V = 2 g/L of each synthetic contaminated water sample. After stirring for 24 h, the solution was subjected to suction filtration. The collected, filtrated adsorbent was then dried overnight at 40 °C. The constituent phases of the prepared samples were identified using a powder XRD (RINT-2500, Rigaku Co., Akishima, Japan) at GSJ-Lab, AIST.

3. Results

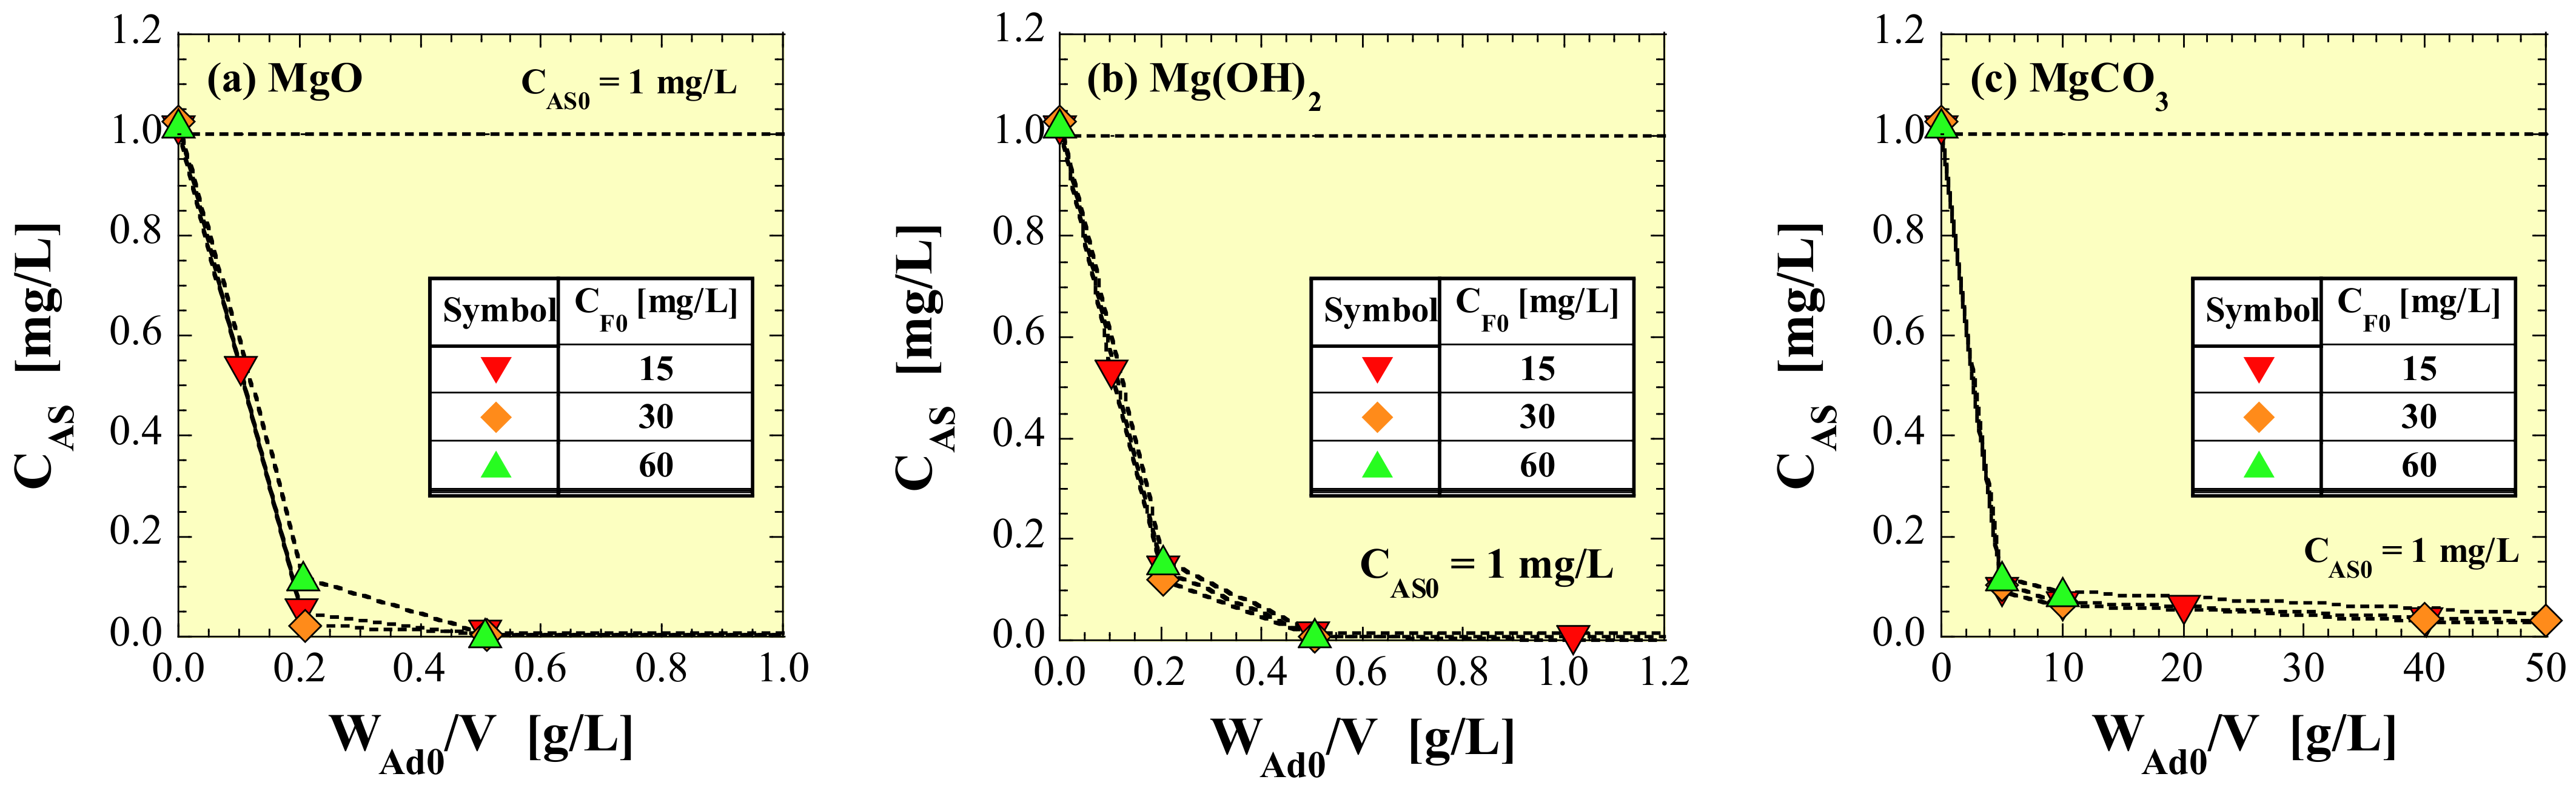
3.1. Residual as Concentration in Treated Water

The residual As concentration in the treated water, CAS [mg/L], obtained from the removal tests is shown in Figure 1. Figure 1a–c show MgO, Mg(OH)2, and MgCO3, respectively.
These figures show that CAS decreased with increasing WAd0/V, regardless of the type of adsorbent or CF0. In addition, for all the Mg-based adsorbents, CAS tended to increase slightly with increasing CF0, but the influence of CF0 on CAS was extremely small. For the same WAd0/V, the CAS values followed the order MgO < Mg(OH)2 < MgCO3. In other words, the As-removal performance followed the order MgCO3 < Mg(OH)2 < MgO. In addition, MgO and Mg(OH)2 met the environmental standards for As (0.01 mg/L) by increasing WAd0/V. Although MgCO3 could meet the effluent standard of As (0.1 mg/L), it could not meet the environmental standard, even at the highest WAd0/V = 60 g/L test conditions used in this study.

3.2. Residual F Concentration in Treated Water

The residual F concentration in the treated water, CF [mg/L], obtained from the removal tests is shown in Figure 2. Similar to Figure 1, Figure 2a–c show MgO, Mg(OH)2, and MgCO3, respectively.
Similar to CAS, regardless of the type of adsorbent and the value of CF0, CF decreased with increasing WAd0/V. The CF values for the same CF0 and WAd0/V were in the order MgO < Mg(OH)2 < MgCO3. In other words, the F-removal performance followed the order MgCO3 < Mg(OH)2 < MgO. This superiority order is the same as that for the As-removal performance. In addition, MgO could meet the environmental standard of F (0.8 mg/L) regardless of CF0. Except for CF0 = 60 mg/L, Mg(OH)2 met the environmental standard for F under the test conditions, and even CF0 = 60 mg/L met the effluent standard for F in areas other than the marine areas (8 mg/L). By contrast, MgCO3 only met effluent standard F at CF0 = 15 and 30 mg/L under the test conditions.
In addition, a comparison of Figure 1 and Figure 2 show that for all three types of Mg-based adsorbents, regardless of CF0, the CF is much higher than zero, even at WAd0/V, where the CAS is close to zero. Thus, it can be concluded that the Mg-based adsorbents adsorbed and removed As(V) preferentially rather than F.

3.3. Leached Mg Concentration in Treated Water

Naturally, the base material of a Mg-based adsorbent (such as the Mg component) leaches into the aqueous solution. The leached Mg concentration in the treated water, CMg [mg/L], obtained from the removal tests, is shown in Figure 3. Figure 3a–c show MgO, Mg(OH)2, and MgCO3, respectively.
Regardless of the type of adsorbent, there was an overall tendency for the CMg to decrease with increasing CF0. However, unlike the behavior of CAS and CF, the behavior of CMg toward WAd0/V varied significantly depending on the type of adsorbent. The CMg for MgO decreases with increasing WAd0/V (Figure 3a). The CMg for Mg(OH)2 tends to increase and then decrease with increasing WAd0/V (CF0 = 15 and 30 mg/L in Figure 3b). The behavior of CMg for MgCO3 appeared to differ depending on CF0; however, overall, CMg seemed to gradually increase alongside the trend of increasing WAd0/V (Figure 3c).

3.4. pH of Treated Water

The pH of the treated water (final pH), pHf, obtained from the removal tests is shown in Figure 4. Figure 4a–c show MgO, Mg(OH)2, and MgCO3, respectively.
The pHf for MgO increased with increasing WAd0/V and then remained almost constant; pHf clearly increased as CF0 increased (Figure 4a). The effects of WAd0/V on pHf for Mg(OH)2 are not clear, but as with MgO, pHf appeared to increase as CF0 increased (Figure 4b). However, the pHf of MgCO3 was not clearly affected by the difference in WAd0/V or in CF0 (Figure 4c).

3.5. ORP of Treated Water
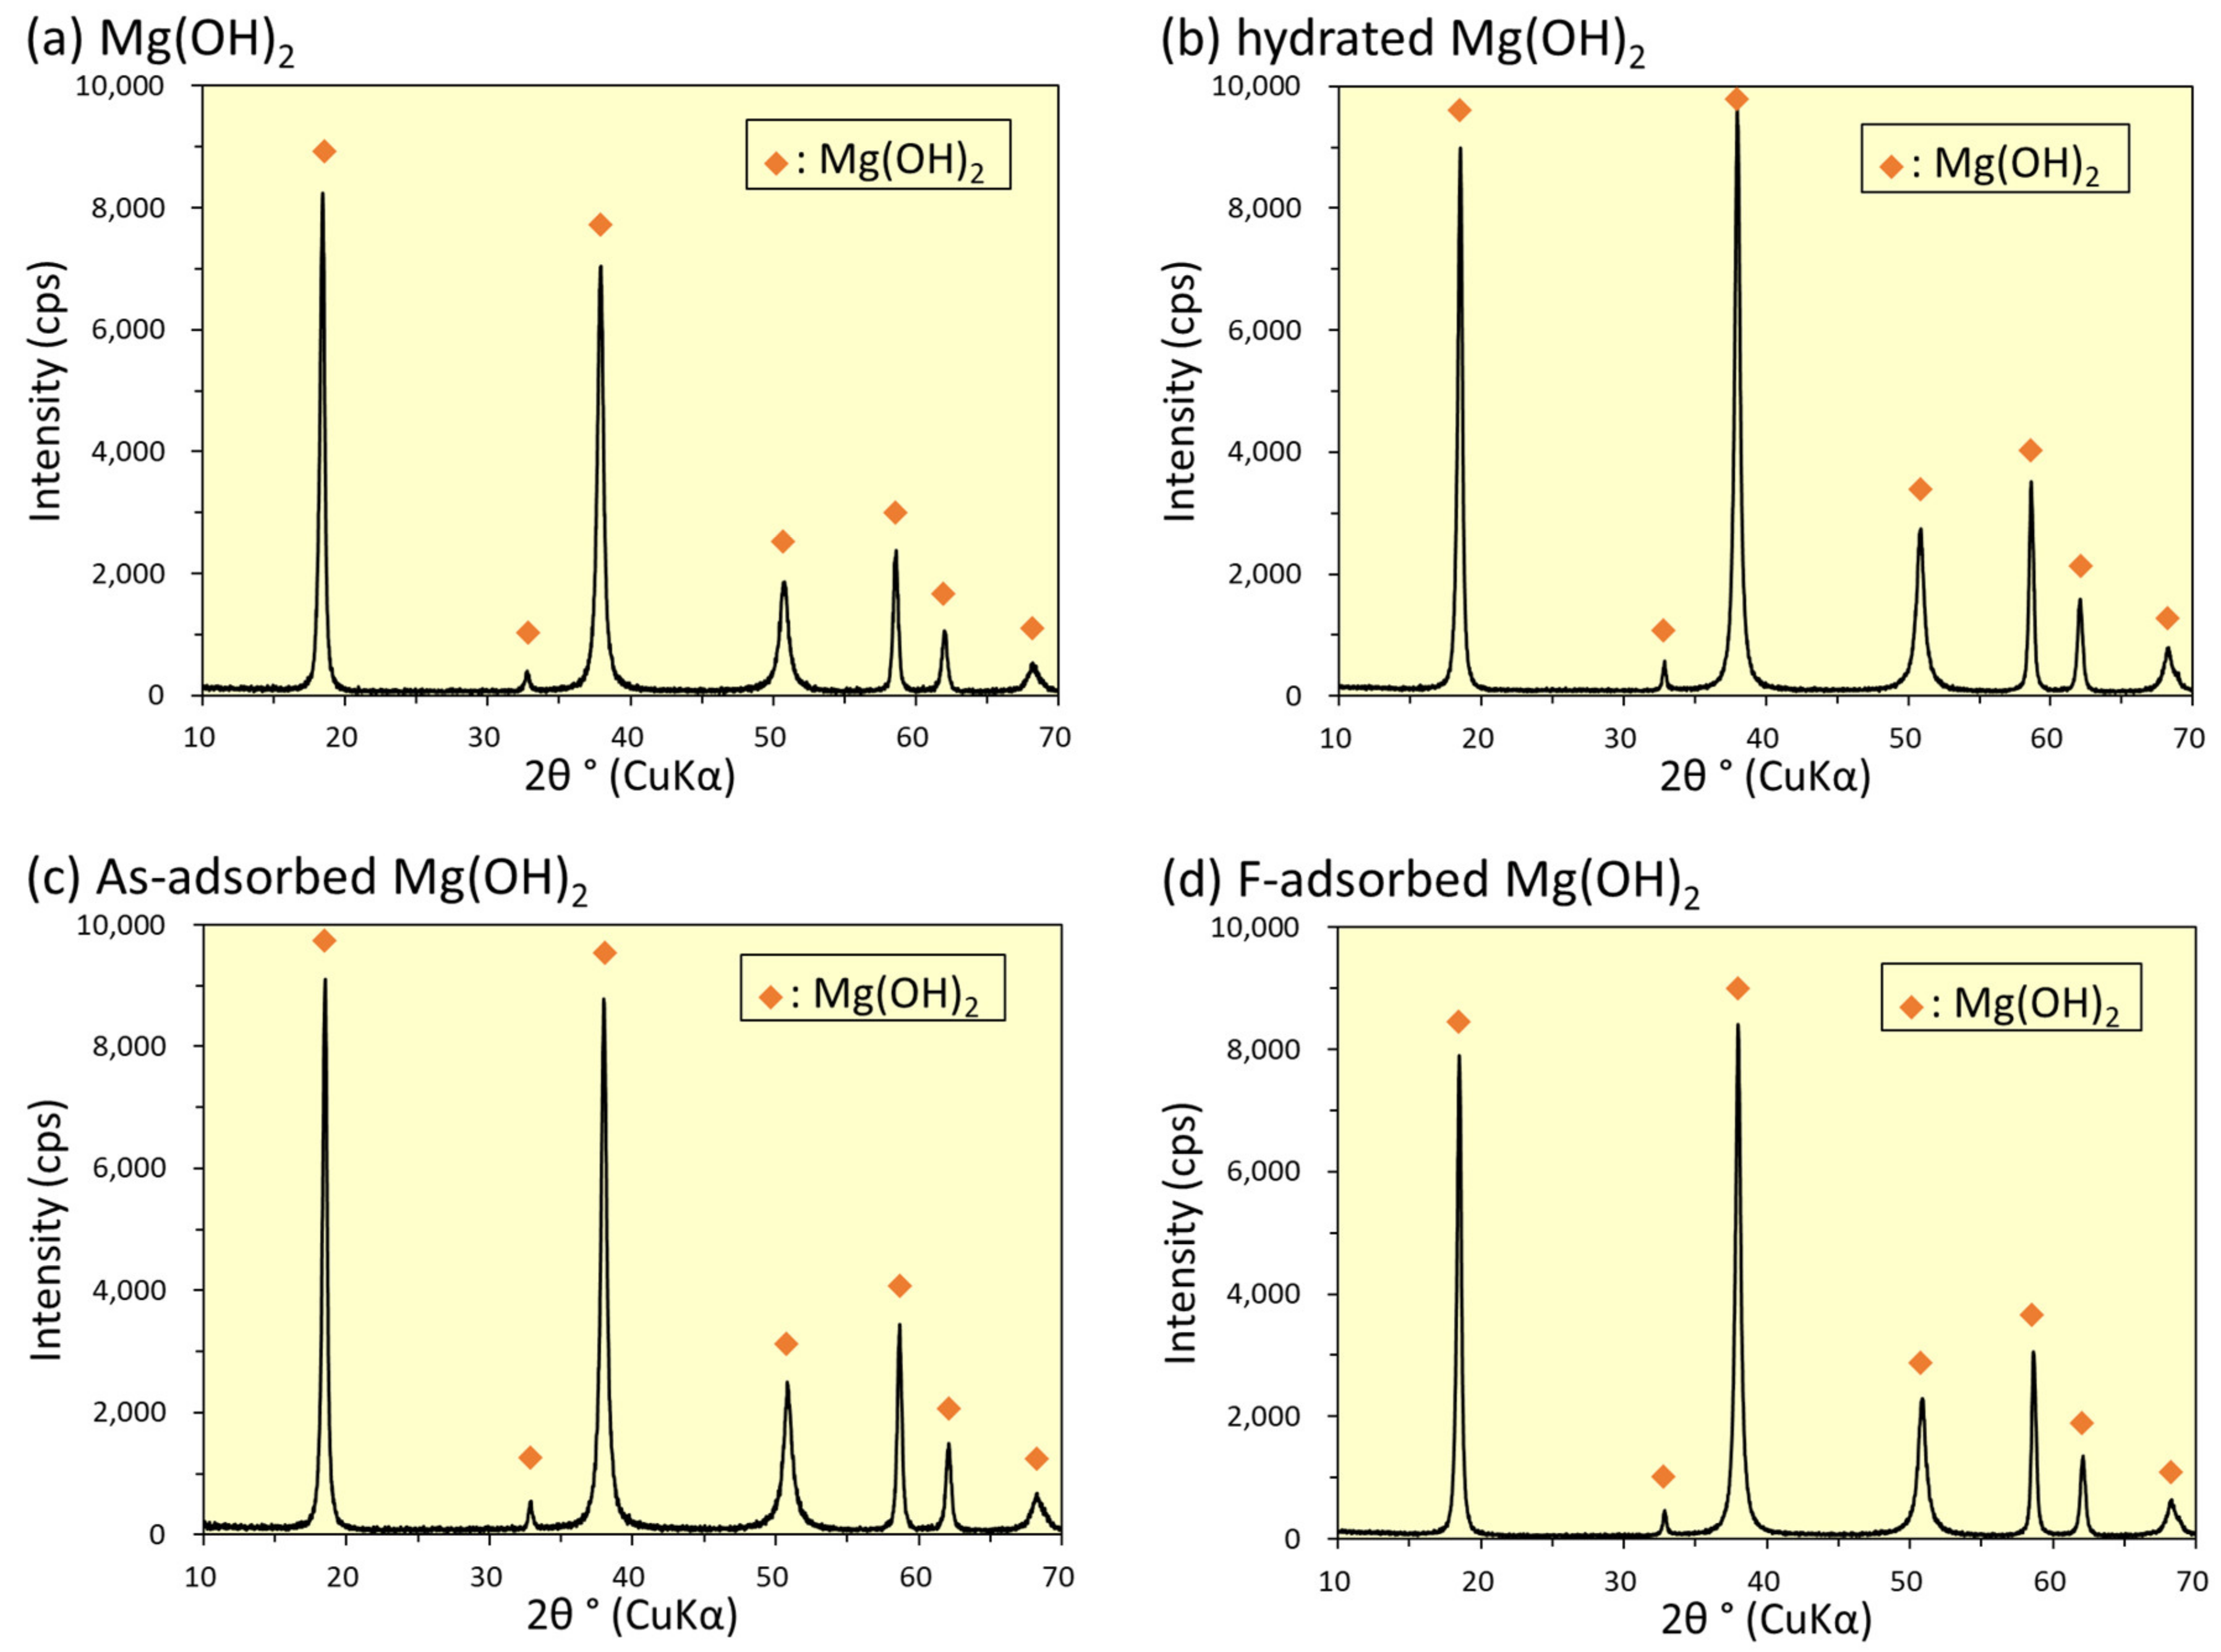
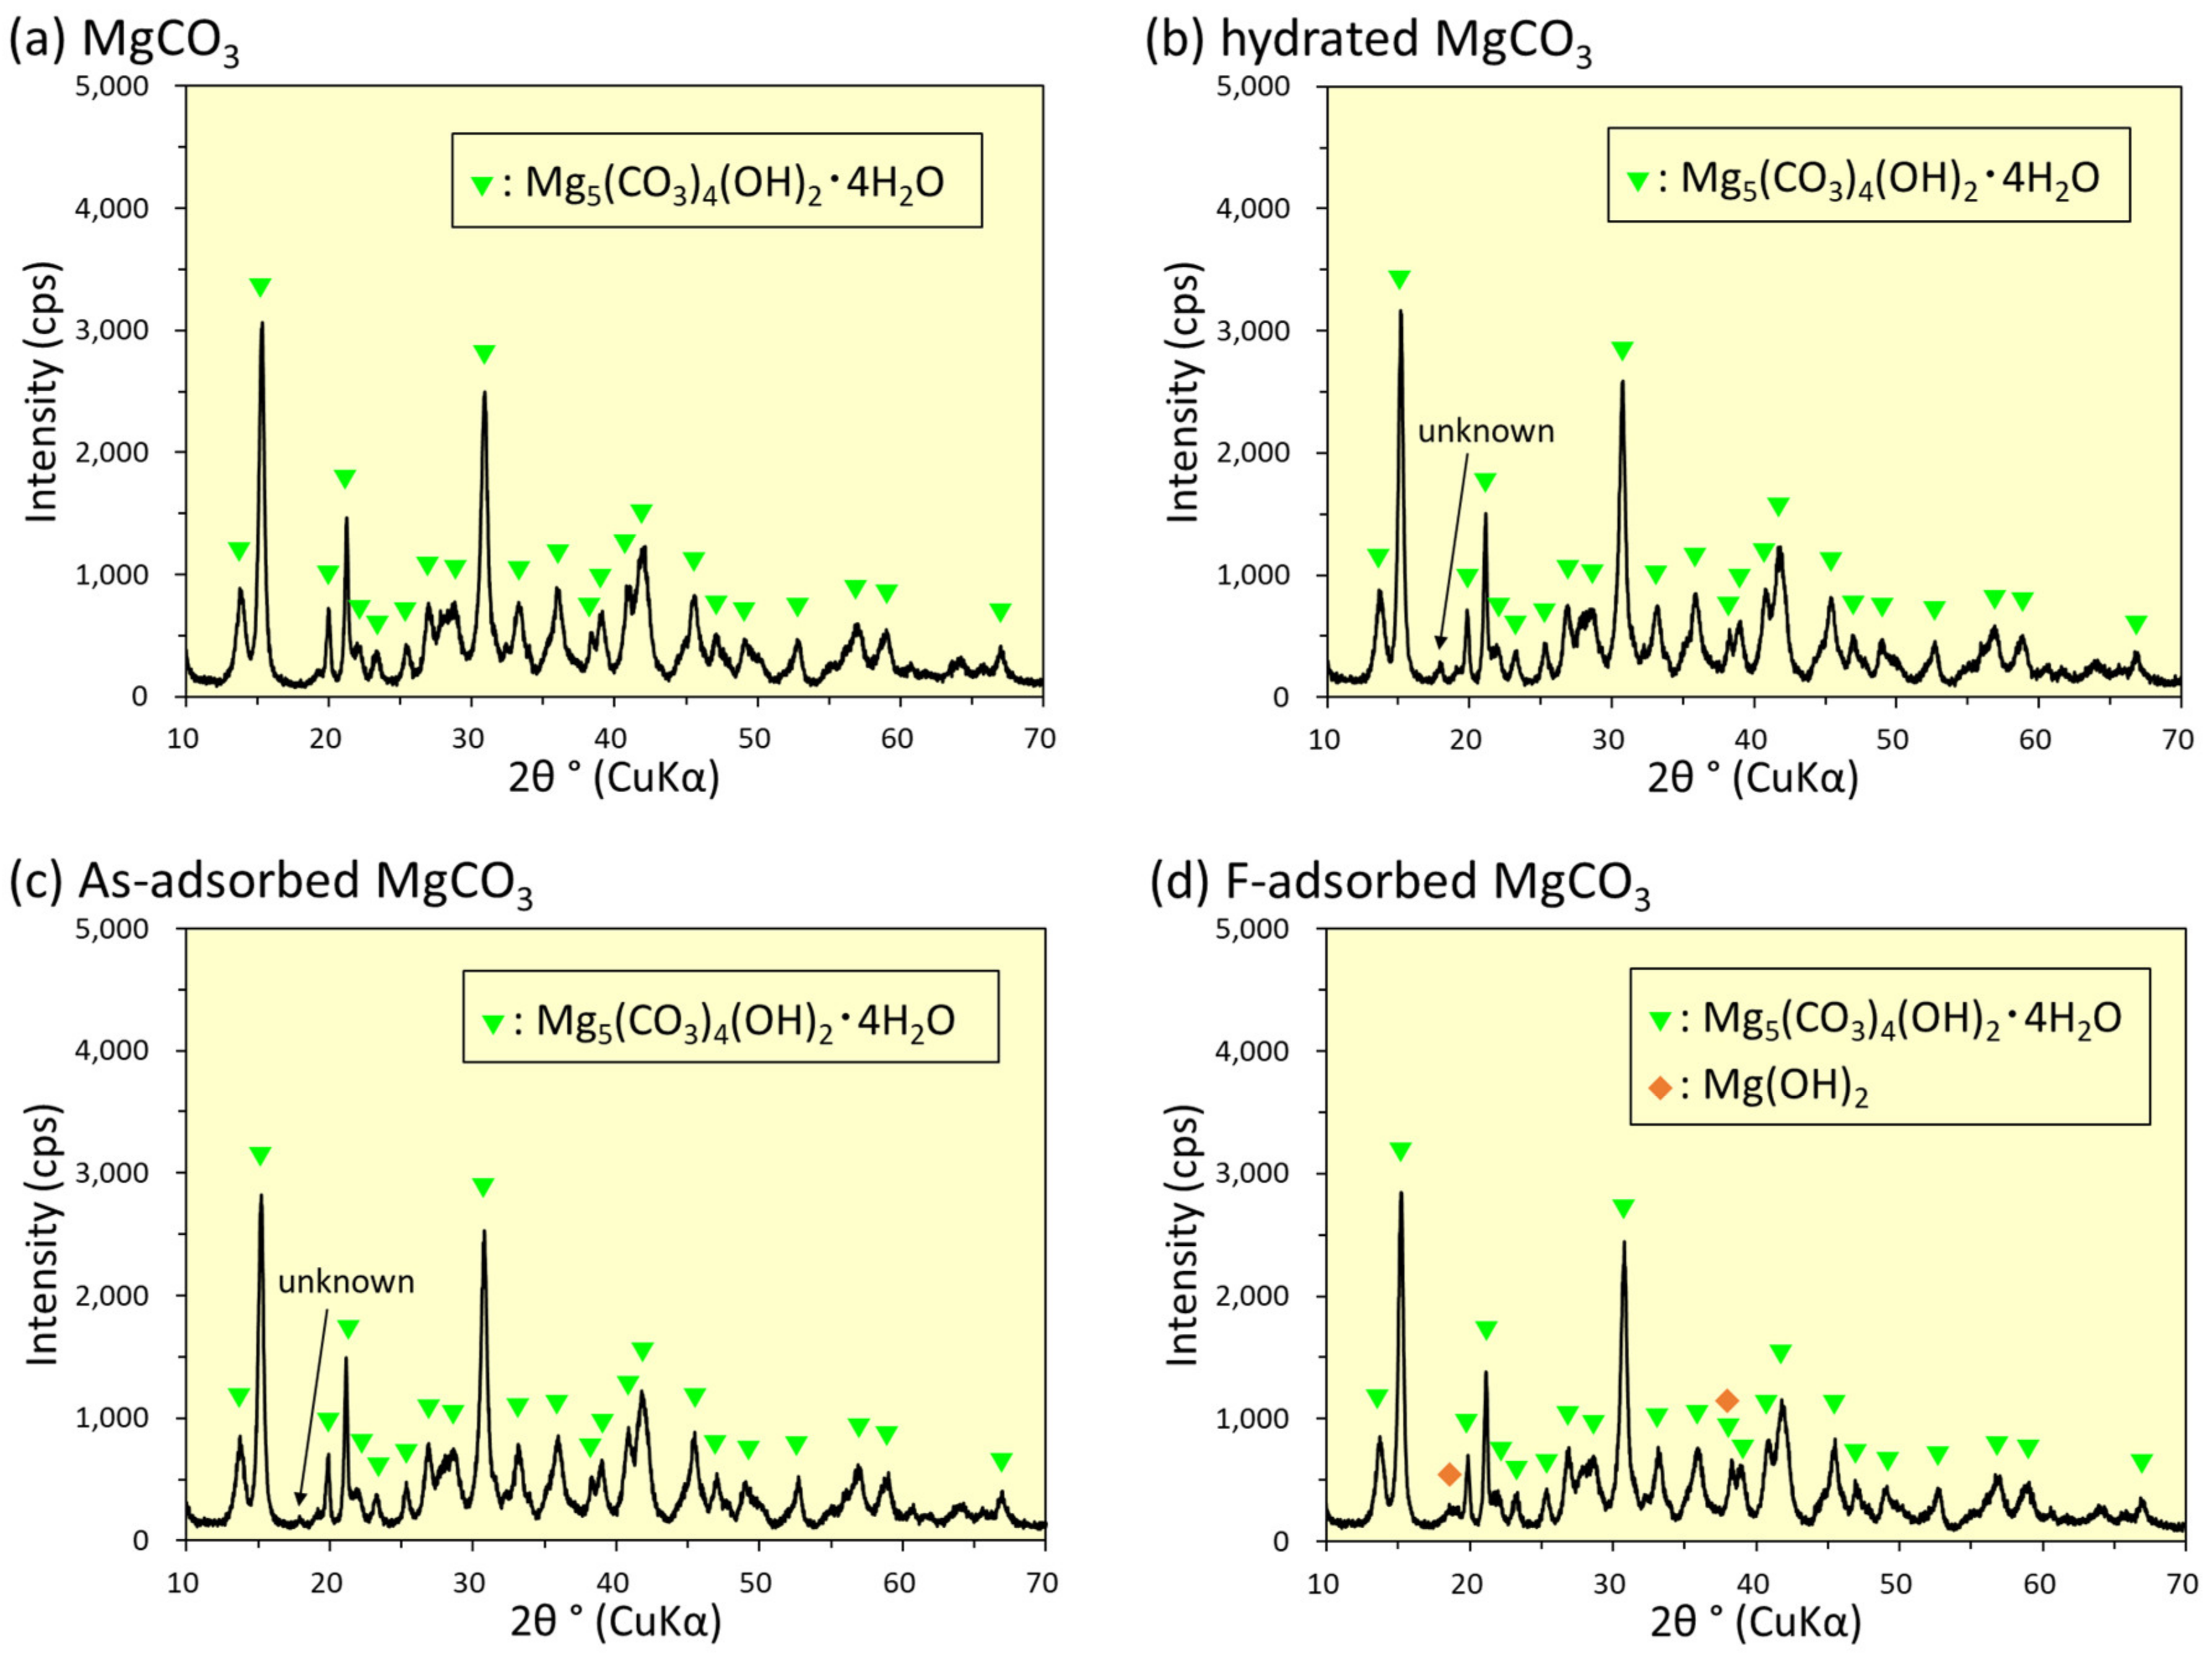
The ORP of the treated water (final ORP), ORPf, obtained from the removal tests is shown in Figure 5. Figure 5a–c show MgO, Mg(OH)2, and MgCO3, respectively.
Contrary to the behavior of pHf, the ORPf for MgO decreased with increasing WAd0/V. In addition, there was a tendency that the higher the ORPf, the lower the CF0. Although the ORPf for MgO did not reach constant values in the test ranges, ORPf might reach constant values if WAd0/V increases further. The ORPf for Mg(OH)2 took relatively high values when WAd0/V was extremely small (approximately 0.2 g/L) and then decreased when WAd0/V was increased slightly. No clear trend was observed in the behavior of ORPf with further increased in WAd0/V (Figure 5b). The ORPf for MgCO3, similar to pHf, was not clearly affected by the difference in WAd0/V or CF0 (Figure 5c).

3.6. XRD Analysis

The results of the powder XRD analysis for MgO, Mg(OH)2, and MgCO3 are shown in Figure 6, Figure 7, and Figure 8, respectively.
Figure 6a–d show the XRD patterns of unused, hydrated, As-adsorbed, and F-adsorbed MgO, respectively. Figure 6a shows the presence of mostly MgO and trace amounts of Mg(OH)2 in unused MgO. However, the distinct peaks attributed to Mg(OH)2 can be seen along with the peaks of MgO in the hydrated MgO sample (Figure 6b), indicating that Mg(OH)2 was formed via the hydration reaction of MgO. Broad peaks (indicated as unknown in Figure 6b) were observed at a lower angle than the peak around 2θ = 18.6°, which is attributed to the basal spacing of Mg(OH)2. The diffraction pattern of the As-adsorbed MgO (Figure 6c) showed peaks of MgO and Mg(OH)2, but the formation of Mg(OH)2 was clearly less than that of hydrated MgO (Figure 6b). No diffraction peaks attributed to the magnesium arsenate species (such as Mg3(AsO4)2 and MgHAsO4) were observed in Figure 6c, as can be seen from the comparison with the XRD profiles of Mg3(AsO4)2·8H2O (hornesite) derived from Rojo et al. (1996) [24] and MgHAsO4·7H2O (rosslerite) derived from Ferraris and Franchini-Angela (1973) [25] shown in Figure 6e. Peaks attributed to MgO and Mg(OH)2 are also observed in Figure 6d, suggesting that Mg(OH)2 formation is comparable to that of hydrated MgO (Figure 6b). No diffraction peaks of the co-precipitated salts (such as MgF2 and Mg(OH)F) were also observed in Figure 6d, as evidenced by comparison with the diffraction data of MgF2 (sellaite) from Baur and Khan (1971) [26] and Mg(OH)F from Crichton et al. (2012) [27] shown in Figure 6f.
Figure 7a shows the XRD pattern of the unused Mg(OH)2 adsorbent. The diffraction pattern obtained corresponded to the crystal structure of Mg(OH)2 (brucite). Figure 8a shows the XRD pattern of the unused MgCO3 adsorbent, and it was a diffraction pattern attributed to the crystalline structure of Mg5(CO3)4(OH)2·4H2O (hydromagnesite).
As in the case of the MgO adsorbent mentioned above, the XRD analysis results for the Mg(OH)2 (Figure 7) and MgCO3 adsorbents (Figure 8) after adsorption showed no evidence of the formation of magnesium arsenate and magnesium fluoride salts. Therefore, it was concluded that the decreases in As(V) and F in the liquid were due to their adsorption onto the adsorbent.

4. Discussion

4.1. As-Removal Ratio

The As-removal ratio, RAS [%], was calculated as follows:
RAS = (CAS0CAS)/CAS0 × 100.
The RAS obtained from Equation (1) is plotted versus WAd0/V in Figure 9. Figure 9a–c show CF0 values of 15, 30, and 60 mg/L, respectively.
Comparing the RAS at the same WAd0/V in Figure 9, the As-removal performance of MgCO3 was the lowest, and those of MgO and Mg(OH)2 were almost the same; however, MgO was slightly better, regardless of CF0.
Although the As valence differs from this study, Tolkou et al. (2023), who conducted a study on the simultaneous removal of As(III) and F, reported that RAS increased with increasing CF0, for example, when CAS0 = 0.1 mg/L, WAd0/V = 2 g/L and pH0 =7, RAS = 84 and 98% at CF0 = 0 and 100 mg/L, respectively [22]. However, in this study, no significant increase in RAS was observed with increasing CF0.
Lin et al. (2023) studied As(V)-removal using their synthesized monodisperse porous pinecone-like Mg(OH)2 (PLMH) [14]. They conducted experiments at various CAS0 (1.1 to 1254 mg/L) and observed the change in RAS (“Remove Efficiency” in their paper) over time. The WAd0/V in their normal tests was 0.5g/L. Although the equilibrium time varied depending on CAS0, their test with CAS0 = 1.1 mg/L, which was similar to our test conditions, showed that RAS reached approximately 100% within 10 min. Considering the results of their studies mentioned above, it is considered that the adsorption was sufficiently in equilibrium because the reaction time in this study was 24 h.

4.2. F-Removal Ratio

The F-removal ratio, RF [%], was calculated as follows:
RF = (CF0CF)/CF0 × 100.
The RF obtained from Equation (2) is plotted versus WAd0/V in Figure 10. Figure 10a–c show CF0 values of 15, 30, and 60 mg/L, respectively.
Comparing the RF at the same WAd0/V in Figure 10, the superiority of the F-removal performance was clearly determined to be MgCO3 < Mg(OH)2 < MgO, regardless of CF0.
Tolkou et al. (2023) also reported that RF increased with increasing CAS0: CF0 = 10 mg/L, WAd0/V = 2 g/L and pH0 =7, RF = 74.7 and 94.3% at CAS0 = 0 and 0.5 mg/L, respectively [22]. However, in this study, no significant increase in RAS was observed with increasing CF0. However, in this study, it was not possible to evaluate the effects of CAS0 on RF because no tests varying CAS0 as a parameter were conducted. In the future, tests varying CAS0 should be added.
In this study, the adsorption of both As and F was expected to be close to an equilibrium state because the reaction time was 24 h, as mentioned in Section 4.1. Therefore, the results of this study cannot determine whether both As(V) and F were adsorbed simultaneously or whether the adsorption of one starts after the adsorption of the other is completed. However, because the adsorption amount of As(V) did not change even if the initial concentration of F changed significantly (Figure 1 and Figure 9), it was inferred that F had no significant effect on the adsorption behavior of As(V).

4.3. Dissolved Forms of As(V) and F in Water

The dissolved forms of As(V) in water are represented by the following dissociation reactions for arsenic acid:
H3AsO4 ⇌ H2AsO4 + H+
H2AsO4 ⇌ HAsO42− + H+
HAsO42− ⇌ AsO43− + H+
where pKa1 = 2.24, pKa2 = 6.96, and pKa3 = 11.5 (25 °C) [28], and the abundance of each dissolved arsenic acid species is determined by the following:
[H2AsO4]/[H3AsO4] = 10 exp (pH−pKa1)
[HAsO42−]/[H2AsO4] = 10 exp (pH−pKa2)
[AsO43−]/[HAsO42−] = 10 exp (pH−pKa3)
For the synthetic contaminated water before adding the adsorbent in this study, the abundances of H3AsO4 and AsO43− were considered to be extremely small and negligible because pKa1 << pH0 << pKa3. Then, substituting the pH0 values (6.50–6.62), the values of [HAsO42−]/[H2AsO4] were calculated to be 0.30–0.46. Therefore, the main dissolved forms of As(V) in synthetic contaminated water were estimated to be H2AsO4 and HAsO42−, while for the treated water, the abundances of H3AsO4 and H2AsO4 were considered to be extremely small and negligible because pKa2 << pH0. Then, substituting the pHf, the values of [AsO43−]/[HAsO42−] were calculated to be 0.18–0.65 for MgO, 0.05–0.12 for Mg(OH)2, and 0.06–0.10 for MgCO3. Therefore, the main dissolved forms of As(V) in the treated water were estimated to be HAsO42− for Mg(OH)2 and MgCO3, and HAsO42− and AsO43− for MgO.
The dissolved forms of F in water are represented by the following dissociation reactions for hydrofluoric acid:
HF ⇌ F + H+
where pKa = 2.67 (25 °C) [28], and the abundance of each dissolved hydrofluoric acid species is determined by the following:
[F]/[HF] = 10 exp (pH−pKa)
From the results obtained by substituting the values of pH0 (6.43–6.62) and pHf (10.0–11.3) into Equation (10), the dissolved form of hydrofluoric acid species in both synthetic contaminated water before adding the adsorbent and treated water was estimated to be approximately 100% F.

4.4. As- and F-Adsorption Amounts per Unit Mass of Adsorbent

To evaluate the As- and F-adsorption data using general adsorption models, it was necessary to calculate the adsorption amount per unit mass of adsorbent QAS and the F-adsorption amount per unit mass of adsorbent QF. However, to determine QAS and QF, it was necessary to recalculate the concentration of the adsorbent remaining in the solid phase because parts of the base materials of Mg-based adsorbents leached into the aqueous solution, as described in Section 3.3. For this purpose, it was first necessary to determine the adsorbent residual ratio γ [%]. The following describes the calculation of γ, QAS, and QF.
The initially added Mg amount, WMg0 [g], is determined using αMg, as shown in Table 1:
WMg0 = (αMg/100) WAd0.
Next, the amount of Mg remaining as a solid phase, WMgf [g], 24 h after adding the adsorbent is calculated.
WMgf = WMg0−(CMg/1000) V.
Because the unit of CMg is [mg/L], it is divided by 1000 to convert the unit to [g]. Assuming that the residual ratio of Mg is equal to that of the adsorbent, γ can be expressed by the following equation:
γ = WMgf/WMg0 × 100.
The concentration of the adsorbent remaining in the solid phase 24 h after adding the adsorbent, WAdf/V [g/L], is as follows:
WAdf/V = (γ/100) WAd0/V.
Therefore, QAS and the QF can be determined using the following equations:
QAS = (CAS0CAS)/(WAdf/V).
QF = (CF0CF)/(WAdf/V).
where the units for both QAS and QF are mg/g.

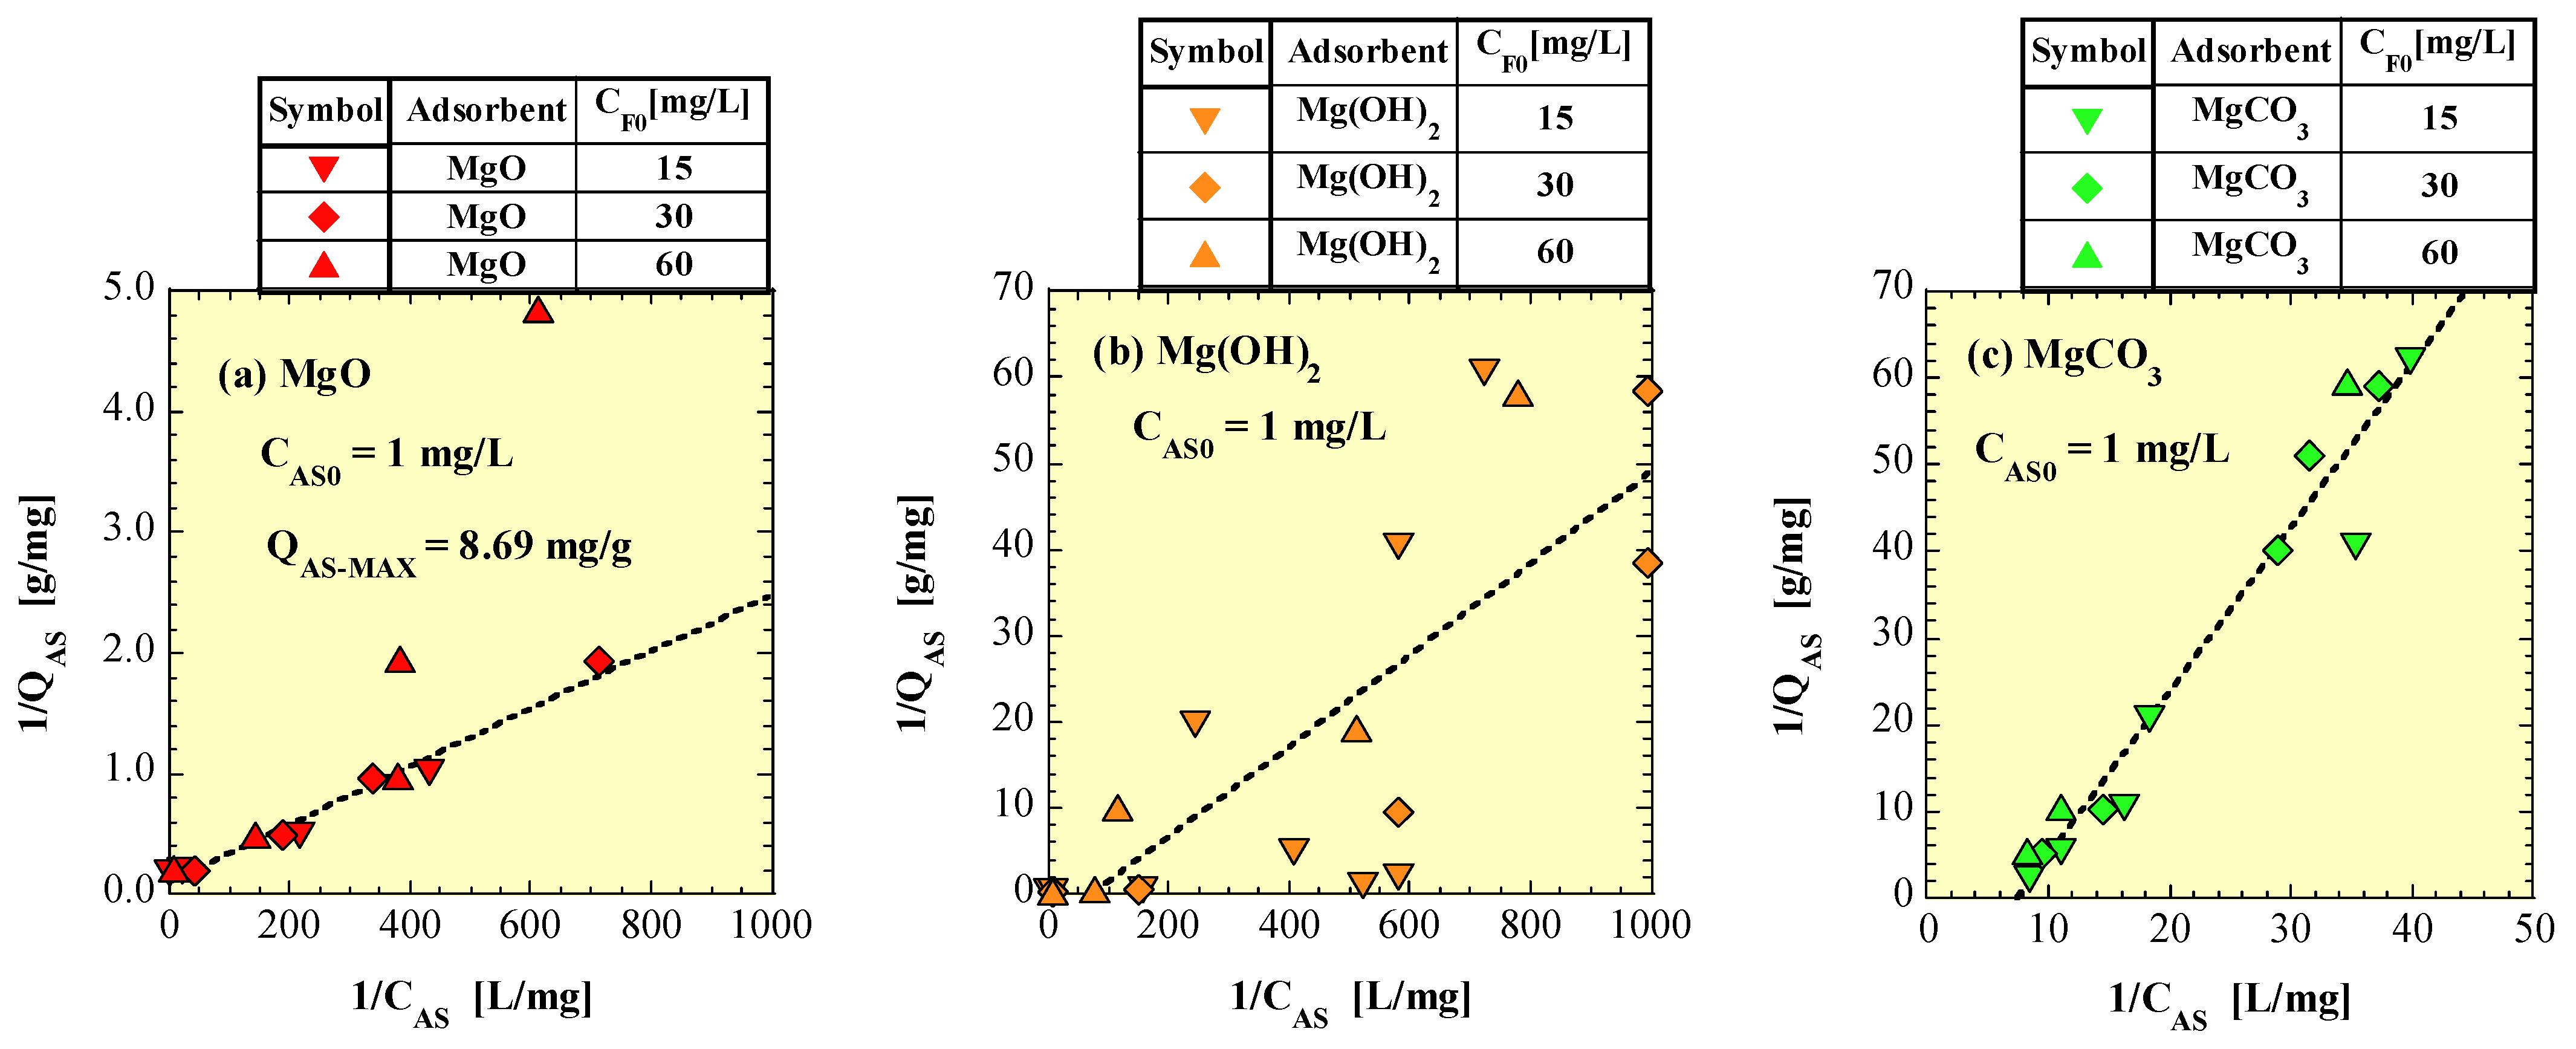
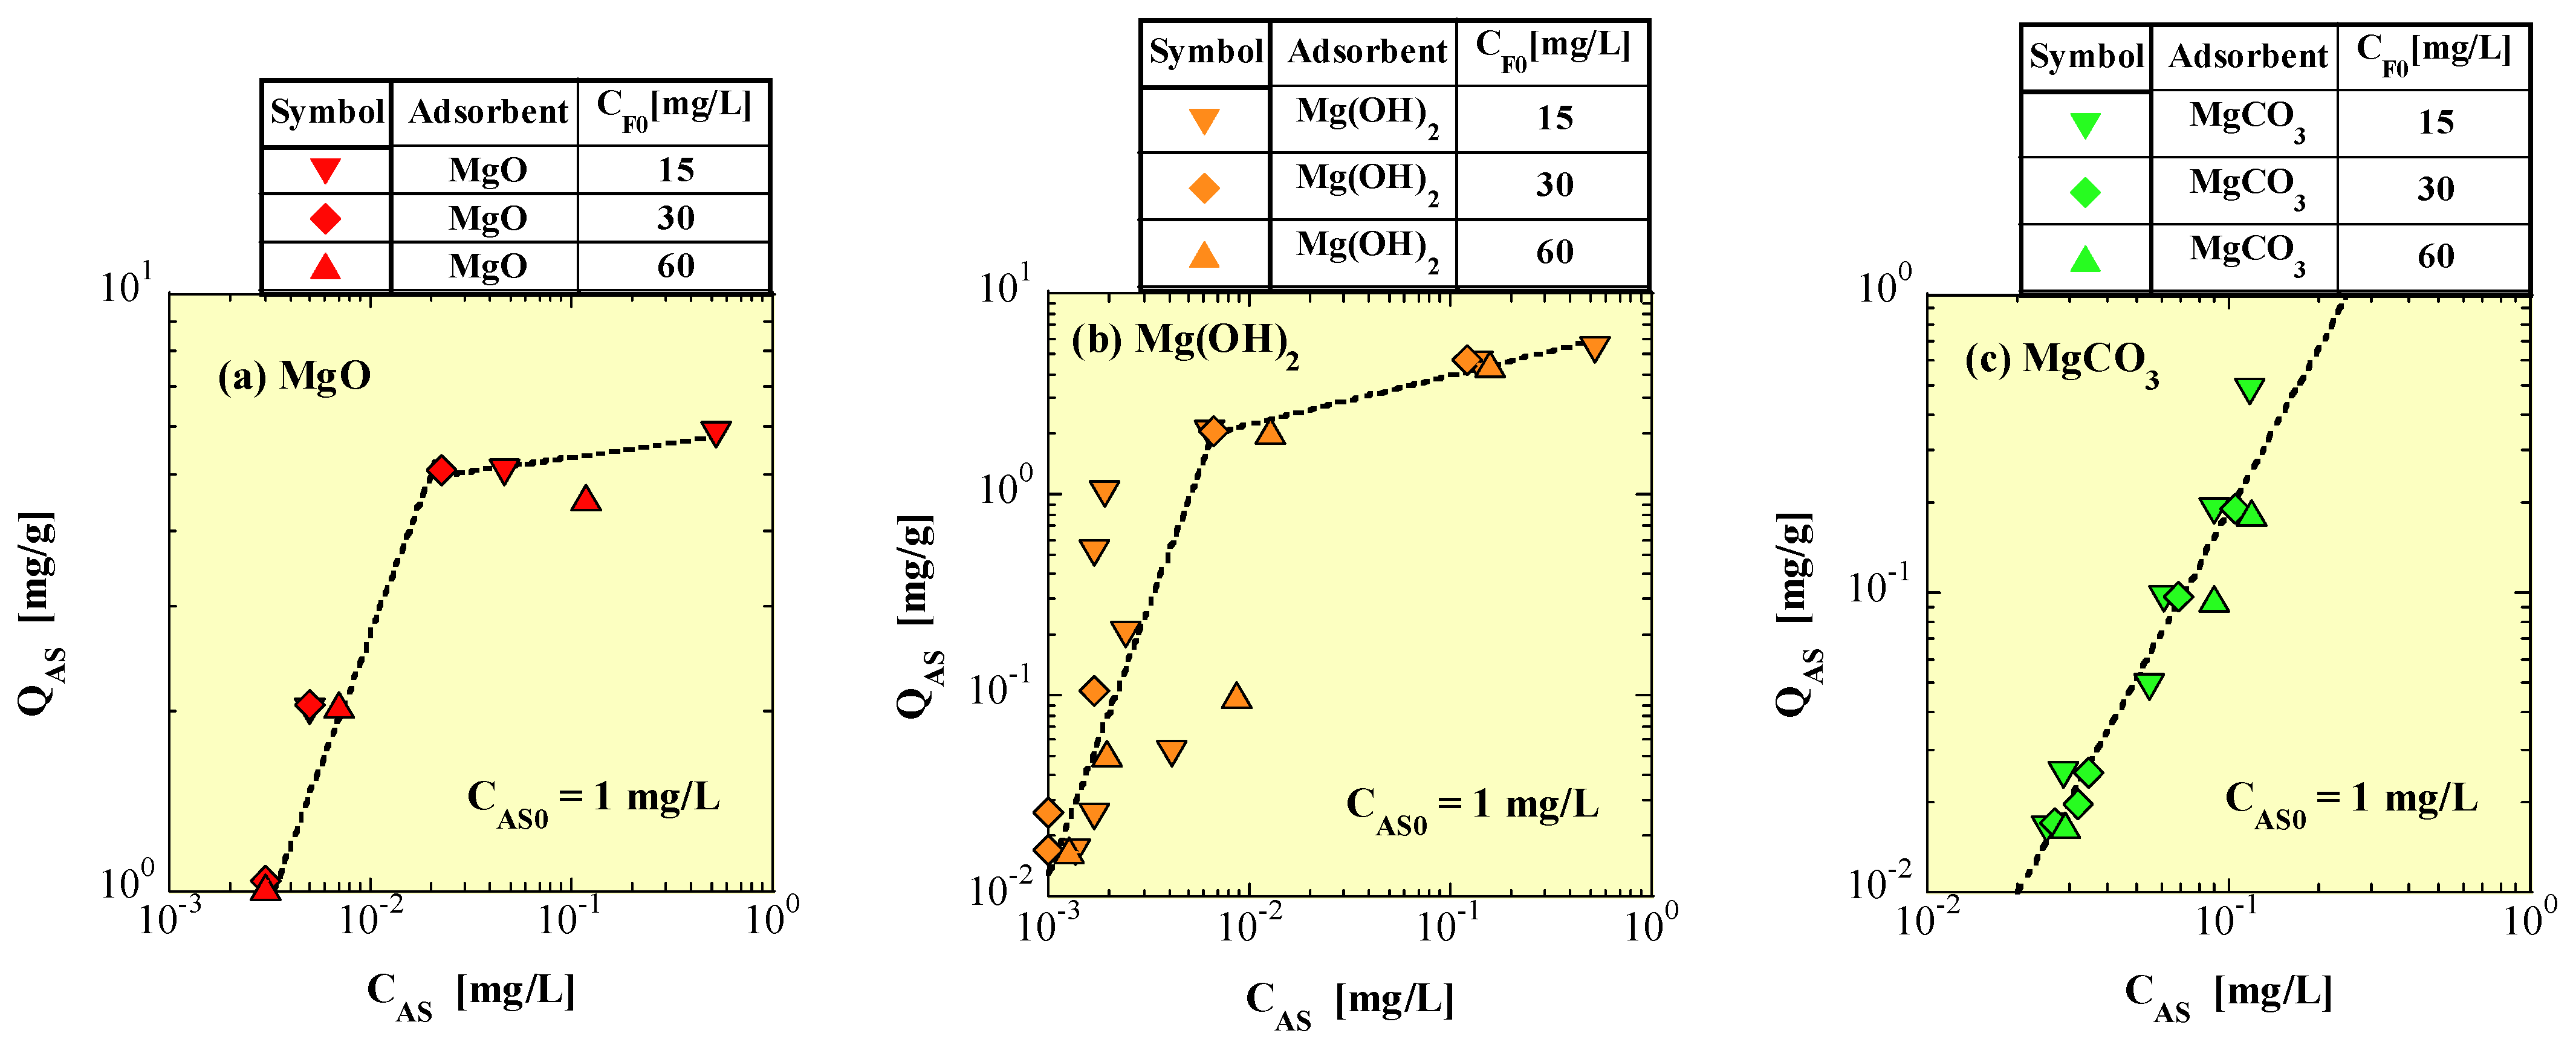
4.5. Langmuir Isotherm Model

The suitability of the Langmuir isotherm model, which is a common adsorption model, was verified using the adsorption data obtained from the As–F simultaneous removal tests.
Langmuir isotherm plots for As-adsorption are shown in Figure 11. Figure 11a–c show MgO, Mg(OH)2, and MgCO3, respectively.
The Langmuir equation for As-adsorption is described by Equation (17):
1/QAS =1/(KL QAS-MAX)(1/CAS) + 1/QAS-MAX.
where QAS-MAX is the maximum As-adsorption amount [mg/g], and KL is the Langmuir adsorption constant.
The As-adsorption data for MgO were plotted on a straight line, except for the upper two points in Figure 11a. An approximately straight line was obtained based on all the adsorption data for Mg(OH)2, as shown in Figure 11b, and the plots diverged significantly from the straight line. An approximately straight line was obtained based on all the adsorption data for MgCO3, as shown in Figure 11c, and the plots were almost straight. The intercept of the approximately straight line in Figure 11a yielded a QAS-MAX of 8.69 mg/g. The intercepts of the approximately straight lines for Mg(OH)2 and MgCO3 were negative. Therefore, the adsorption data for As based on these two Mg-based adsorbents did not fit the Langmuir isotherm model. For reference, the values of QAS-MAX, KL, and correlation coefficient r for the approximate straight lines obtained by applying Equation (17) to the As-adsorption data are listed in Table 2.
The Langmuir isotherm plots for the adsorption of F are shown in Figure 12. Figure 12a–c show MgO, Mg(OH)2, and MgCO3, respectively.
The Langmuir equation for F-adsorption is given by Equation (18):
1/QF = (1/KL QF-MAX)(1/CF) + 1/QF-MAX.
where QF is the F-adsorption amount per mass of adsorbent [mg/g], and QF-MAX is the maximum F-adsorption amount [mg/g].
In Figure 12a, the plots of F-adsorption data for MgO are scattered. Therefore, an approximately straight line for MgO was obtained by excluding all data at CF0 = 15 mg/L and one data point at CF0 = 60 mg/L. The intercept of the approximately straight line in Figure 12a yields a QF-MAX of 33.1 mg/g. In contrast, the F-adsorption data for Mg(OH)2 and MgCO3 are plotted around approximately straight lines (Figure 12b,c). The intercepts of the approximately straight lines in Figure 12b,c give a QF-MAX of 5.84 mg/g for Mg(OH)2 and 1.74 mg/g for MgCO3, respectively. For reference, the values of QF-MAX, KL, and r for the approximately straight lines obtained by applying Equation (18) for the F-adsorption data are listed in Table 3. The suitability of the F-adsorption data for Mg-based adsorbents in the Langmuir isotherm model was determined to be good for both Mg(OH)2 and MgCO3 but not for MgO. The pHf range obtained in this test was 10.8–11.3 for the MgO tests, 10.2–10.6 for the Mg(OH)2 tests, and 10.3–10.5 for the MgCO3 tests (Figure 3). Most of the pHf values in the MgO tests with CF0 = 15 mg/L were less than 10.9. Thus, it can be inferred that the F-adsorption behavior of Mg-based adsorbents differed above and below approximately 10.9 of pHf.

4.6. Freundlich Isotherm Model

Similar to the Langmuir isotherm model, the suitability of the Langmuir isotherm model was verified using adsorption data obtained from the As-F simultaneous removal tests.
The Freundlich isotherm plots for As-adsorption are shown in Figure 13. Figure 13a–c show MgO, Mg(OH)2, and MgCO3, respectively.
The Freundlich equation for As-adsorption is given by Equation (19):
QAS = KF CA S(1/n).
where KF and n are Freundlich adsorption constants.
The approximate curves for MgO and Mg(OH)2 are shown as two curves with different slopes, respectively. This is because, in the Freundlich plots, QAS approaches the saturation value with increasing CAS and then QAS levels when CAS exceeds a certain value. Therefore, the suitability of the Freundlich model is evaluated within a range lower than CAS, where the slope of the approximate curve decreases.
The As-adsorption data for MgCO3 fit the Freundlich isotherm model. In addition, the As-adsorption data for MgO in the low CAS concentration range fit the Freundlich isotherm model. However, the adsorption data plots for Mg(OH)2 are scattered and poorly fit the Freundlich isotherm model. For reference, the approximately straight line obtained by excluding some significantly deviating adsorption data is shown in Figure 13b. In addition, the values of KF, n, and r for the approximately straight lines obtained by applying Equation (19) to the As-adsorption data are listed in Table 4.
Subsequently, the Freundlich isotherm plots for F-adsorption are shown in Figure 14. Figure 14a–c show MgO, Mg(OH)2, and MgCO3, respectively.
The Freundlich equation for F-adsorption is given by Equation (20):
QF = KF CF(1/n)
The values of KF, n, and r for approximately straight lines obtained by applying Equation (20) to the F-adsorption data are listed in Table 5.
The F-adsorption data for Mg(OH)2 and MgCO3 fit the Freundlich isotherm model. Although several data points for MgO are plotted in the lower right of the approximation curve in Figure 14a, most of the adsorption data for MgO seem to fit the Freundlich isotherm model. The data plots that deviated from the approximate curve were the adsorption data with a pHf of less than 10.9. Therefore, similar to the Langmuir model, the Freundlich model suggests that the F-adsorption behavior of Mg-based adsorbents differed above and below approximately 10.9 of pHf.
Evaluation methods similar to this study were also used by Tolou et al. (2023), who studied the adsorption of As(III) and F on GO-MnO2 [22]. They reported that the Langmuir isotherm model better fit the adsorption of As(III) in the presence of F-, and the Freundlich isotherm model better fit the adsorption of F- in the presence of As(III). The trend of suitability of As(V) and F for the MgCO3 adsorbent in this study is similar to that of As(III) and F in the adsorption models for the GO-MnO2.

4.7. Correlation of pHf with CMg and ORPf

To confirm whether there was a correlation between CMg and ORPf with pHf, CMg and ORPf were plotted versus pHf in Figure 15a,b, respectively. Approximate curves obtained using the MgO data are shown in each figure.
As shown in Figure 15a, a negative correlation was found between pHf and the logarithm of CMg for MgO, and the data for MgCO3 were roughly plotted on the extension of the approximately straight line for MgO. The data for Mg(OH)2 were plotted at positions that deviated significantly from the approximate curve for MgO, and no clear relationship was found between pHf and CMg for Mg(OH)2.
In Figure 15b, a negative correlation was also found between pHf and the ORPf for MgO, and the data for Mg(OH)2 and MgCO3 appear to be plotted relatively close to the extension of the approximate straight line for MgO.
Furthermore, to consider the dissolution of the base materials of the adsorbents, after the conversion of the CMg and hydroxide ion concentration (calculated based on pHf) in the treatment of water-to-molar concentrations, the amount of OH in the solution was plotted versus the amount of Mg leached from the adsorbent as shown in Figure 16. MMg and [OH]f are the molar concentrations of Mg [mM] and OH [mM], respectively, as shown in Figure 16.
In Figure 16, a negative correlation was found between the MMg and the logarithm of [OH]f for MgO, and the plots for Mg(OH)2 and MgCO3 are placed below the approximate straight line for MgO.
In this study, the dissolution reactions of the Mg-based adsorbent in water can be described as follows:
For the MgO-adsorbent,
MgO + H2O ⇌ Mg2+ + 2OH.
For the Mg(OH)2-adsorbent,
Mg(OH)2 ⇌ Mg2+ + 2OH.
For the MgCO3-adsorbent,
MgCO3 ⇌ Mg2+ + CO32−.
MgCO3 + H2O ⇌ Mg2+ + HCO3 + OH.
MgCO3 + 2H2O ⇌ Mg2+ + H2CO3 + 2OH.
According to the above formulas, if MMg increases with the dissolution of the base materials of the Mg-based adsorbents, [OH]f should also increase, though this did not actually occur. Therefore, the reaction mechanisms that differ from those in the above equation must be considered.

4.8. Removal Mechanisms of As(V) and F

Based on the XRD results, the following precipitation reactions between Mg2+ leached from the Mg-based adsorbents and the arsenate ion species or F hardly occurred.
3Mg2+ + 2AsO43− ⇌ Mg3(AsO4)2.
Mg2+ + HAsO42− ⇌ MgHAsO4.
Mg2+ + 2H2AsO4 ⇌ Mg(H2AsO4)2.
Mg2+ + 2F ⇌ MgF2.
Mg2+ + xOH + (2−x)F ⇌ Mg(OH)xF(2−x), where 0 < x < 2.
Nevertheless, As(V) and F were removed from the contaminated water, and it was presumed that ion-exchange chemical adsorption occurred on the surface of the Mg-based adsorbents, as shown in the following reaction equations:
Examples of the surface reaction of MgO- and Mg(OH)2-adsorbents:
Solid-Mg-OH + AsO(OH)O22− ⇌ Solid-Mg-O-AsO(OH)O + OH.
Solid-Mg-OH + AsO43− ⇌ Solid-Mg-O-AsOO22− + OH.
Solid-Mg-OH + F ⇌ Solid-Mg-F + OH.
Considering the dissolved form of As(V) in the treated water estimated in Section 4.3, they considered that the reaction of Equation (31) was dominant for Mg(OH)2, but for MgO, the reaction of Equation (32) also occurred with a comparable to higher frequency than that of Equation (31).
Examples of surface reaction of the MgCO3-adsorbent:
Solid-Mg-O-CO(OH) + AsO(OH)O22− ⇌ Solid-Mg-O-AsO(OH)O + HCO3.
Solid-Mg-O-CO(OH) + F ⇌ Solid-Mg-F + HCO3.
Equations (31)–(33) denote the ion-exchange reactions with hydroxyl groups on the adsorbent surface, and Equations (34) and (35) denote the ion-exchange reactions with carbonate groups on the adsorbent surface. Monolayer adsorption reactions are generally believed to fit the Langmuir isotherm model. Because the adsorption data for F obtained in this study fit the Langmuir adsorption isotherms overall (Figure 12), the main F-removal mechanism by the Mg-based adsorbents was considered to be ion-exchange chemical adsorption on the adsorbent surface, as shown in Equations (33) and (35), respectively. However, the adsorption data of As(V) fit the Langmuir isotherm model only for MgO and not for Mg(OH)2 or MgCO3. Therefore, the As(V) removal mechanisms of Mg-based adsorbents cannot be explained by simple reactions, such as Equations (31) and (34), respectively. The results may indicate the influence of competitive adsorption between As(V) and F. However, the results of this study strongly support the conventional and general argument that arsenate ion species and F undergo ion-exchange with hydroxyl groups and carbonates on the adsorbent surface and are adsorbed. In addition, the removal performance of MgCO3 for As(V) and F is also supported as lower than that of MgO and Mg(OH)2 because carbonate ion species, compared to hydroxide ions, have stronger competition for adsorption with arsenate ion species and F.

5. Conclusions

In this study, experiments were conducted to simultaneously remove As(V) and F from multiple contaminated water samples using Mg-based adsorbents. The effects of F on As(V) removal and the adsorption behavior of As(V) and F on the Mg-based adsorbents were examined. The removal performance of both As(V) and F followed the order MgCO3 < Mg(OH)2 < MgO. For all three types of Mg-based adsorbents, regardless of CF0, a considerable amount of F remained even when the majority of As(V) was removed. Thus, As(V) was preferentially adsorbed and removed by Mg-based adsorbents as opposed to F. Additionally, no magnesium arsenate, magnesium fluoride, or magnesium hydroxide fluoride species were observed in the XRD analysis. The adsorption data for F on Mg-based adsorbents generally fit the Langmuir and Freundlich isotherm models, with the exception of some data. The maximum F-adsorption amount QF-MAX obtained using the Langmuir model was 33.1, 5.84, and 1.74 mg/g for MgO, Mg(OH)2, and MgCO3, respectively, while the adsorption data of As(V) fit the Langmuir isotherm model only for MgO, and not for Mg(OH)2 or MgCO3. The maximum As-adsorption amount QAS-MAX obtained using the Langmuir model was 8.69 mg/g for MgO. In addition, the As(V) adsorption data fit the Freundlich isotherm model for MgO and MgCO3 but not for Mg(OH)2. Because magnesium arsenate, MgF2, and magnesium hydroxide fluoride species were not observed in the XRD analysis, the removal mechanisms of As(V) and F by the Mg-based adsorbents were predominantly ion-exchange chemical-adsorption reactions with the hydroxyl or carbonate groups on the adsorbent surface. In the near future, we plan to conduct chemical equilibrium calculations based on the measurements of the Mg concentration, pH, and ORP obtained in this study and to further investigate the dissolved forms and precipitates. This research aims to advance sustainable As treatment methods using inexpensive Mg-based adsorbents.

Author Contributions

Conceptualization, H.S.; methodology, H.S., T.S. and J.H.; formal analysis, H.S. and K.M.; investigation, H.S. and K.M.; resources, H.S., K.M. and J.H.; data curation, H.S. and K.M.; writing—original draft preparation, H.S. and K.M.; writing—review and editing, H.S., K.M., T.S. and J.H.; supervision, J.H.; project administration, H.S.; funding acquisition, J.H., T.S. and H.S. All authors have read and agreed to the published version of the manuscript.

Funding

This study received no external funding.

Institutional Review Board Statement

Not applicable.

Informed Consent Statement

Not applicable.

Data Availability Statement

Data supporting the findings of this study are available from the corresponding authors upon reasonable request.

Acknowledgments

We are deeply grateful to Terumi Oguma for her assistance with the experiments.

Conflicts of Interest

The authors declare no conflicts of interest.

References

  1. Zhu, C.; Bai, G.; Liu, X.; Li, Y. Screening high-fluoride and high-arsenic drinking waters and surveying endemic fluorosis and arsenism in Shaanxi province in western China. Water Res. 2006, 40, 3015–3022. [Google Scholar] [CrossRef] [PubMed]
  2. Armienta, M.A.; Segovia, N. Arsenic and fluoride in the groundwater of Mexico. Environ. Geochem. Health 2008, 30, 345–353. [Google Scholar] [CrossRef] [PubMed]
  3. Farooqi, A.; Masuda, H.; Siddiqui, R.; Naseem, M. Sources of Arsenic and Fluoride in Highly Contaminated Soils Causing Groundwater Contamination in Punjab, Pakistan. Arch. Environ. Contam. Toxicol. 2009, 56, 693–706. [Google Scholar] [CrossRef] [PubMed]
  4. Ingallinella, A.M.; Pacini, V.A.; Fernandez, R.G.; Vidoni, R.M.; Sanguinetti, G. Simultaneous removal of arsenic and fluoride from groundwater by coagulation-adsorption with polyaluminum chloride. J. Environ. Sci. Health A 2011, 46, 1288–1296. [Google Scholar] [CrossRef] [PubMed]
  5. Alarcon-Herrera, M.T.; Bundschuh, J.; Nath, B.; Nicollid, H.B.; Gutierrez, M.; Reyes-Gomez, V.M.; Nunez, D.; Martín-Dominguez, I.R.; Sracek, O. Co-occurrence of arsenic and fluoride in groundwater of semi-arid regions in Latin America: Genesis, mobility and remediation. J. Hazard. Mater. 2013, 262, 960–969. [Google Scholar] [CrossRef] [PubMed]
  6. Navarro, O.; González, J.; Júnez-Ferreira, H.E.; Bautista, C.-F.; Cardona, A. Correlation of Arsenic and Fluoride in the groundwater for human consumption in a semiarid region of Mexico. Procedia Eng. 2017, 186, 333–340. [Google Scholar] [CrossRef]
  7. Jha, P.K.; Tripathi, P. Arsenic and fluoride contamination in groundwater: A review of global scenarios with special reference to India. Groundw. Sustain. Dev. 2021, 13, 10057. [Google Scholar] [CrossRef]
  8. The World Health Organization (WHO). Guidelines for Drinking-Water Quality, 4th ed.; Arsenic, 315-318; WHO: Tarxien, Malta, 2011; ISBN 978-92-4-154815-1. Available online: https://apps.who.int/iris/bitstream/handle/10665/44584/9789241548151_eng.pdf (accessed on 10 December 2023).
  9. Jadhav, S.V.; Bringas, E.; Yadav, G.D.; Rathod, V.K.; Ortiz, I.; Marathe, K.V. Arsenic and fluoride contaminated groundwaters: A review of current technologies for contaminants removal. J. Environ. Manag. 2015, 162, 306–325. [Google Scholar] [CrossRef]
  10. Sarkar, A.; Paul, B. The global menace of arsenic and its conventional remediation—A critical review. Chemosphere 2016, 158, 37–49. [Google Scholar] [CrossRef]
  11. Ghosh, S.; Debsarkar, A.; Dutta, A. Technology alter-natives for decontamination of arsenic-rich groundwater—A critical review. Environ. Technol. Innov. 2019, 13, 277–303. [Google Scholar] [CrossRef]
  12. Kumar, R.; Patel, M.; Singh, P.; Bundschuh, J.; Pittman, C.U., Jr.; Trakal, L.; Mohan, D. Emerging technologies for arsenic removal from drinking water in rural and peri-urban areas: Methods, experience from, and options for Latin America. Sci. Total Environ. 2019, 694, 133427. [Google Scholar] [CrossRef]
  13. Yu, X.Y.; Luo, T.; Jia, Y.; Zhang, Y.X.; Liu, J.H.; Huang, X.J. Porous hierarchically micro-/nanostructured MgO: Morphology control and their excellent performance in As(III) and As(V) removal. J. Phys. Chem. C 2011, 115, 22242–22250. [Google Scholar] [CrossRef]
  14. Lin, Q.; Chen, W.; Lin, F.; Zhu, H.; Wang, X. Exaggerated arsenic removal efficiency and pH adaptability by adsorption using monodispersed porous pinecone-like magnesium hydroxide. AQUA 2023, 72, 969–982. [Google Scholar] [CrossRef]
  15. Mohapatra, M.; Anand, S.; Mishra, B.K.; Giles, D.E.; Singh, P. Review of fluoride removal from drinking water. J. Environ. Manag. 2009, 91, 67–77. [Google Scholar] [CrossRef]
  16. He, J.; Yang, Y.; Wu, Z.; Xie, C.; Zhang, K.; Kong, L.; Liu, J. Review of fluoride removal from water environment by adsorption. J. Environ. Chem. Eng. 2020, 8, 104516. [Google Scholar] [CrossRef]
  17. Gai, W.-Z.; Deng, Z.-Y. A comprehensive review of adsorbents for fluoride removal from water: Performance, water quality assessment and mechanism. Environ. Sci. Water Res. Technol. 2021, 7, 1362–1386. [Google Scholar] [CrossRef]
  18. Pillai, P.; Dharaskar, S.; Pandian, S.; Panchal, H. Overview of fluoride removal from water using separation techniques. Environ. Technol. Innov. 2021, 21, 101246. [Google Scholar] [CrossRef]
  19. Jin, Z.; Jia, Y.; Zhang, K.-S.; Kong, L.-T.; Sun, B.; Shen, W.; Meng, F.-L.; Liu, J.-H. Effective removal of fluoride by porous MgO nanoplates and its adsorption mechanism. Appl. Surf. Sci. 2015, 357, 1080–1088. [Google Scholar] [CrossRef]
  20. Wallace, A.R.; Su, C.; Sun, W. Adsorptive removal of fluoride from water using nanomaterials of ferrihydrite, apatite, and brucite: Batch and column studies. Environ. Eng. Sci. 2019, 36, 634–642. [Google Scholar] [CrossRef]
  21. Lopez-Guzman, M.; Alarcon-Herrera, M.T.; Irigoyen-Campuzano, J.R.; Torres-Castanon, L.A.; Reynoso-Cuevas, L. Simultaneous removal of fluoride and arsenic from well water by electrocoagulation. Sci. Total Environ. 2019, 678, 181–187. [Google Scholar] [CrossRef]
  22. Tolkou, A.K.; Trikkaliotis, D.G.; Kyzas, G.Z.; Katsoyiannis, I.A.; Deliyanni, E.A. Simultaneous Removal of As(III) and Fluoride Ions from Water Using Manganese Oxide Supported on Graphene Nanostructures (GO-MnO2). Sustainability 2023, 15, 1179. [Google Scholar] [CrossRef]
  23. Sugita, H.; Oguma, T.; Zhang, M.; Hara, J.; Takahashi, S. Environmental stability of spent magnesium-based and calcium-based arsenic adsorbents-Effects of soils. J. Jpn. Soc. Civ. Eng. Ser. G Environ. Res. 2016, 72, 437–448. [Google Scholar] [CrossRef]
  24. Rojo, J.M.; Mesa, J.L.; Pizarro, J.L.; Lezama, L.; Arriortua, M.I.; Rojo, T. Spectroscopic and Magnetic Study of the (Mg,M)3(AsO4)2·8H2O (M = Ni2+, Co2+) Arsenates. Mater. Res. Bull. 1996, 31, 925–934. [Google Scholar] [CrossRef]
  25. Ferraris, G.; Franchini-Angela, M. Hydrogen Bonding in the Crystalline State. Crystal Structure of MgHAsO4·7H2O, Roesslerite. Acta. Crystallogr. B 1973, 29, 286–292. [Google Scholar] [CrossRef]
  26. Baur, W.H.; Khan, A.A. Rutile-type Compounds. IV. SiO2, GeO2 and a Comparison with Other Rutile-type Structures. Acta Crystallogr. B 1971, 27, 2133–2139. [Google Scholar] [CrossRef]
  27. Crichton, W.A.; Parise, J.B.; Muller, H.; Breger, J.; Marshall, W.G.; Welch, M.D. Synthesis and Structure of Magnesium Hydroxide Fluoride, Mg(OH)F: A Topological Intermediate Between Brucite- and Rutile-type Structures. Mineral. Mag. 2012, 76, 25–36. [Google Scholar] [CrossRef]
  28. The Chemical Society of Japan (CSJ). Kagaku Binran (Handbook of Chemistry), Pure Chemistry II, 5th ed.; Maruzen: Tokyo, Japan, 2004; p. 332. [Google Scholar]
Figure 1. Change in residual As concentration in treated water with adsorbent addition concentration: (a) MgO, (b) Mg(OH)2, and (c) MgCO3.
Sustainability 16 01774 g001
Figure 2. Plots of residual F concentration in treated water versus adsorbent addition concentration: (a) MgO, (b) Mg(OH)2, and (c) MgCO3.
Sustainability 16 01774 g002
Figure 3. Plots of leached Mg concentration in treated water versus adsorbent addition concentration: (a) MgO, (b) Mg(OH)2, and (c) MgCO3.
Sustainability 16 01774 g003
Figure 4. Plots of the pH of treated water versus adsorbent addition concentration: (a) MgO, (b) Mg(OH)2, and (c) MgCO3.
Sustainability 16 01774 g004
Figure 5. Plots of ORP of treated water versus adsorbent addition concentration: (a) MgO, (b) Mg(OH)2, and (c) MgCO3.
Sustainability 16 01774 g005
Figure 6. Powder X-ray diffraction patterns: (a) MgO, (b) hydrated MgO, (c) As-adsorbed MgO, and (d) F-adsorbed MgO. Relative intensity ratio of XRD peaks based on the crystal structure: (e) magnesium arsenate salts, Mg3(AsO4)2·8H2O (hornesite) [24] and MgHAsO4·7H2O (rosslerite) [25], (f) magnesium fluoride salts, MgF2 (sellaite) [26] and Mg(OH)F [27].
Sustainability 16 01774 g006
Figure 7. Powder X-ray diffraction patterns: (a) Mg(OH)2, (b) hydrated Mg(OH)2, (c) As-adsorbed Mg(OH)2, and (d) F-adsorbed Mg(OH)2.
Sustainability 16 01774 g007
Figure 8. Powder X-ray diffraction patterns: (a) MgCO3, (b) hydrated MgCO3, (c) As-adsorbed MgCO3, and (d) F-adsorbed MgCO3.
Sustainability 16 01774 g008
Figure 9. Plots of As-removal ratio versus adsorbent addition concentration: (a) CF0 =15 mg/L, (b) CF0 = 30 mg/L, and (c) CF0 = 60 mg/L.
Sustainability 16 01774 g009
Figure 10. Plots of F-removal ratio versus adsorbent addition concentration: (a) CF0 =15 mg/L, (b) CF0 = 30 mg/L, and (c) CF0 = 60 mg/L.
Sustainability 16 01774 g010
Figure 11. Langmuir isotherm plots for As(V): (a) MgO, (b) Mg(OH)2, and (c) MgCO3.
Sustainability 16 01774 g011
Figure 12. Langmuir isotherm plots for F: (a) MgO, (b) Mg(OH)2, and (c) MgCO3.
Sustainability 16 01774 g012
Figure 13. Freundlich isotherm plots for As(V): (a) MgO, (b) Mg(OH)2, and (c) MgCO3.
Sustainability 16 01774 g013
Figure 14. Freundlich isotherm plots for F: (a) MgO, (b) Mg(OH)2, and (c) MgCO3.
Sustainability 16 01774 g014
Figure 15. Plotts of CMg and ORPf versus pHf: (a) CMg and (b) ORPf.
Sustainability 16 01774 g015
Figure 16. Plotts of [OH] versus MMg.
Sustainability 16 01774 g016
Table 1. Characteristics of the adsorbents where α is the measured Mg content, P is the reagent purity, Dp50 is the median particle size, and SBET is the BET surface area.
No.AdsorbentαMg (%)P (%)Dp50 (μm)SBET (m2/g)
(1) 1MgO59.198.01.544.3
(2) 1Mg(OH)240.697.34.1322.0
(3) 1MgCO324.886.115.026.0
1 Data from Sugita et al. (2016) [23].
Table 2. Values of QAS-MAX, KL, and r for the approximate straight lines obtained by applying Equation (17) to As-adsorption data.
Figure No.AdsorbentQAS-MAX (mg/g)KLr
Figure 11aMgO8.69 *48.7 *0.988 *
Figure 11bMg(OH)2–0.284 **–66.9 **0.791
Figure 11cMgCO3–14.0 **–7.40 **0.976
* These values were calculated after excluding two adsorption data points that deviated significantly. ** The values are for reference only, as they did not fit the Langmuir model.
Table 3. Values of QF-MAX, KL, and r for the approximate straight lines obtained by applying Equation (18) to F-adsorption data.
Figure No.AdsorbentQF-MAX (mg/g)KLr
Figure 12aMgO33.1 *3.62 *0.991 *
Figure 12bMg(OH)25.840.1610.991
Figure 12cMgCO31.740.05860.964
* These values were calculated by excluding all data at CF0 = 15 mg/L and one data point at CF0 = 60 mg/L, which deviated significantly.
Table 4. Values of KF, n, and r for the approximately straight lines obtained by applying Equation (19) to As-adsorption data.
Figure No.AdsorbentKFnr
Figure 13aMgO1621.120.965
Figure 13bMg(OH)26.86 *4.10 *0.964 *
Figure 13cMgCO312.60.5470.856
* These values were calculated by excluding significantly deviating As-adsorption data.
Table 5. Values of KF, n, and r for the approximately straight lines obtained by applying Equation (20) to F-adsorption data.
Figure No.AdsorbentKFnr
Figure 14aMgO18.0 *4.89 *0.942 *
Figure 14bMg(OH)20.7461.450.846
Figure 14cMgCO30.1081.310.973
* These values were calculated by excluding significantly deviating F-adsorption data.
Disclaimer/Publisher’s Note: The statements, opinions and data contained in all publications are solely those of the individual author(s) and contributor(s) and not of MDPI and/or the editor(s). MDPI and/or the editor(s) disclaim responsibility for any injury to people or property resulting from any ideas, methods, instructions or products referred to in the content.

