

Rapid Photocatalytic Activity of Crystalline CeO2-CuO-Cu(OH)2 Ternary Nanocomposite

 , and
, and
Abstract
:1. Introduction
2. Materials and Methods
2.1. Materials
2.2. Synthesis of CeO2-CuO-Cu(OH)2 Nanocomposite
2.3. Characterization
2.4. Photocatalytic Degradation
3. Results and Discussion
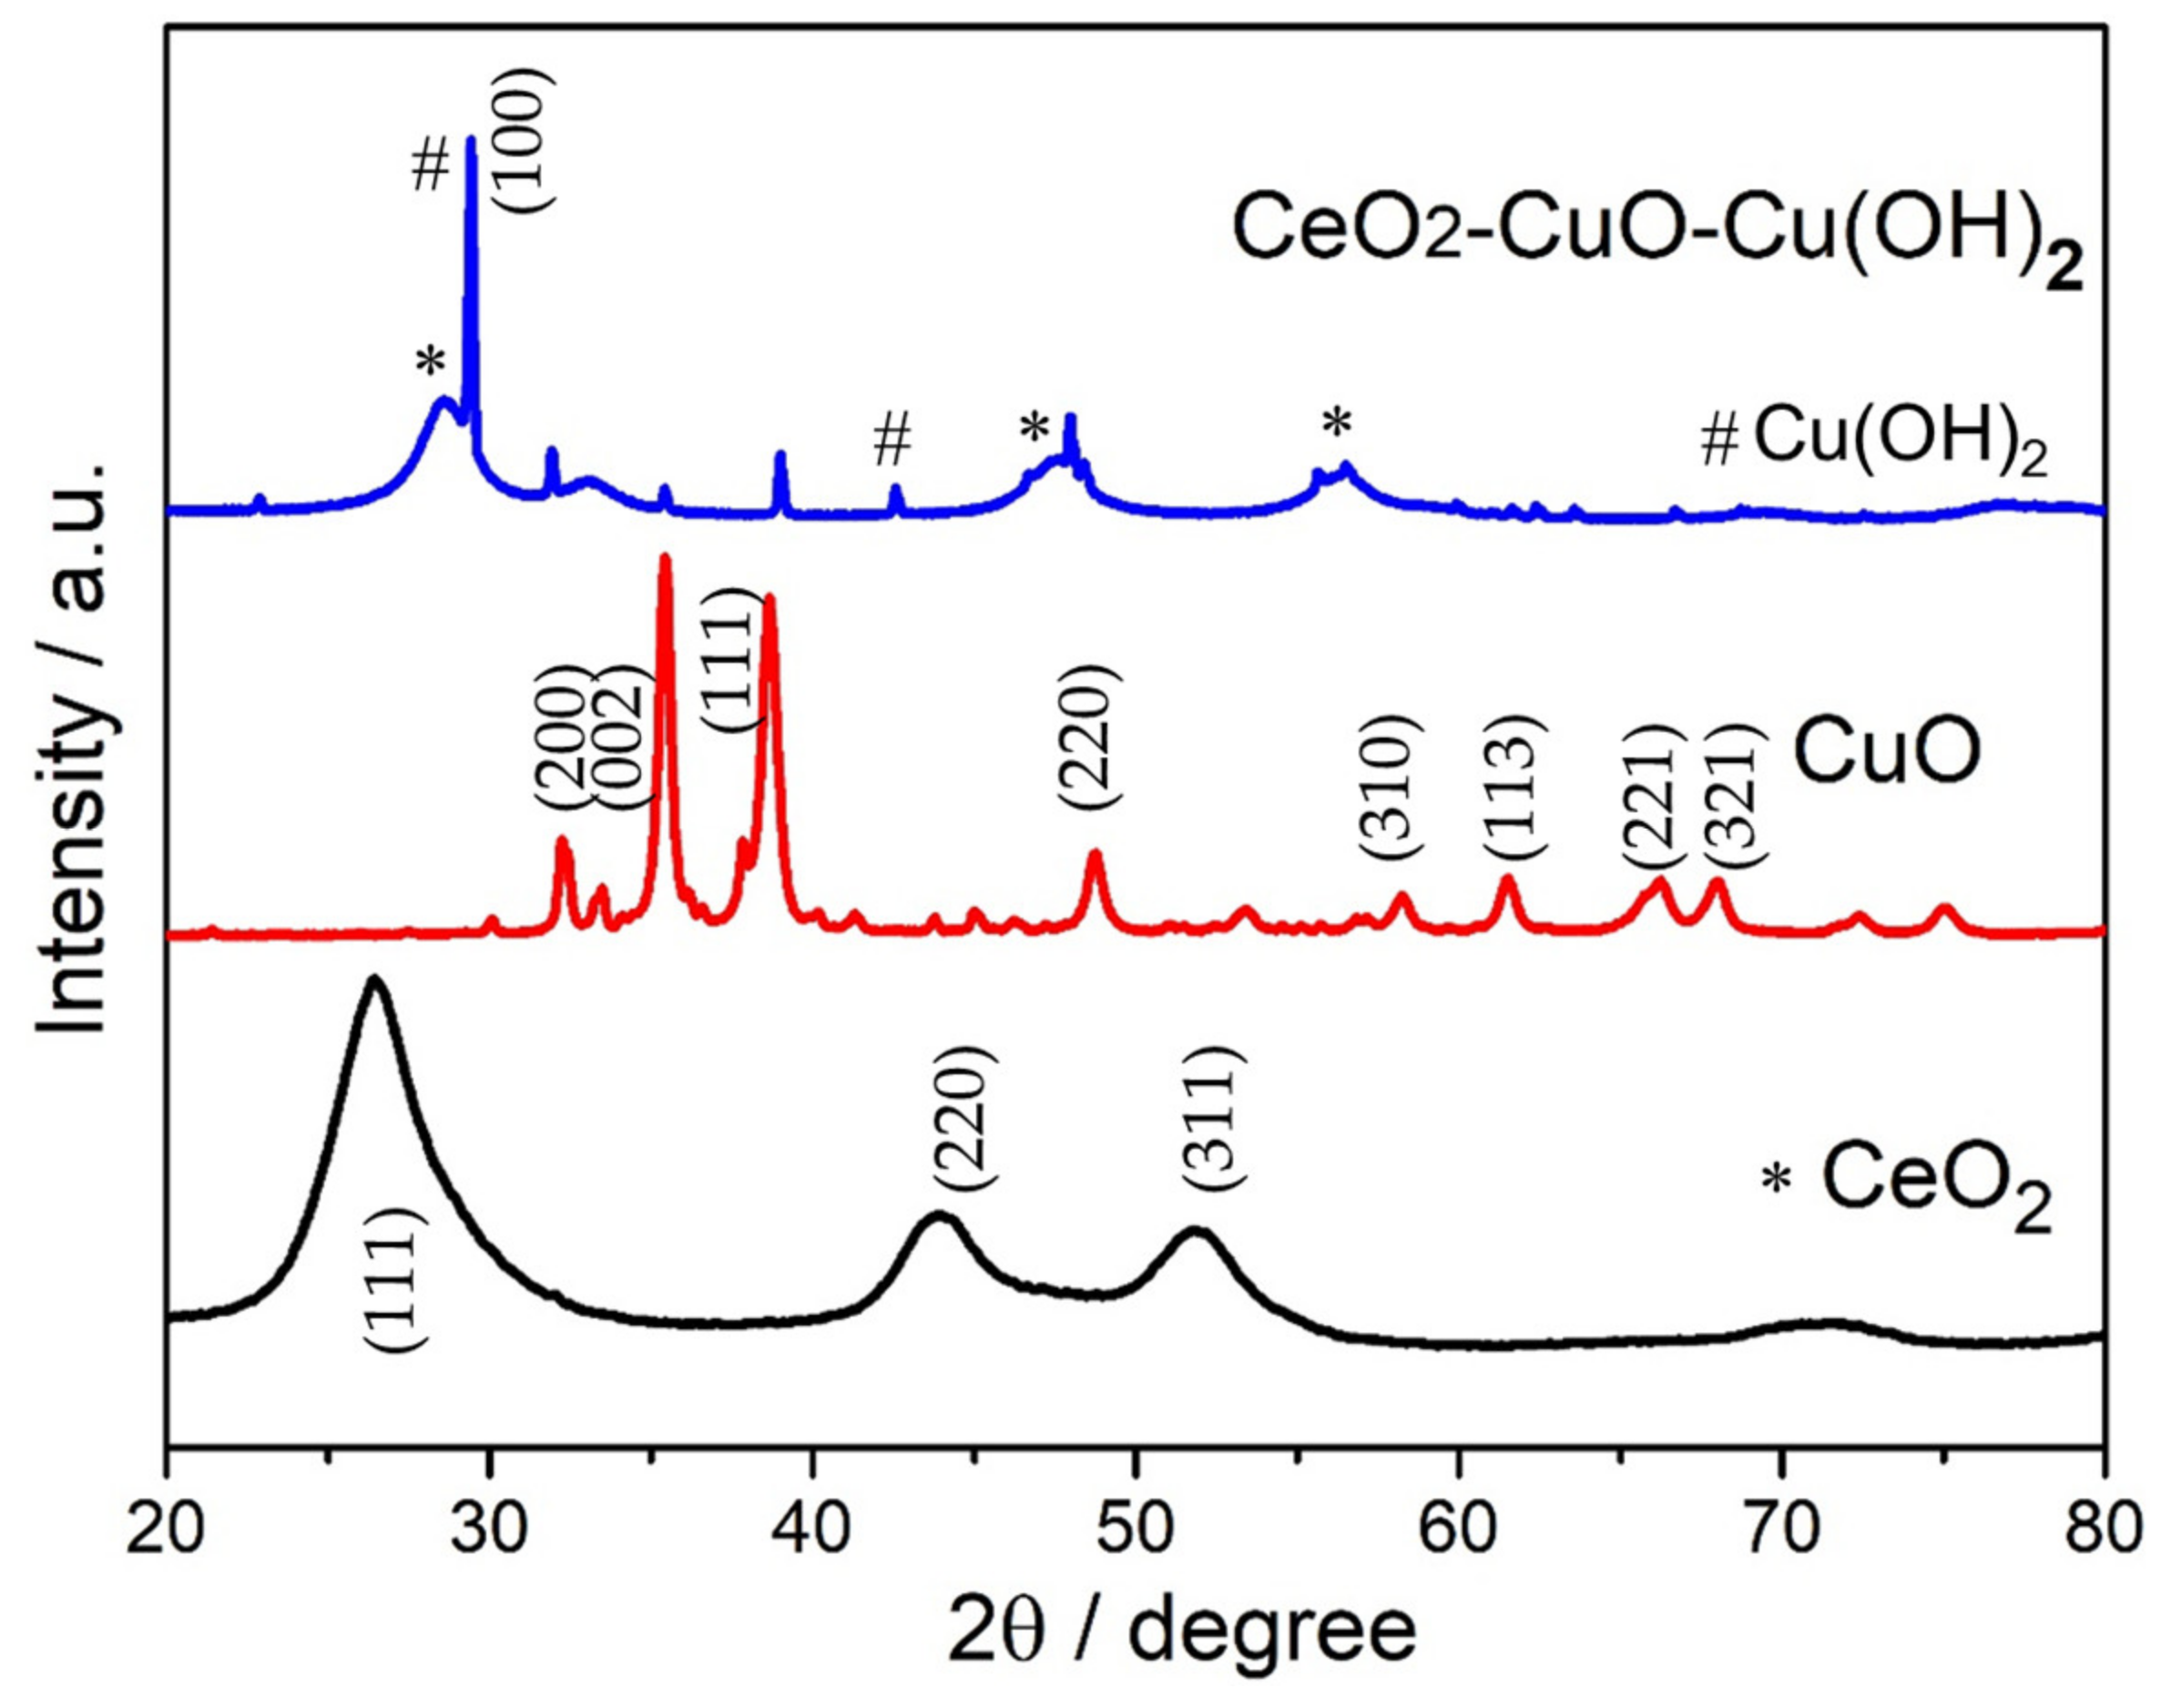
3.1. Structural Study
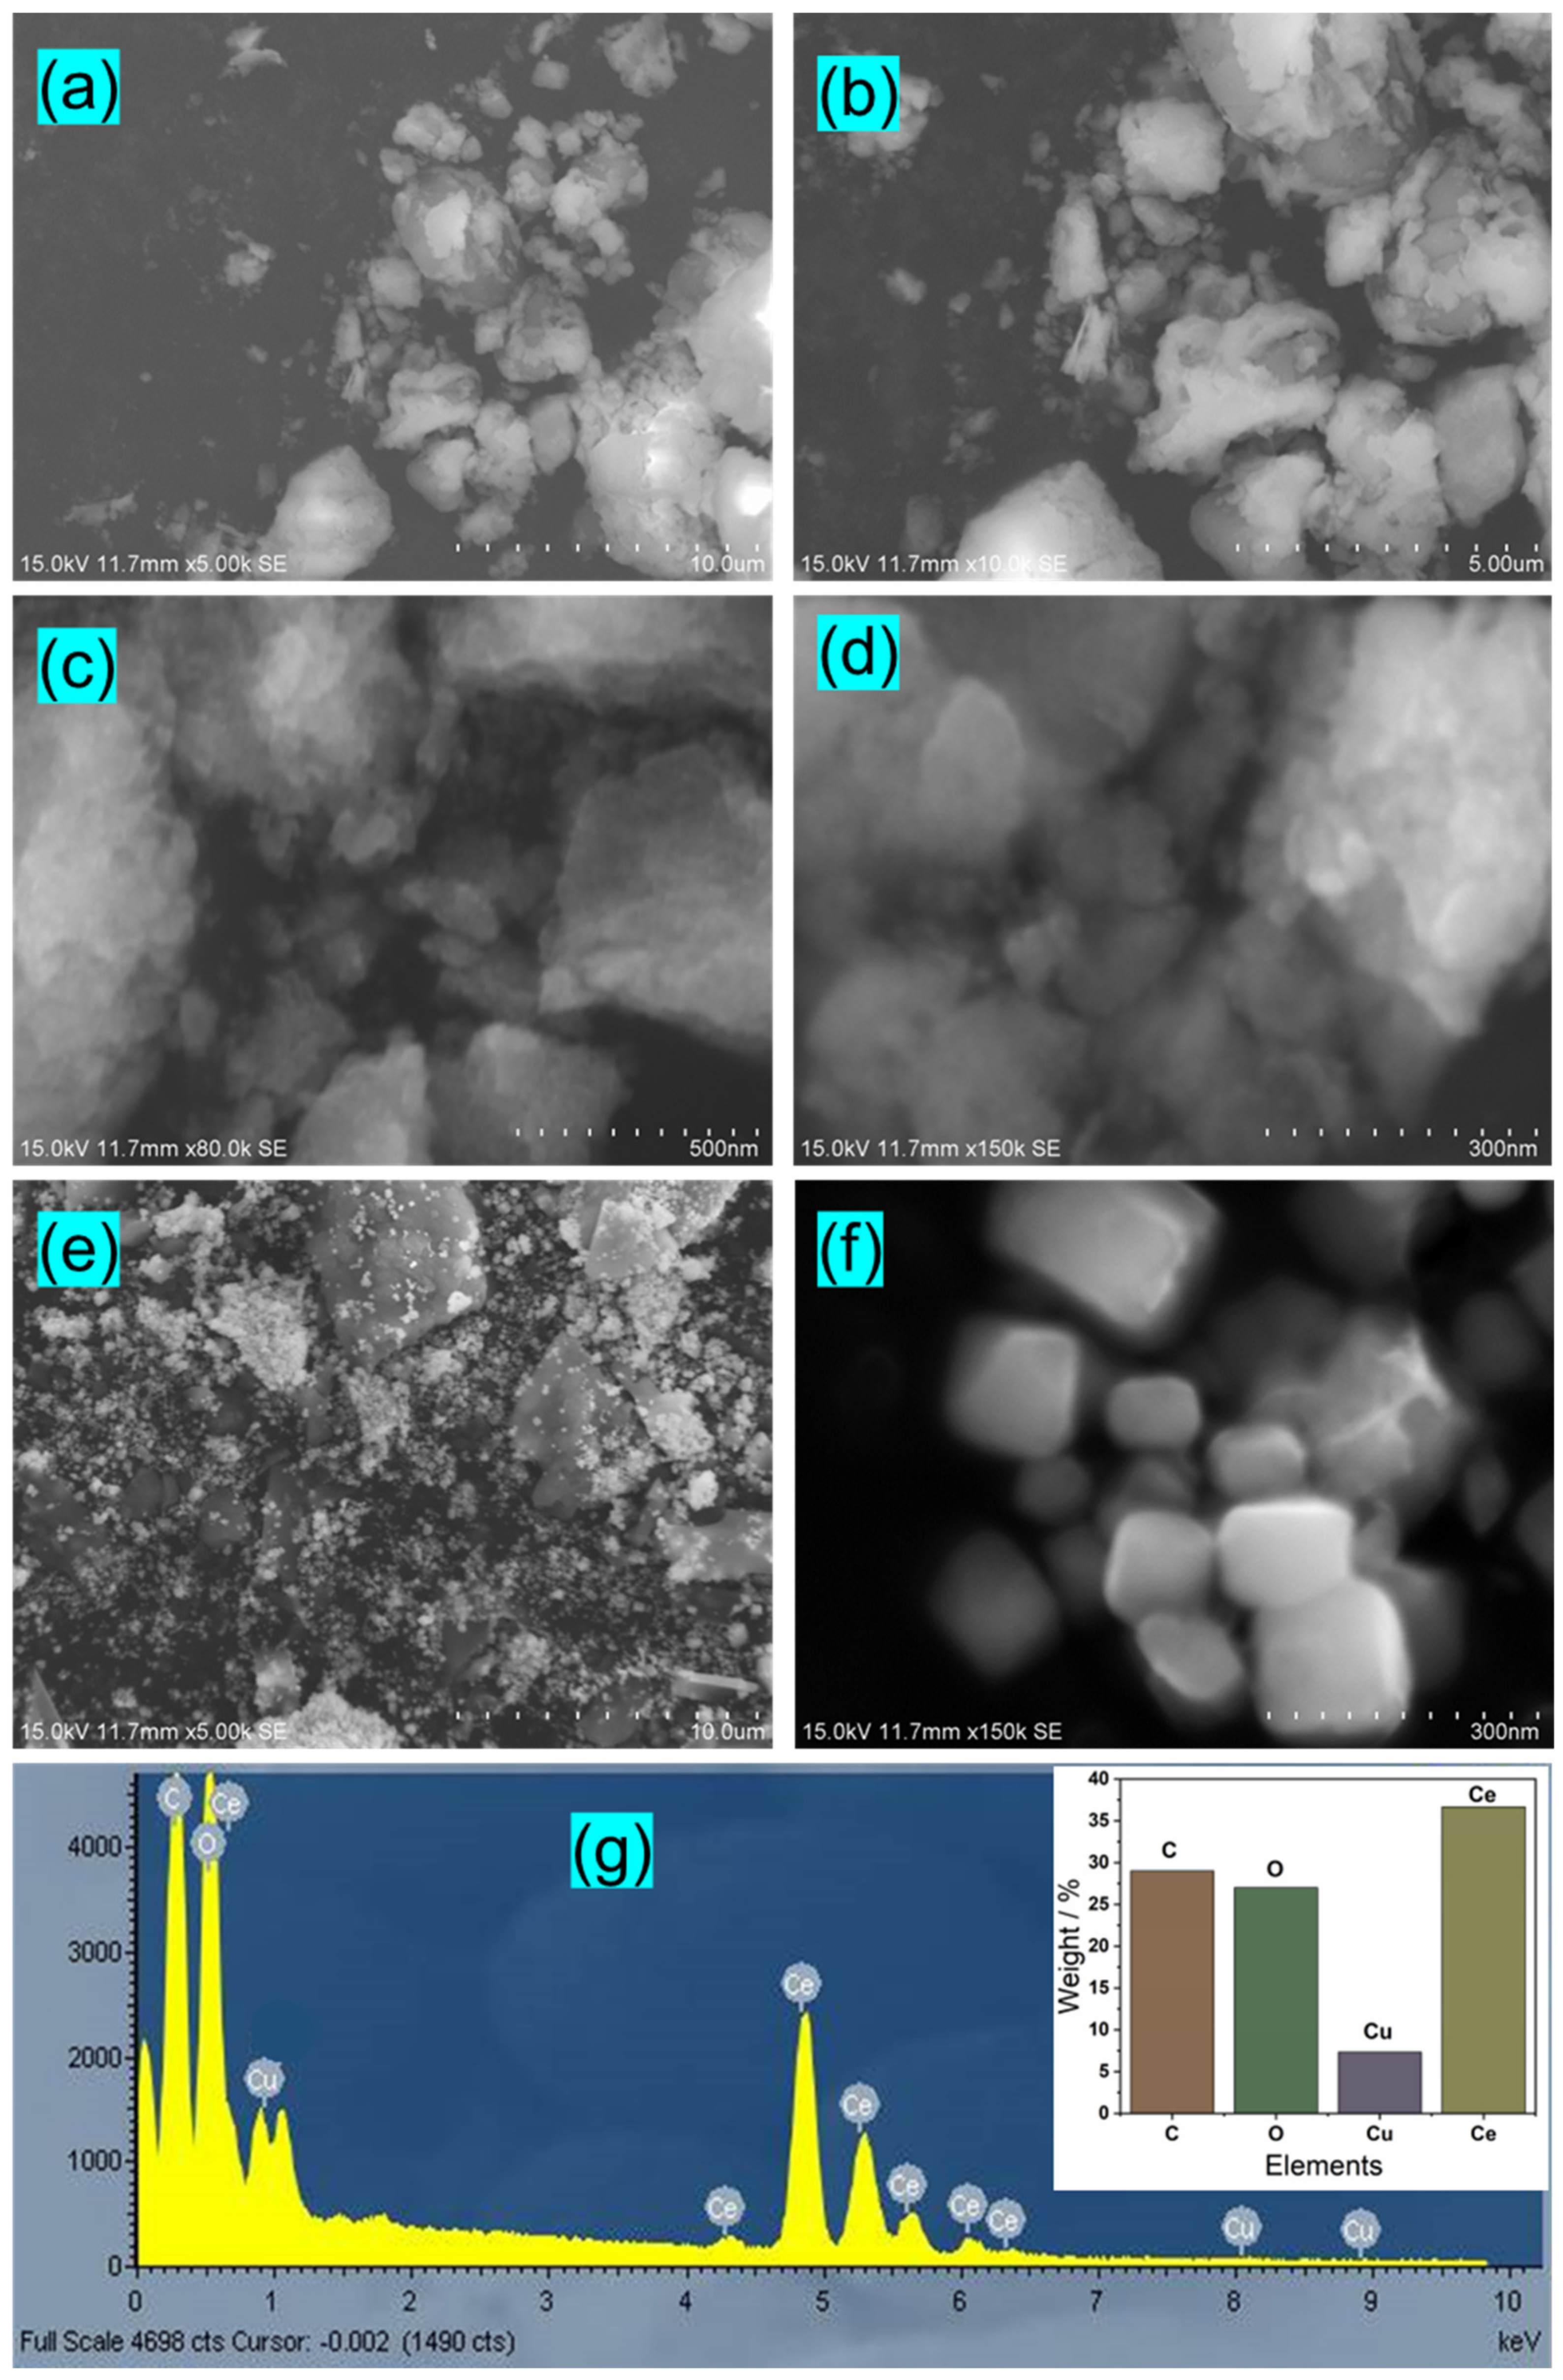
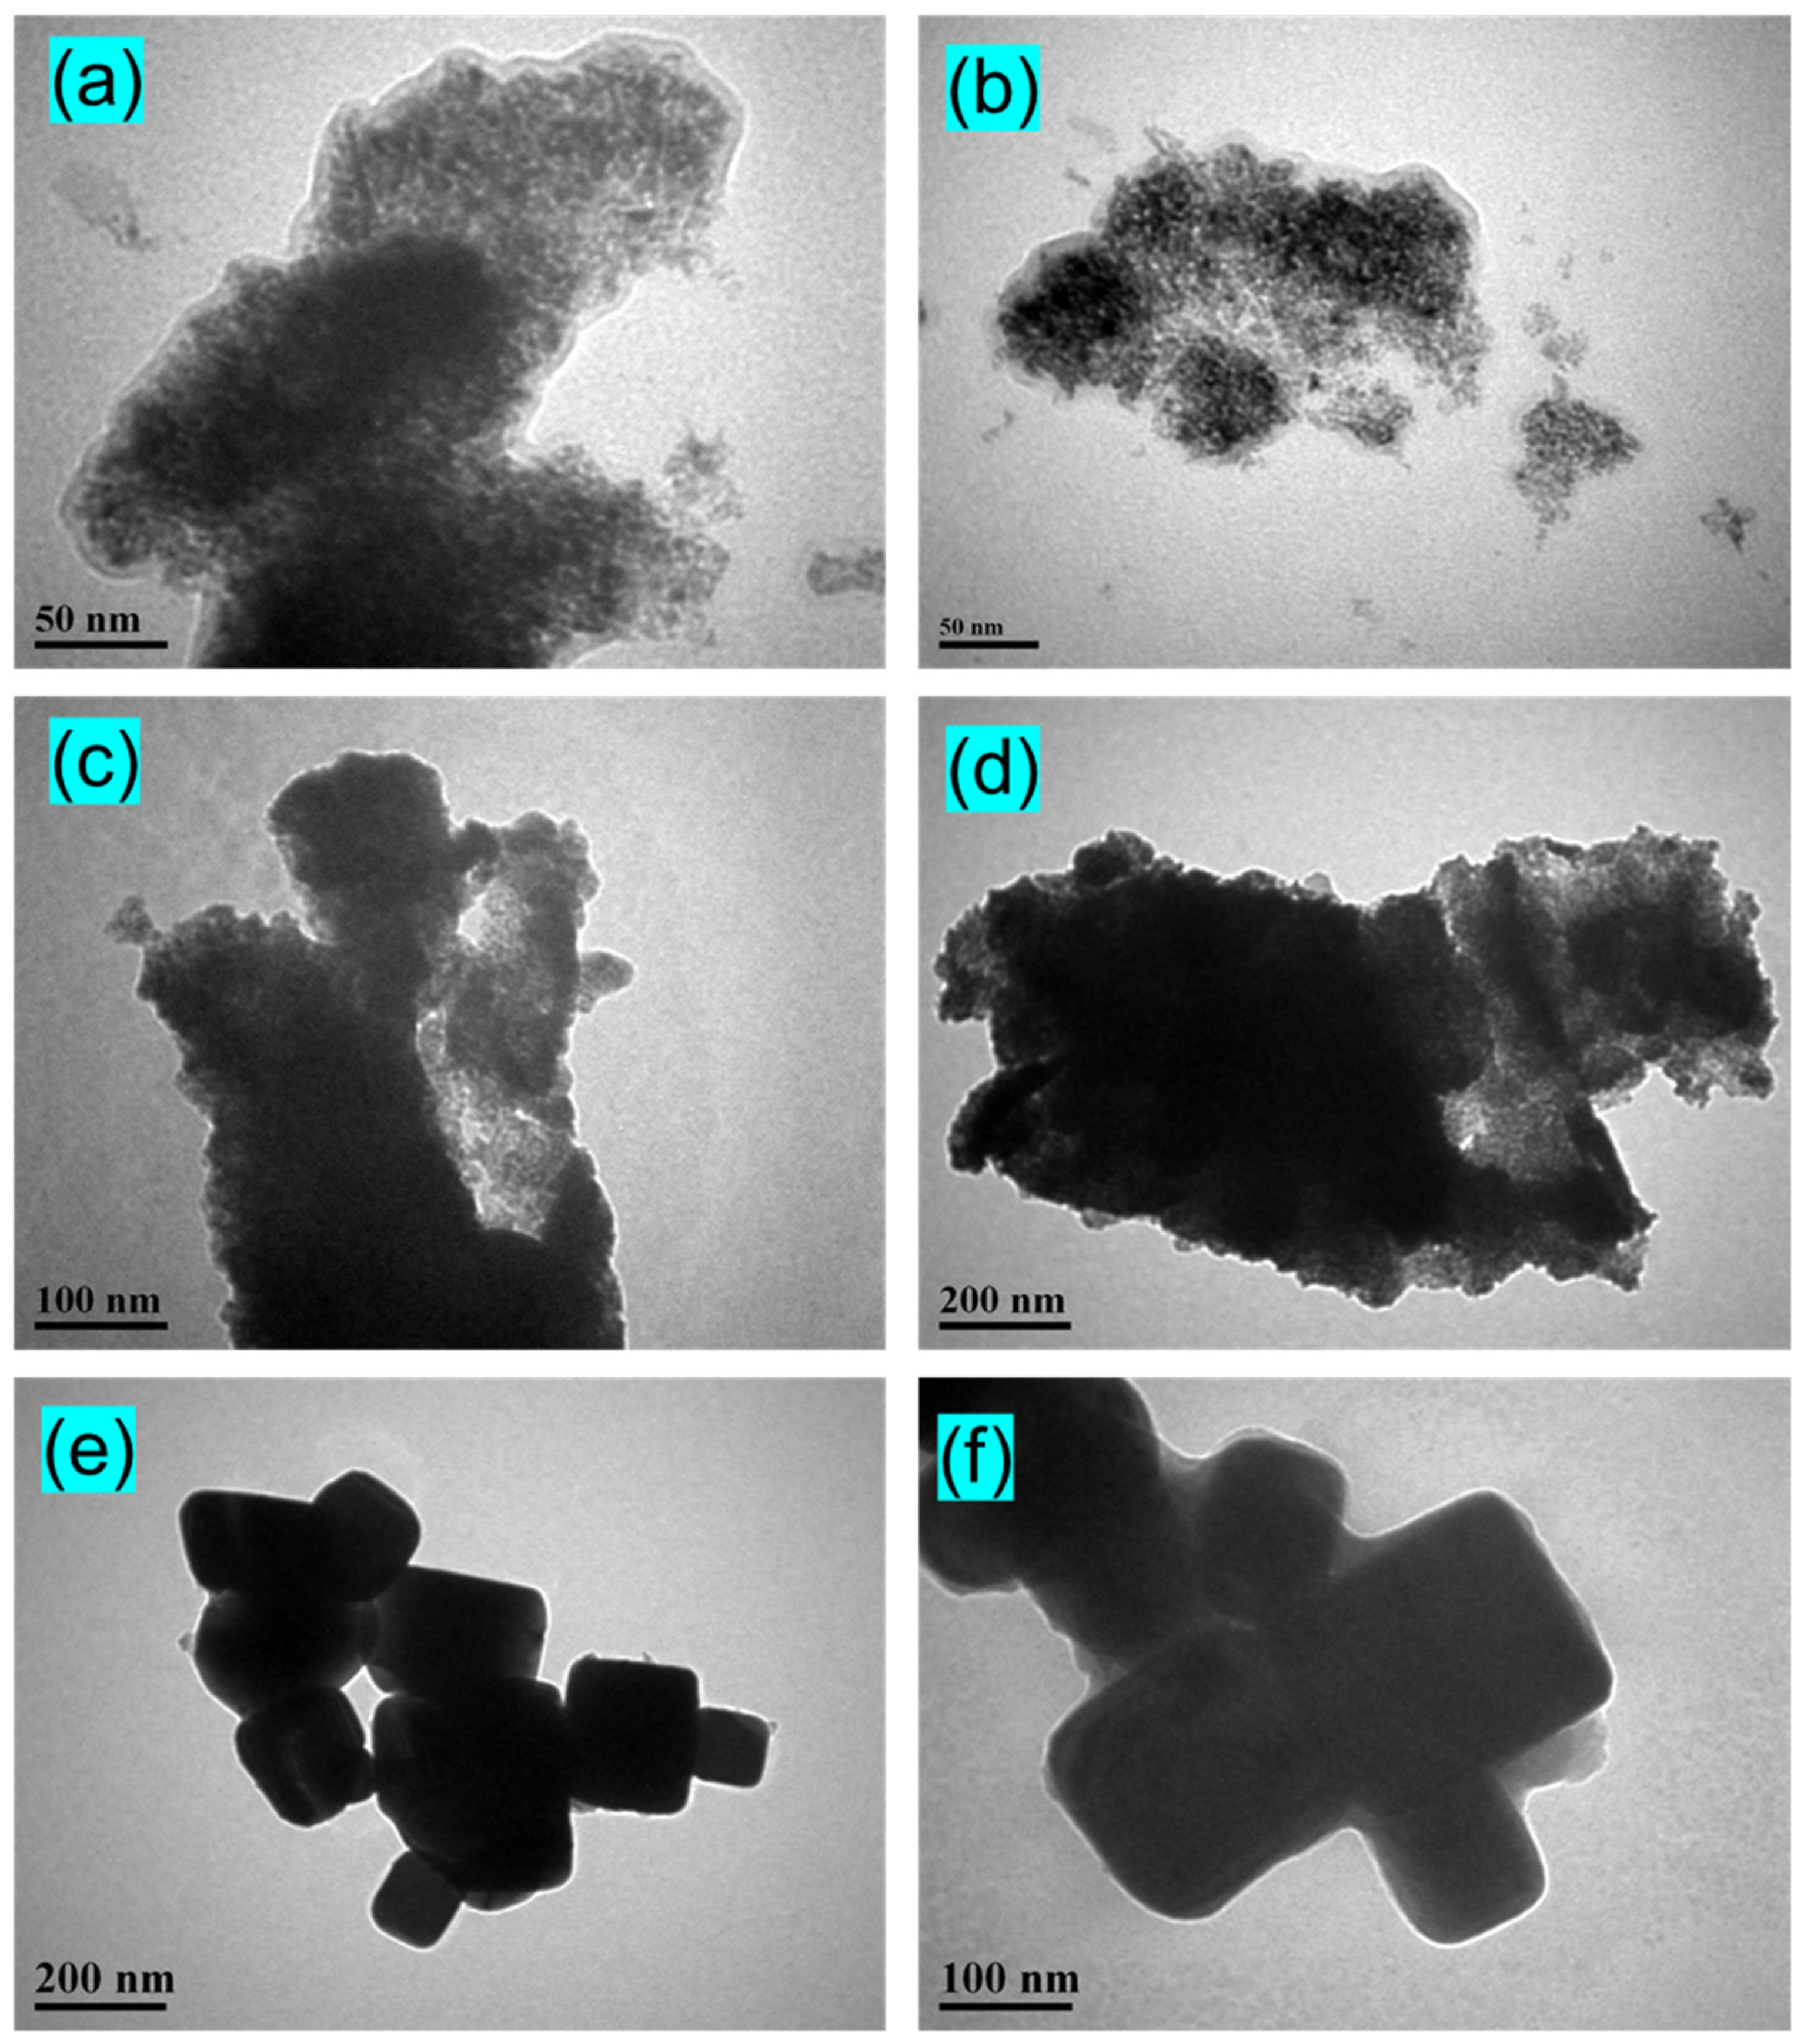
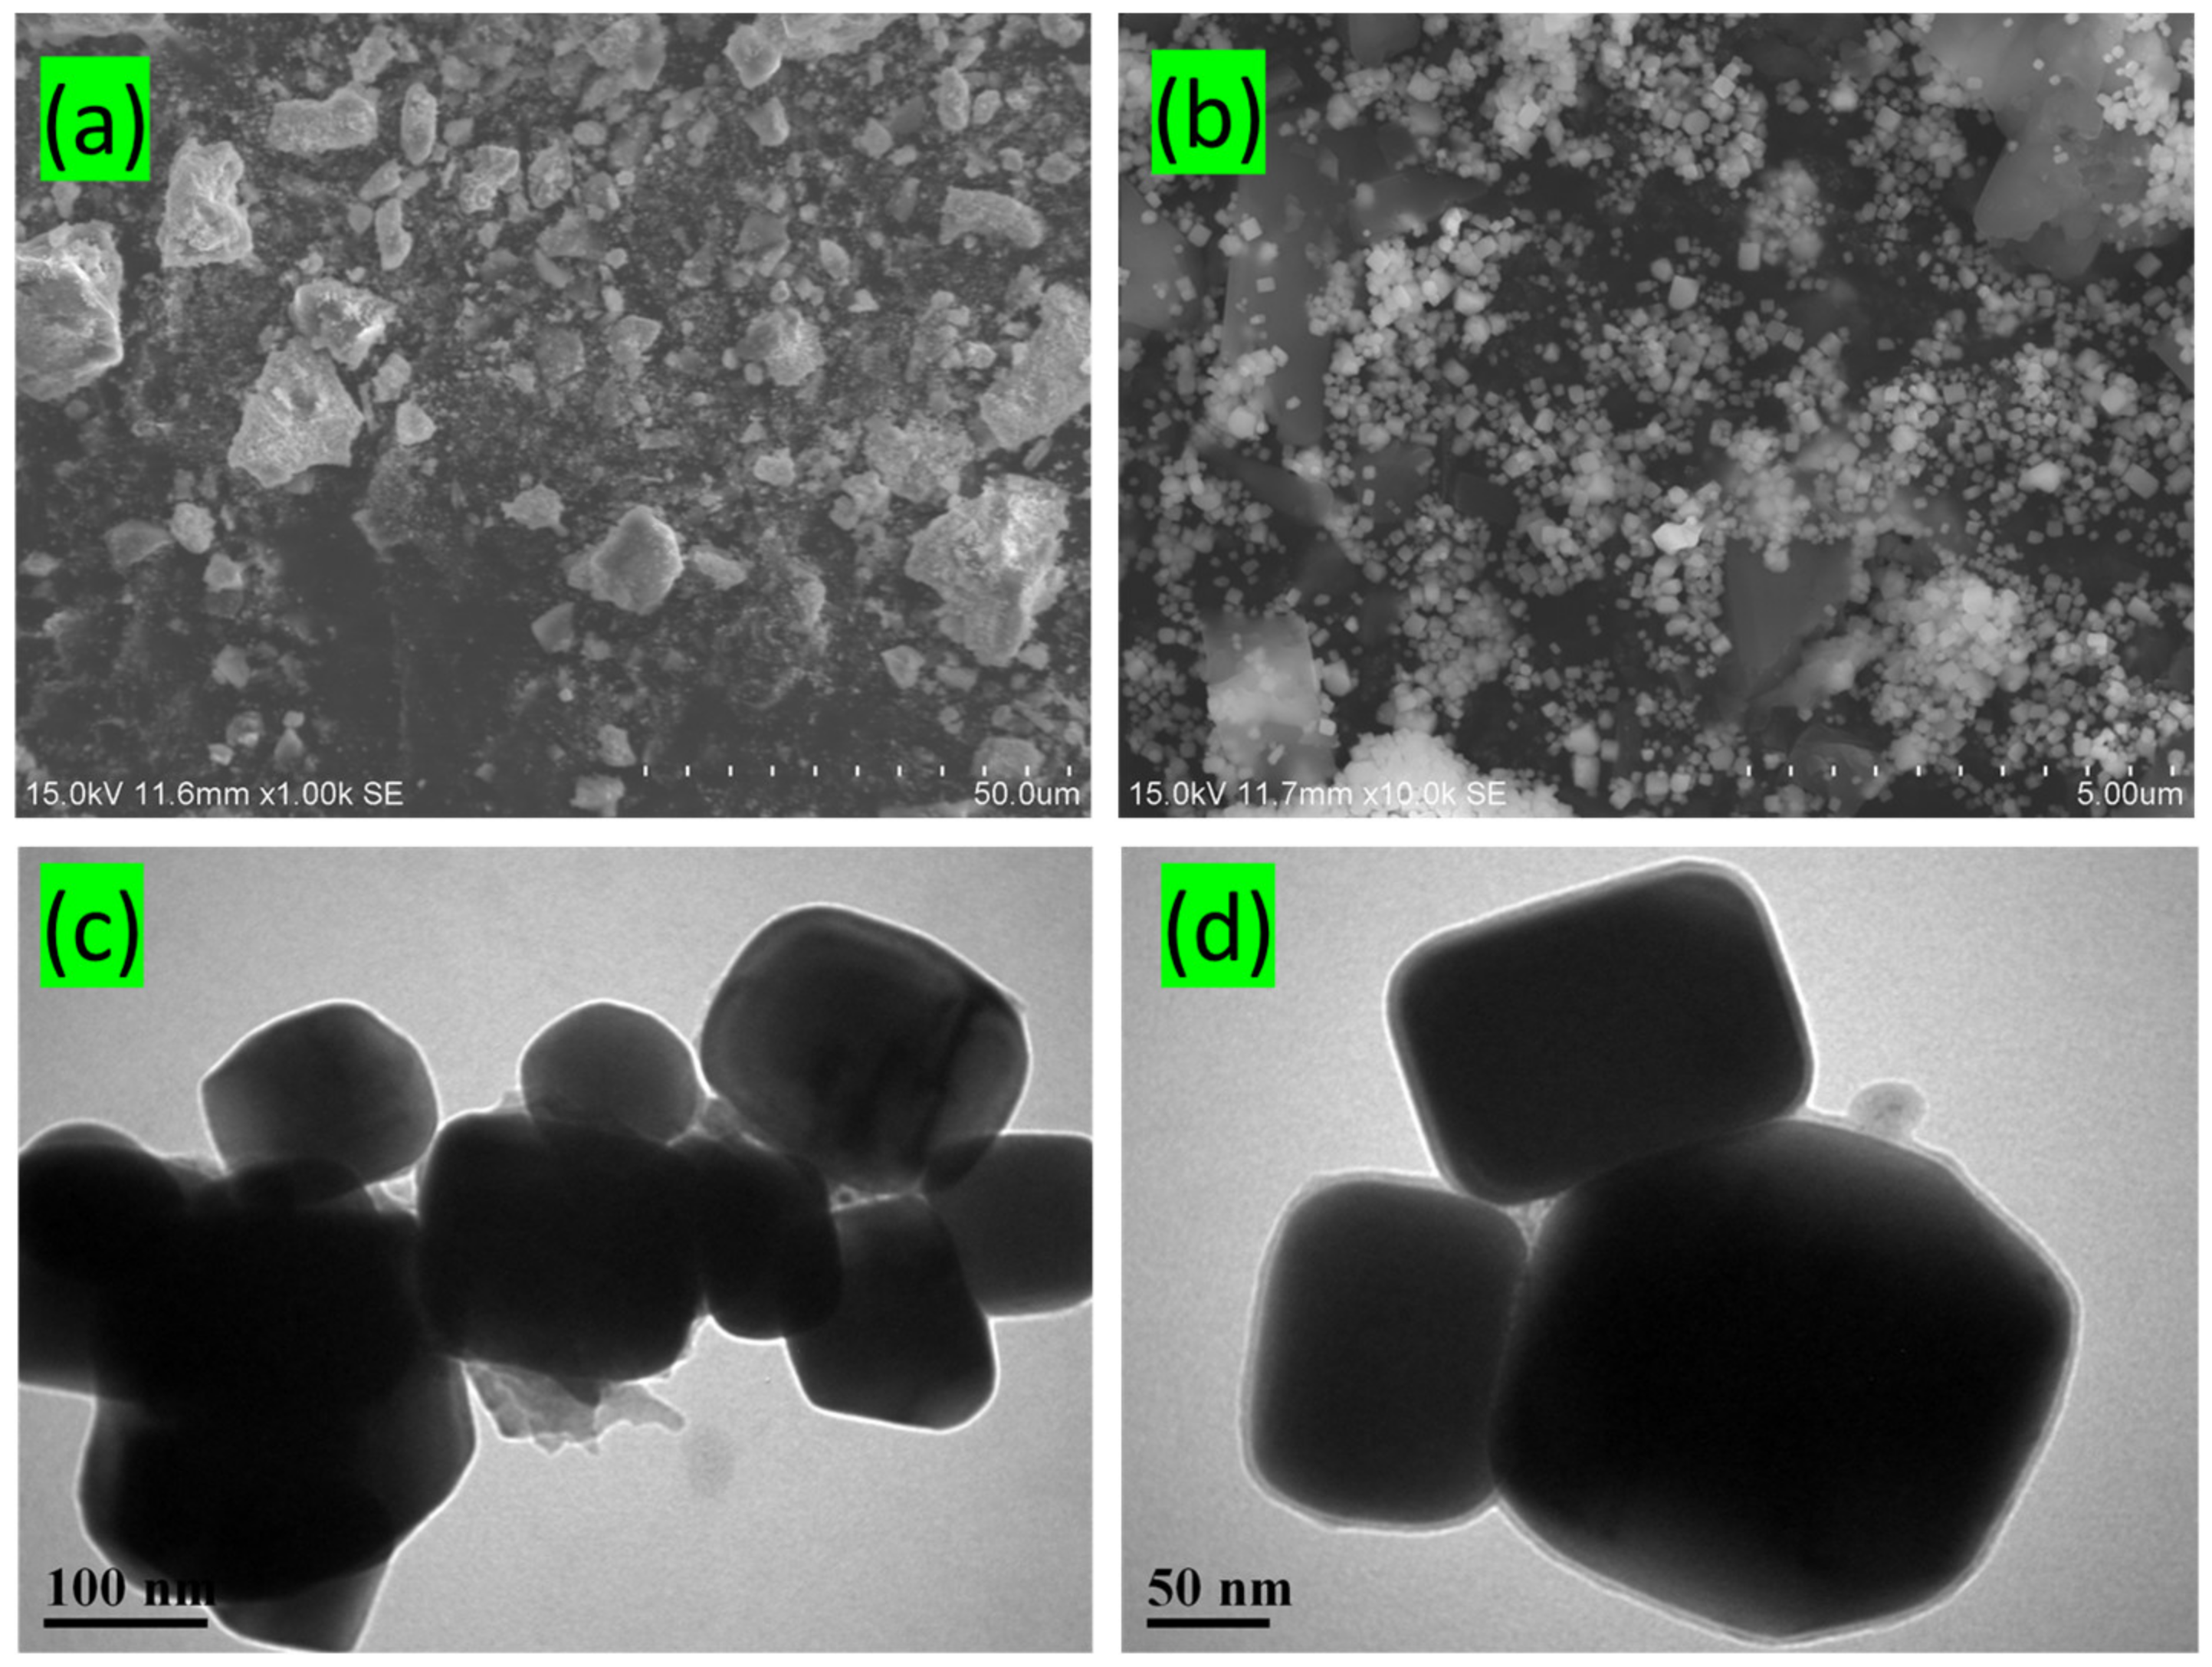
3.2. Morphological Study
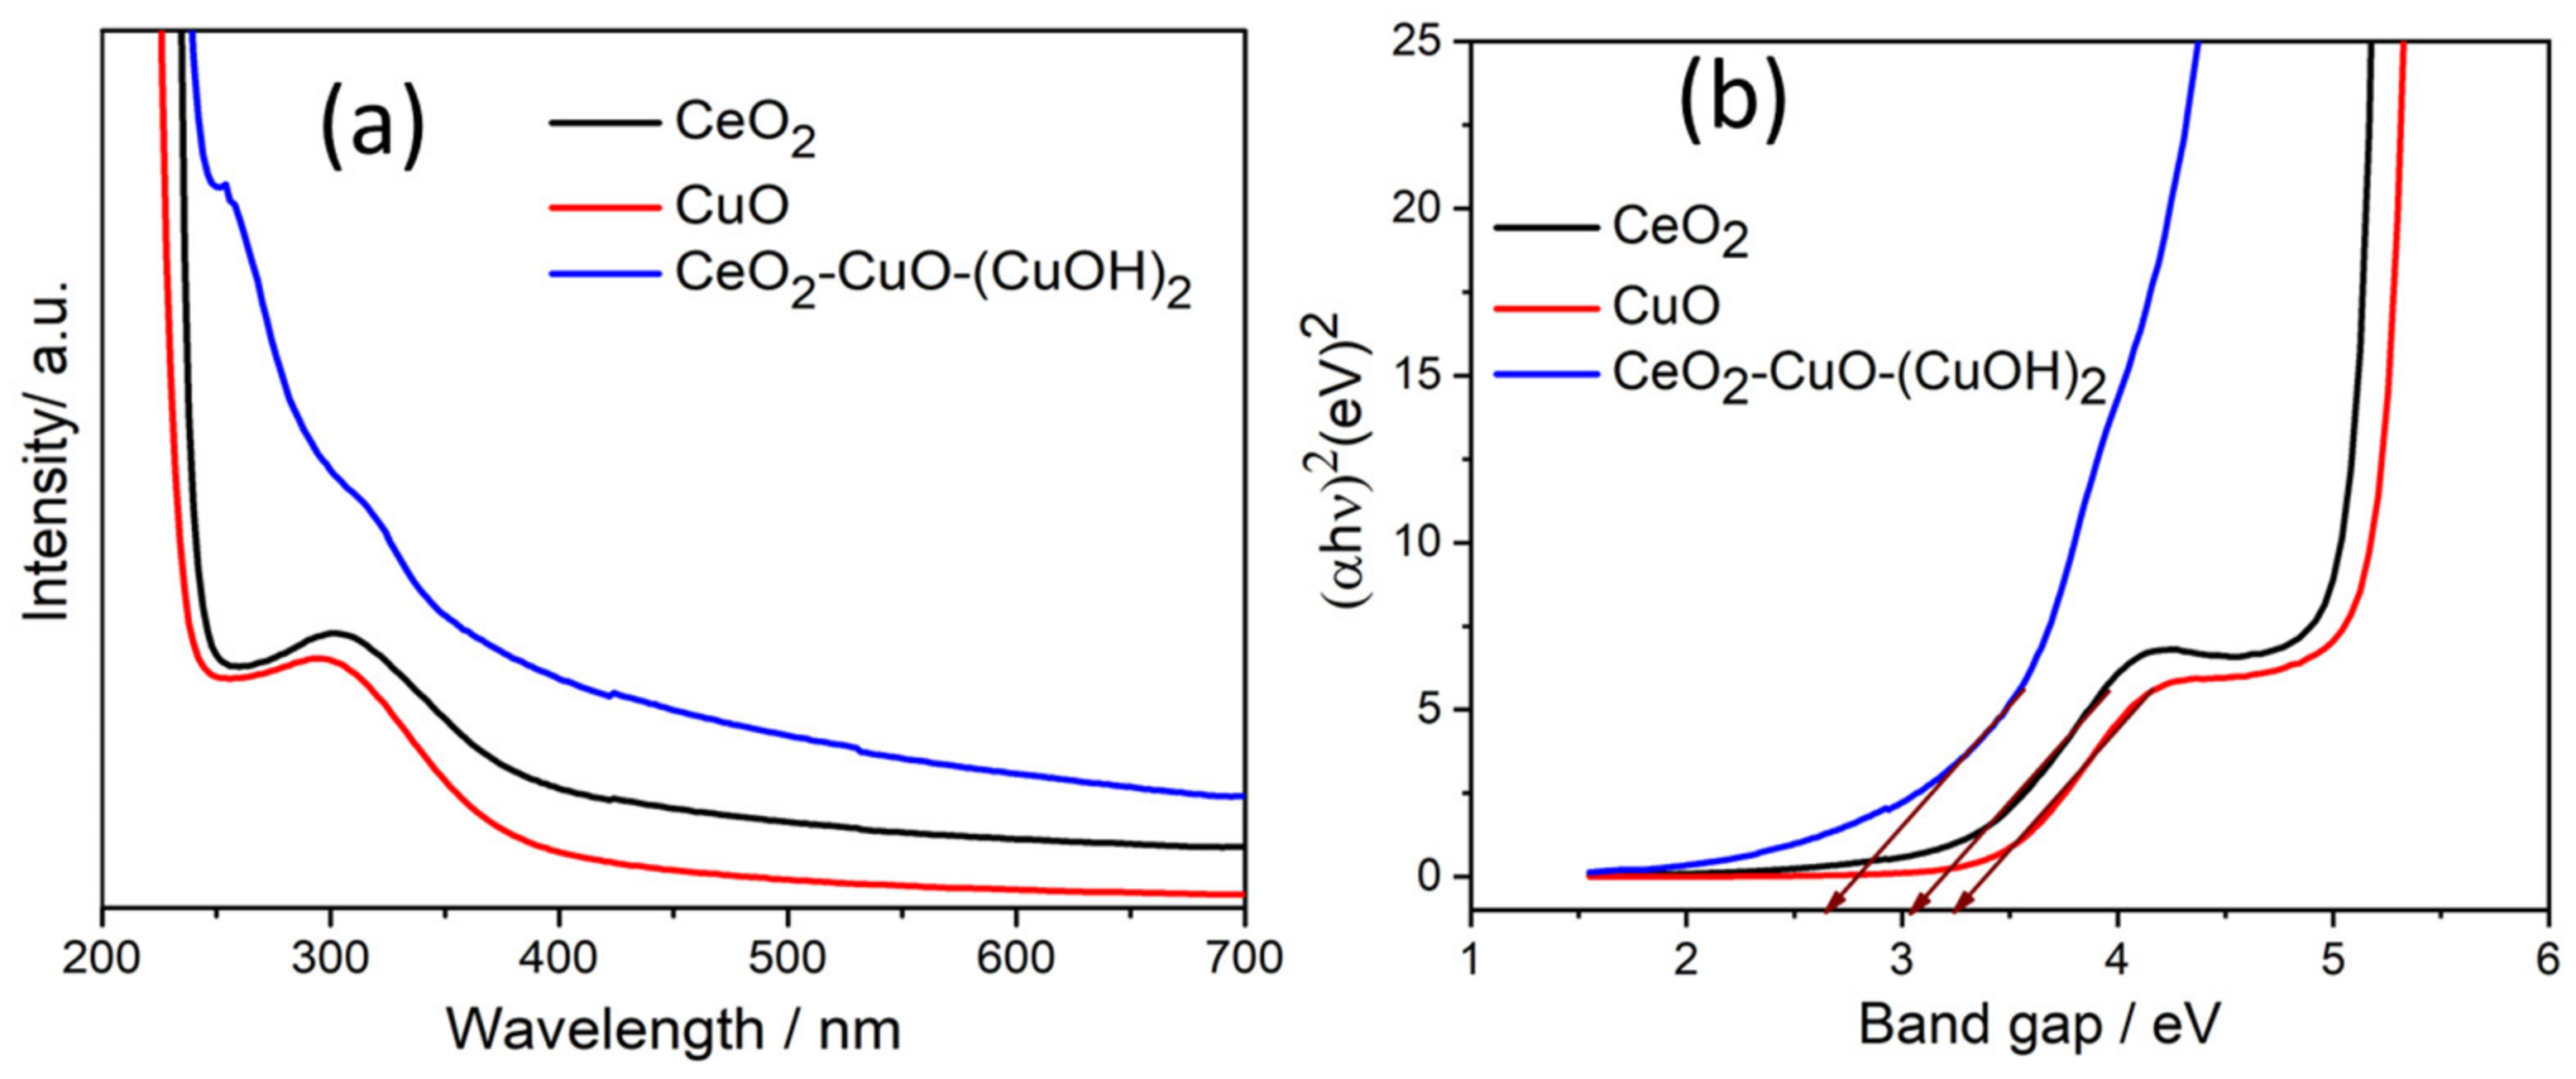
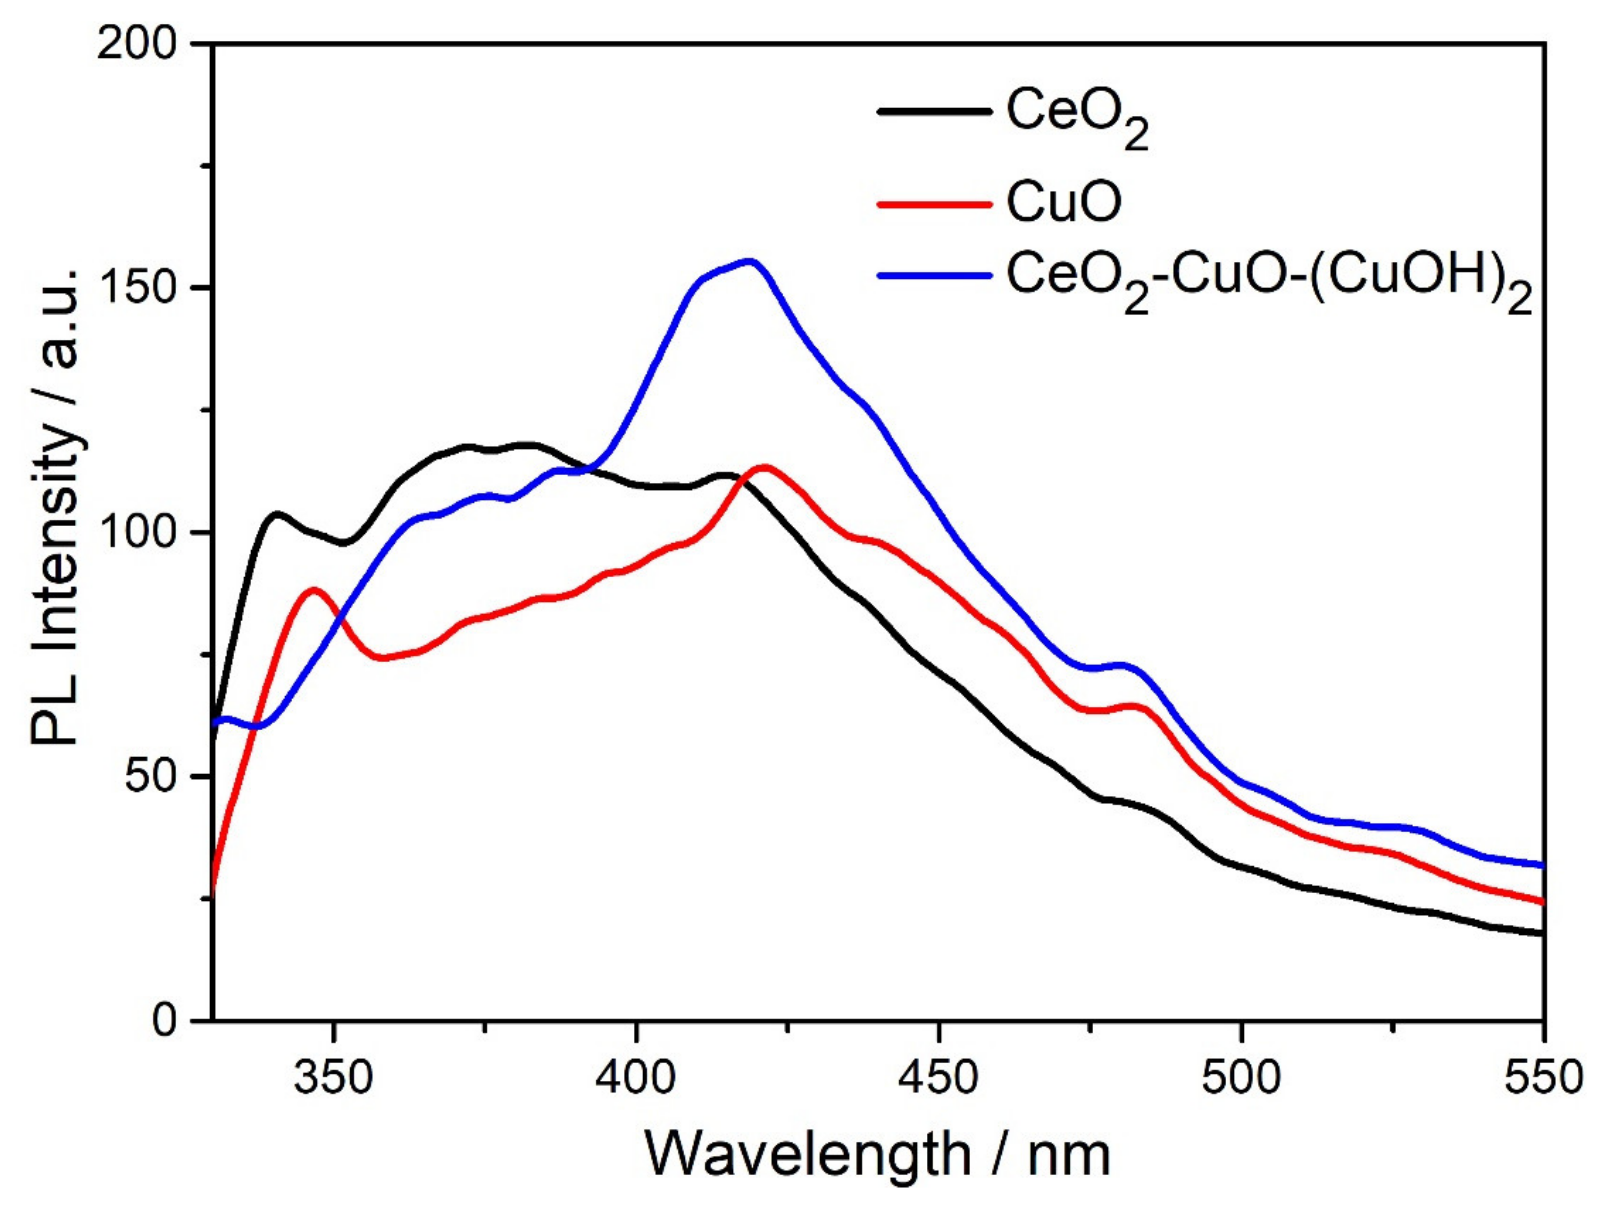
3.3. Optical Study
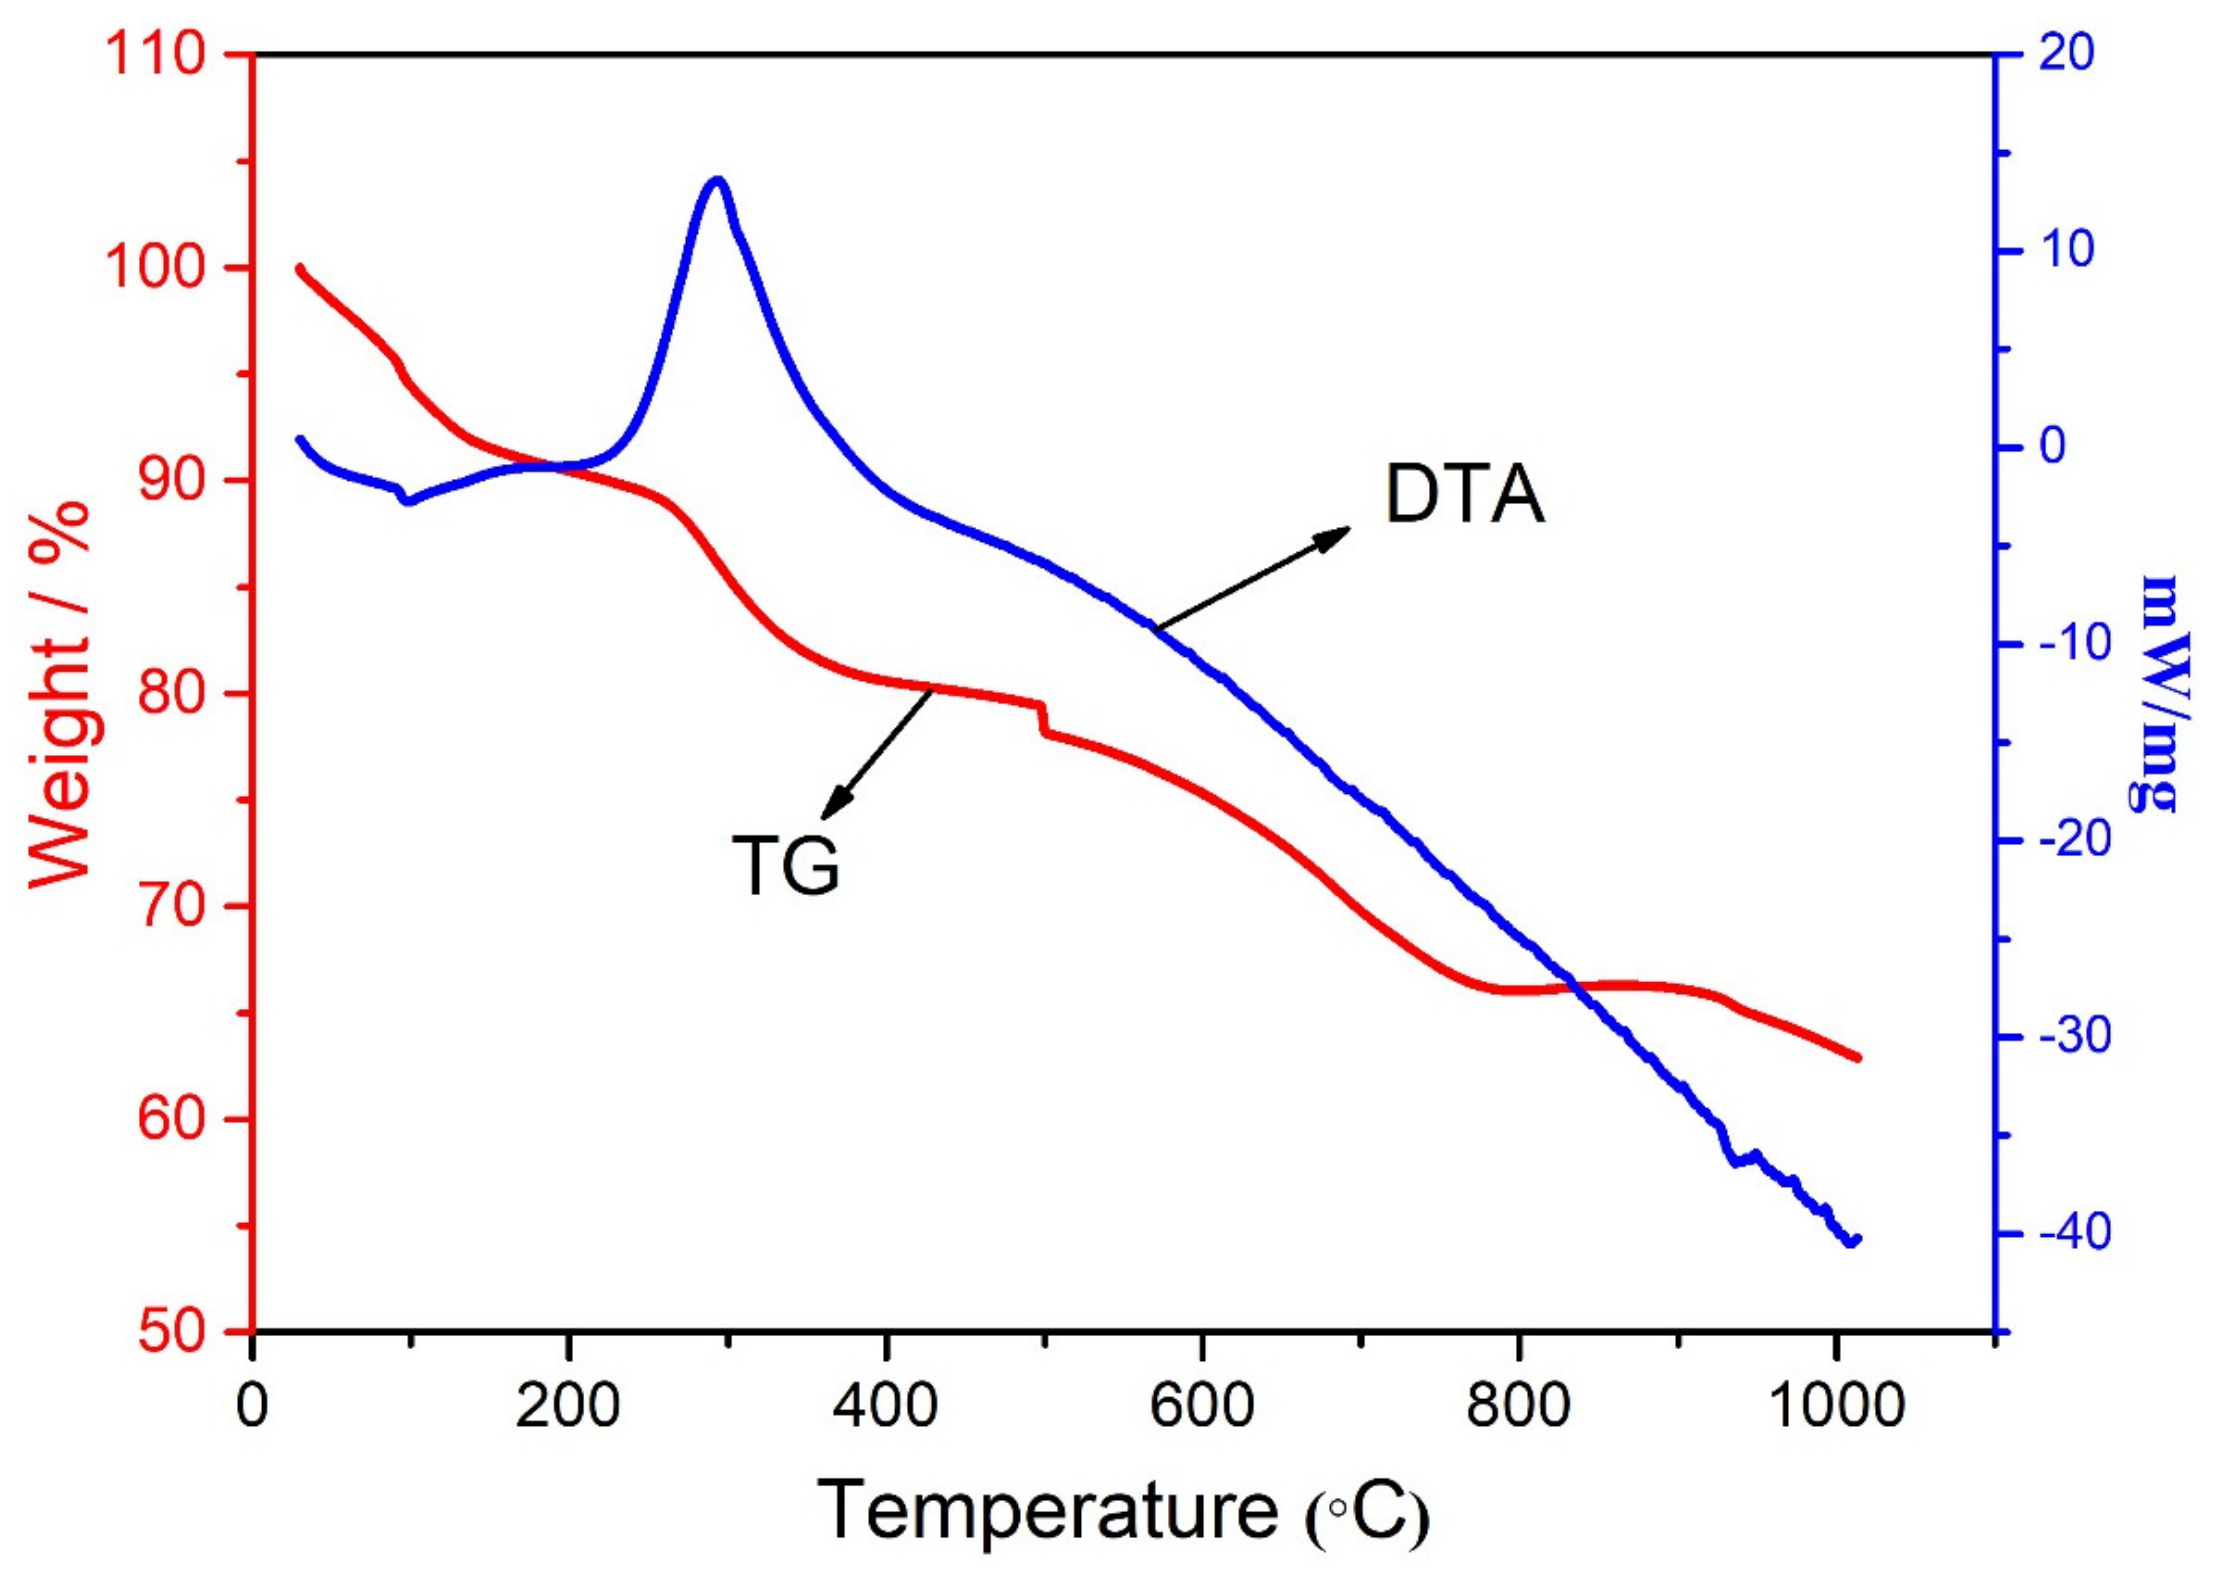
3.4. Thermal Study
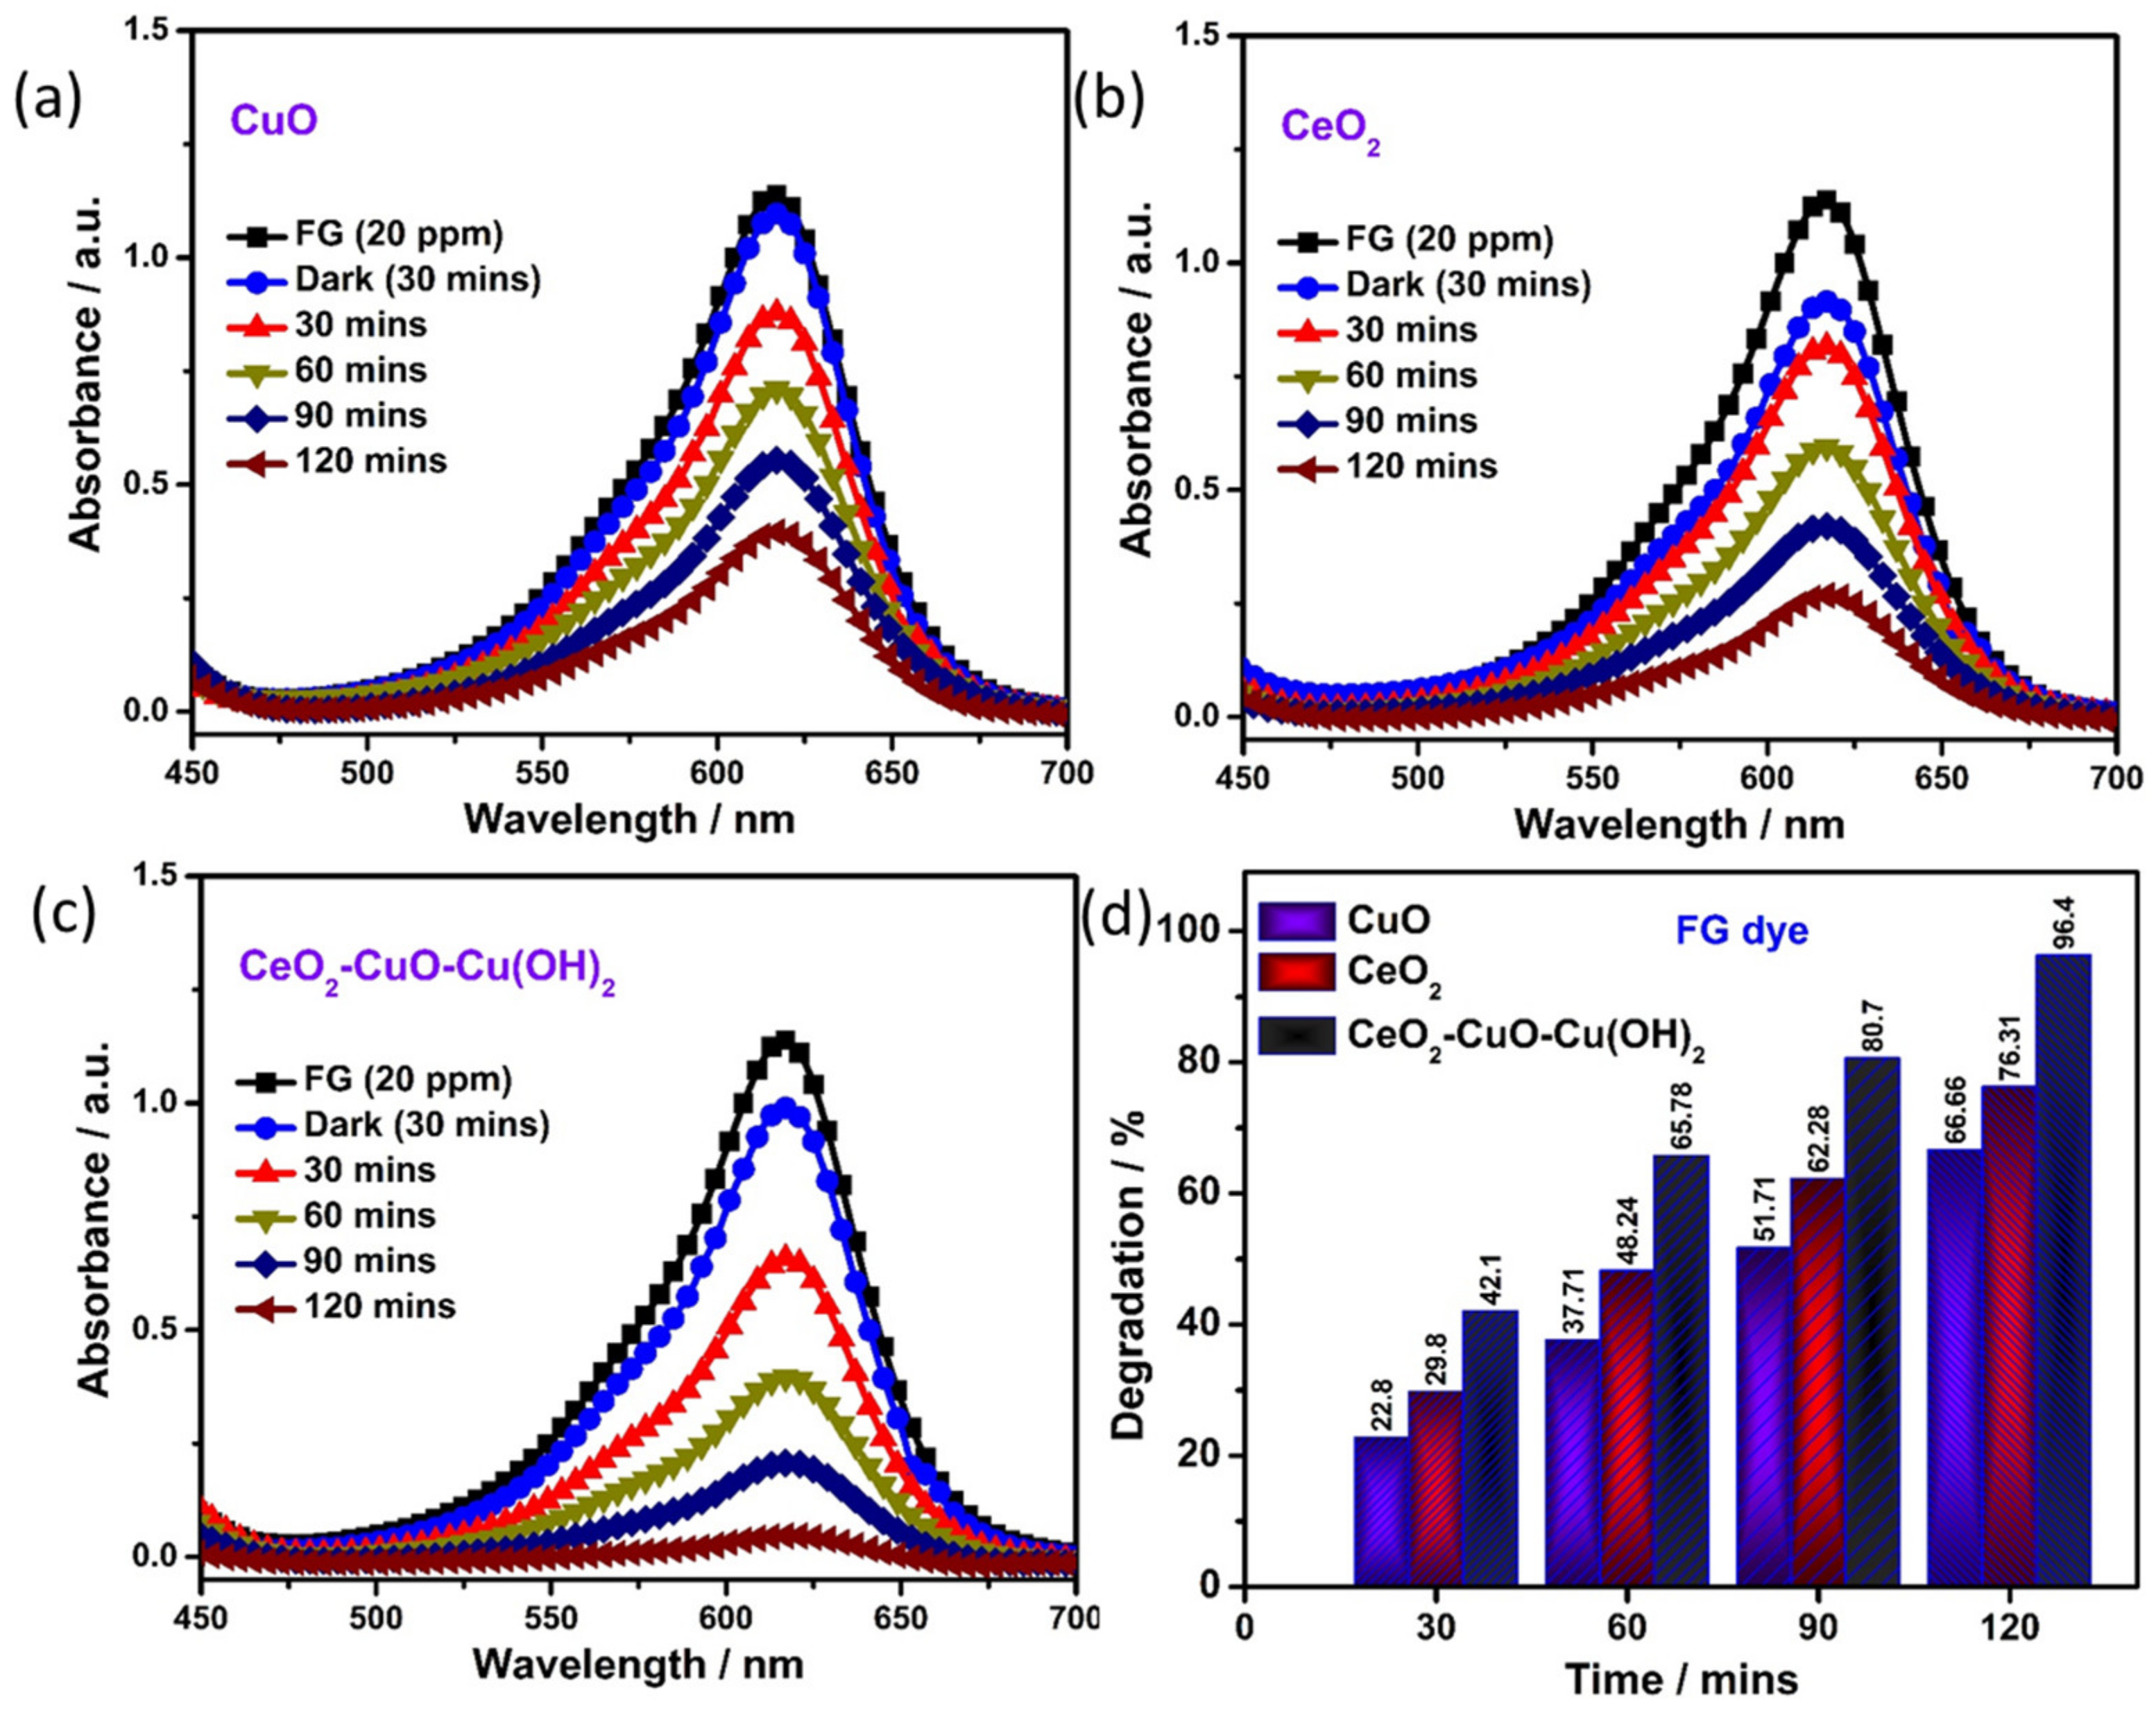
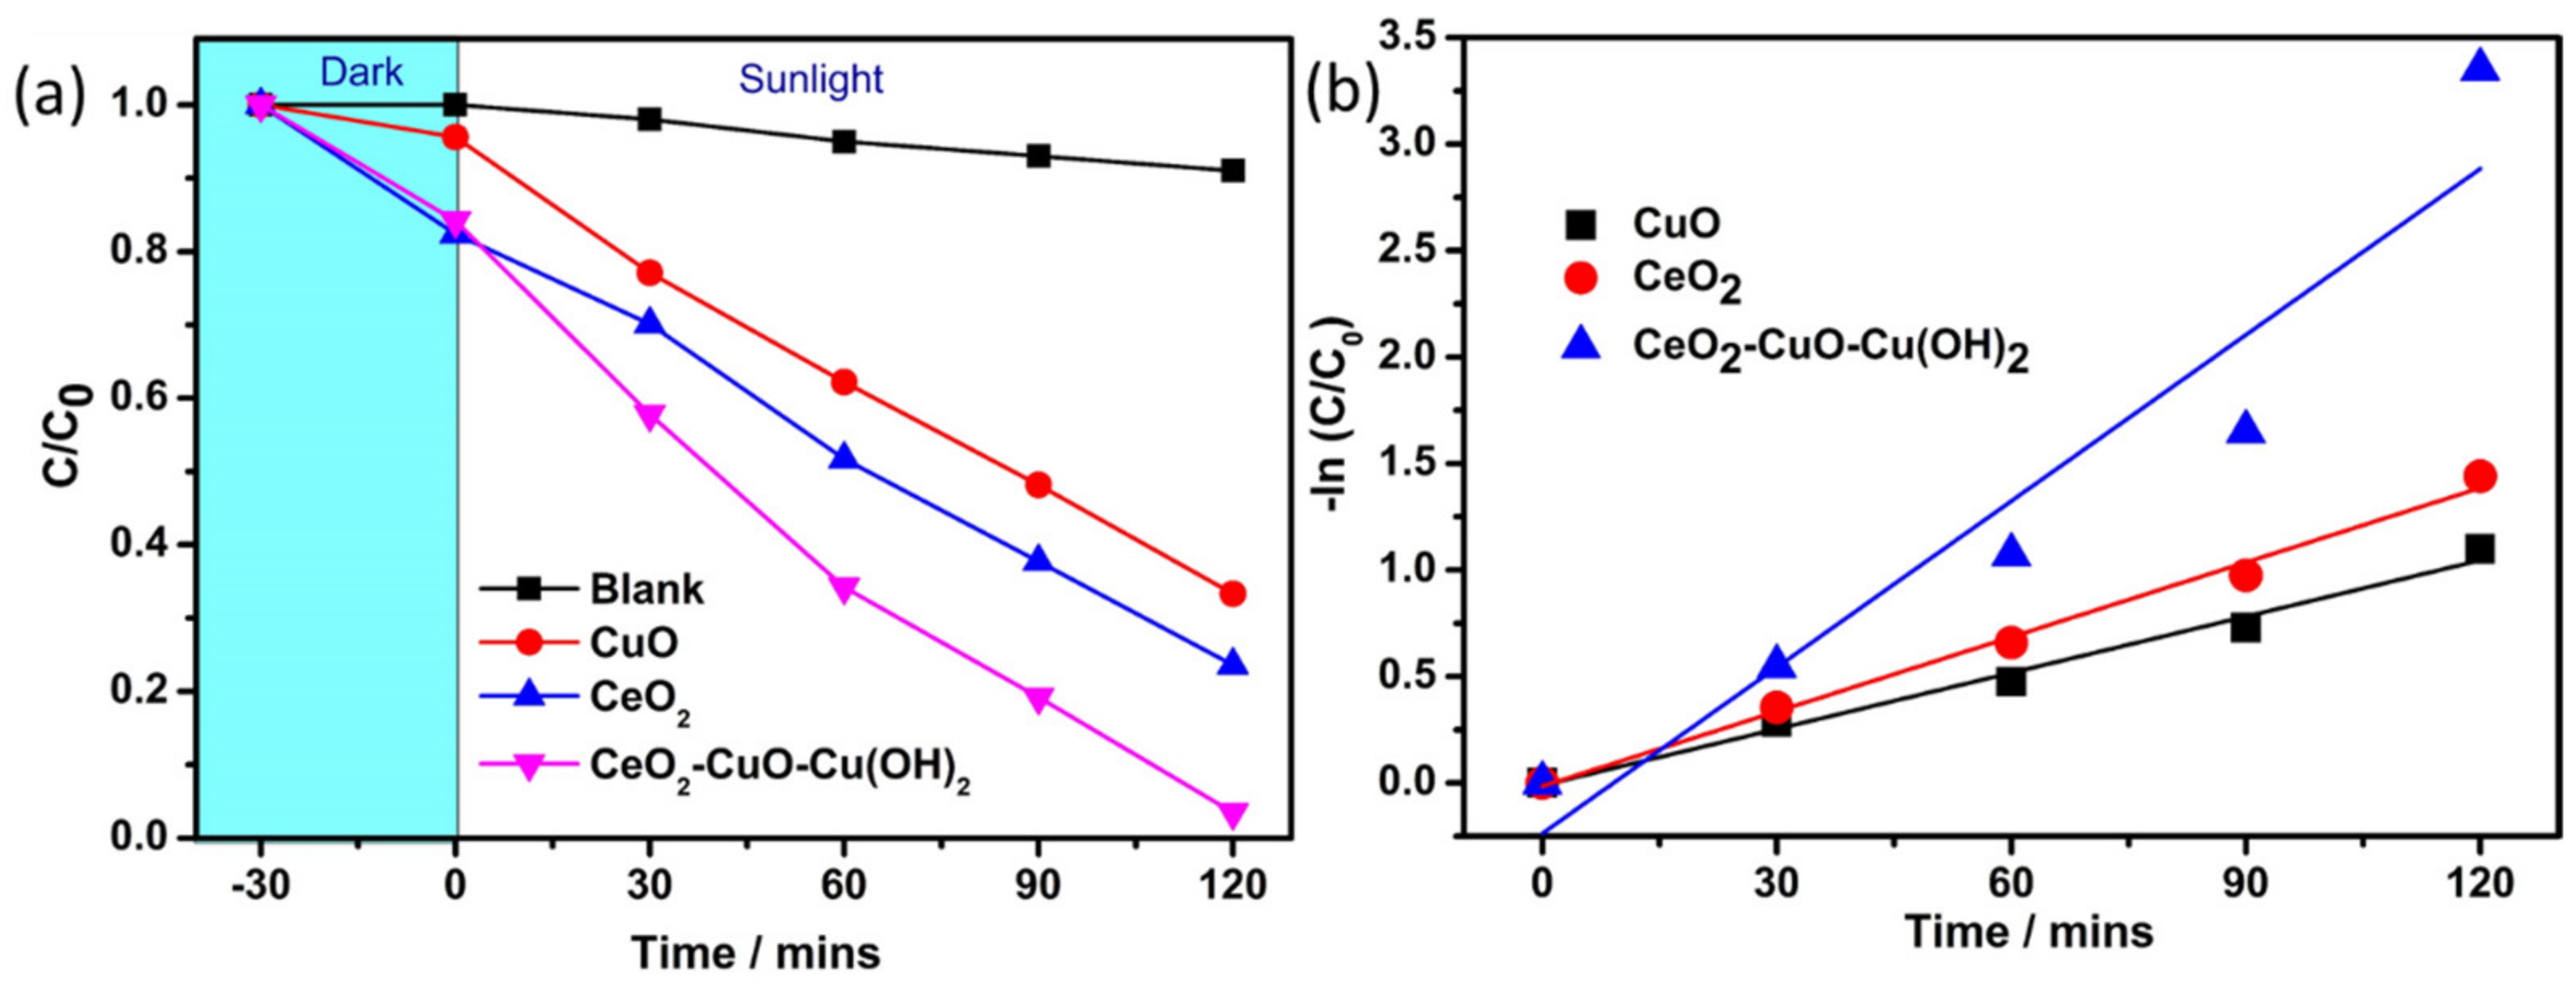
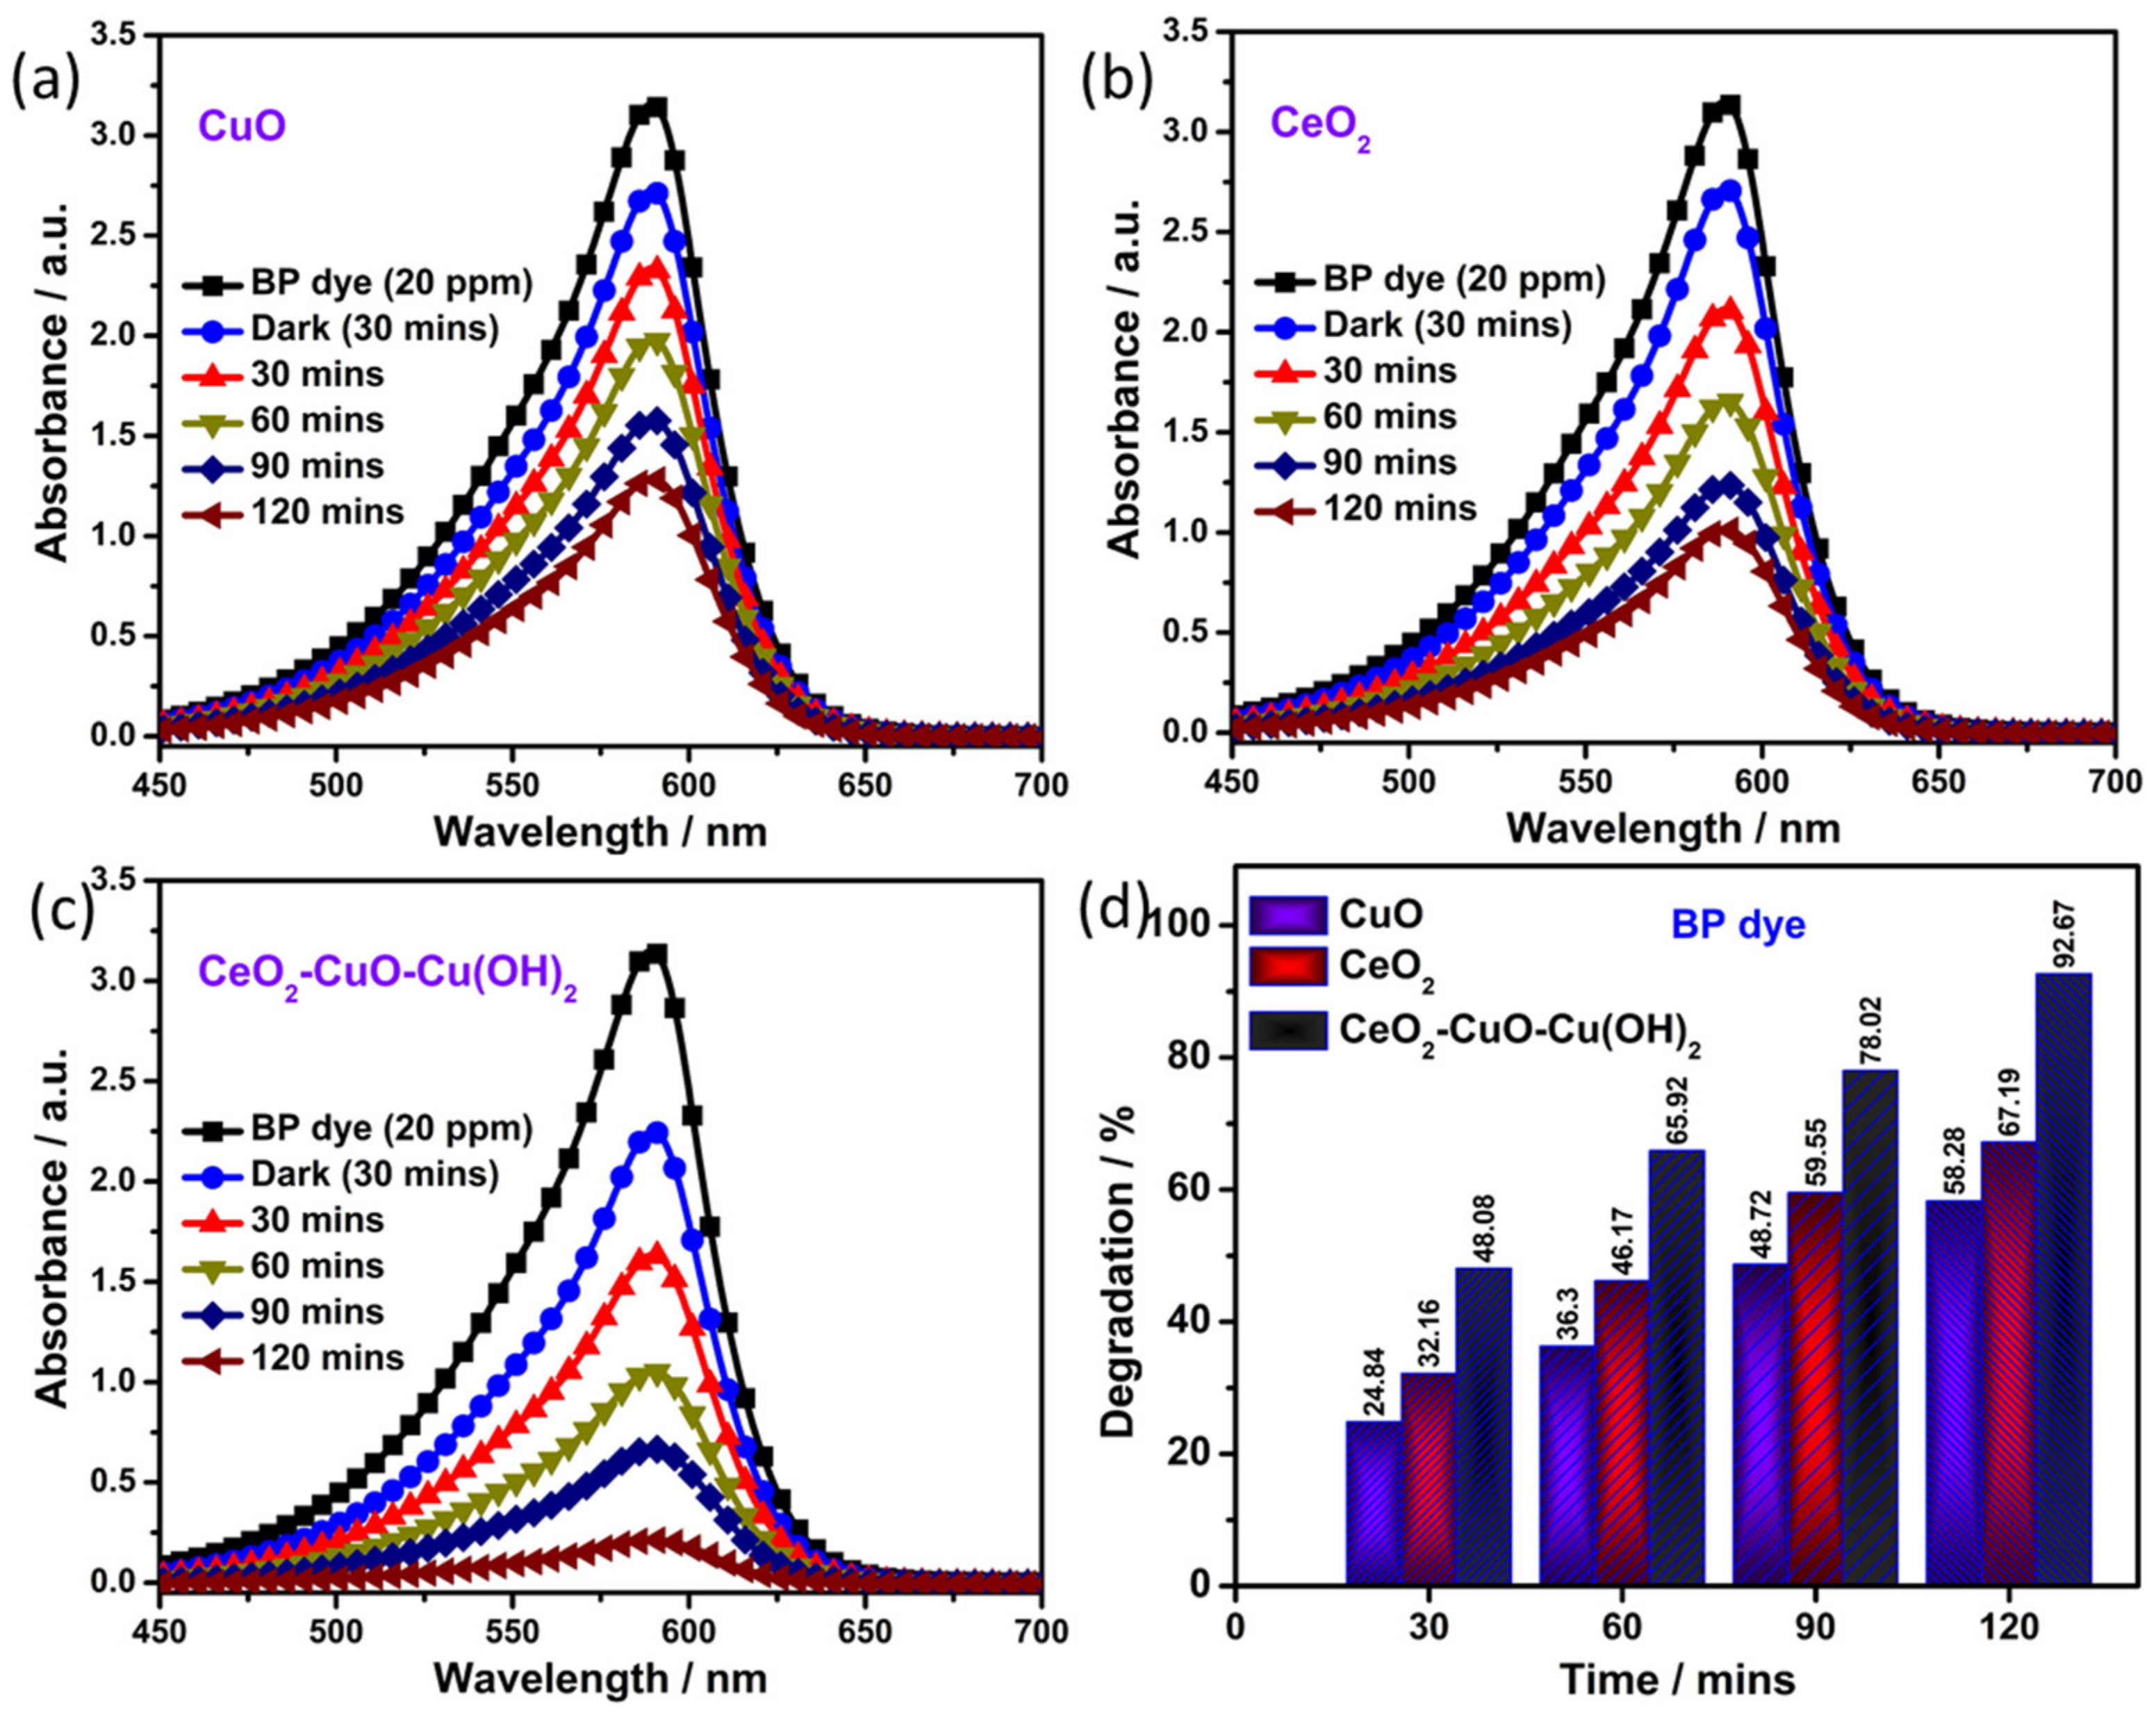
3.5. Photocatalytic Degradation of Textile Dye
4. Conclusions
Author Contributions
Funding
Data Availability Statement
Acknowledgments
Conflicts of Interest
References
- Mock, S.A.; Sharp, S.E.; Stoner, T.R.; Radetic, M.J.; Zell, E.T.; Wang, R. CeO2 nanorods-supported transition metal catalysts for CO oxidation. J. Colloid Interface Sci. 2016, 466, 261. [Google Scholar] [CrossRef]
- Zhang, S.M.; Huang, W.P.; Qiu, X.H.; Li, B.Q.; Zheng, X.C.; Wu, S.H. Comparative study on catalytic properties for low-temperature CO oxidation of Cu/CeO2 and CuO/CeO2 prepared via solvated metal atom impregnation and conventional impregnation. Catal. Lett. 2002, 80, 41. [Google Scholar] [CrossRef]
- Yao, S.Y.; Xu, W.Q.; Johnston-Peck, A.C.; Zhao, F.Z.; Liu, Z.Y.; Luo, S.; Senanayake, S.D.; Martinez-Arias, A.; Liu, W.J.; Rodriguez, J.A. Morphological effects of the nanostructured ceria support on the activity and stability of CuO/CeO2 catalysts for the water gas shift reaction. Phys. Chem. Chem. Phys. 2014, 16, 17183. [Google Scholar] [CrossRef]
- Zhuan, H.D.; Bai, S.F.; Liu, X.M.; Yan, Z.F. Structure and performance of Cu/ZrO2 catalyst for the synthesis of methanol from CO2 hydrogenation. J. Fuel Chem. Technol. 2010, 38, 462. [Google Scholar] [CrossRef]
- Hu, C.; Zhu, Q.; Jiang, Z.; Zhang, Y.; Wang, Y. Preparation and formation mechanism of mesoporous CuO–CeO2 mixed oxides with excellent catalytic performance for removal of VOCs. Microporous Mesoporous Mater. 2008, 113, 427. [Google Scholar] [CrossRef]
- Flytzani-Stephanopoulos, M.; Zhu, T.; Li, Y. Ceria-based catalysts for the recovery of elemental sulfur from SO2-laden gas streams. Catal. Today 2000, 62, 145. [Google Scholar] [CrossRef]
- Barbato, P.S.; Colussi, S.; Benedetto, A.D.; Landi, G.; Lisi, L.; Llorca, J.; Trovarelli, A. Origin of high activity and selectivity of CuO/CeO2 catalysts prepared by solution combustion synthesis in CO-PROX reaction. J. Phys. Chem. C 2016, 120, 13039. [Google Scholar] [CrossRef]
- Guo, X.; Li, J.; Zhou, R. Catalytic performance of manganese doped CuO-CeO2 catalysts for selective oxidation of CO in hydrogen-rich gas. Fuel 2016, 163, 56. [Google Scholar] [CrossRef]
- Zabilsky, M.; Djinovic, P.; Tchernychova, E.; Tkachenko, O.P.; Kustov, L.M.; Pintar, A. Nanoshaped CuO/CeO2 materials: Effect of the exposed ceria surfaces on catalytic activity in N2O decomposition reaction. ACS Catal. 2015, 5, 5357. [Google Scholar] [CrossRef]
- Avgouropoulos, G.; Ioannides, T.; Matralis, H. Influence of the preparation method on the performance of CuO-CeO2 catalysts for the selective oxidation of CO. Appl. Catal. B Environ. 2005, 56, 87. [Google Scholar] [CrossRef]
- Zhou, K.; Xu, R.; Sun, X.; Chen, H.; Tian, Q.; Shen, D.; Li, Y. Favorable synergistic effects between CuO and the reactive planes of ceria nanorods. Catal. Lett. 2005, 101, 169. [Google Scholar] [CrossRef]
- Liu, L.; Yao, Z.; Deng, Y.; Gao, F.; Liu, B.; Dong, L. Morphology and crystal-place effects of nanoscale ceria on the activity of CuO/CeO2 for NO reduction by CO. ChemCatChem 2011, 3, 978. [Google Scholar] [CrossRef]
- Zheng, X.; Zhang, X.; Wang, X.; Wang, S.; Wu, S. Preparation and characterization of CuO/CeO2 catalysts and their applications in low-temperature CO oxidation. Appl. Catal. A Gen. 2005, 295, 142. [Google Scholar] [CrossRef]
- Avgouropoulos, G.; Ioannides, T. Effect of synthesis parameters on catalytic properties of CuO-CeO2. Appl. Catal. B Environ. 2006, 67, 1. [Google Scholar] [CrossRef]
- Li, K.; Peng, B.; Peng, T. Recent advances in heterogeneous photocatalytic CO2 conversion to solar fuels. ACS Catal. 2016, 6, 7485. [Google Scholar] [CrossRef]
- Singh, J.; Juneja, S.; Soni, R.K.; Bhattacharya, J. Sunlight mediated enhanced photocatalytic activity of TiO2 nanoparticles functionalized CuO–Cu2O nanorods for removal of methylene blue and oxytetracycline hydrochloride. J. Colloid Interface Sci. 2021, 590, 60. [Google Scholar] [CrossRef]
- Seeharaj, P.; Kongmun, P.; Paiplod, P.; Prakobmit, S.; Sriwong, C.; Kim-Lohsoontorn, P.; Vittayakorn, N. Ultrasonically-assisted surface modified TiO(2)/rGO/CeO2 heterojunction photocatalysts for conversion of CO2 to methanol and ethanol. Ultrason. Sonochem. 2019, 58, 104657. [Google Scholar] [CrossRef] [PubMed]
- Magesh, G.; Viswanathan, B.; Viswanath, R.P.; Varadarajan, T.K. Photocatalytic behavior of CeO2–TiO2 system for the degradation of methylene blue. Indian J. Chem. 2009, 48, 480. [Google Scholar]
- Abdullah, H.; Khan, M.R.; Pudukudy, M.; Yaakob, Z.; Ismail, N.A. CeO2–TiO2 as a visible light active catalyst for the photo reduction of CO2 to methanol. J. Rare Earths 2015, 33, 1155. [Google Scholar] [CrossRef]
- Ghasemi, S.; Setayesh, S.R.; Habibi-Yangjeh, A.; Hormozi-Nezhad, M.R.; Gholami, M.R. Assembly of CeO2–TiO2 nanoparticles prepared in room temperature ionic liquid on graphene nanosheets for photocatalytic degradation of pollutants. J. Hazard. Mater. 2012, 199, 170–178. [Google Scholar] [CrossRef]
- Sarli, V.D.; Landi, G.; Benedetto, A.D.; Lisi, L. Synergy between Ceria and Metals (Ag or Cu) in Catalytic Diesel Particulate Filters: Effect of the Metal Content and of the Preparation Method on the Regeneration Performance. Top. Catal. 2021, 64, 256. [Google Scholar] [CrossRef]
- Govindarajan, D.; Murugadoss, G.; Kirubaharan, K.; Kumar, M.R.; Manibalan, G.; Shaikh, J.; Etesami, M.; Kheawhom, S. Improved electrochemical supercapacitive properties of CuO-Ni(OH)2 nanocomposites by eco-friendly low-temperature synthesis. J. Alloys Compd. 2023, 942, 169130. [Google Scholar] [CrossRef]
- Kim-Lohsoontorn, P.; Tiyapongpattan, V.; Asarasri, N.; Seeharaj, P.; Laosiripojan, N. Preparation of CeO2 nanorods through a sonication-assisted precipitation. Int. J. Appl. Ceram. Technol. 2014, 11, 645. [Google Scholar] [CrossRef]
- Manibalan, G.; Murugadoss, G.; Hazra, S.; Marimuthu, R.; Manikandan, C.; Rajabathar, J.R.; Kumar, M.R. A facile synthesis of Sn-doped CeO2 nanoparticles: High performance electrochemical nitrite sensing application. Inorg. Chem. Commun. 2022, 135, 109096. [Google Scholar] [CrossRef]
- Manibalan, G.; Murugadoss, G.; Kuppusami, P.; Kandhasamy, N.; Kumar, M.R. Synthesis of heterogeneous NiO nanoparticles for high performance electrochemical supercapacitor application. J. Mater. Sci. Mater. Electron. 2021, 32, 5945–5954. [Google Scholar] [CrossRef]
- Gao, Y.; Qian, K.; Xu, B.; Li, Z.; Zheng, J.; Zhao, S.; Ding, F.; Sun, Y.; Xu, Z. Recent advances in visible-light-driven conversion of CO2 by photocatalysts into fuels or value-added chemicals. Carbon Resour. Convers. 2020, 3, 46–59. [Google Scholar] [CrossRef]
- Soltanabadi, Y.; Jourshabani, M.; Shariatinia, Z. Synthesis of novel CuO/LaFeO3 nanocomposite photocatalysts with superior Fenton-like and visible light photocatalytic activities for degradation of aqueous organic contaminants. Sep. Purif. Technol. 2018, 202, 227. [Google Scholar] [CrossRef]
- Velasco-Soto, M.A.; Pérez-García, S.A.; Alvarez-Quintana, J.; Cao, Y.; Nyborg, L.; Licea-Jiménez, L. Selective band gap manipulation of graphene oxide by its reduction with mild reagents. Carbon 2015, 93, 967. [Google Scholar] [CrossRef]
- Abid Sehrawat, P.; Islam, S.S.; Mishra, P.; Ahmad, S. Reduced graphene oxide (rGO) based wideband optical sensor and the role of temperature, defect states and quantum efficiency. Sci. Rep. 2018, 8, 3537. [Google Scholar] [CrossRef]
- Liu, J.; Zhang, X.; Zhong, Q.; Li, J.; Wu, H.; Zhang, B.; Jin, L.; Tao, H.B.; Liu, B. Electrostatic Self-Assembly of a AgI/Bi2Ga4O9 p-n Junction Photocatalyst for Boosting Superoxide Radical Generation. J. Mater. Chem. A 2020, 8, 4083. [Google Scholar] [CrossRef]
- Seeharaj, P.; Vittayakorn, N.; Morris, J.; Kim-Lohsoontorn, P. CeO2/CuO/TiO2 heterojunction photocatalysts for conversion of CO2 to ethanol. Nanotechnology 2021, 32, 375707. [Google Scholar] [CrossRef] [PubMed]
- Wang, X.; Liu, D.; Li, J.; Zhen, J.; Zhang, H. Clean synthesis of Cu2O@CeO2 core@shell nanocubes with highly active interface. NPG Asia Mater. 2015, 7, e158. [Google Scholar] [CrossRef]
- Zhu, J.; Zhang, G.; Xian, G.; Zhang, N.; Li, J. A High-Efficiency CuO/CeO2 Catalyst for Diclofenac Degradation in Fenton-Like System. Front. Chem. 2019, 7, 796. [Google Scholar] [CrossRef] [PubMed]
- Khan, M.A.; Nayan, N.; Shadiullah Ahmad, M.K.; Soon, C.F. Surface Study of CuO Nanopetals by Advanced Nanocharacterization Techniques with Enhanced Optical and Catalytic Properties. Nanomaterials 2020, 10, 1298. [Google Scholar] [CrossRef]


| S. No. | Catalyst | Band Gap (eV) | Degradation Efficiency (%) (2 h) | K (min−1) | R2 |
|---|---|---|---|---|---|
| Fast green (20 ppm) | |||||
| 1 | CuO | 3.04 | 66.6 | 0.018 | 0.98 |
| 2 | CeO2 | 3.26 | 76.3 | 0.011 | 0.99 |
| 3 | CuO-CeO2-Cu(OH)2 | 2.64 | 96.4 | 0.059 | 0.90 |
| Bromophenol blue (20 ppm) | |||||
| 1 | CuO | 3.04 | 58.2 | 0.016 | 0.99 |
| 2 | CeO2 | 3.26 | 67.1 | 0.020 | 0.98 |
| 3 | CuO-CeO2-Cu(OH)2 | 2.64 | 92.7 | 0.046 | 0.95 |
Disclaimer/Publisher’s Note: The statements, opinions and data contained in all publications are solely those of the individual author(s) and contributor(s) and not of MDPI and/or the editor(s). MDPI and/or the editor(s) disclaim responsibility for any injury to people or property resulting from any ideas, methods, instructions or products referred to in the content. |
© 2023 by the authors. Licensee MDPI, Basel, Switzerland. This article is an open access article distributed under the terms and conditions of the Creative Commons Attribution (CC BY) license (https://creativecommons.org/licenses/by/4.0/).
Share and Cite
Murugadoss, G.; Kannappan, T.; Rajabathar, J.R.; Manavalan, R.K.; Salammal, S.T.; Venkatesh, N. Rapid Photocatalytic Activity of Crystalline CeO2-CuO-Cu(OH)2 Ternary Nanocomposite. Sustainability 2023, 15, 15601. https://doi.org/10.3390/su152115601
Murugadoss G, Kannappan T, Rajabathar JR, Manavalan RK, Salammal ST, Venkatesh N. Rapid Photocatalytic Activity of Crystalline CeO2-CuO-Cu(OH)2 Ternary Nanocomposite. Sustainability. 2023; 15(21):15601. https://doi.org/10.3390/su152115601
Chicago/Turabian StyleMurugadoss, Govindhasamy, Thiruppathi Kannappan, Jothi Ramalingam Rajabathar, Rajesh Kumar Manavalan, Shyju Thankaraj Salammal, and Nachimuthu Venkatesh. 2023. "Rapid Photocatalytic Activity of Crystalline CeO2-CuO-Cu(OH)2 Ternary Nanocomposite" Sustainability 15, no. 21: 15601. https://doi.org/10.3390/su152115601
APA StyleMurugadoss, G., Kannappan, T., Rajabathar, J. R., Manavalan, R. K., Salammal, S. T., & Venkatesh, N. (2023). Rapid Photocatalytic Activity of Crystalline CeO2-CuO-Cu(OH)2 Ternary Nanocomposite. Sustainability, 15(21), 15601. https://doi.org/10.3390/su152115601