
How the River Chief System Achieved River Pollution Control: Analysis Based on AGIL Paradigm

Abstract
1. Introduction
2. Materials and Methods
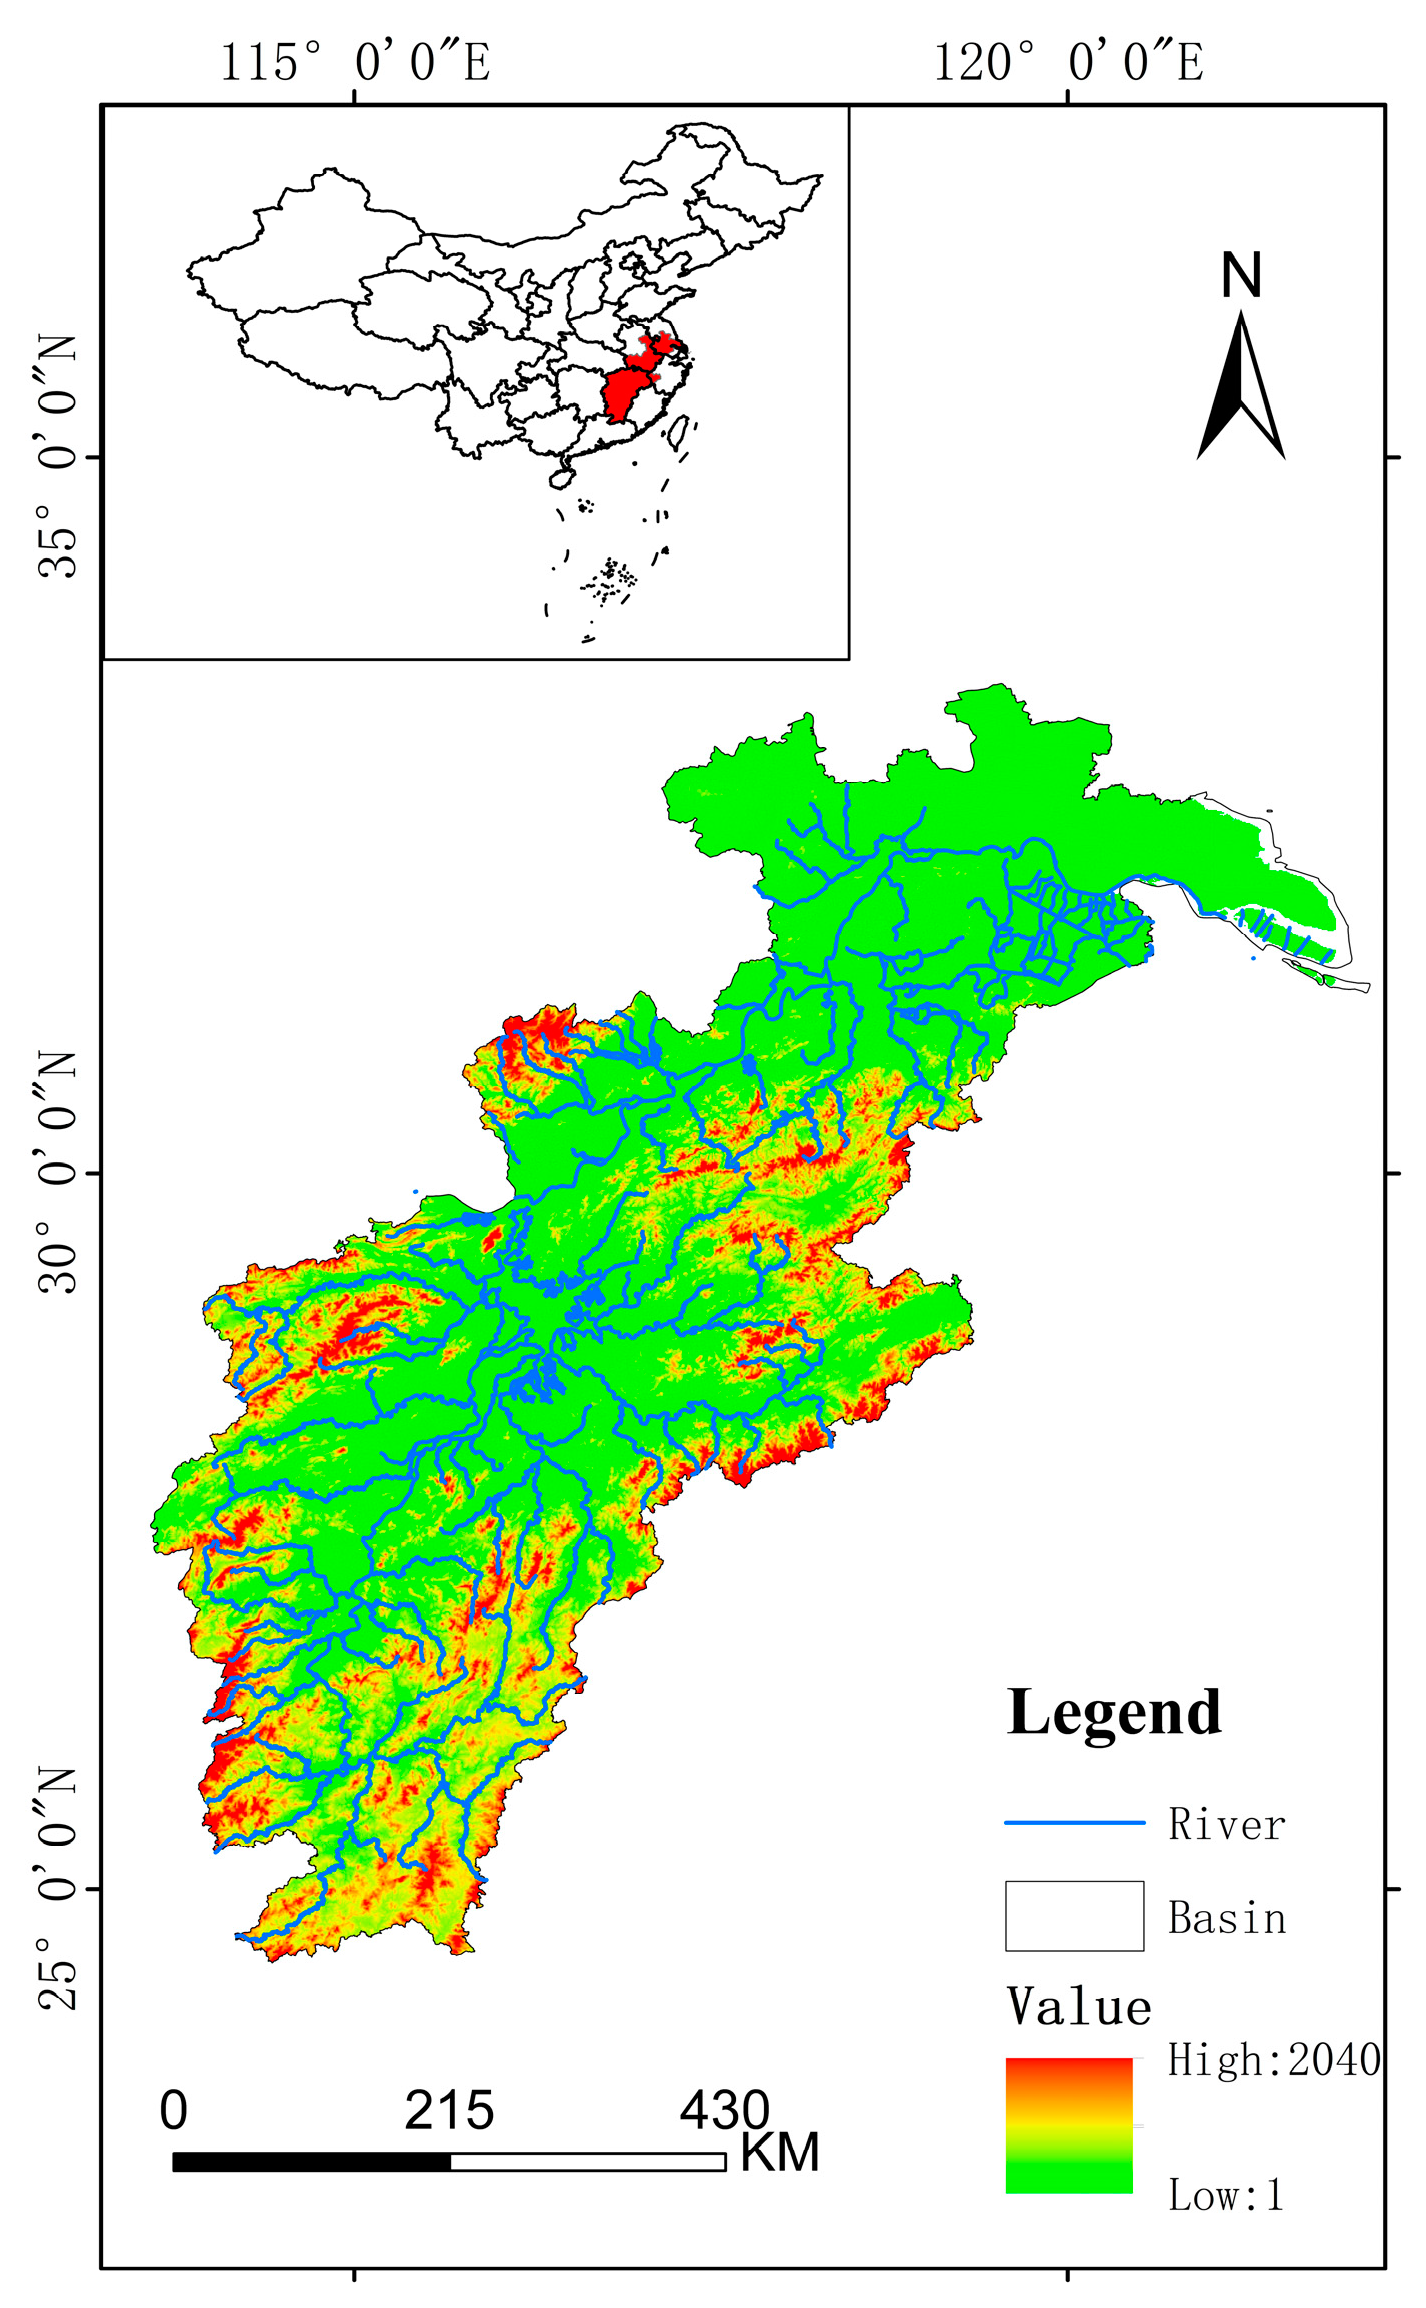
2.1. Research Area
2.2. Data
2.3. Methods
2.3.1. Theoretical Methods
2.3.2. Data-Processing Methods
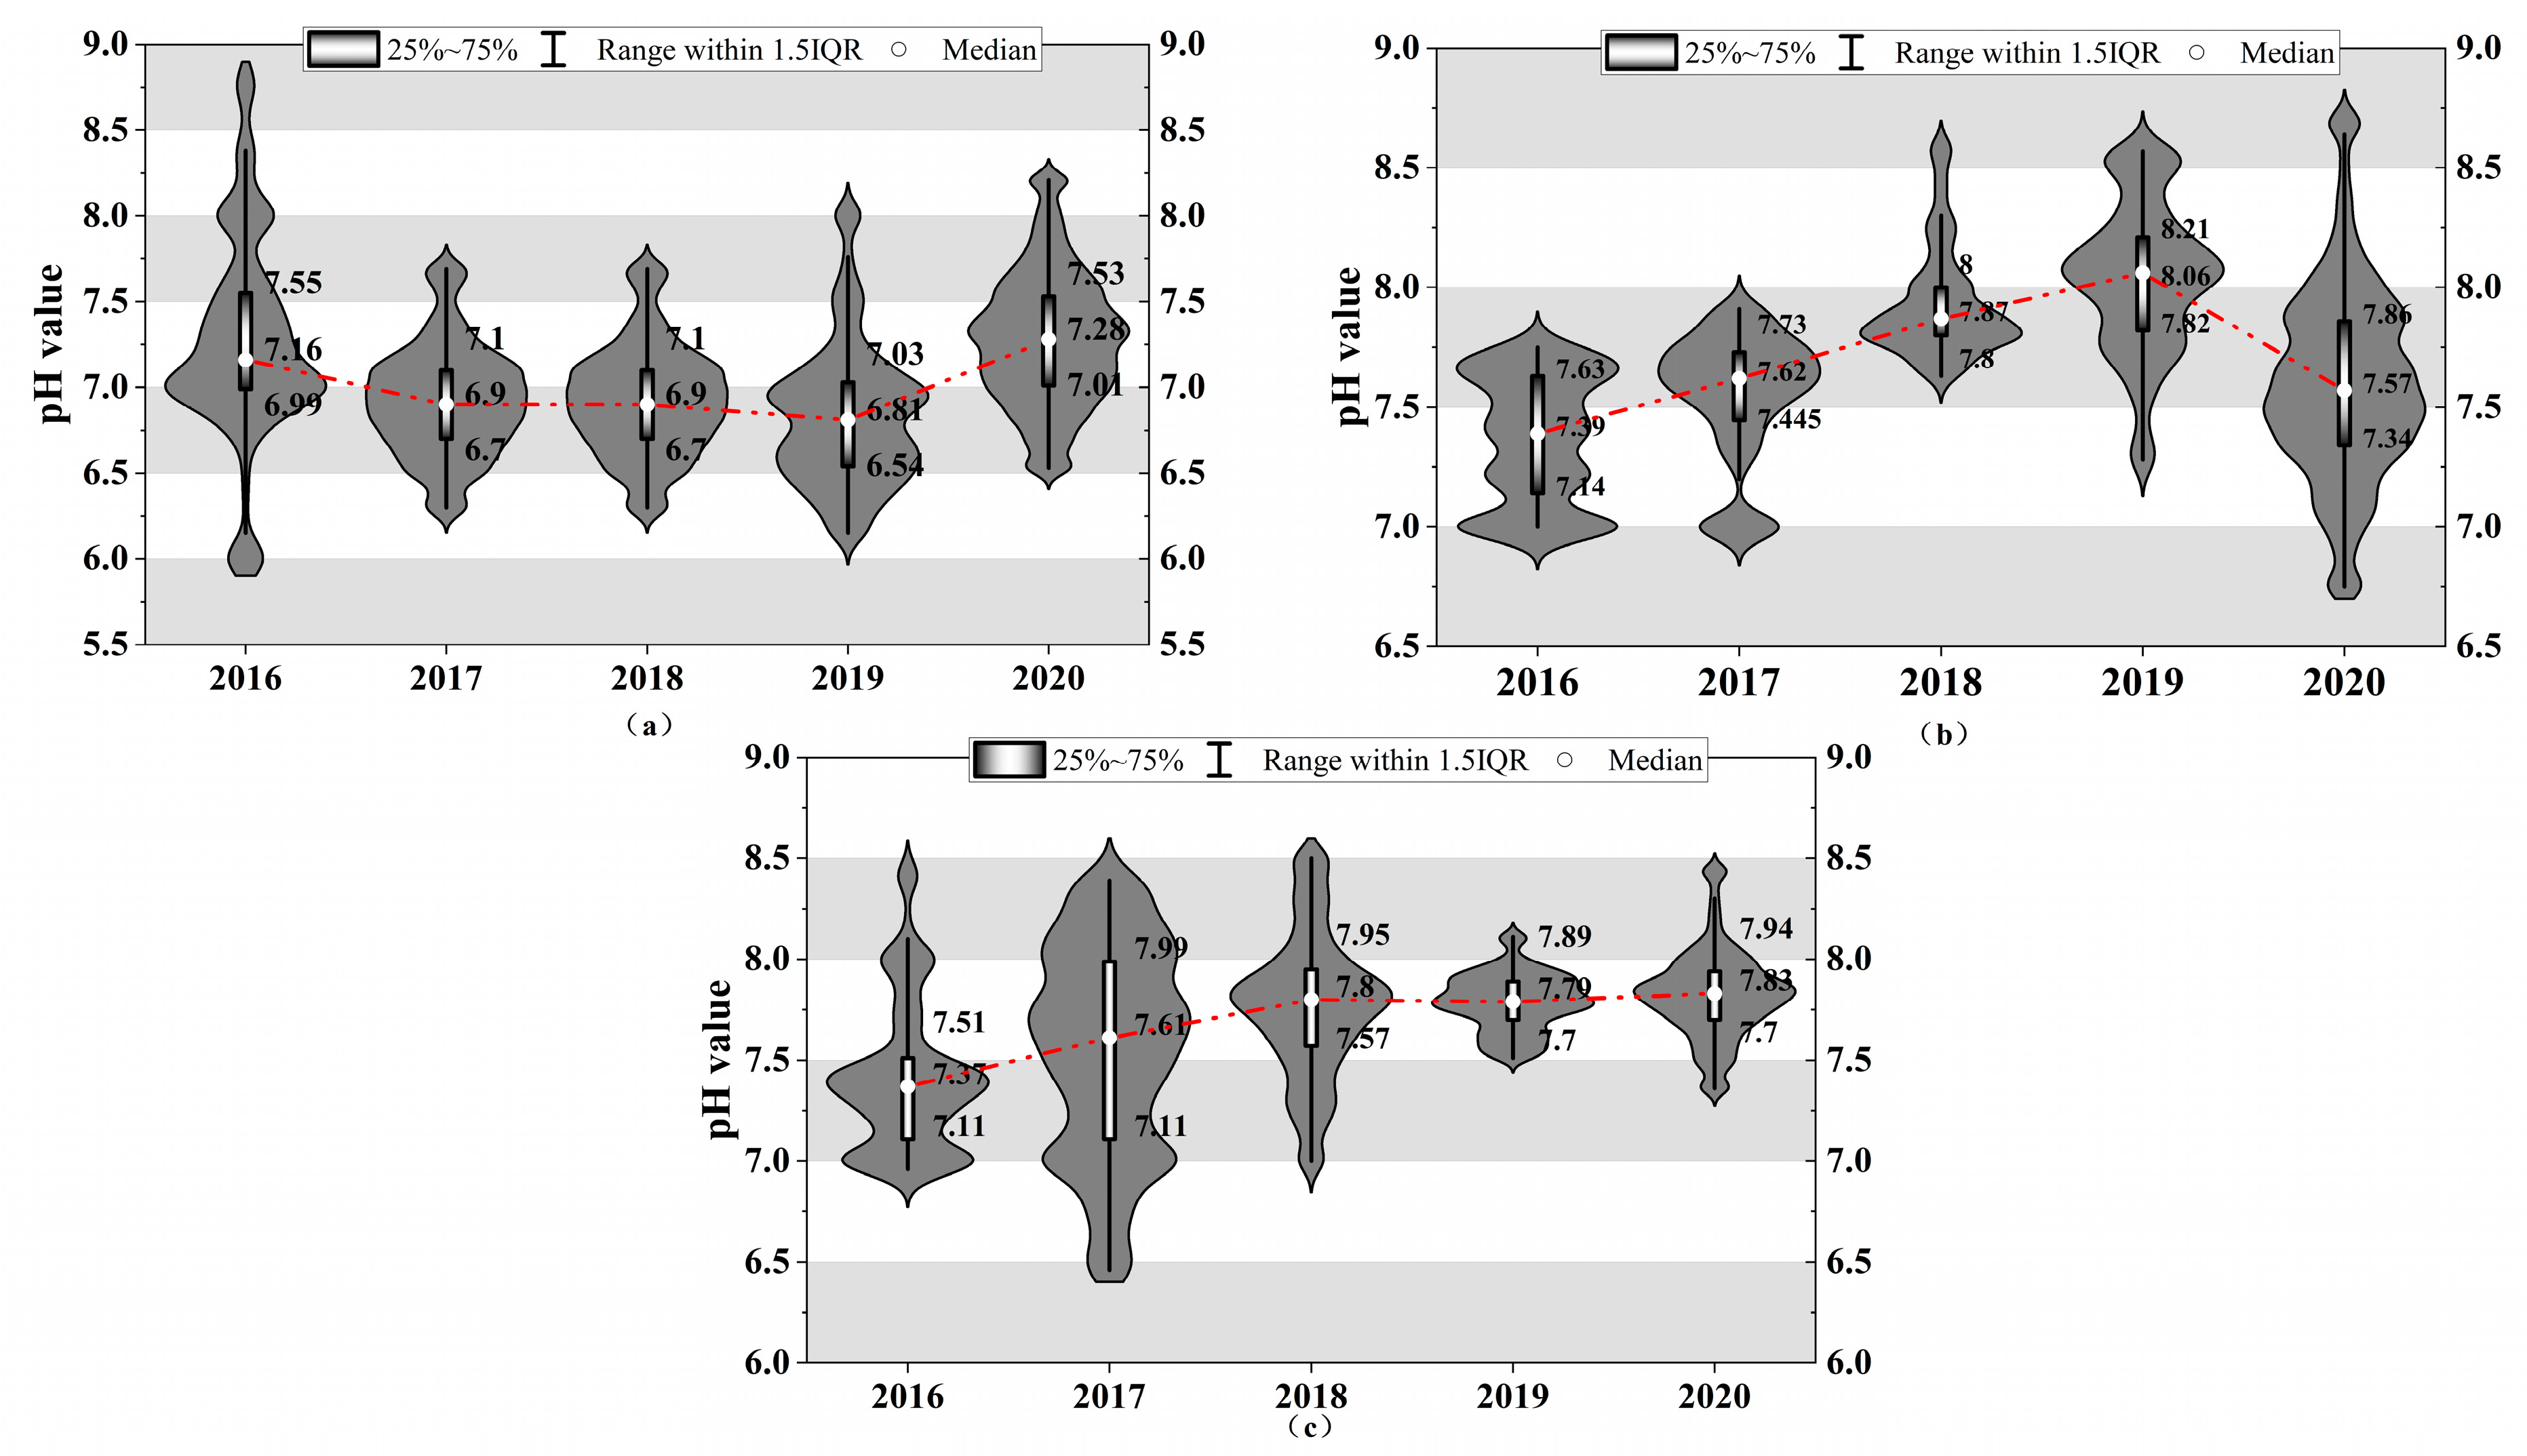
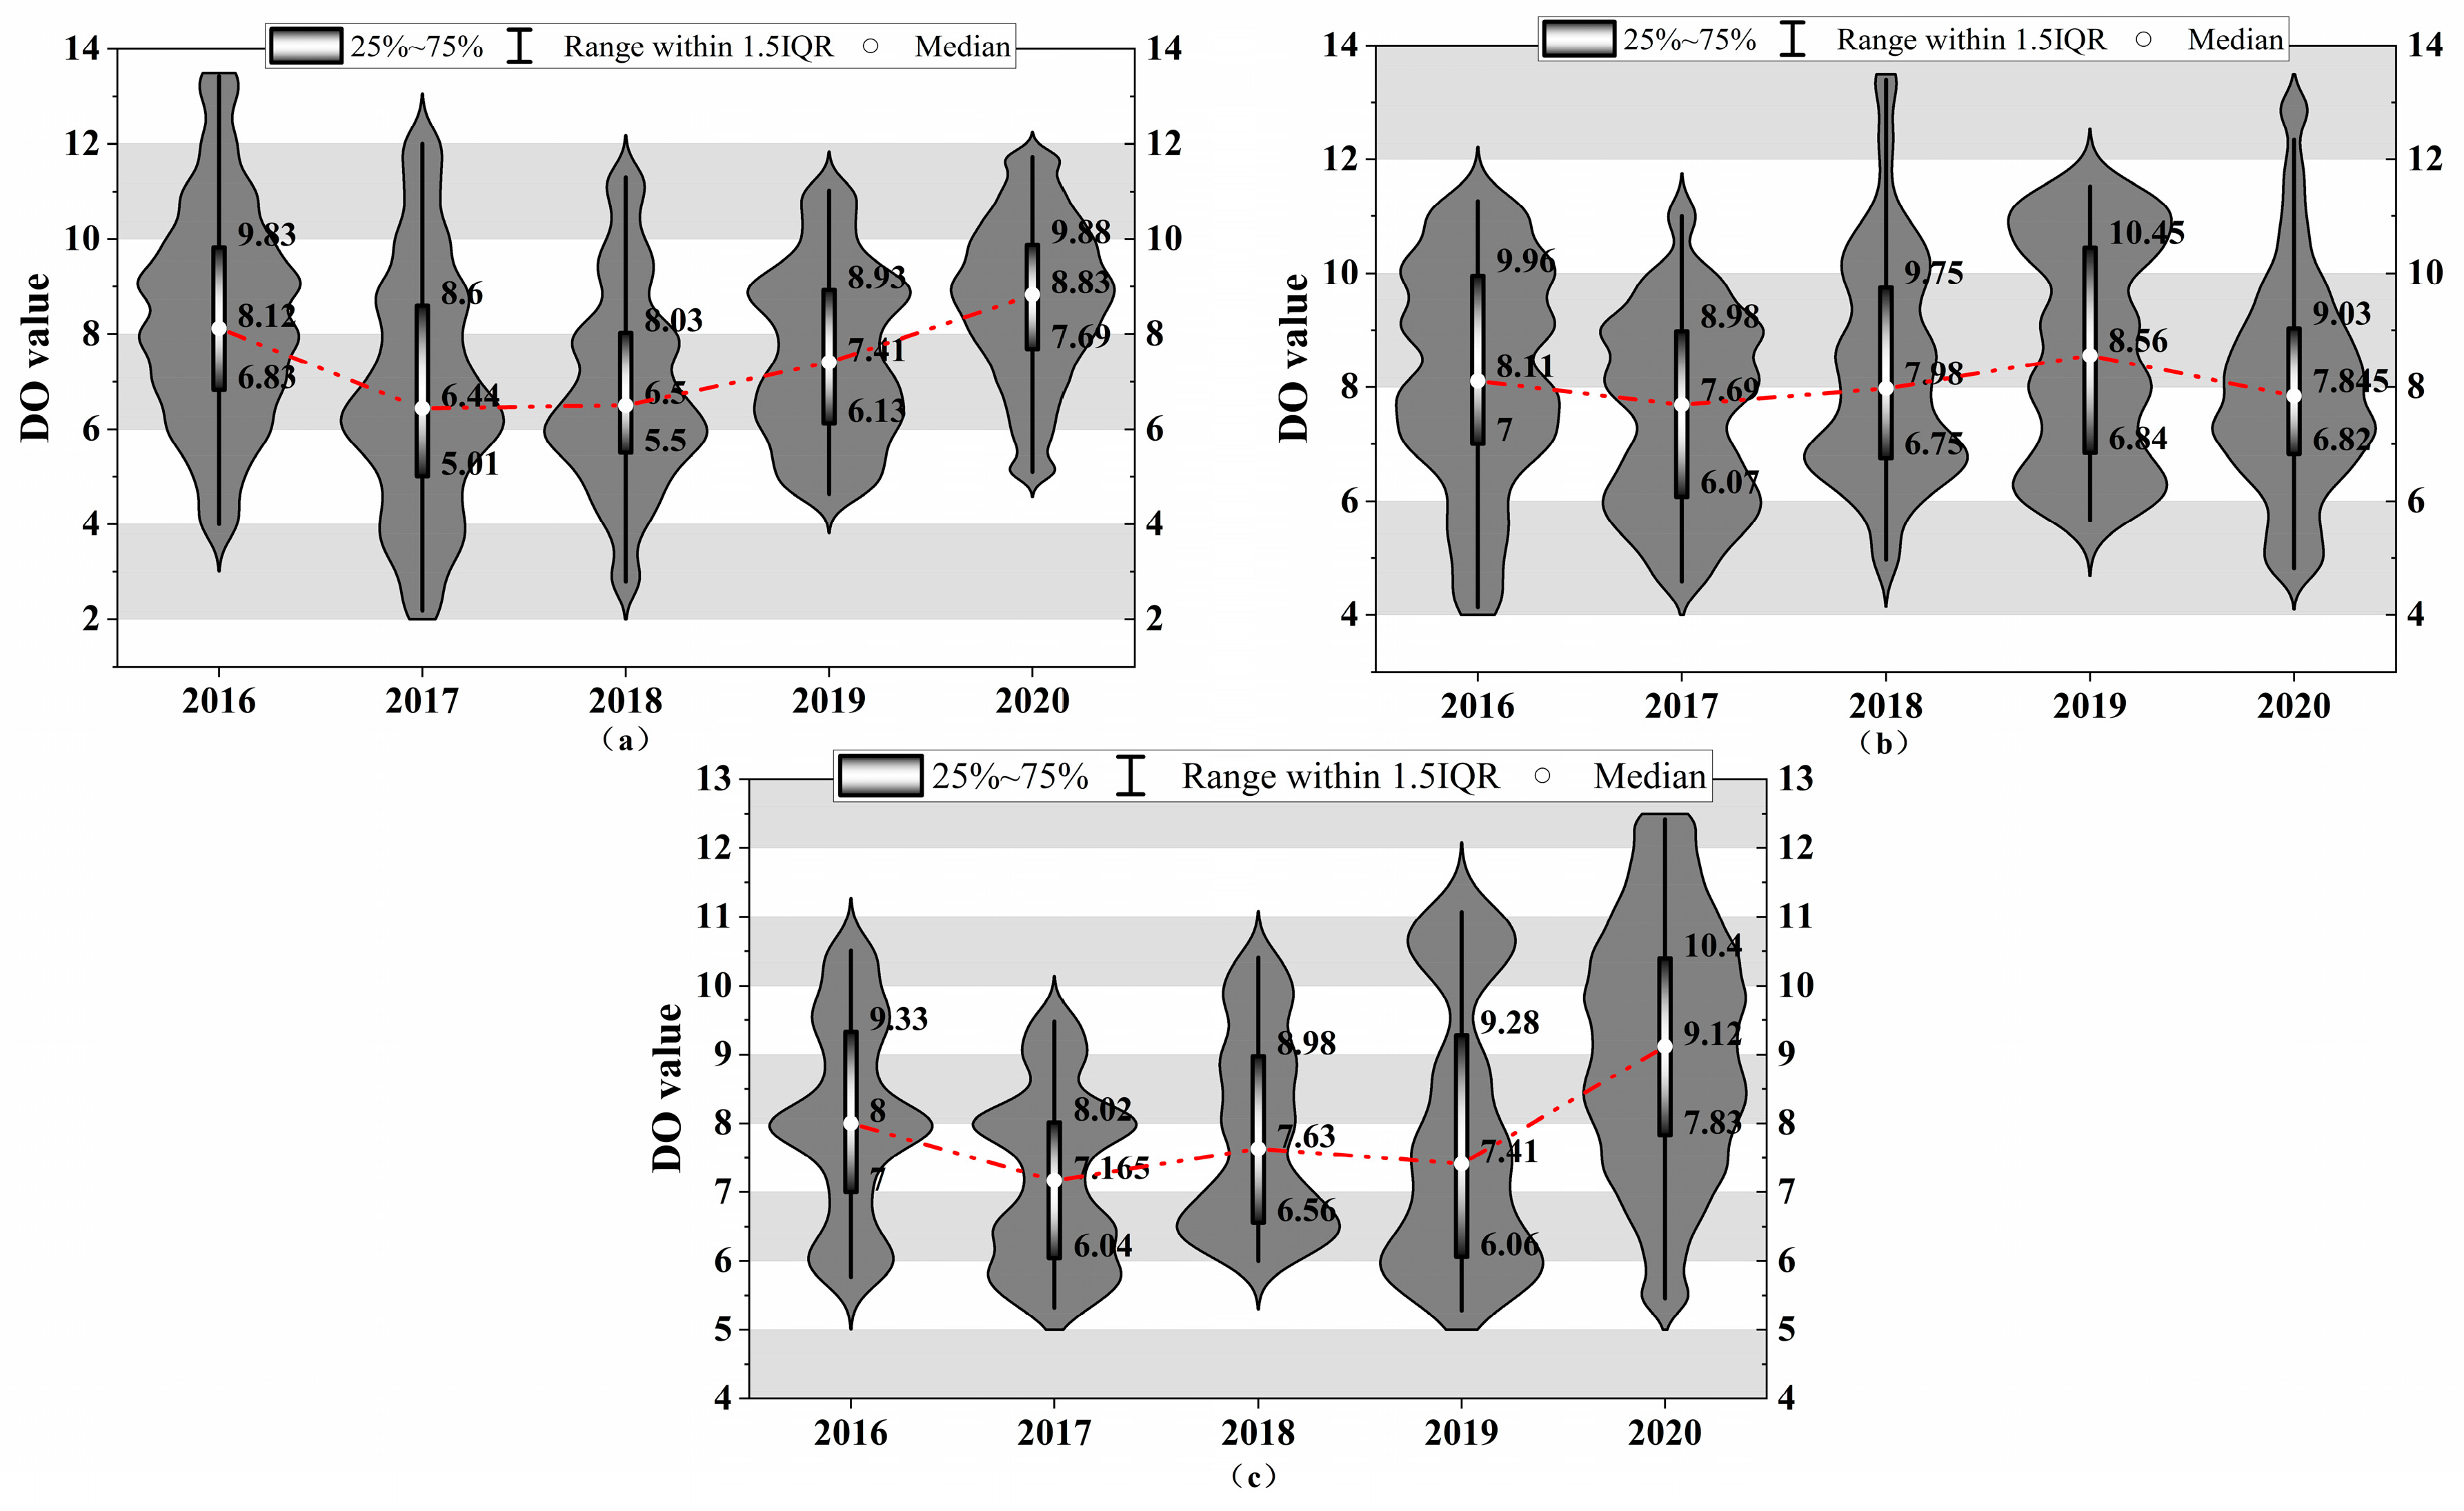
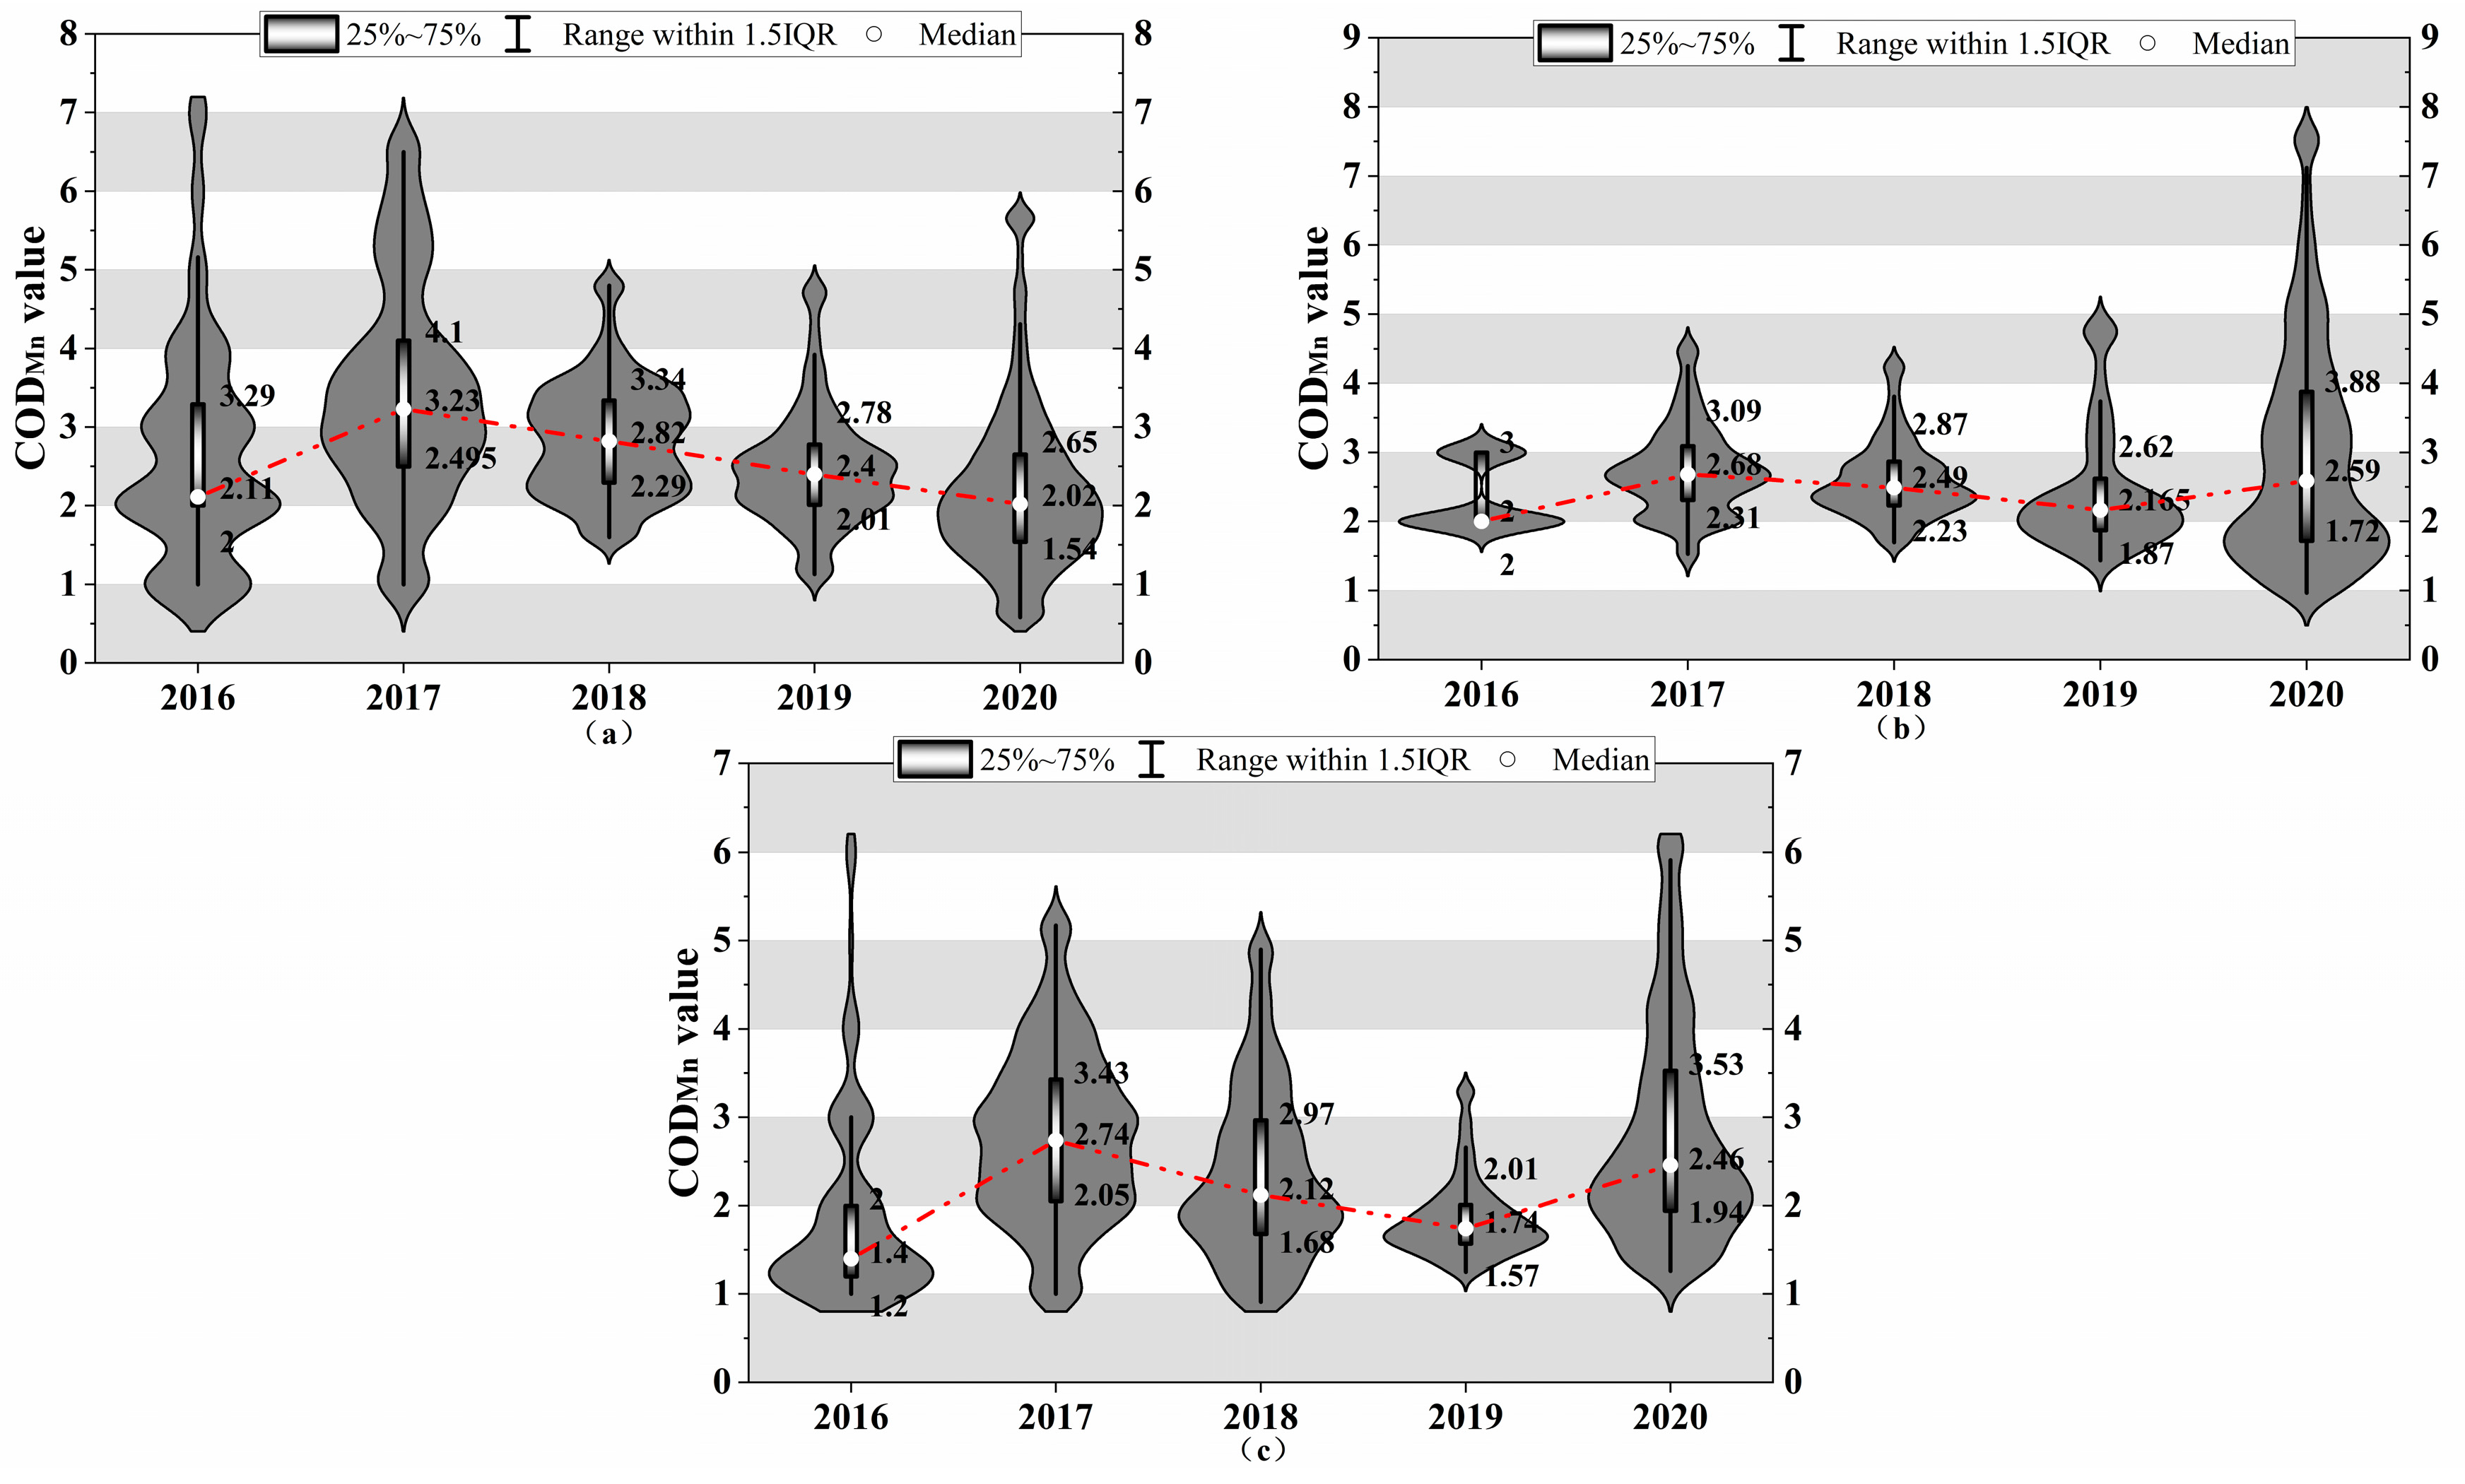
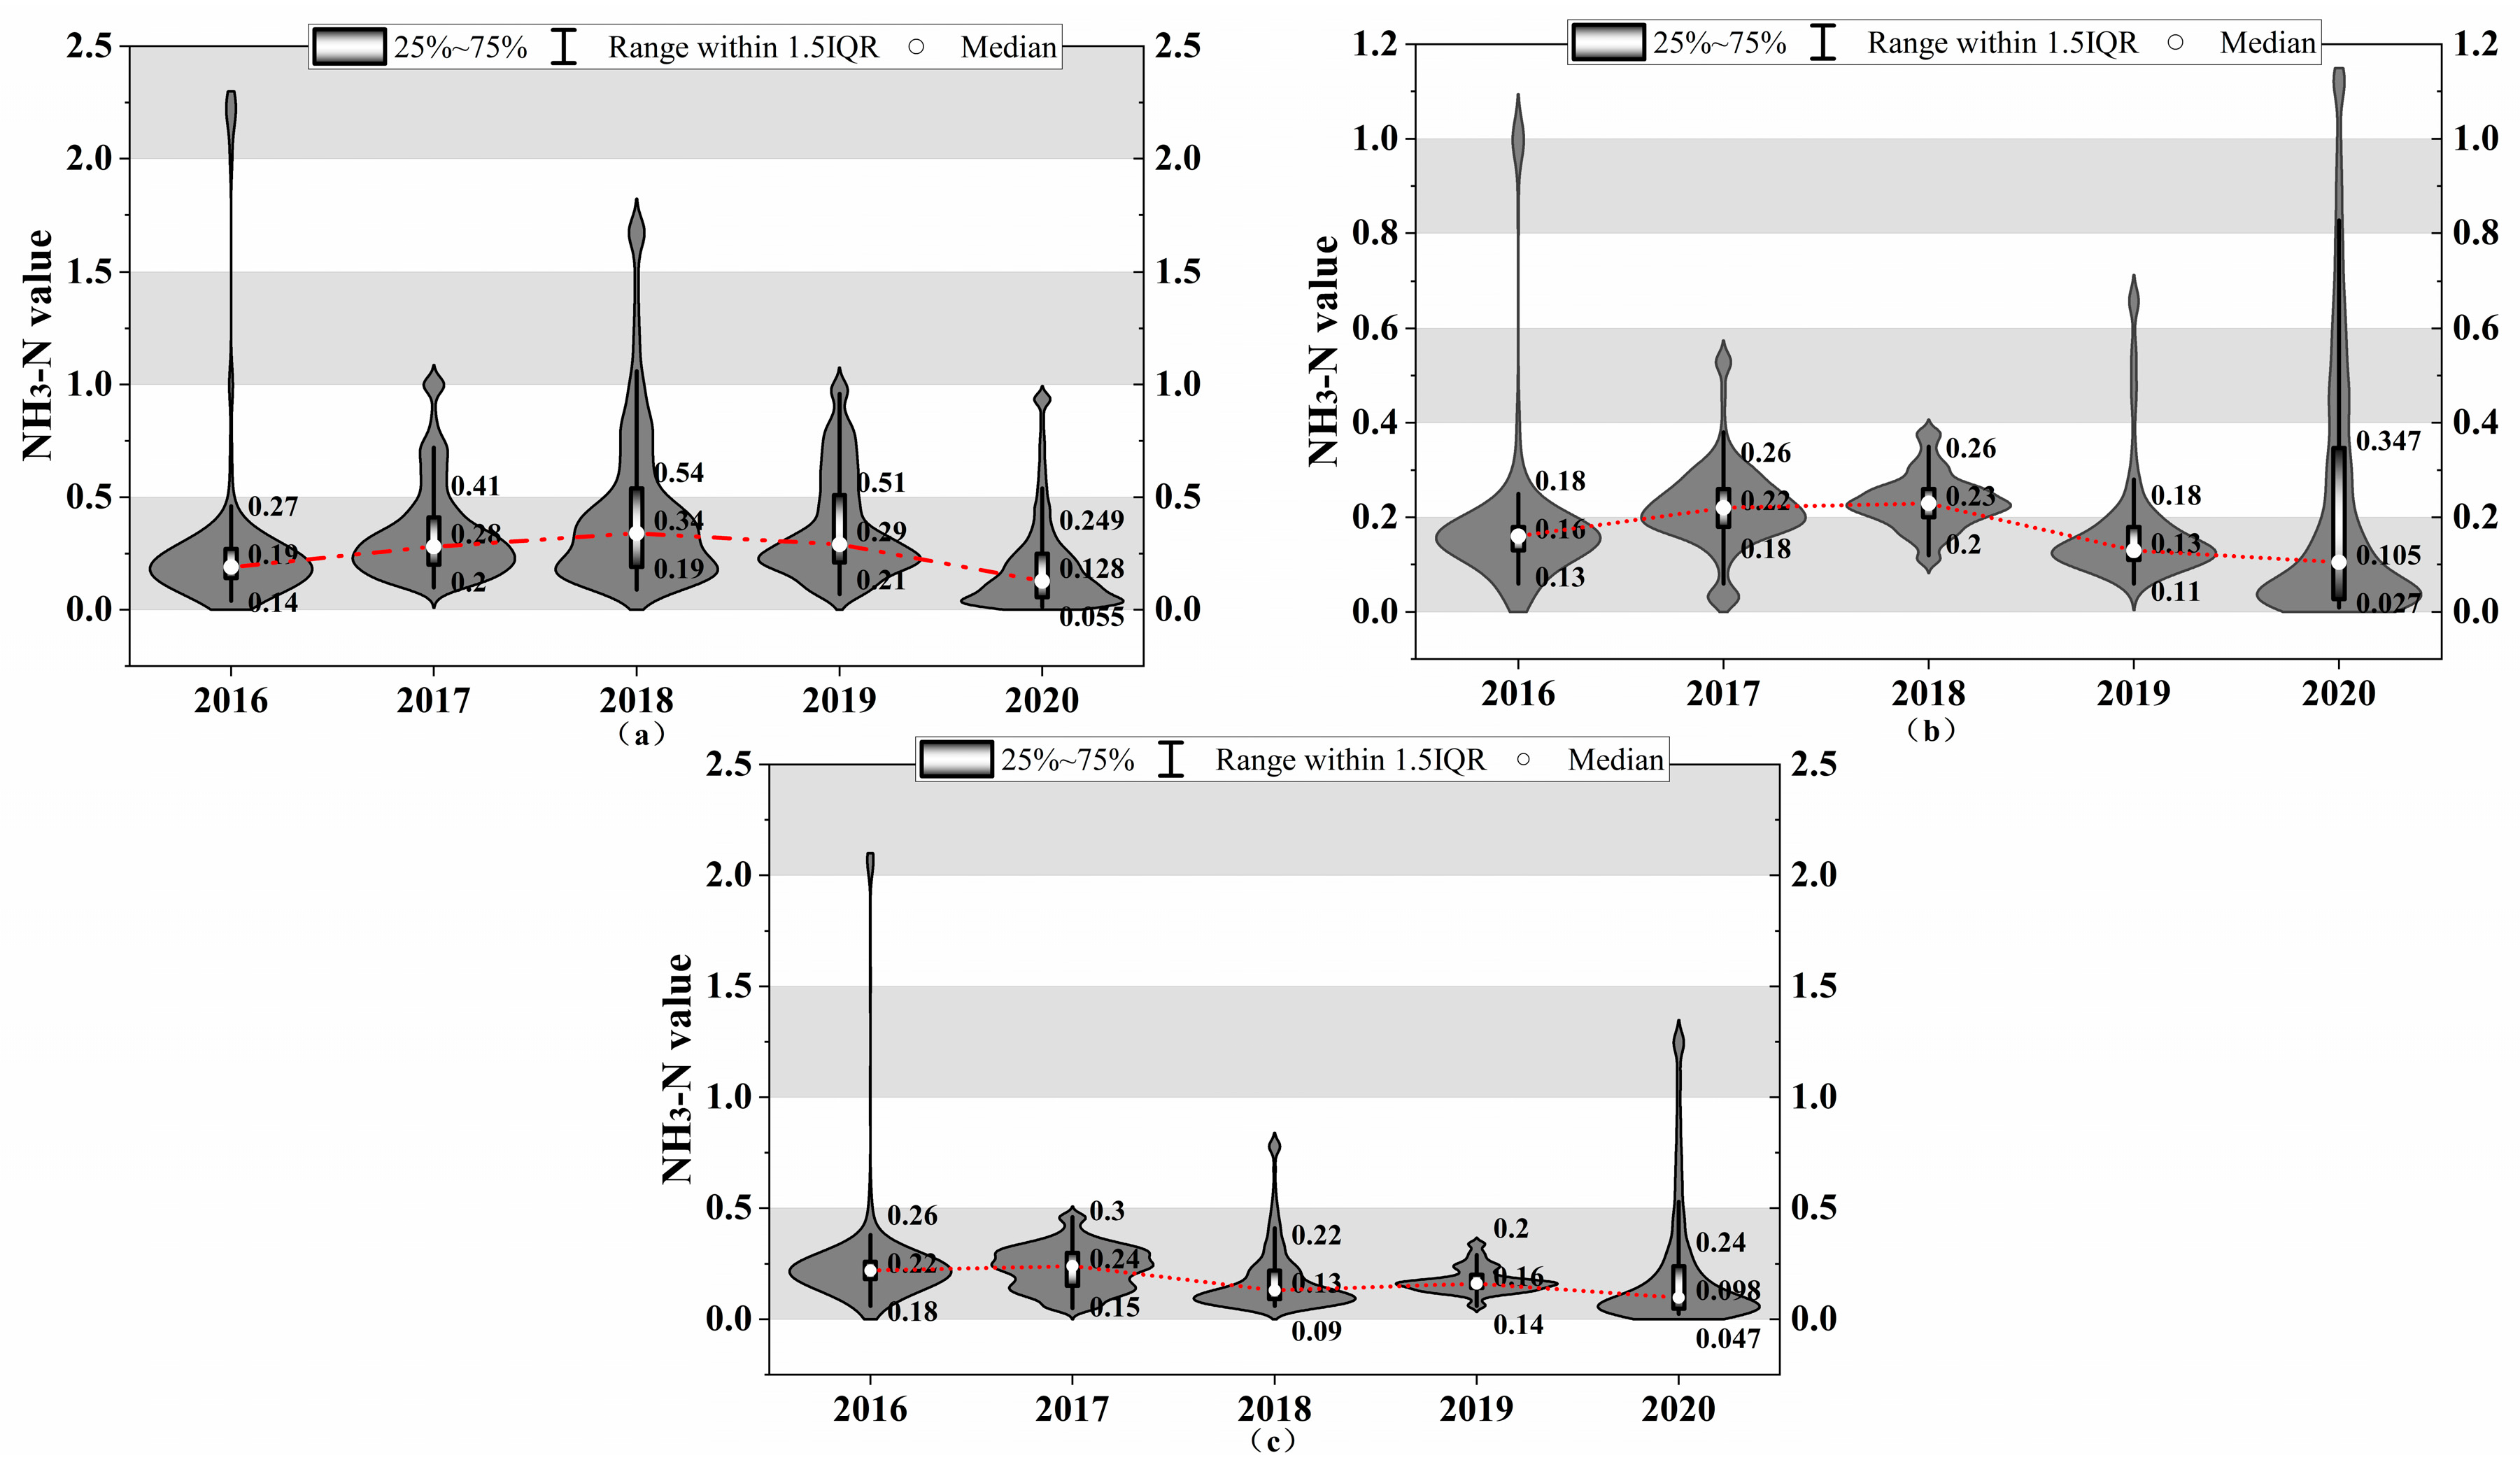
3. Results
4. Discussion
4.1. Operational Mechanism of RCS to Realize Collaborative Governance
4.1.1. From the Perspective of Adaptation Function of RCS
4.1.2. From the Perspective of Goal Attainment Function of RCS
4.1.3. From the Perspective of Integration Function of RCS
4.1.4. From the Perspective of Latency Pattern Maintenance Function of RCS
4.2. How to Further Consolidate the Coordinated Governance of RCS
5. Conclusions
Author Contributions
Funding
Institutional Review Board Statement
Informed Consent Statement
Data Availability Statement
Acknowledgments
Conflicts of Interest
References
- Huang, C.; Chen, T.; Yi, H.; Xu, X.; Chen, S.; Chen, W. Collaborative Environmental Governance, Inter-Agency Cooperation and Local Water Sustainability in China. Sustainability 2017, 9, 2305. [Google Scholar] [CrossRef]
- Su, J.; Ji, D.; Lin, M.; Chen, Y.; Sun, Y.; Huo, S.; Zhu, J.; Xi, B. Developing Surface Water Quality Standards in China. Resour. Conserv. Recycl. 2017, 117, 294–303. [Google Scholar] [CrossRef]
- Fidelis, T.; Roebeling, P. Water Resources and Land Use Planning Systems in Portugal—Exploring Better Synergies through Ria de Aveiro. Land Use Policy 2014, 39, 84–95. [Google Scholar] [CrossRef]
- Fan, X.; Li, X.; Yin, J.; Tian, L.; Liang, J. Similarity and Heterogeneity of Price Dynamics across China’s Regional Carbon Markets: A Visibility Graph Network Approach. Appl. Energy 2019, 235, 739–746. [Google Scholar] [CrossRef]
- Tian, L.; Ye, Q.; Zhen, Z. A New Assessment Model of Social Cost of Carbon and Its Situation Analysis in China. J. Clean. Prod. 2019, 211, 1434–1443. [Google Scholar] [CrossRef]
- Han, D.; Currell, M.J.; Cao, G. Deep Challenges for China’s War on Water Pollution. Environ. Pollut. 2016, 218, 1222–1233. [Google Scholar] [CrossRef] [PubMed]
- Cai, H.; Chen, Y.; Gong, Q. Polluting Thy Neighbor: Unintended Consequences of China’s Pollution Reduction Mandates. J. Environ. Econ. Manag. 2016, 76, 86–104. [Google Scholar] [CrossRef]
- Liu, H.; Chen, Y.D.; Liu, T.; Lin, L. The River Chief System and River Pollution Control in China: A Case Study of Foshan. Water 2019, 11, 1606. [Google Scholar] [CrossRef]
- Wang, P. China’s Air Pollution Policies: Progress and Challenges. Curr. Opin. Environ. Sci. Health 2021, 19, 100227. [Google Scholar] [CrossRef]
- van Rooij, B. Implementation of Chinese Environmental Law: Regular Enforcement and Political Campaigns. Dev. Chang. 2006, 37, 57–74. [Google Scholar] [CrossRef]
- Ran, R. Understanding Blame Politics in China’s Decentralized System of Environmental Governance: Actors, Strategies and Context. China Q. 2017, 231, 634–661. [Google Scholar] [CrossRef]
- Chu, T.Y. Systematic Roots and Corrections of Local Government’s Governance Failure in Ecological Environment. Soc. Sci. 2020, 480, 64–75. [Google Scholar] [CrossRef]
- Wang, M. Environmental Governance as a New Runway of Promotion Tournaments: Campaign-Style Governance and Policy Implementation in China’s Environmental Laws. Environ. Sci. Pollut. Res. 2021, 28, 34924–34936. [Google Scholar] [CrossRef] [PubMed]
- Macatangay, R.E.; Rieu-Clarke, A. The Role of Valuation and Bargaining in Optimising Transboundary Watercourse Treaty Regimes. Int. Environ. Agreem. 2018, 18, 409–428. [Google Scholar] [CrossRef]
- Ran, R. Unpacking the Decentralization Paradox of Environmental Governance: From the Perspective of Politics of Blame Avoidance. Econ. Soc. Syst. Comp. 2019, 68–76. [Google Scholar]
- Wang, Y.; Chen, X. River Chief System as a Collaborative Water Governance Approach in China. Int. J. Water Resour. Dev. 2020, 36, 610–630. [Google Scholar] [CrossRef]
- Wang, B.; Wang, H.; Zeng, X.; Li, B. Towards a Better Understanding of Social-Ecological Systems for Basin Governance: A Case Study from the Weihe River Basin, China. Sustainability 2022, 14, 4922. [Google Scholar] [CrossRef]
- Song, X.; Ravesteijn, W.; Frostell, B.; Wennersten, R. Managing Water Resources for Sustainable Development: The Case of Integrated River Basin Management in China. Water Sci. Technol. 2010, 61, 499–506. [Google Scholar] [CrossRef]
- Li, J.; Shi, X.; Wu, H.; Liu, L. Trade-off between Economic Development and Environmental Governance in China: An Analysis Based on the Effect of River Chief System. China Econ. Rev. 2020, 204, 101403. [Google Scholar] [CrossRef]
- Ouyang, J.; Zhang, K.; Wen, B.; Lu, Y. Top-Down and Bottom-Up Approaches to Environmental Governance in China: Evidence from the River Chief System (RCS). Int. J. Environ. Res. Public Health 2020, 17, 7058. [Google Scholar] [CrossRef] [PubMed]
- Zheng, S.; Kahn, M.E.; Sun, W.; Luo, D. Incentives for China’s Urban Mayors to Mitigate Pollution Externalities: The Role of the Central Government and Public Environmentalism. Reg. Sci. Urban Econ. 2014, 47, 61–71. [Google Scholar] [CrossRef]
- Zhou, R.; Li, Y.; Wu, J.; Gao, M.; Wu, X.; Bi, X. Need to Link River Management with Estuarine Wetland Conservation: A Case Study in the Yellow River Delta, China. Ocean. Coast. Manag. 2017, 146, 43–49. [Google Scholar] [CrossRef]
- Gao, X.; Teets, J. Civil Society Organizations in China: Navigating the Local Government for More Inclusive Environmental Governance. China Inf. 2021, 35, 46–66. [Google Scholar] [CrossRef]
- Zhang, Z.; Xiong, C.; Yang, Y.; Liang, C.; Jiang, S. What Makes the River Chief System in China Viable? Examples from the Huaihe River Basin. Sustainability 2022, 14, 6329. [Google Scholar] [CrossRef]
- Duan, X.; Dai, S.; Yang, R.; Duan, Z.; Tang, Y. Environmental Collaborative Governance Degree of Government, Corporation, and Public. Sustainability 2020, 12, 1138. [Google Scholar] [CrossRef]
- Wang, J.; Song, Y. Effect of Water Pollution Control on Provincial Boundaries of River-Director System: Based on the Study of the Yangtze River Valley in China. Environ. Sci. Pollut. Res. 2020, 27, 35217–35227. [Google Scholar] [CrossRef] [PubMed]
- Ren, M. The River-chief mechanism: A Case Study of China’s Inter-departmental Coordination for Watershed Treatment. J. Beijing Adm. Inst. 2015, 97, 25–31. [Google Scholar] [CrossRef]
- Fu, J.B. Research on multi-subject collaborative governance of the ecological environment in the Yellow River Basin. J. Irrig. Drain. 2020, 39, 130–137. [Google Scholar] [CrossRef]
- Dijkstra, B.R.; Fredriksson, P.G. Regulatory Environmental Federalism. Annu. Rev. Resour. Econ. 2010, 2, 319–339. [Google Scholar] [CrossRef]
- Liu, F.; Xu, H.H.; Miao, W. Social Water Environment Governance Innovation in China Driven by Big Data: Frontier Trends, Dilemma Challenges and Optimization Paths. IOP Conf. Ser. Earth Environ. Sci. 2020, 612, 012054. [Google Scholar] [CrossRef]
- Wang, B.; Wan, J.; Zhu, Y. River Chief System: An Institutional Analysis to Address Watershed Governance in China. Water Policy 2021, 23, 1435–1444. [Google Scholar] [CrossRef]
- Zhu, M. On the Development Practice and Promotion of the River Chief System. Environ. Prot. 2017, 45, 58–61. [Google Scholar] [CrossRef]
- Xiong, Y. Cross-domain Environmental Governance: An Analytical Framework of “Vertical-Horizontal” Mechanism—Taking “River Chief System” as an Analysis Sample. Beijing Soc. Sci. 2017, 169, 108–116. [Google Scholar] [CrossRef]
- Hao, Y.; Wan, T. Consensus Mobilization: A Framework Analysis of the River Chief System to Activate Public Responsibility. J. Guangxi Univ. (Philos. Soc. Sci.) 2019, 41, 133–140. [Google Scholar] [CrossRef]
- Yu, H.; Yang, L.; Zheng, X. Can River Chief System Realize the Coordinated Governance from “Beggar Thy Neighbor” to “Help Each Other”: Examination from Quasi-Natural Experiment in the Seven Major River Basins. Soft Sci. 2022, 36, 40–47. [Google Scholar]
- Wang, L.; Sun, Z.Y. An Empirical Study on the Double Dividend Effect of Environment and Economy of the River Chief Policy—A Quasi-Natural Experiment Based on the Implementation of the River Length System Policy in the Yangtze River Economic Belt. Soft Sci. 2020, 34, 40–45. [Google Scholar]
- Zhang, Y.; Wang, J.; Zhu, K.; Min, F. River Research Department, Changjiang River Scientific Research Institute. Study on performance evaluation of the river chief system based on TOPSIS: Case of Jiangsu province. Yangtze River 2020, 51, 237–242. [Google Scholar] [CrossRef]
- Zhou, J.; Xiong, Y. “The River Chief System”: How Is Continuous Innovation Possible?—A Two-Dimension Analysis on the Basis of Both Policy Text and Reform Practice. Jiangsu Soc. Sci. 2017, 4, 38–47. [Google Scholar]
- Li, B.; Yu, S. Bottom-Line Pressure Type System: The Operation Logic of Local Water Environmental Governance by River Chief. Ningxia Soc. Sci. 2018, 2, 41–47. [Google Scholar]
- Cao, X.; Zhou, J. How the River Chief System Was Established: Its Function, Deep Structure and Mechanism Condition. China Popul. Resour. Environ. 2020, 30, 179–184. [Google Scholar]
- Xu, G.; Lu, Y. On the Governance Experience and Future of ‘Five-Water Co-Governance’: From the Perspective of Collaborative Governance Theory. Adm. Reform 2019, 2, 33–40. [Google Scholar]
- Wu, Z.; Tang, X. Status and Measures of Joint Protection and Management for Inter-provincal Rivers under the River Chief System: A Case Study on Chishui River. J. Chang. River Sci. Res. Inst. 2020, 37, 1–7. [Google Scholar]
- Li, F.; Gu, R.Z. Research on the River Chief System in the Yangtze River Basin from the Perspective of Holistic Governance. J. Econ. Water Resour. 2021, 39, 41–45+79. [Google Scholar]
- Tang, X.Q.; Zhao, W.H.; Tang, W.J.; Yu, Z.Q.; Li, H. Study on the synergetic promotion model of river basin management and river chief system. China Water Resour. 2018, 844, 4–6. [Google Scholar]
- Liu, B. Crisis and Construction: An Analysis of National Emergency Management System Based on AGIL Model. AJHSS 2021, 4, 70–75. [Google Scholar] [CrossRef]
- Qin, Q.; Tan, S. Research on Mutual-Supporting Pension in Rural China with the AGIL Model. In Proceedings of the First International Symposium on Management and Social Sciences (ISMSS 2019), Wuhan, China, 13–14 April 2019; Atlantis Press: Wuhan, China, 2019. [Google Scholar]
- Liu, R.Z. An analysis of Structural functionalism and its social theory. Tianjin Soc. Sci. 2005, 5, 52–56. [Google Scholar] [CrossRef]
- Ingrassia, M.; Bellia, C.; Giurdanella, C.; Columba, P.; Chironi, S. Digital Influencers, Food and Tourism—A New Model of Open Innovation for Businesses in the Ho.Re.Ca. Sector. J. Open Innov. Technol. Mark. Complex. 2022, 8, 50. [Google Scholar] [CrossRef]
- Parsons, T.; Shils, E.A.; Naegele, K.D.; Pitts, J.R. (Eds.) An Outline of the Social System. In Classical Sociological Theory, 2nd ed.; Simoon & Shuster, The Free Press: New York, NY, USA, 1961; Available online: http://www.csun.edu/~snk1966/Talcott%20Parsons%20-%20An%20Outline%20of%20the%20Social%20System.pdf (accessed on 1 March 2023).
- Parsons, T. On the Concept of Value-Commitments. Sociol. Inq. 1968, 38, 135–160. [Google Scholar] [CrossRef]
- Parsons, T. The Social System; Routledge & Kegan Paul Ltd.: London, UK, 1970; pp. 26–50. ISBN 978-1-134-92774-6. [Google Scholar]
- Kwak, S.K.; Kim, J.H. Statistical Data Preparation: Management of Missing Values and Outliers. Korean J. Anesthesiol. 2017, 70, 407. [Google Scholar] [CrossRef]
- Chen, Q.; Lin, S.; Zhang, X. The Effect of China’s Incentive Policies for Technological Innovation: Incentivizing Quantity or Quality. China Ind. Econ. 2020, 385, 79–96. [Google Scholar] [CrossRef]
- Correll, M.; Gleicher, M. Error Bars Considered Harmful: Exploring Alternate Encodings for Mean and Error. IEEE Trans. Visual. Comput. Graphics 2014, 20, 2142–2151. [Google Scholar] [CrossRef]
- Sidiropoulos, N.; Sohi, S.H.; Pedersen, T.L.; Porse, B.T.; Winther, O.; Rapin, N.; Bagger, F.O. SinaPlot: An Enhanced Chart for Simple and Truthful Representation of Single Observations Over Multiple Classes. J. Comput. Graph. Stat. 2018, 27, 673–676. [Google Scholar] [CrossRef]
- Ministry of Ecology and Environment Protection of the People’s Republic of China. Environmental Quality Standards for Surface Water. Available online: https://www.mee.gov.cn/ywgz/fgbz/bz/bzwb/shjbh/shjzlbz/200206/t20020601_66497.shtml (accessed on 9 February 2024).
- Greenstone, M.; Hanna, R. Environmental Regulations, Air and Water Pollution, and Infant Mortality in India. Am. Econ. Rev. 2014, 104, 3038–3072. [Google Scholar] [CrossRef]
- Lipscomb, M.; Mobarak, A.M. Decentralization and Pollution Spillovers: Evidence from the Re-Drawing of County Borders in Brazil. Rev. Econ. Stud. 2017, 84, 464–502. [Google Scholar] [CrossRef]
- Wang, X.P. The leadership of the Communist Party of China is the biggest national condition and the most essential characteristic of China. Red Flag Manuscr. 2016, 335, 1+12–14. [Google Scholar]
- Ren, H. Analyses of the Idea of the “Co-responsibility of the Communist Party and Government” in the Construction of the Environmental Accountability in China. J. Beijing Univ. Technol. (Soc. Sci. Ed.) 2018, 18, 49–55. [Google Scholar]
- Wu, C.; Ju, M.; Wang, L.; Gu, X.; Jiang, C. Public Participation of the River Chief System in China: Current Trends, Problems, and Perspectives. Water 2020, 12, 3496. [Google Scholar] [CrossRef]
- The Central People’s Government of the People’s Republic of China. Circular on the List of Places and Incentive Measures for the Implementation of Major Policies and Measures in 2021 with Obvious Effects. Available online: https://www.gov.cn/zhengce/zhengceku/2022-06/09/content_5694834.htm?eqid=d56d48a000006b8200000006645df33a&eqid=f739f797000832d20000000264897999 (accessed on 9 February 2024).
- Han, Z.; Li, C. How to construct the responsibility—Take the River Chief system and its implementation in S City as an example. Theor. Investig. 2021, 218, 137–145. [Google Scholar] [CrossRef]
- Kou, P.; Han, Y.; Qi, X. The Operational Mechanism and Effectiveness of China’s Central Environmental Protection Inspection: Evidence from Air Pollution. Socio-Econ. Plan. Sci. 2022, 81, 101215. [Google Scholar] [CrossRef]
- Jin, Y.; Andersson, H.; Zhang, S. Air Pollution Control Policies in China: A Retrospective and Prospects. IJERPH 2016, 13, 1219. [Google Scholar] [CrossRef]
- Khan, M.I.; Chang, Y.-C. Environmental Challenges and Current Practices in China—A Thorough Analysis. Sustainability 2018, 10, 2547. [Google Scholar] [CrossRef]
- Kostka, G. Barriers to the Implementation of Environmental Policies at the Local Level in China. In Policy Research Working Papers; The World Bank: Washington, DC, USA, 2014. [Google Scholar]
- Zhan, X.; Lo, C.W.-H.; Tang, S.-Y. Contextual Changes and Environmental Policy Implementation: A Longitudinal Study of Street-Level Bureaucrats in Guangzhou, China. J. Public Adm. Res. Theory 2014, 24, 1005–1035. [Google Scholar] [CrossRef]
- Xiong, C. Study on the Application of Incentive Mechanism in the Fulfillment of the Duty of Environmental Protection Department in China. Trib. Political Sci. Law 2018, 36, 79–92. [Google Scholar]
- Ding, X.-H.; He, Y.; Wu, J.; Cheng, C. Effects of Positive Incentive and Negative Incentive in Knowledge Transfer: Carrot and Stick. CMS 2016, 10, 593–614. [Google Scholar] [CrossRef]
- Wang, Z.; Zhang, Q.; Zhou, L.-A. Career Incentives of City Leaders and Urban Spatial Expansion in China. Rev. Econ. Stat. 2020, 102, 897–911. [Google Scholar] [CrossRef]
- Ran, R. Political Incentives and Local Environmental Governance under a “Pressurized System”. Econ. Soc. Syst. Comp. 2013, 3, 111–118. [Google Scholar]
- Zhong, T. Governmental Responsibility: Political Responsibility and Administrative Responsibility. J. Jishou Univ. (Soc. Sci. Ed.) 2015, 36, 42–47. [Google Scholar] [CrossRef]
- Zhang, Y.; Wang, S. How Does Policy Innovation Diffuse among Chinese Local Governments? A Qualitative Comparative Analysis of River Chief Innovation. Public Admin. Dev. 2021, 41, 34–47. [Google Scholar] [CrossRef]
- McGuire, M. Collaborative Public Management: Assessing What We Know and How We Know It. Public Adm. Rev. 2006, 66, 33–43. [Google Scholar] [CrossRef]
- Xiong, C. Changes and challenges of environmental protection reform to the fulfillment of responsibilities of ecological and environmental departments. Acad. Forum 2019, 42, 136–148. [Google Scholar] [CrossRef]
- Cash, D.W.; Adger, W.N.; Berkes, F.; Garden, P.; Lebel, L.; Olsson, P.; Pritchard, L.; Young, O. Scale and Cross-Scale Dynamics: Governance and Information in a Multilevel World. Ecol. Soc. 2006, 11, 8. [Google Scholar] [CrossRef]
- Lo, K. How Authoritarian Is the Environmental Governance of China? Environ. Sci. Policy 2015, 54, 152–159. [Google Scholar] [CrossRef]
- Kostka, G.; Nahm, J. Central–Local Relations: Recentralization and Environmental Governance in China. China Q. 2017, 231, 567–582. [Google Scholar] [CrossRef]
- Scholz, J.T.; Berardo, R.; Kile, B. Do Networks Solve Collective Action Problems? Credibility, Search, and Collaboration. J. Politics 2008, 70, 393–406. [Google Scholar] [CrossRef]
- Tian, X.-L.; Guo, Q.-G.; Han, C.; Ahmad, N. Different Extent of Environmental Information Disclosure across Chinese Cities: Contributing Factors and Correlation with Local Pollution. Glob. Environ. Chang. 2016, 39, 244–257. [Google Scholar] [CrossRef]
- Hu, X.Y. The Traditional Roots and Modern Regeneration of Chinese River Culture. Guangxi Soc. Sci. 2019, 292, 135–141. [Google Scholar]
- Gao, H.; Gong, X. Community Social Organizations Viewed from AGIL Framework: Their Function System and Approaches to Function Enhancement. J. Nanjing Norm. Univ. (Soc. Sci. Ed.) 2018, 217, 25–31. [Google Scholar]
- Huang, Q.; Xu, J. Rethinking Environmental Bureaucracies in River Chiefs System (RCS) in China: A Critical Literature Study. Sustainability 2019, 11, 1608. [Google Scholar] [CrossRef]
- Zhang, Z.G. Legislation of River Length System: Necessity, Mode and Difficulty. Hebei Law Sci. 2019, 37, 29–41. [Google Scholar] [CrossRef]

| Number | Classification | Function |
|---|---|---|
| 1 | Class I | Source water, national nature reserve. |
| 2 | Class II | First-level protected area for centralized drinking water surface water sources, rare aquatic life habitats, etc. |
| 3 | Class III | Second-level protected area for centralized drinking water sur-face water sources, fish and shrimp wintering grounds, migration channels, etc. |
| 4 | Class IV | General industrial water area, recreational water areas with indirect human contact. |
| 5 | Class V | Agricultural water area, general landscape waters. |
| Province | Class | 2016 | 2017 | 2018 | 2019 | 2020 | Data Source |
|---|---|---|---|---|---|---|---|
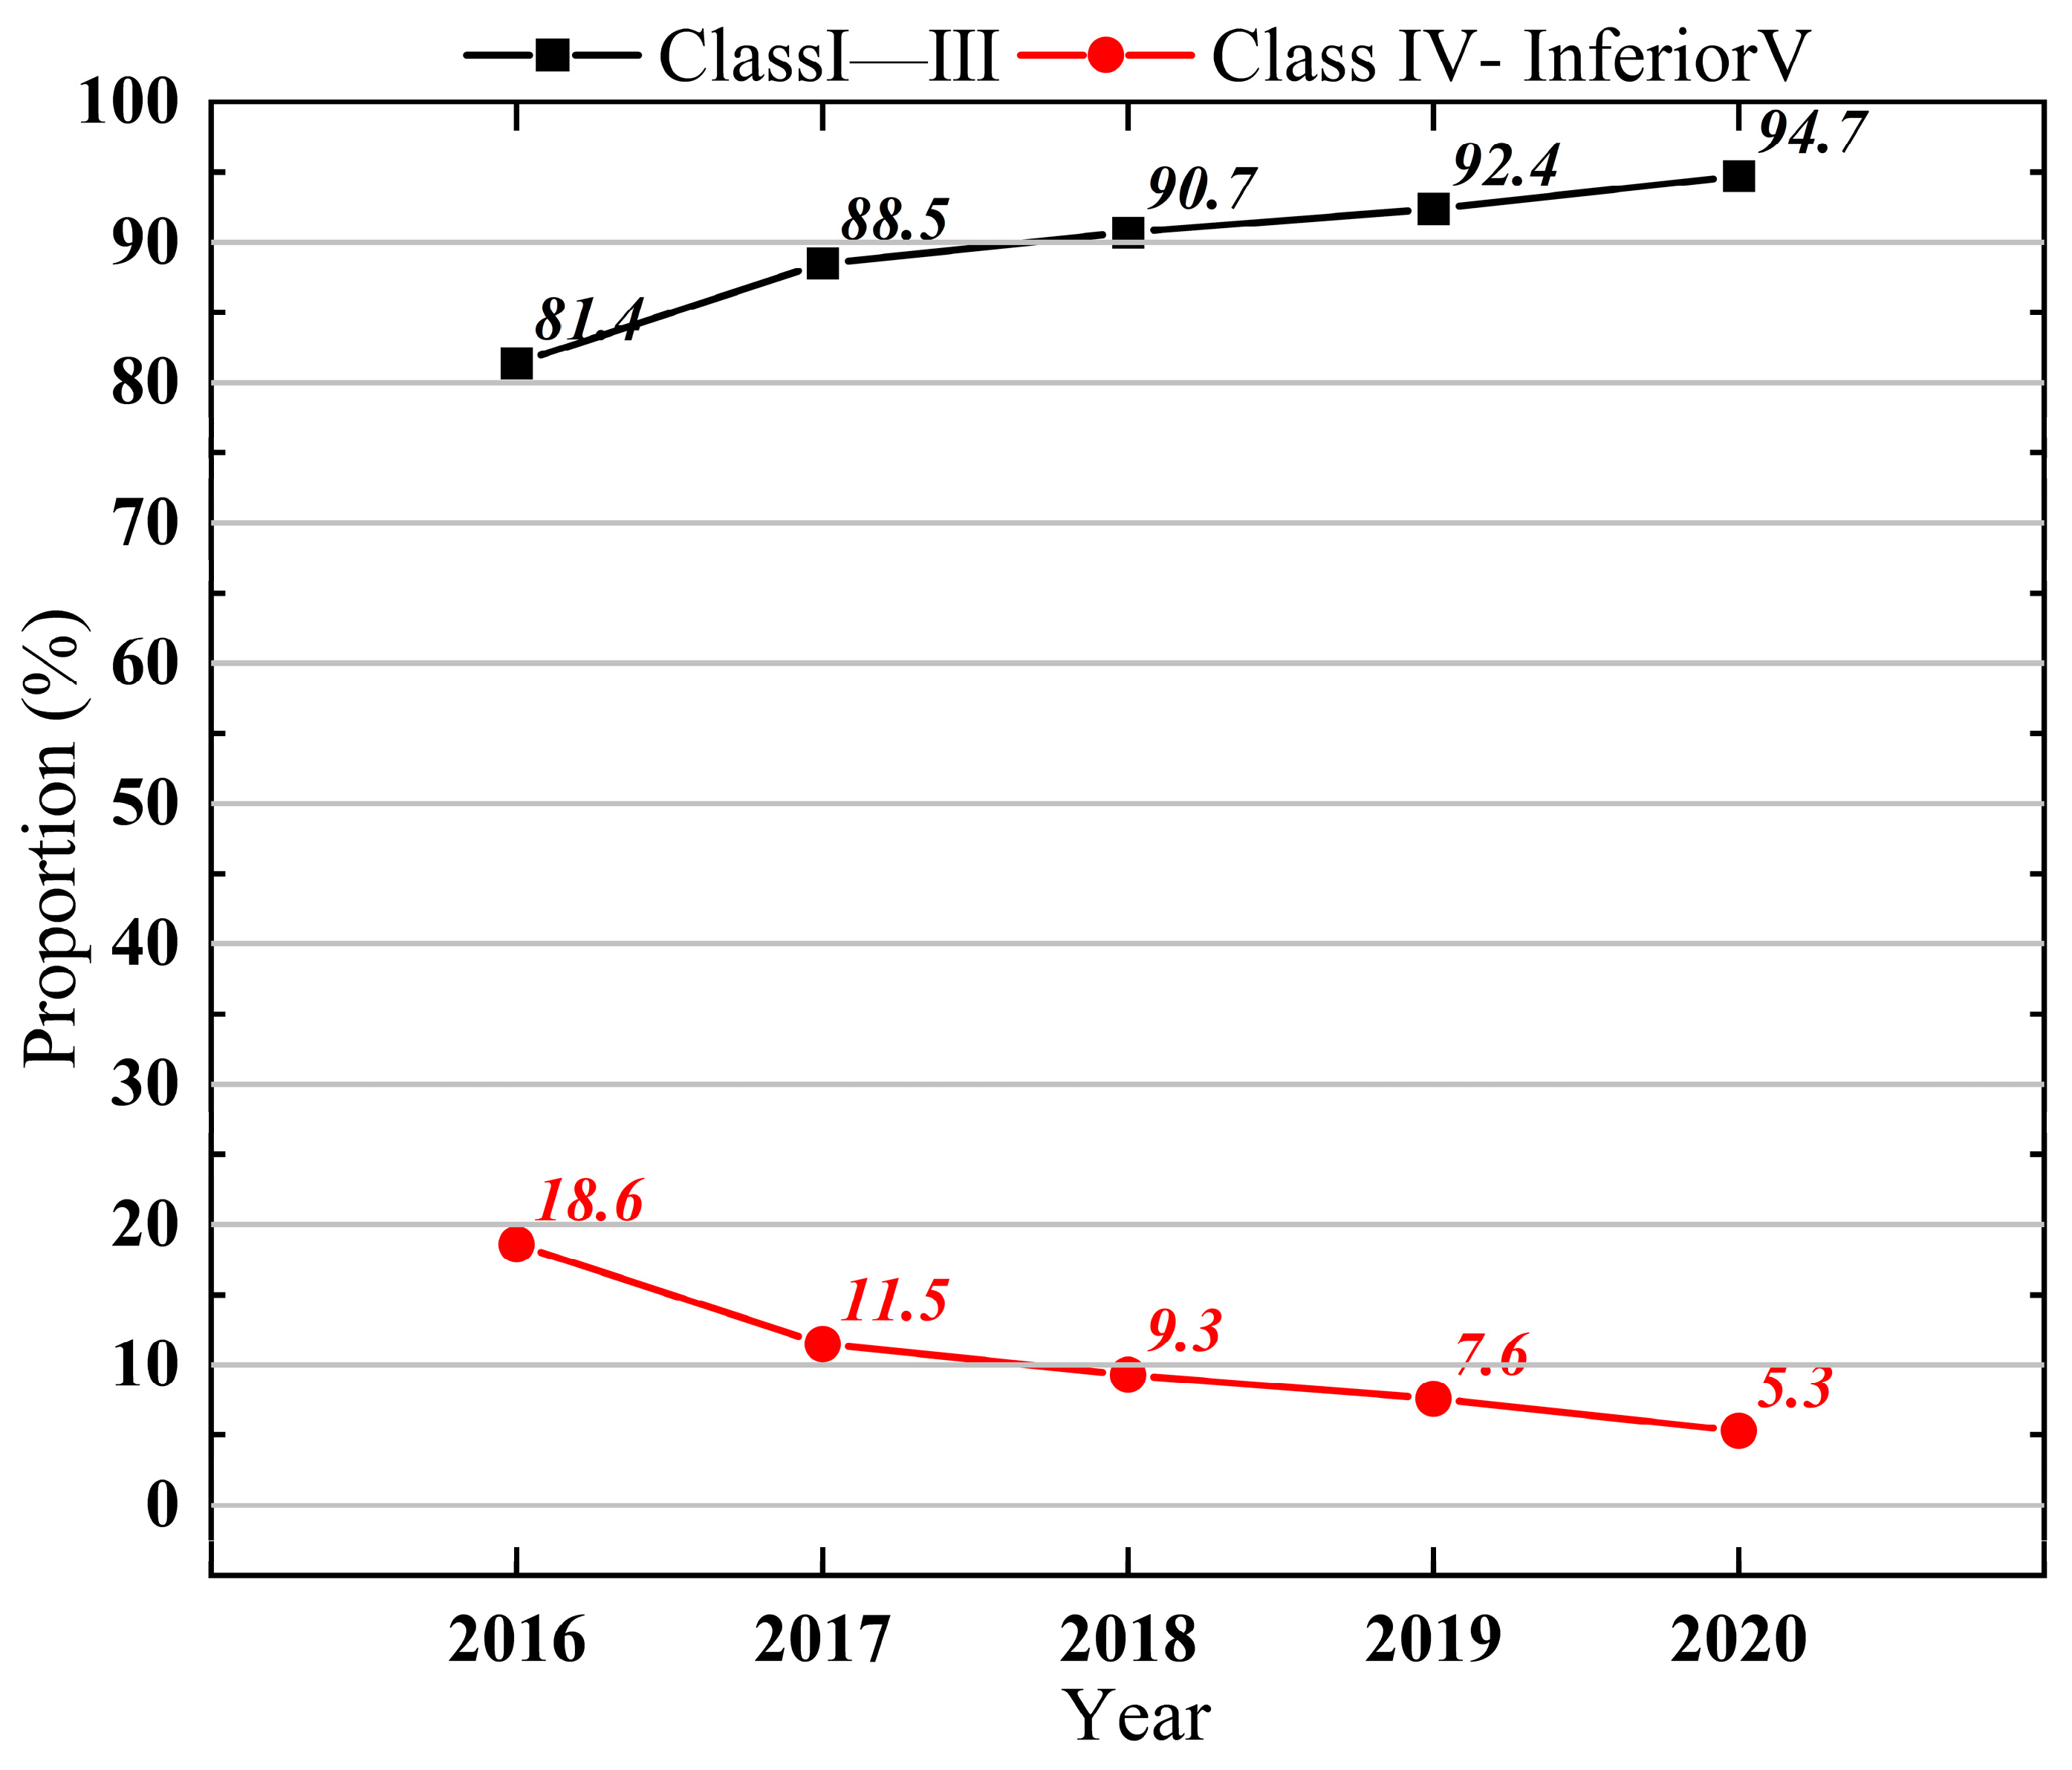
| Jiangxi | Class I–III | 81.4% | 88.5% | 90.7% | 92.4% | 94.7% | http://sthjt.jiangxi.gov.cn/col/col42073/index.html (accessed on 9 February 2024) |
| Class IV–Inferior Class V | 18.6% | 11.5% | 9.3% | 7.6% | 5.3% | ||
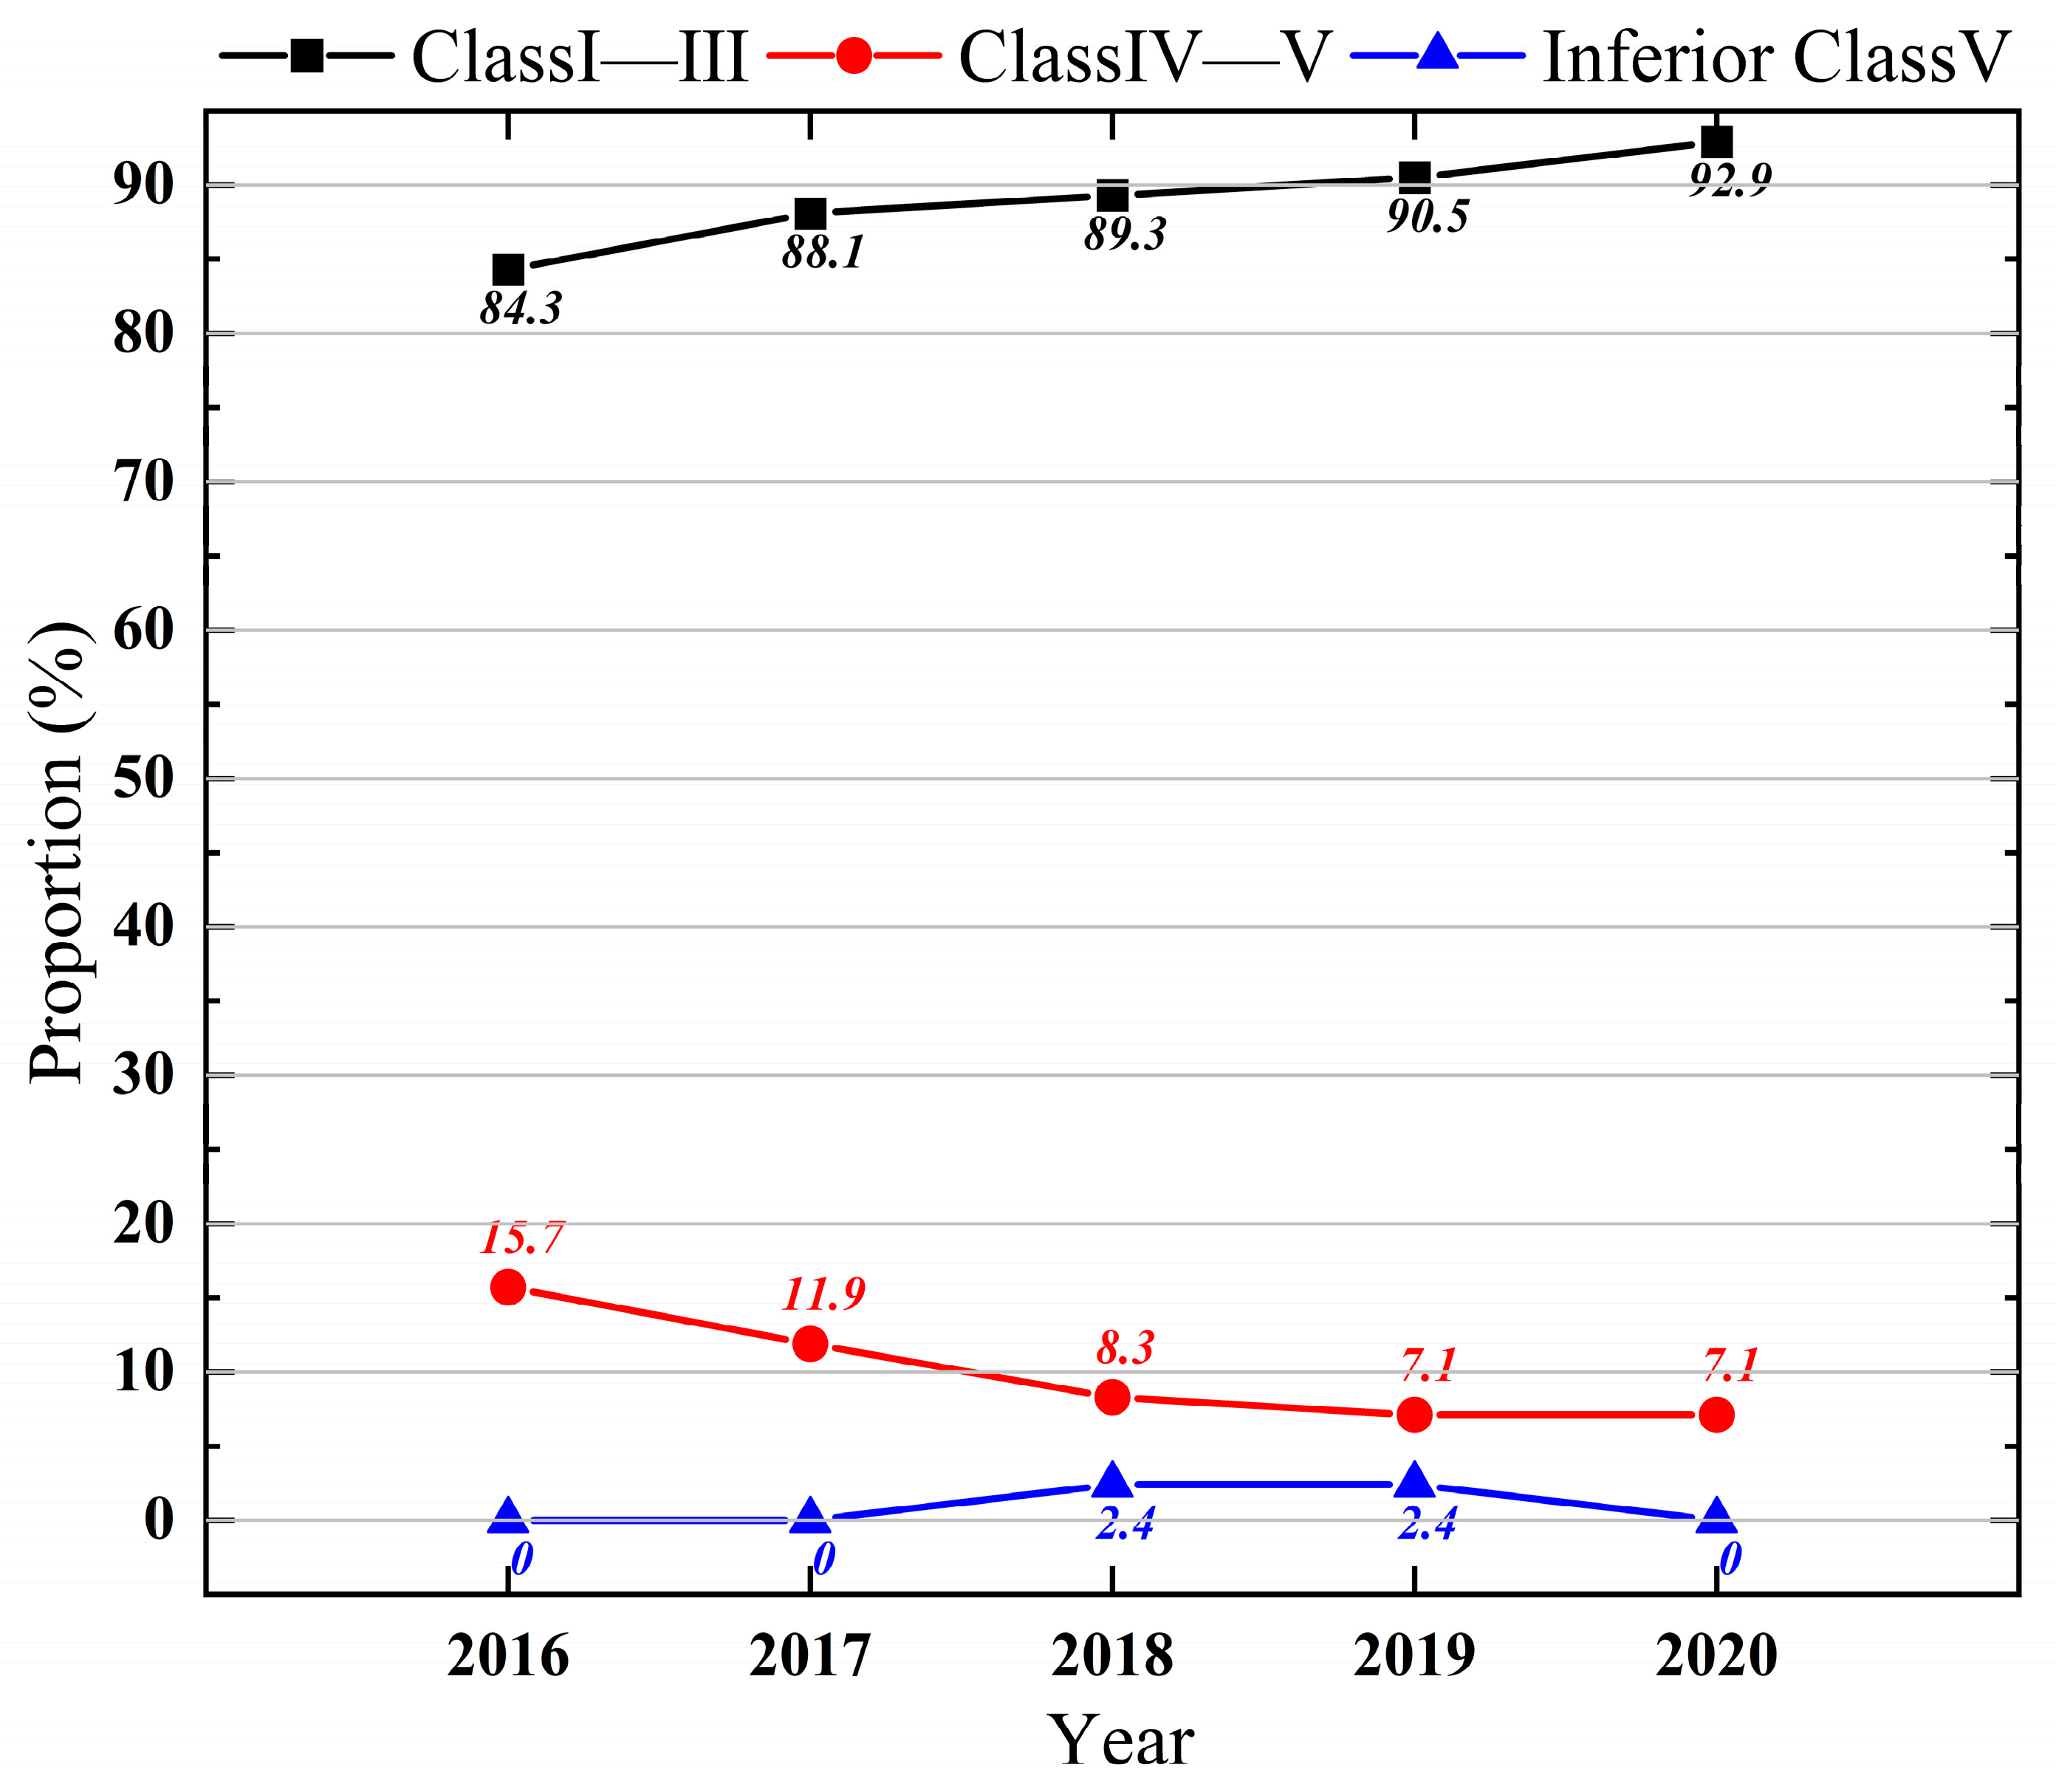
| Anhui | Class I–III | 84.3% | 88.1% | 89.3% | 90.5% | 92.9% | https://sthjt.ah.gov.cn/public/column/21691?type=4&catId=28009461&action=list (accessed on 9 February 2024) |
| Class IV–V | 15.7% | 11.9% | 8.3% | 7.1% | 7.1% | ||
| Inferior Class V | 0% | 0% | 2.4% | 2.4% | 0% | ||
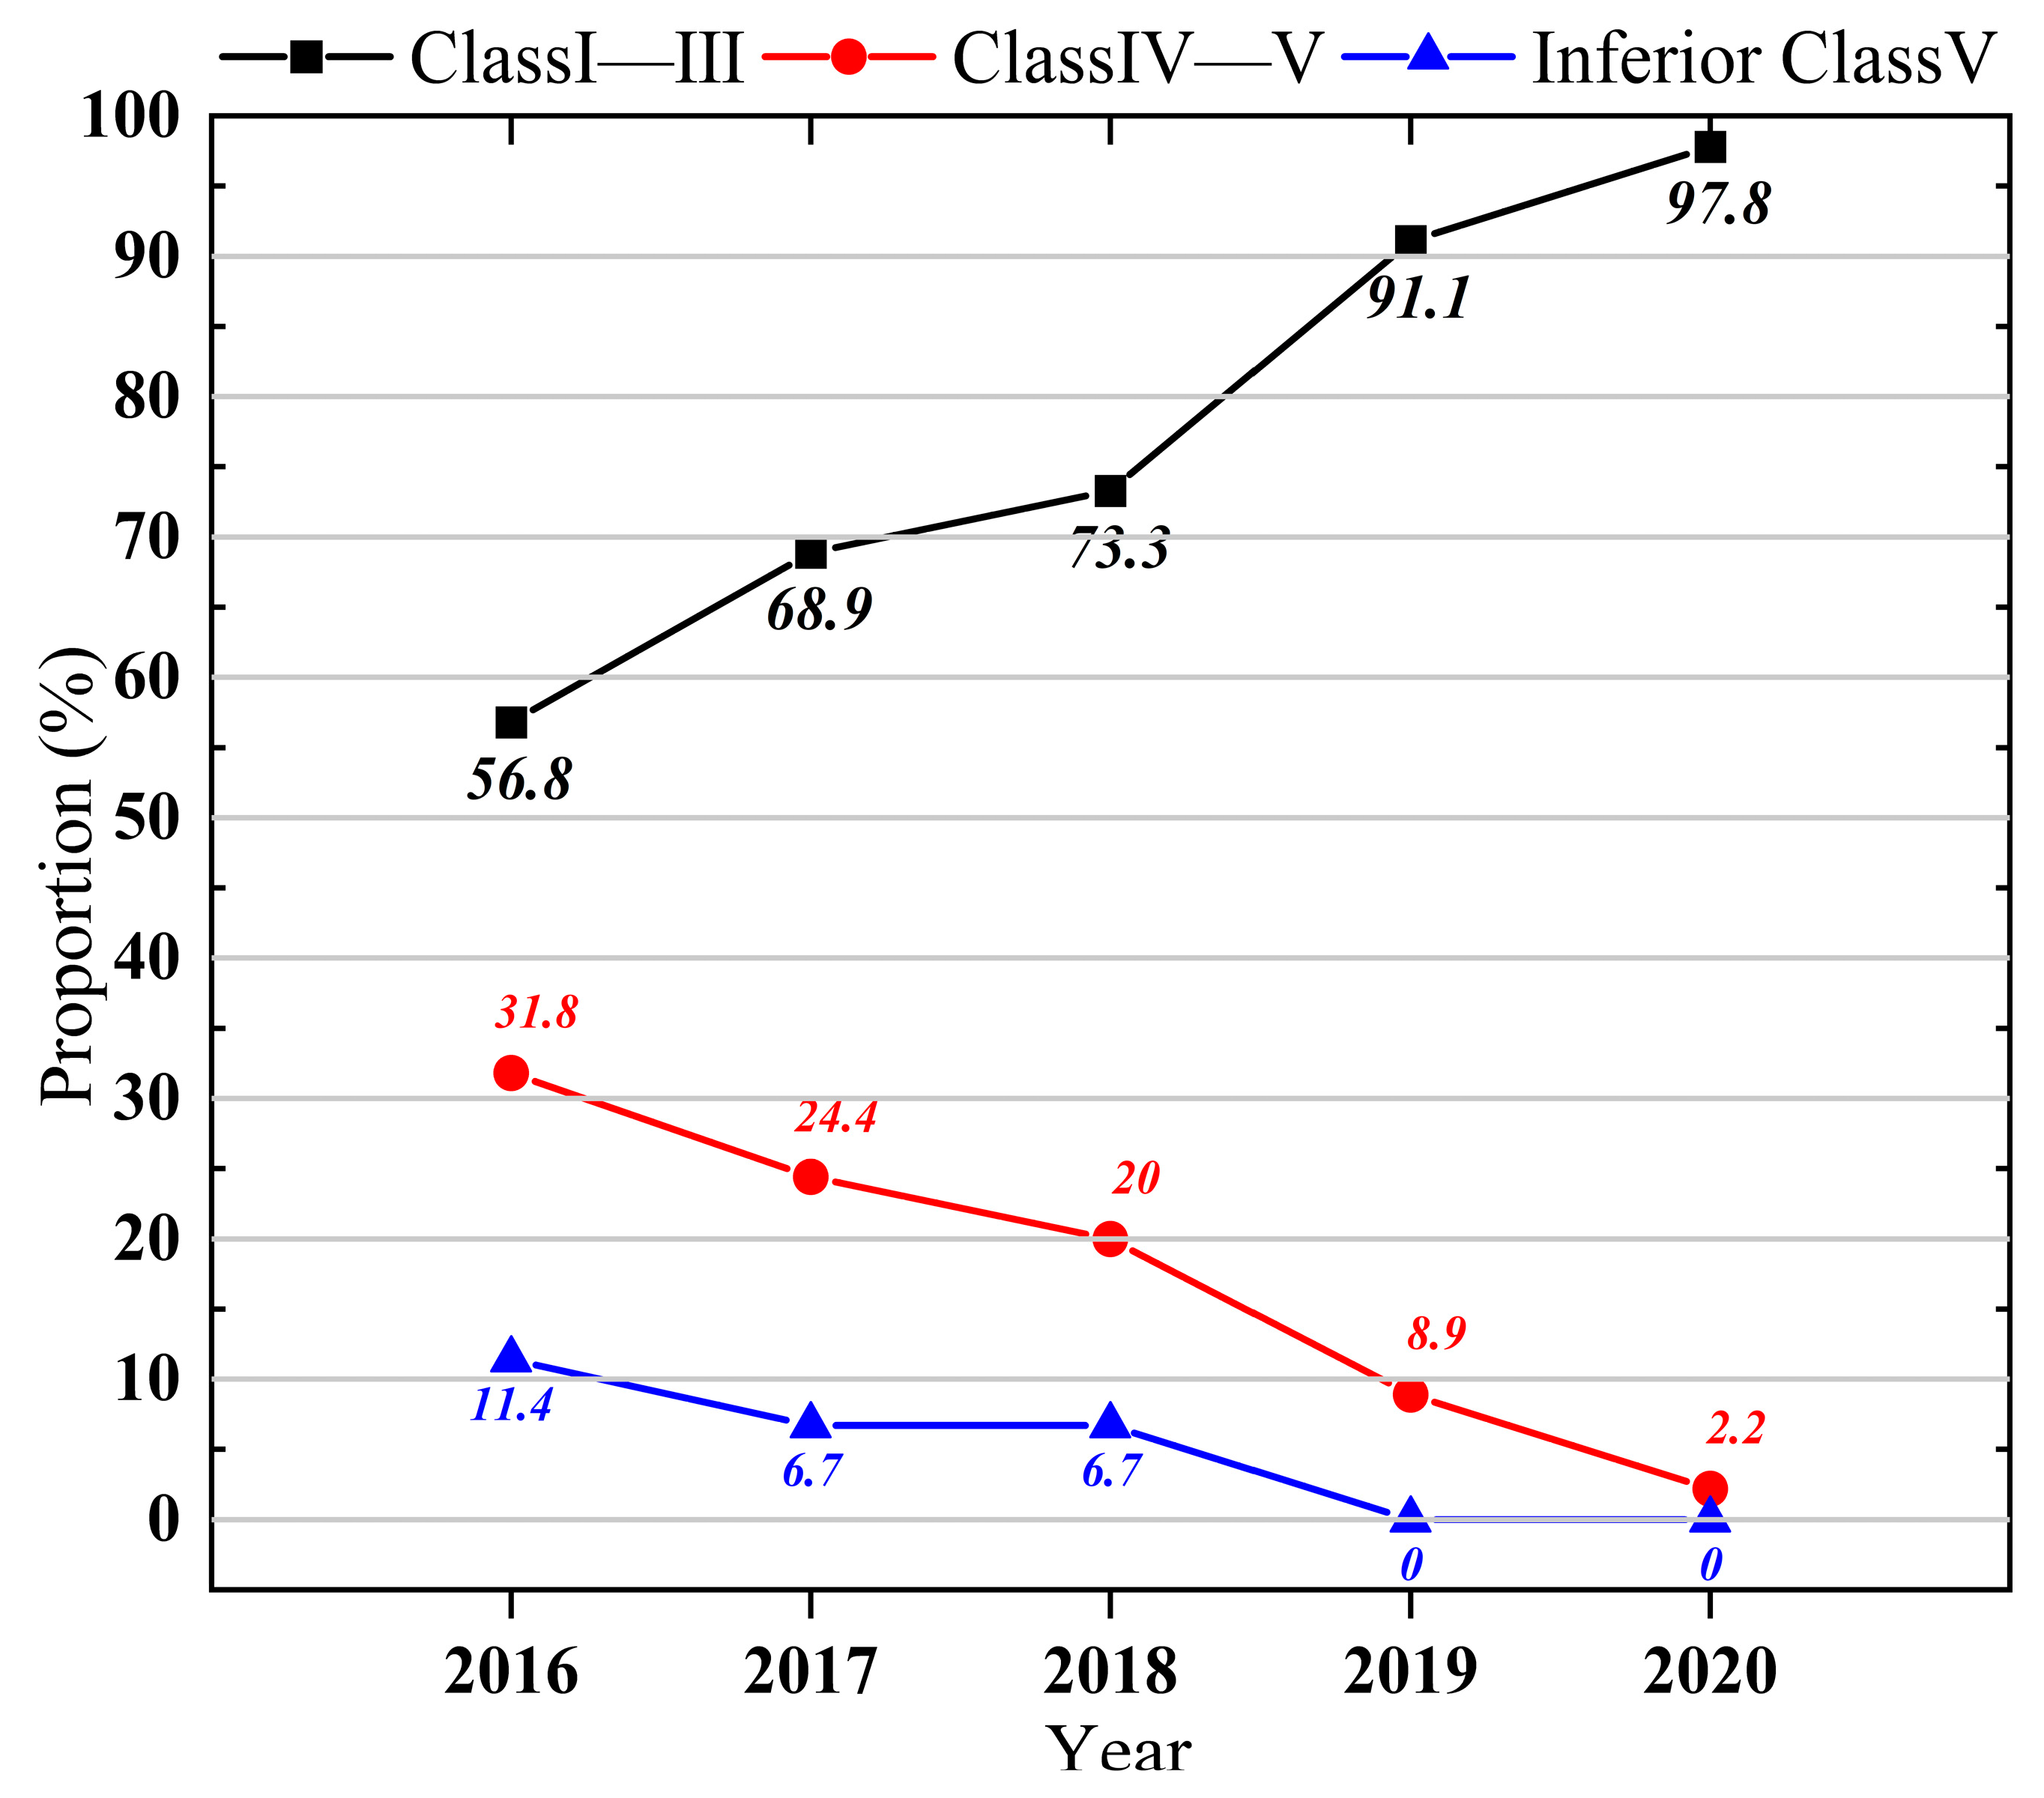
| Jiangsu | Class I–III | 56.8% | 68.9% | 73.3% | 91.1% | 97.8% | http://sthjt.jiangsu.gov.cn/col/col83855/index.html (accessed on 9 February 2024) |
| Class IV–V | 31.8% | 24.4% | 20% | 8.9% | 2.2% | ||
| Inferior Class V | 11.4% | 6.7% | 6.7% | 0% | 0% |
| Variables | Obs | Mean | Std. Dev. | Min | Max |
|---|---|---|---|---|---|
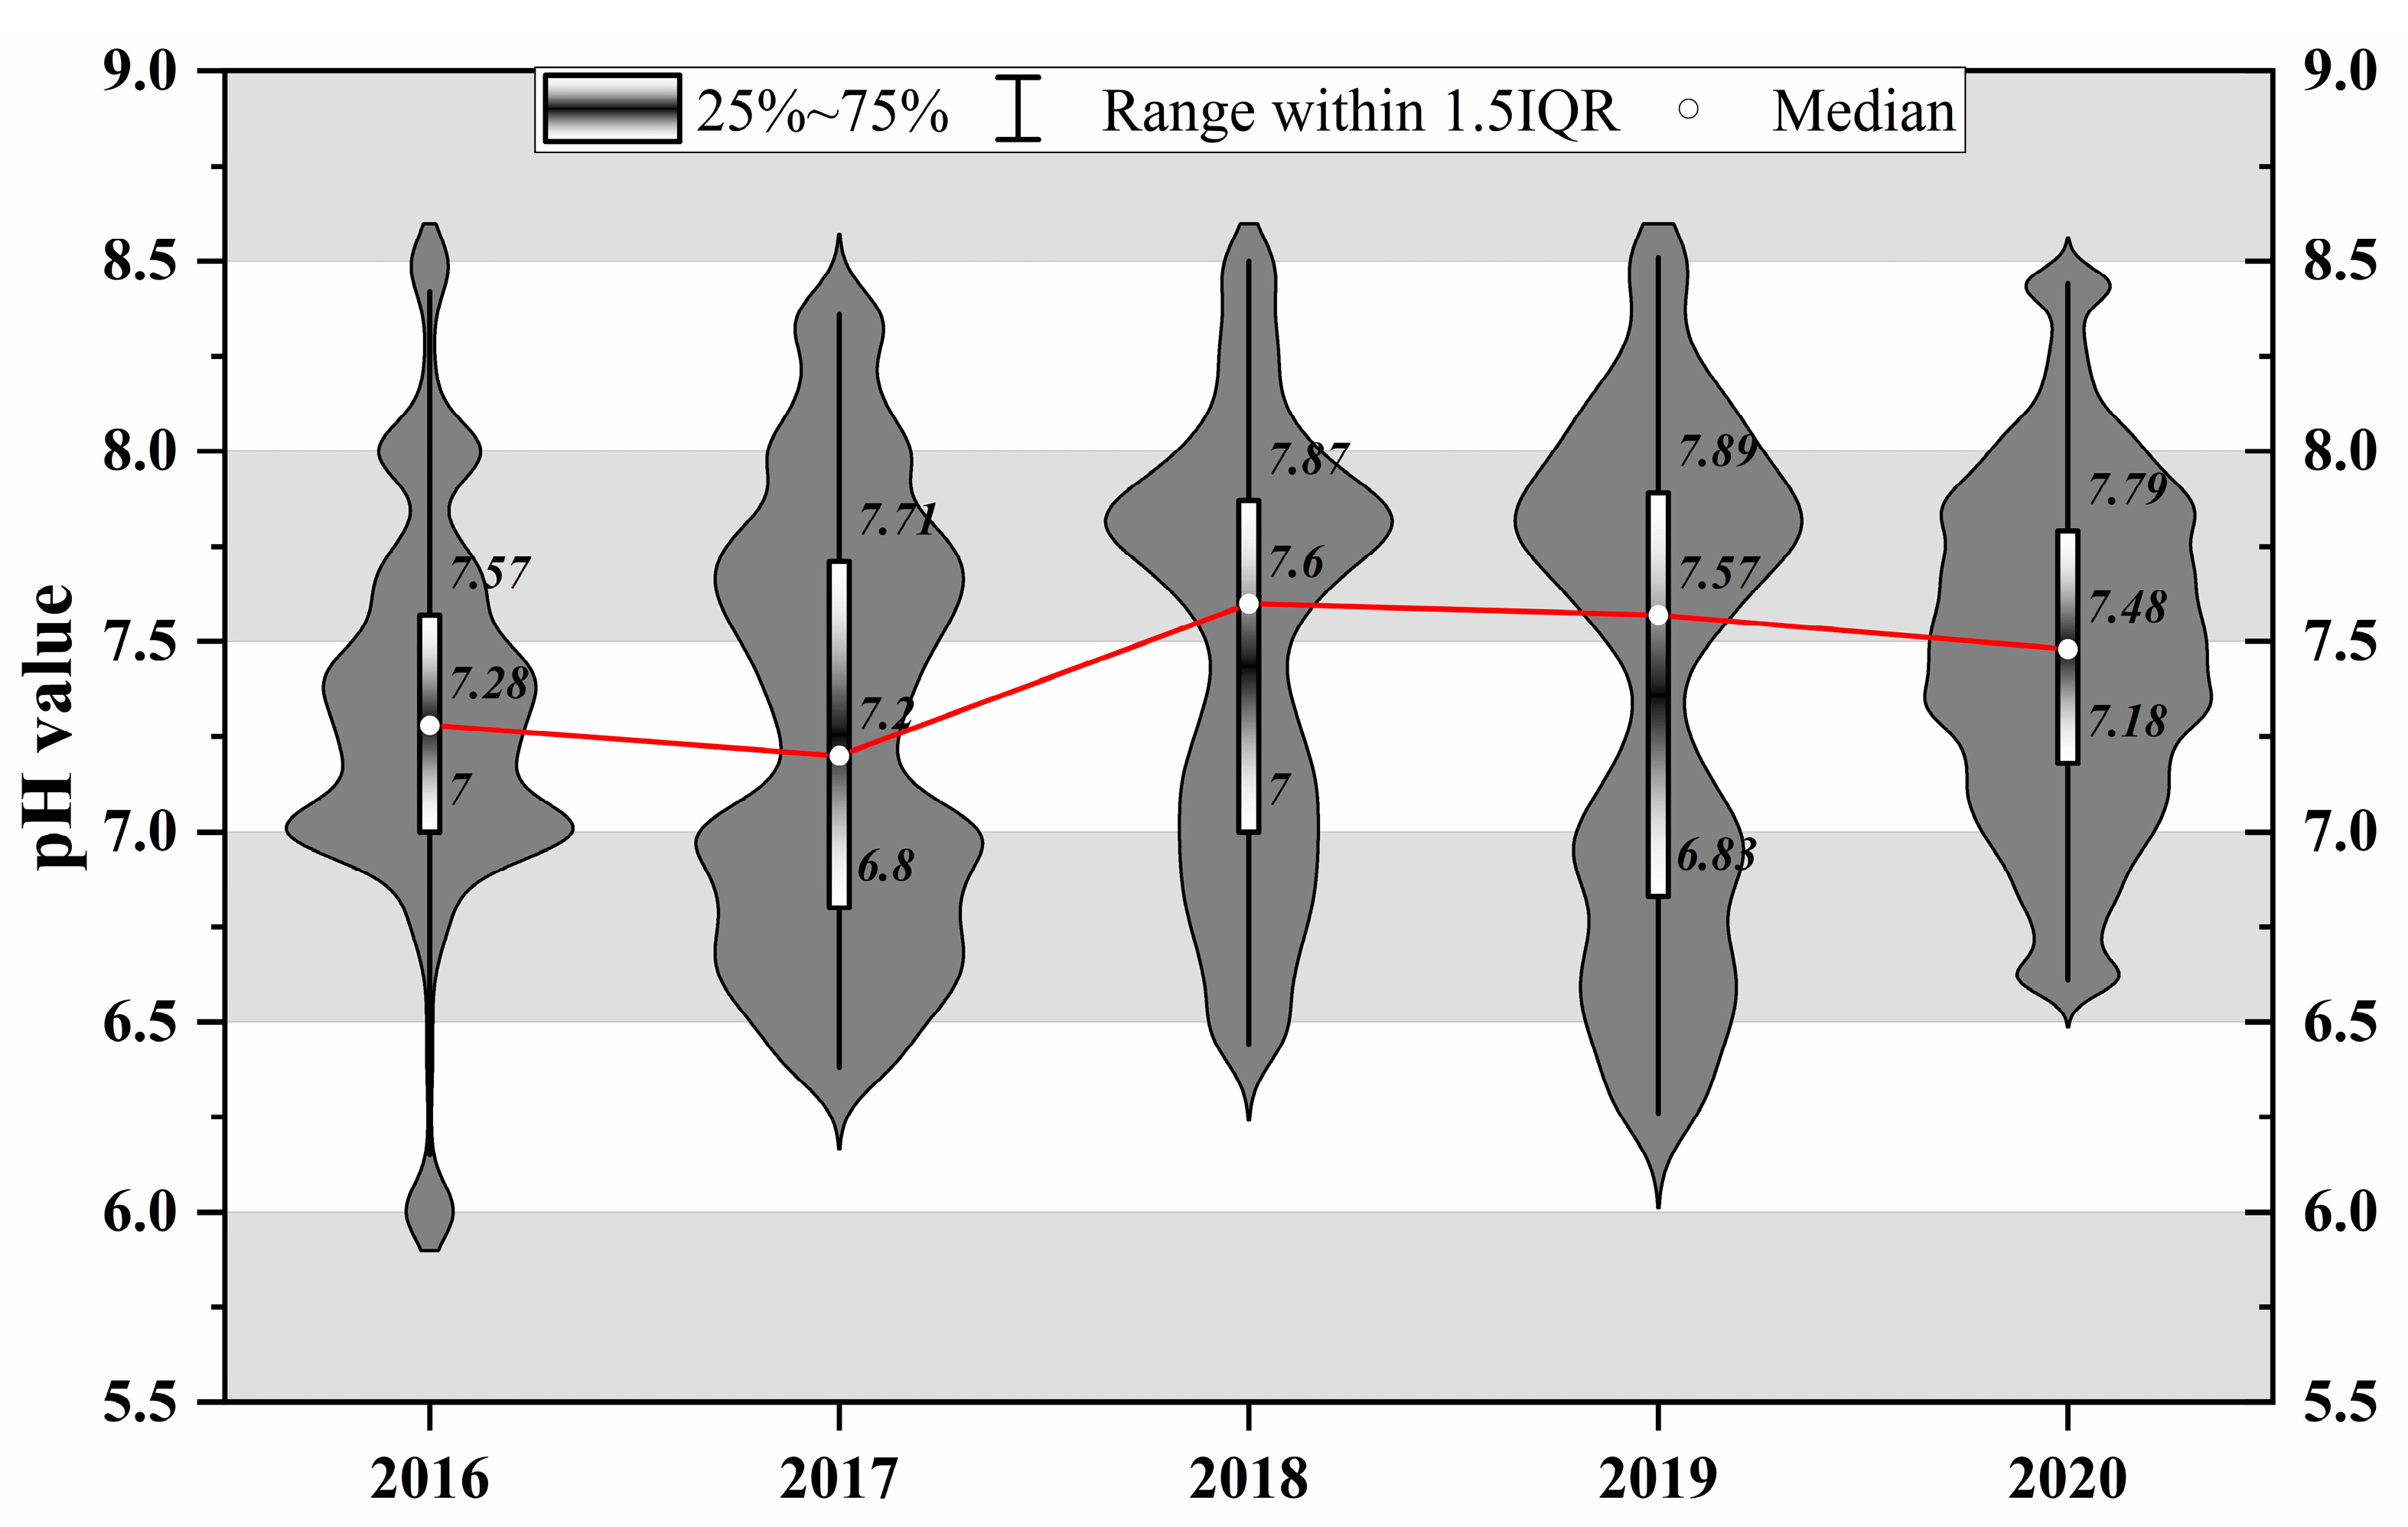
| pH-2016 | 8376 | 7.309 | 0.489 | 6.00 | 8.50 |
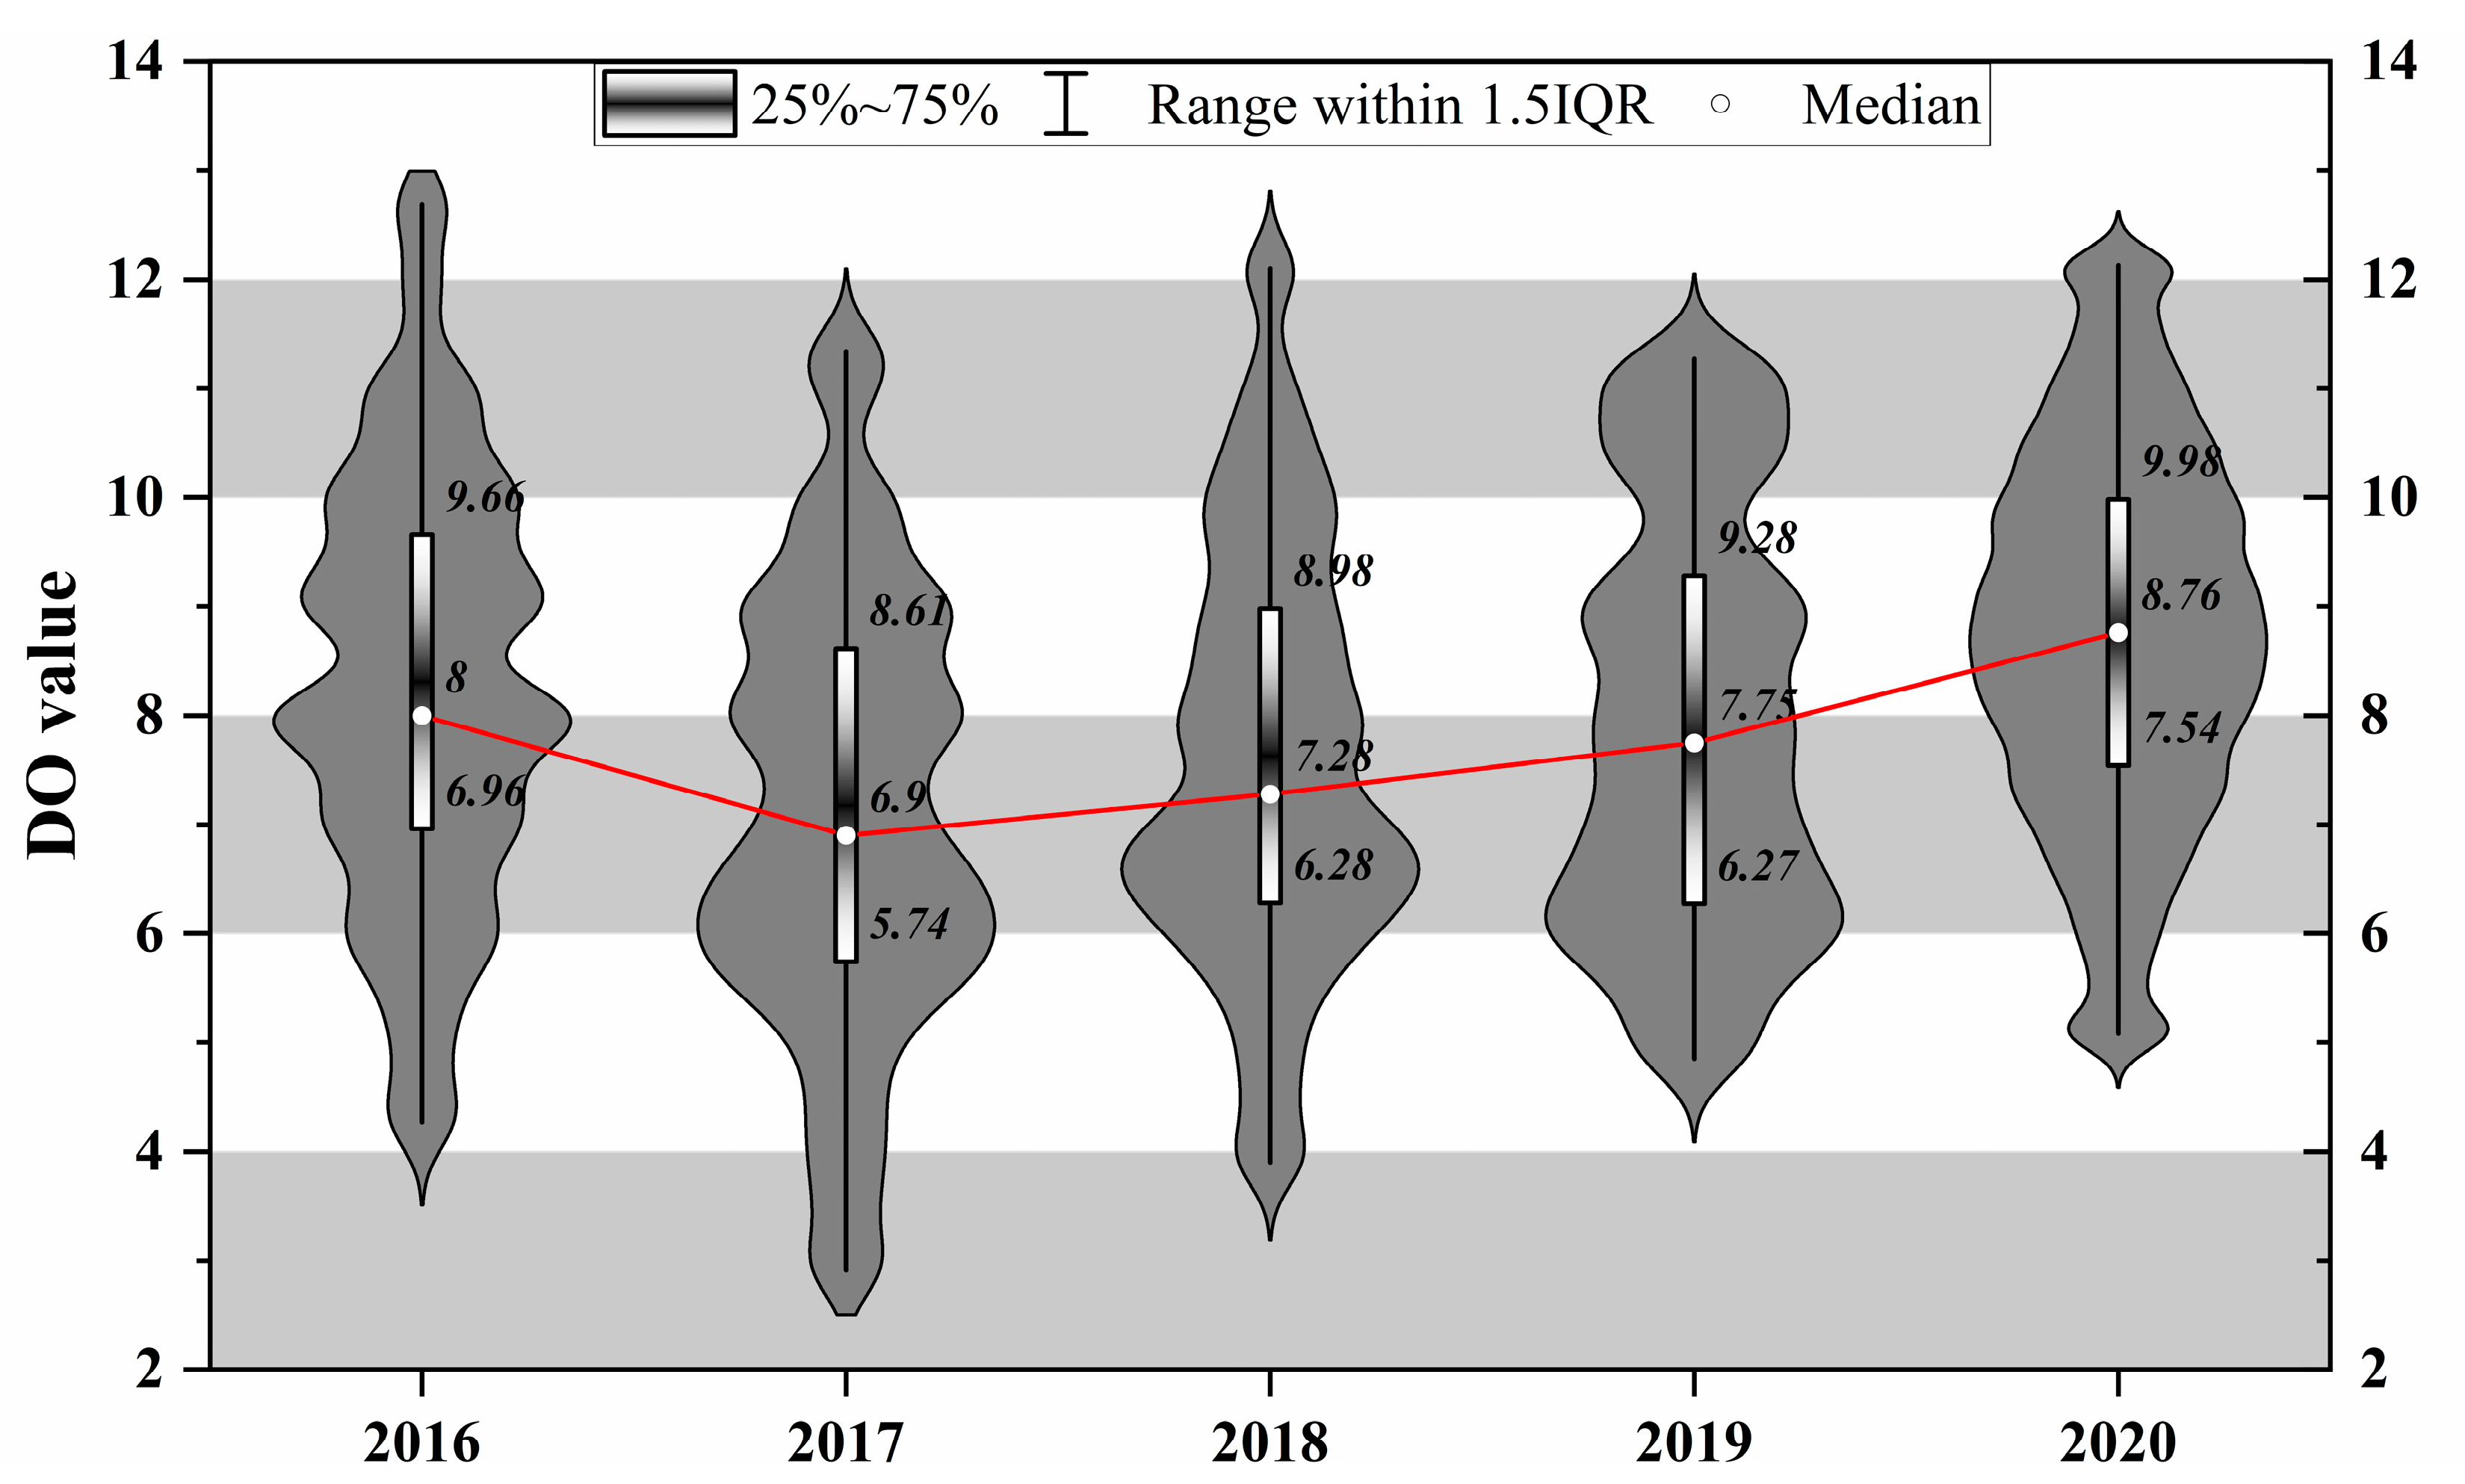
| DO-2016 | 8060 | 8.263 | 1.960 | 4.27 | 12.69 |
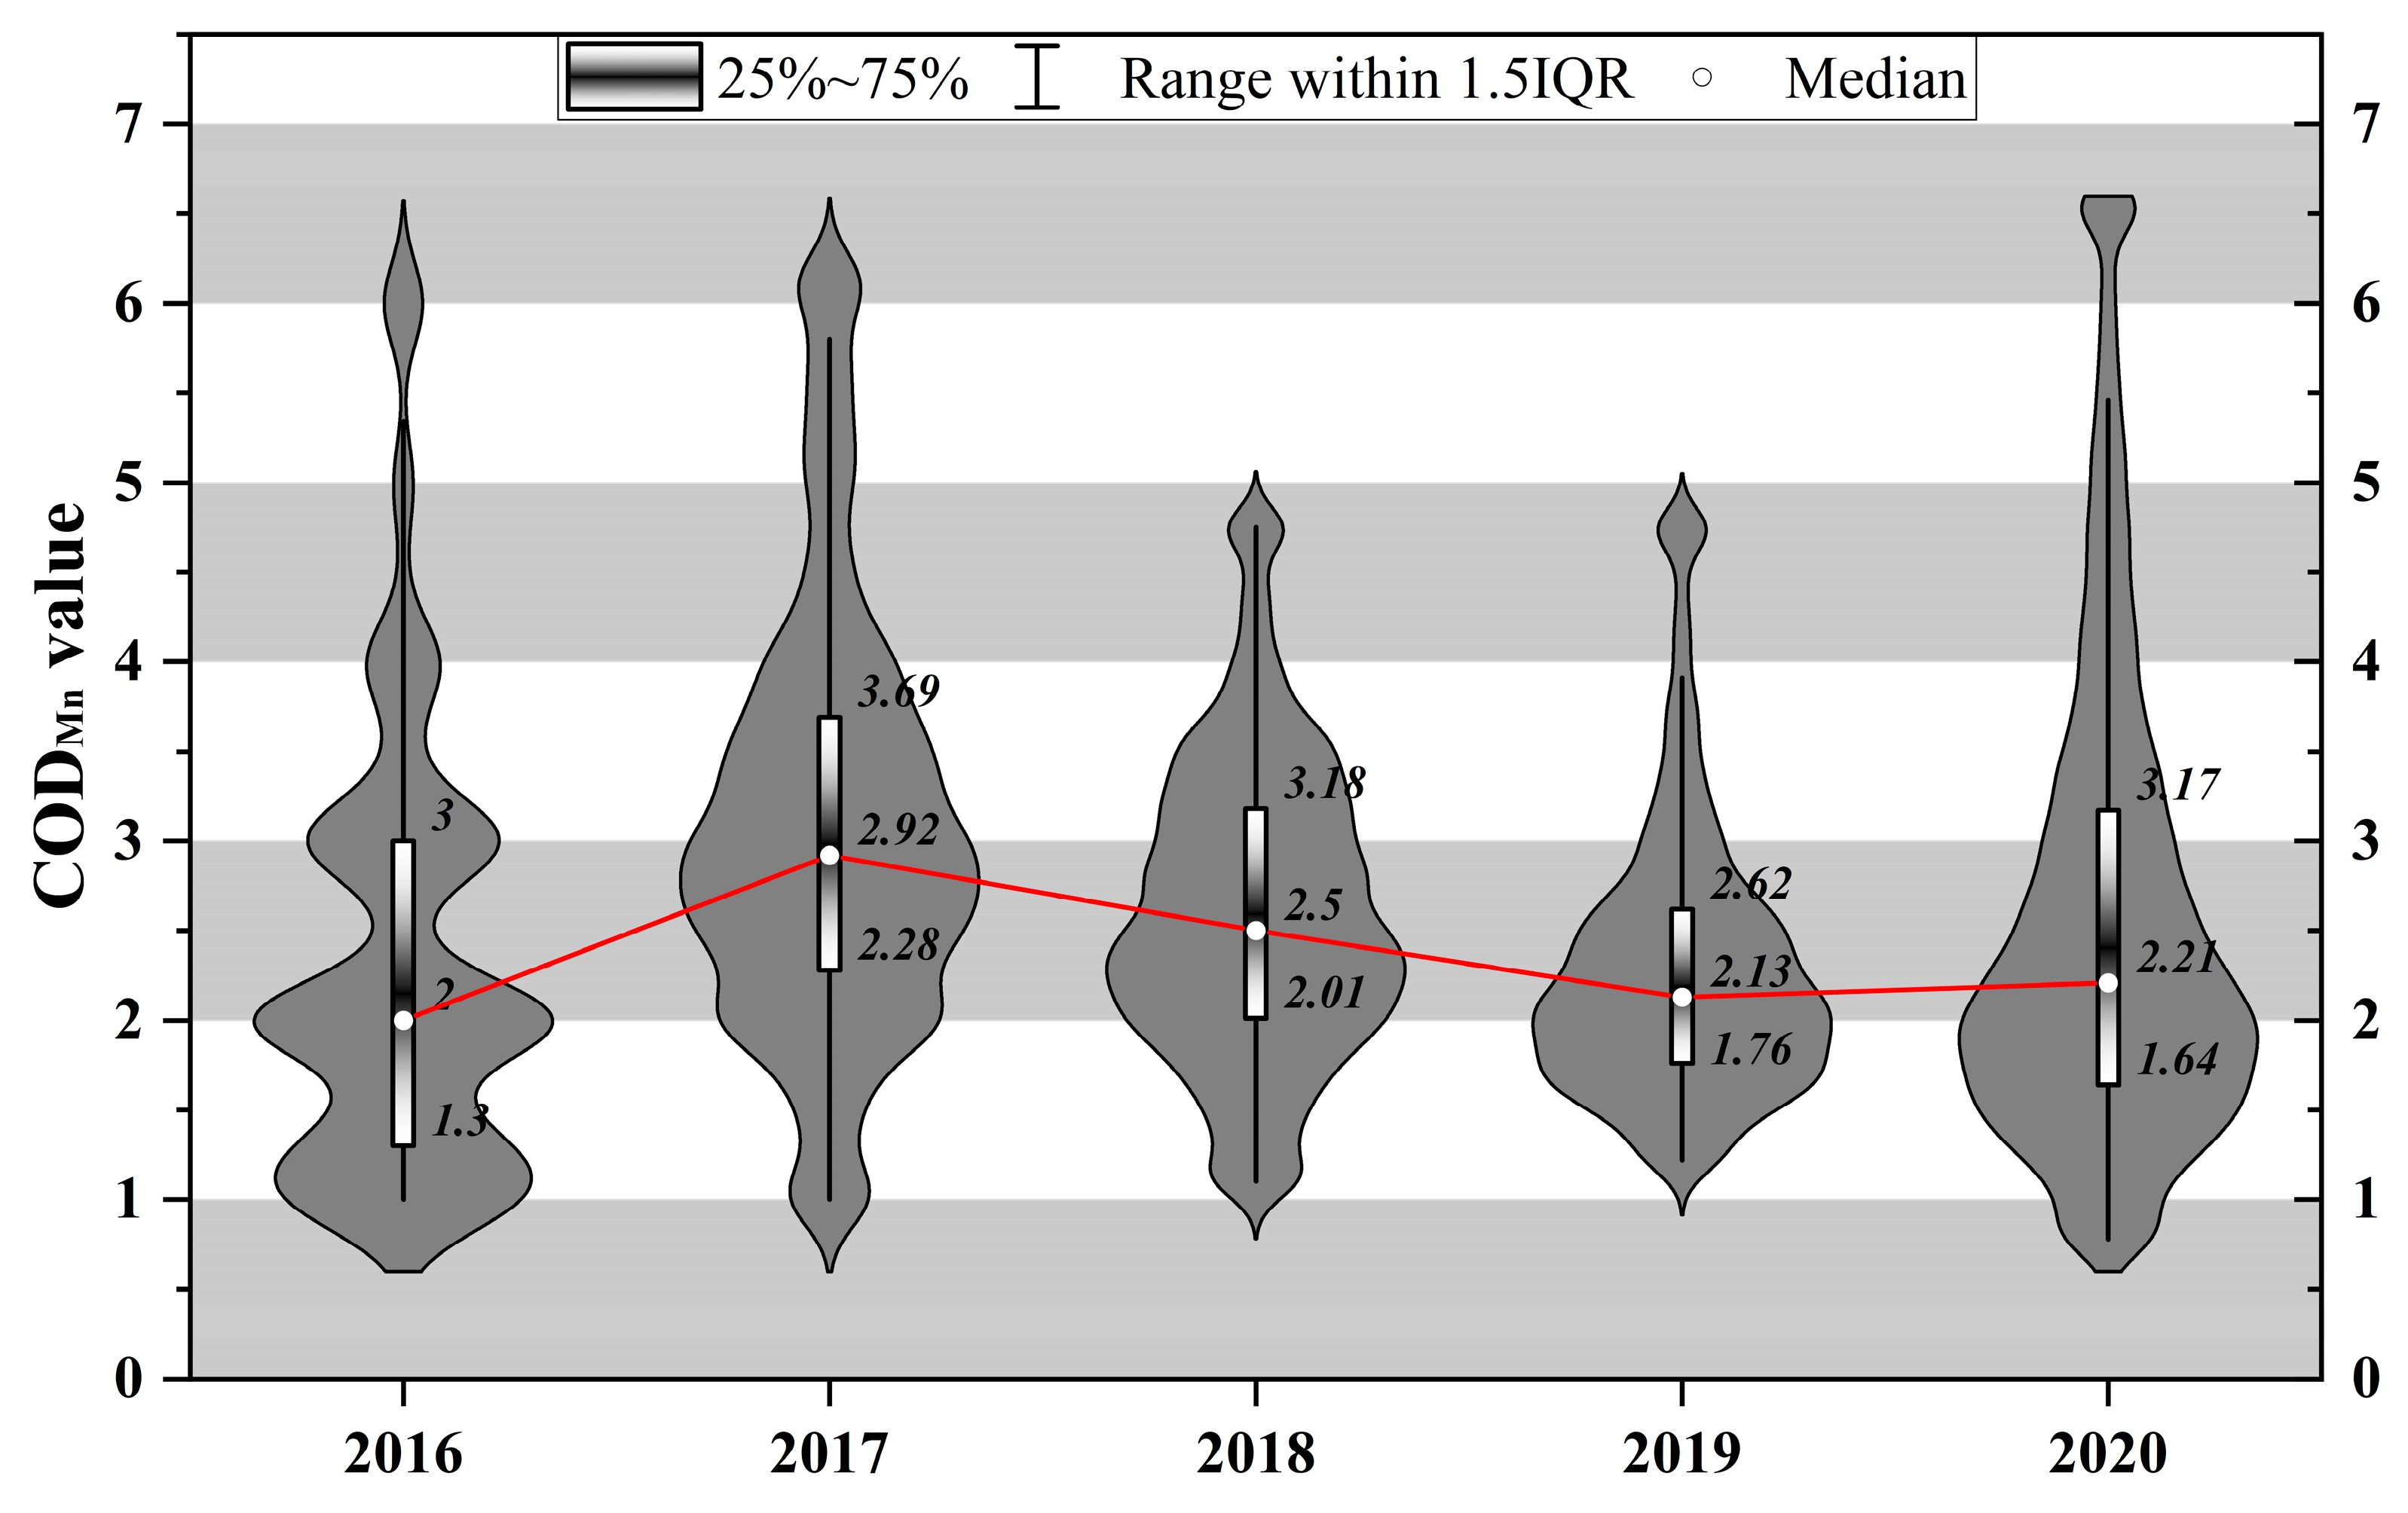
| CODMn-2016 | 2851 | 2.334 | 1.229 | 1.00 | 6.00 |
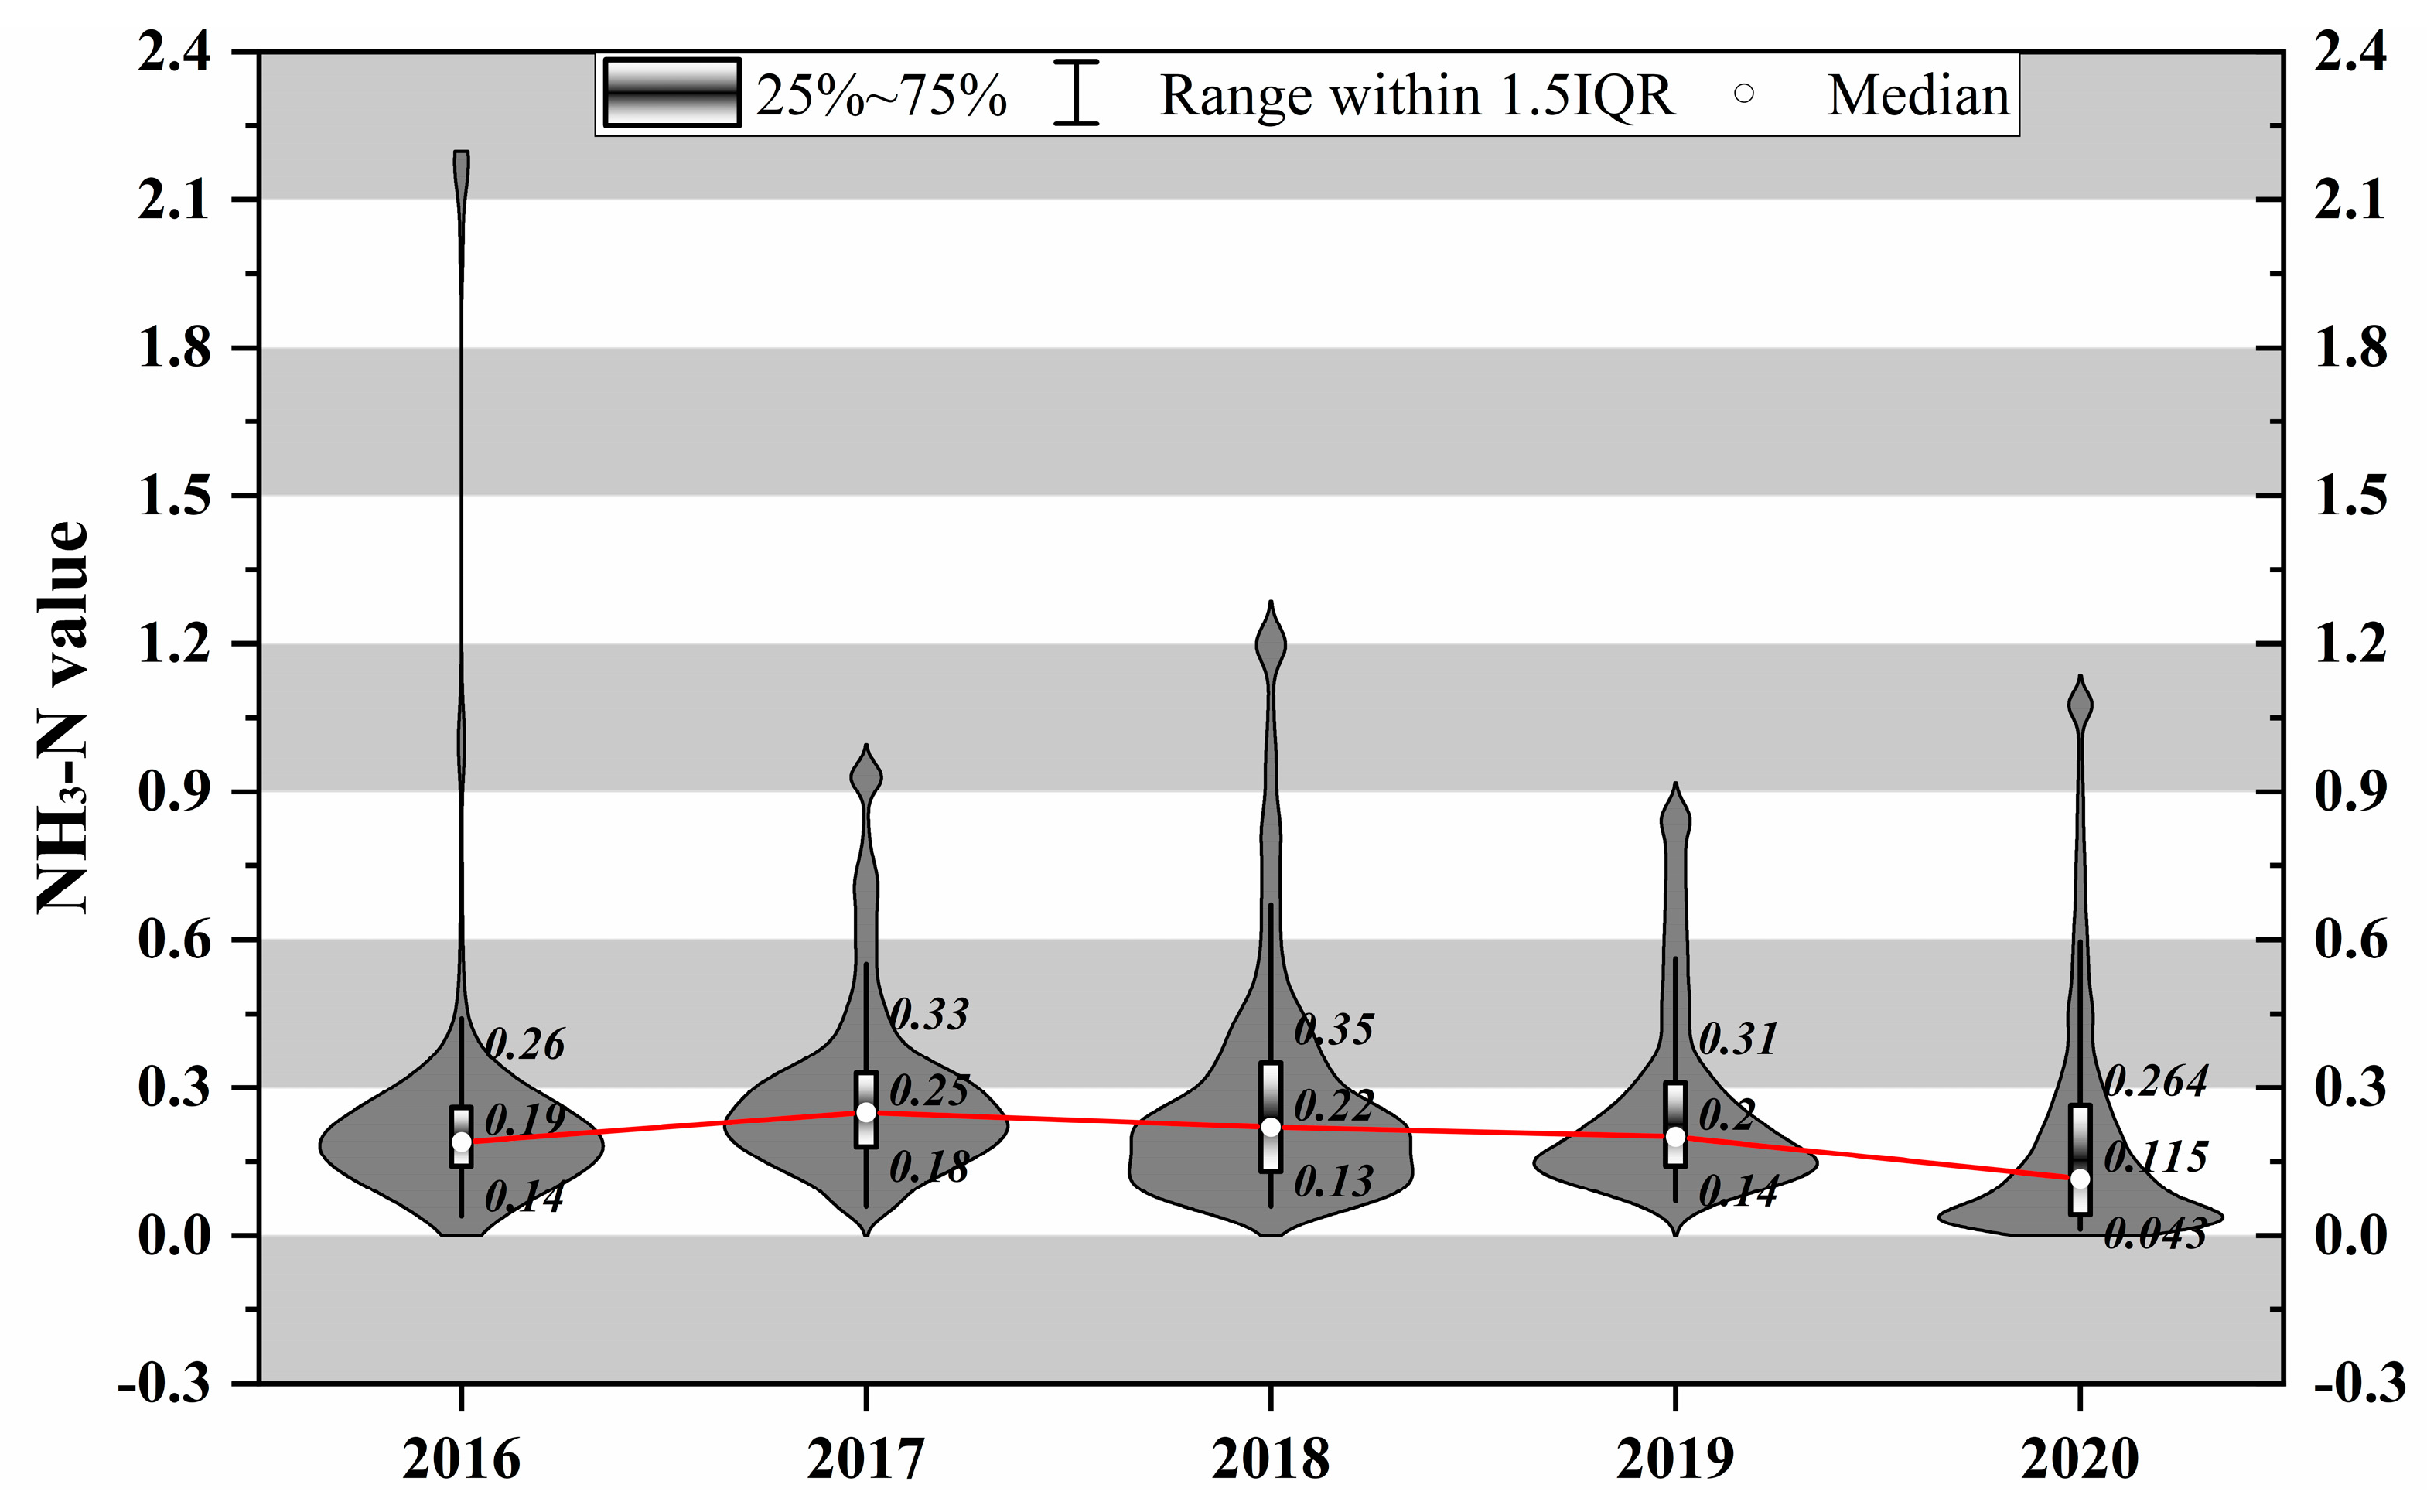
| NH3-N-2016 | 6170 | 0.280 | 0.385 | 0.04 | 2.18 |
| pH-2017 | 10,282 | 7.264 | 0.551 | 6.38 | 8.36 |
| DO-2017 | 10,297 | 7.008 | 2.013 | 2.91 | 11.34 |
| CODMn-2017 | 10,026 | 3.090 | 1.193 | 1.00 | 6.14 |
| NH3-N-2017 | 8204 | 0.293 | 0.179 | 0.06 | 0.93 |
| pH-2018 | 10,281 | 7.462 | 0.546 | 6.44 | 8.50 |
| DO-2018 | 10,276 | 7.601 | 1.926 | 3.90 | 12.1 |
| CODMn-2018 | 10,040 | 2.611 | 0.828 | 1.10 | 4.75 |
| NH3-N-2018 | 10,226 | 0.292 | 0.249 | 0.06 | 1.20 |
| pH-2019 | 7689 | 7.385 | 0.634 | 6.26 | 8.51 |
| DO-2019 | 7689 | 7.907 | 1.873 | 4.85 | 11.27 |
| CODMn-2019 | 7631 | 2.305 | 0.775 | 1.22 | 4.75 |
| NH3-N-2019 | 7665 | 0.268 | 0.196 | 0.07 | 0.85 |
| pH-2020 | 53,281 | 7.482 | 0.426 | 6.61 | 8.44 |
| DO-2020 | 53,272 | 8.743 | 1.714 | 5.08 | 12.13 |
| CODMn-2020 | 52,289 | 2.574 | 1.326 | 0.78 | 6.54 |
| NH3-N-2020 | 51,895 | 0.209 | 0.246 | 0.013 | 1.077 |
| Number | Variables | Class I | Class II | Class III | Class IV | Class V |
|---|---|---|---|---|---|---|
| 1 | pH | 6~9 (non-dimensional) | ||||
| 2 | DO≥ | 7.5 | 6 | 5 | 3 | 2 |
| 3 | CODMn≤ | 2 | 4 | 6 | 10 | 16 |
| 4 | NH3-N≤ | 0.15 | 0.5 | 1.0 | 1.5 | 2.0 |
Disclaimer/Publisher’s Note: The statements, opinions and data contained in all publications are solely those of the individual author(s) and contributor(s) and not of MDPI and/or the editor(s). MDPI and/or the editor(s) disclaim responsibility for any injury to people or property resulting from any ideas, methods, instructions or products referred to in the content. |
© 2024 by the authors. Licensee MDPI, Basel, Switzerland. This article is an open access article distributed under the terms and conditions of the Creative Commons Attribution (CC BY) license (https://creativecommons.org/licenses/by/4.0/).
Share and Cite
Li, J.; Xiong, C.; Huang, Y. How the River Chief System Achieved River Pollution Control: Analysis Based on AGIL Paradigm. Sustainability 2024, 16, 1775. https://doi.org/10.3390/su16051775
Li J, Xiong C, Huang Y. How the River Chief System Achieved River Pollution Control: Analysis Based on AGIL Paradigm. Sustainability. 2024; 16(5):1775. https://doi.org/10.3390/su16051775
Chicago/Turabian StyleLi, Jinyang, Chao Xiong, and Yunrong Huang. 2024. "How the River Chief System Achieved River Pollution Control: Analysis Based on AGIL Paradigm" Sustainability 16, no. 5: 1775. https://doi.org/10.3390/su16051775
APA StyleLi, J., Xiong, C., & Huang, Y. (2024). How the River Chief System Achieved River Pollution Control: Analysis Based on AGIL Paradigm. Sustainability, 16(5), 1775. https://doi.org/10.3390/su16051775