Abstract
Sustainable development requires a holistic perspective that integrates the different aspects of production and consumption and promotes the transition to a circular economy. This approach aims to balance the needs of the present and future generations, as well as the social, environmental, and economic dimensions of development. By producing products that are durable, recyclable, and reusable, and by minimizing the use of energy and materials, the environmental impact of production can be reduced while also generating economic benefits and enhancing social well-being. The article addresses the multicriteria sustainability of producing mortar modified with sand from recycled concrete rubble. The research explored the possibility of replacing natural sand with recycled sand in proportions from 10% to 100%. The consistency of mixtures, flexural and compressive strengths after 2, 28, and 90 days, as well as the carbon footprint and cost of the aggregate used were analyzed. The waste management index and sustainable use of natural resources were also considered. The research and analysis showed that recycled sand could be successfully used as an alternative for natural aggregate, as there are clear environmental and economic advantages, and the basic technical characteristics do not differ significantly statistically from the unmodified composite.
1. Introduction
Sustainable development is a global challenge that requires rethinking the way we produce and consume goods and services [1]. The linear model of production, based on extracting resources, transforming them into products, and disposing of them as waste, is not compatible with the finite capacity of the planet and the growing needs of the population [2,3]. Therefore, there is a need for a transition to a circular economy, where resources are used efficiently, and waste is minimized or eliminated. A circular economy is not only an environmental solution, but it is also a source of economic opportunities and social benefits. By designing products that are durable, recyclable, and reusable, and by optimizing the use of energy and materials, the environmental impact of production can be reduced, while also creating value, jobs, and well-being for society. However, achieving a circular economy requires a holistic perspective that integrates the different aspects of production and consumption and considers the needs of the present and future generations, as well as the social [1], environmental [4], and economic [5] dimensions of development. In view of this, when planning a potentially beneficial modification of cement composites, all these factors should be taken into account.
The majority of the total waste, more than 60% [6], comes from the construction and demolition waste that is produced by extracting materials, building new structures, and improving existing ones [7,8]. This waste is not easy to dispose of by usual methods, but it can be reused, for instance, as recycled aggregate (RA), which offers a smart and sustainable solution to be recycled into the circular economy. Aggregate constitutes 60–80% of the volume of concrete and requires a large amount of raw materials every year (>48 million tons), which challenges the sustainability of the supplies [9,10].
The RA as a substitute for natural aggregate (NA) can lower energy use and cost, save natural resources, and prevent landfill disposal [11]. It can also lower the environmental impacts of the construction industry, which is the biggest user of natural resources. Recycled aggregate has several environmental advantages over natural aggregate: it has 30% less embodied energy, 60% less CO2 emissions, and 65% less greenhouse gas emissions [12]. Moreover, it saves about 58% of energy and could guarantee similar properties of the concrete as made with natural aggregate [13]. The observed relationships are attributed to the fact that recycled sand, derived from crushed material obtained during the demolition of reinforced concrete and concrete structures, does not require extraction and transportation, often over considerable distances. Additionally, it is easier to crush recycled sand, as its strength is generally lower than that of the parent rock. This difference in strength contributes to the variations in embodied energy, CO2 emissions, and greenhouse gas emissions compared to natural sand. The reduced environmental impact stems from the inherent advantages of utilizing recycled sand, which avoids the resource-intensive processes associated with conventional sand extraction and transportation.
In the current times, when there is a lack of availability of sand, it is especially important to analyze the possibility of using sand from recycling [14] or recovery [15,16,17]. In the ever-evolving landscape of sustainable construction practices, the quest for environmentally friendly alternatives to traditional building materials has gained momentum. One such critical area of exploration revolves around finding substitutes for sand, a finite resource extensively used in the construction industry. Several materials are currently under consideration for this purpose, with a few noteworthy contenders being slag sand [18], waste glass powder [19], and various other by-products [20]. One of the possible uses of sand from recycling is to apply it in cementitious [21] or geopolymer [22] mortars. It has been found that using recycled sand (RS) instead of natural sand (NS) in cement mortar lowers their technological properties and strength [23,24]. However, adjusting the shape and form of RS can also considerably boost the functionality and properties of both mortar and concrete [25]. Recycled concrete is mainly crushed by a jaw crusher and then an industrial hammer mill to produce RS. Hence, a precise and effective method to track RS morphology during the crushing process is essential for the efficient optimization of RS quality [22,26].
Due to the current guidelines of the European Union [27], it is necessary to analyze the double significance of the impact. In the case of sand from recycling, apart from the undeniable influence on the mortar parameters, there is also an impact on the environmental carbon footprint and use of natural resources, as well as economic and social aspects. In this context, when analyzing the impact of substituting natural sand with recycled sand, it is reasonable to use a multicriteria analysis [28,29].
The aim of this study was to investigate the multicriteria sustainability of producing mortar modified with sand from recycled concrete rubble. The scope of the research included the following aspects:
- The effect of recycled sand content on the properties of mortar such as consistency, flexural and compressive strengths, and durability.
- The evaluation of the environmental impact of using recycled sand in terms of carbon footprint, waste management index, and natural resource consumption.
- The assessment of the economic feasibility of using recycled sand in terms of production cost, market demand, and social benefits.
- The research aimed to provide a comprehensive and balanced analysis of the advantages and disadvantages of using recycled sand in mortar production and to propose optimal solutions for improving the sustainability of the construction industry.
2. Materials and Methods
The materials analyzed in this study were cement mortars with different proportions of natural sand to recycled sand. They were made of Portland cement CEM I 42.5 (Górażdże, Poland) and natural crushed sand in the fraction 0/2—their grain sizes between 0 and 2 mm (Kwarcmix, Poland)—and sand from the demolition of a residential building with a reinforced concrete structure in the fraction 0/2. The analyzed recycled sand originated from the crushing and subsequent screening of materials derived from the demolition of an approximately 30-year-old reinforced concrete residential structure located in Poland. Due to the origin of the sand from the actual demolition of the building, its composition was not purely concrete and also contained grains of other origins. The composition of coarse recycled aggregate from the same crushing batch as the tested sand was examined according to PN EN 933-11 [30], and the results were as follows: Rc—concrete, concrete products, and mortar accounted for 88.5%; Ru—unbound aggregate, natural stone, and hydraulically bound aggregate accounted for 4.7%; Rb—clay, silicate, and cellular concrete elements accounted for 0.2%, Ra—bituminous materials accounted for 1.9%, X—other, such as metals, wood, plastic, rubber, and gypsum plaster, accounted for 4.5%. Images of the recycled sand were made with an optical microscope and confirmed that the compositions of the grain types in terms of origin were similar to the coarse aggregate (Figure 1 and Figure 2). The grain size distribution of both sands used is shown in Figure 3. The designed mortars had a constant cement dosage. The water dosage changed with the level of substitution of natural sand with recycled sand (Table 1). This was related to the procedure of preliminary preparation of recycled sand for use in mortar mixtures. The recycled sand was soaked for 24 h in water and then surface dried and applied to the mixer. As a result, water was already contained in the sand grains. However, not all the water in the aggregate grains (the value resulting from the absorption test) was released into the mixture during mixing. In preliminary tests, it was determined that only 30% of the water contained in the sand grains could be classified as effective water. The final water content was determined empirically during mixing until the same consistency was obtained for all mixtures, which is a practice used on the construction site, where, in most cases, mortars are produced.
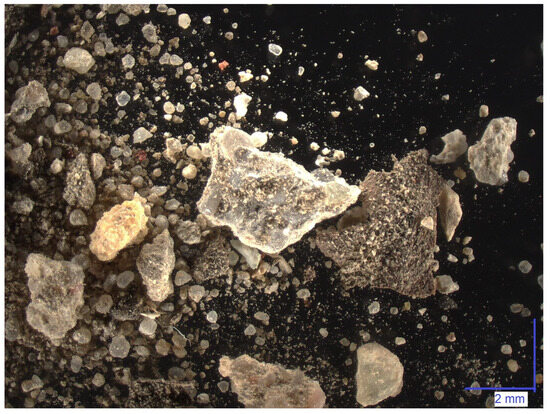
Figure 1.
Optical microscopic image of tested recycled sand.
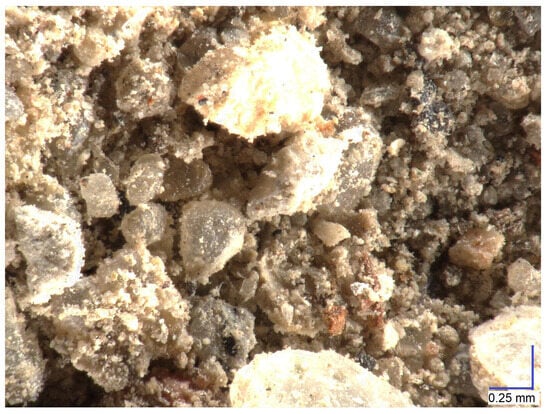
Figure 2.
Optical microscopic image of tested recycled sand—dust fraction.
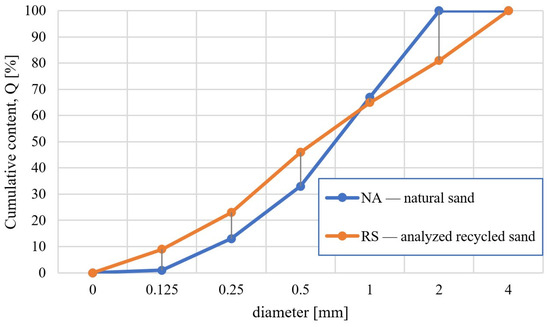
Figure 3.
Grain size distribution of examined sands.

Table 1.
Mortar compositions for 1 m3 of mortar mixture.
The mixture’s consistency was measured according to the method for testing the plasticity of building mortars (based on the European Standard EN 1015-3 standard [31]), right after mixing the components. A truncated cone (with dimensions: bottom diameter 100 mm, top diameter 70 mm, height 60 mm) was formed on the flow table. The fresh composite in this shape was exposed to 15 generative shakes by lifting and dropping the measuring table to a height of 10 mm at a frequency of 1 per second. The diameter of the resulting flow was then recorded. The flexural strength of the composite was tested by preparing 3 rectangular specimens with dimensions of 40 mm by 40 mm by 160 mm for each composition. The specimens were tested according to EN 196-1 standard [32]. The three-point loading method was applied. The compressive strength of the composite was tested by preparing 6 specimens for each composition. The specimens were tested according to the European Standard EN 196-1. The compressive area was 1600 mm2.
The carbon footprint of the produced mortars was determined by taking into account the scope of analysis, covering aspects of the life cycle modules according to the European Standard EN 15804 [33] from A1 to A4 (A1—raw material supply; A2—transport; A3—manufacturing; A4—transport). The carbon footprint of the used mixtures assumed that the distance from the natural sand resources was 400 km, the distance from the cement producer was 200 km, and the distance from the place of obtaining recycled sand was 20 km. The small, adopted distance for obtaining recycled sand is related to the fact that both demolition and construction works are usually carried out in urban areas, i.e., at a short distance from each other.
It is worth noting that, if we assume that the carbon dioxide emissions assumed in Table 2 for the production of natural sand and recycled sand are the same, the difference in distance between the mine and the construction site from which the recycled aggregate is obtained is more than 30 km, and the increased carbon footprint generated by the recycled aggregate is offset by the carbon footprint generated during transport. The calculations also assumed that the water consumption in the case of recycled aggregate will be doubled due to its preliminary preparation process. In order to calculate the cost of the mortar, the current market prices for the purchase of materials were adopted. The cost of cement with delivery amounted to 144 euros per ton, the cost of purchasing sand was 10 euros per ton, and the cost of their transport, including the cost of fuel, depreciation, freight charges, and margin, amounted to 2.8 euros per km of travel with a vehicle with a load capacity of 20 tons; the purchase of tap water was valued at a price of 1.0 euro per cubic meter, and it was assumed that obtaining recycled aggregate did not generate costs other than transport costs.
Table 2.
Carbon footprint calculation methodology.
The concept of generalized utility function, developed by Harrington [39], enabled the determination of a generalized multi-criteria model of concrete modified with waste mineral dust. The values of individual properties, expressed by the obtained regression equations, were expressed on a dimensionless scale. They were assigned distributions in the form of lower, intermediate, and upper values, and appropriate utility values were assigned to them. In the case of properties for which the maximum criterion applied, a utility value of 1.0 was assigned to the upper values, and a utility value of 1.0 was assigned to the lower values of a given feature in the case of values for which the minimum criterion applied. Function (1) was used to calculate the generalized utility function.
where —weight of the feature, —value of the feature, —lower limit of the satisfactory range of the feature, worse value, —upper limit of the satisfactory range of the feature, better value, and 0 ≤ ≤ 1; i = 1, 2, …., m; .
3. Results
The mortar mixtures were prepared according to the algorithm presented in point 3 of the research scheme (Figure 4). The consistency of the mortar was obtained within the range of (180 ± 10) mm. From the prepared mortar, beam samples were made and then cured for 24 h under cover and then in water. After 2, 28, and 90 days, bending and compression tests were performed. The results are summarized in Table 3. It should be noted that, with the increase in the content of recycled sand, there was no significant increase in the heterogeneity of the results indicating the heterogeneity of the samples—there was no correlation between the standard deviations of the results and the share of recycled sand.
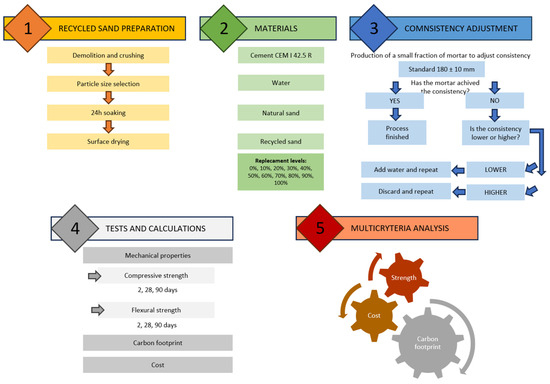
Figure 4.
Experimental procedures summarized scheme.
Table 3.
Results of compressive and flexural strength.
As the level of replacement of natural sand with recycled sand increased, the flexural strength decreased. However, it is worth noting that, over time, these differences were smaller, and they were practically within the limits of standard deviations of the results after 90 days (Figure 5).
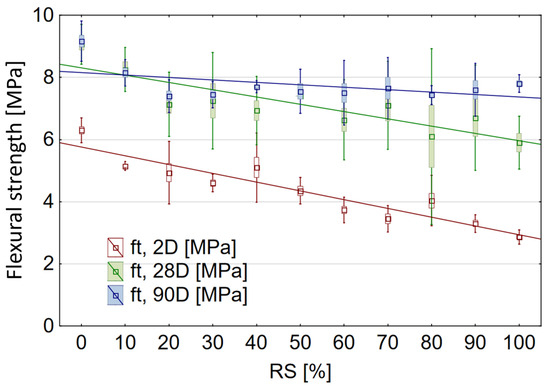
Figure 5.
Flexural strength of tested composites after 2, 28, and 90 days: box—standard error, whiskers—standard deviation.
As the level of replacement of natural sand with recycled sand increased, the compressive strength decreased, but, similarly to the flexural strength, these differences disappeared with the extension of the curing time. After 90 days, the only statistically significant difference was the qualitative change—adding even 10% of recycled sand. However, the quantitative change in the range of dosing up to 80% replacement did not significantly affect the 90-day compressive strength (Figure 6).
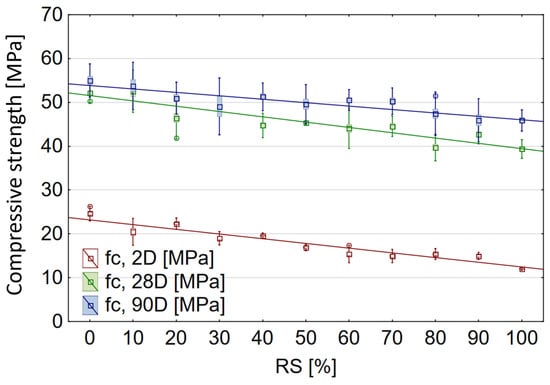
Figure 6.
Compressive strength of tested composites after 2, 28 and 90 days: box—standard error, whiskers—standard deviation, dot—outliers.
The carbon footprint for all mixtures was calculated, covering the range A1–A4, the price and the amount of natural resources in the form of sand saved for one cubic meter of mortar, Table 4. Although cement had the largest share in the carbon footprint and the price, taking into account aspect A4, i.e., the transport of materials, aspects also related to the applied fine aggregate became important.
Table 4.
Results of calculations—real values.
The obtained values of compressive strength, carbon footprint, price, and natural resource savings were converted to relative values (Table 5). With the increase in the share of recycled sand, the carbon footprint, price, and compressive strength decrease, whereas the natural resource savings increase. It should be noted that, while the decrease in compressive strength is an undesirable feature, the change in the remaining parameters is beneficial from the point of view of the sustainability of the composite (Figure 7).
Table 5.
Results of calculations—relative values.
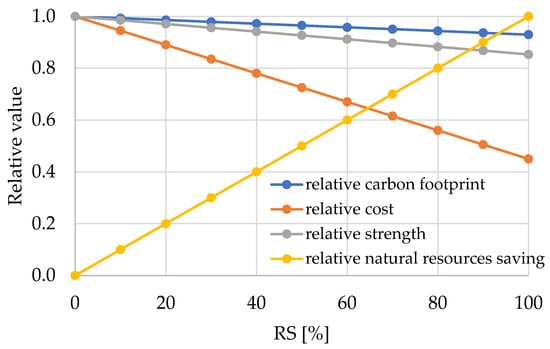
Figure 7.
Relative values of the composites.
The generalized utility function indicates that, with the adopted boundary values and weights of features (Table 6), the best dosages of recycled sand are in the range from 40% to 60%. This allows for achieving satisfactory compressive strength after 90 days and, at the same time, it reduces the cost and carbon footprint of the composite and saves significant amounts of natural resources (Figure 8).
Table 6.
Utility function parameters.
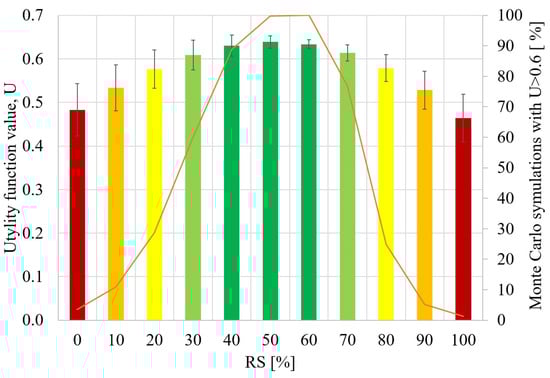
Figure 8.
Utility function of tested composites.
In the conducted multicriteria analysis, weights were assigned to different criteria to reflect their relative importance in the decision-making process. One of the fundamental parameters in this analysis was compressive strength, for which a weight of 0.5 was assigned as dominant. This choice was made due to its crucial role as a primary technical parameter for construction mortars. The proportions between the remaining weights were determined in accordance with the criteria outlined in various environmental building certifications such as LEVELS, BREEAM, and LEED. These certifications provide guidelines for sustainable construction practices, and their criteria were considered relevant in establishing the relative importance of different aspects. To assess the sensitivity of the adopted weights, a Monte Carlo method was employed. The normal distribution of weights was assumed, with a standard deviation set to 30% of the adopted weight. Through 1000 Monte Carlo simulations, the analysis aimed to evaluate the robustness of the weighting scheme. Furthermore, the criterion for the generalized utility function U, set at 0.6, was used as a benchmark. It was found that the criterion was met in over 90% of cases when substituting natural sand with recycled sand ranged between 40% and 60%. This result indicates the effectiveness of the weighting scheme in capturing the desired outcomes within the decision-making framework.
4. Discussion
The effect of replacing natural sand with recycled sand on the flexural strength of mortar is negative. This means that the higher the proportion of recycled sand, the lower the flexural strength. However, it should be noted that, over time, these differences decrease, and they are practically within the limits of standard deviations of the results after 90 days; the same is true for compressive strength. Increasing the proportion of recycled sand causes a decrease in compressive strength. The compressive strength of mortars modified decreases with an increasing proportion of recycled sand. Specifically, when replacing 50% of natural sand with recycled sand, the strength decreases by approximately 10%, and the reduction is around 20% with 100% replacement. Similarly to the flexural strength, these differences disappear with the extension of the curing time. It is crucial to emphasize that the 90-day flexural strength of mortars with recycled aggregate is comparable to that of unmodified mortars. Notably, a noticeable difference in flexural strength only occurs with a qualitative change (10% substitution of natural sand with recycled sand). Increasing the proportion of recycled sand beyond this threshold does not significantly impact the flexural strength of mortars after 90 days of curing. Simultaneously, the carbon footprint, calculated in the A1 to A2 areas, decreases. When substituting 50% of natural sand with recycled sand, the carbon footprint drops by 19 kg per cubic meter of the mixture, and, with 100% replacement, it reduces by 38 kg per cubic meter. Considering transportation costs, it is noteworthy that the mixture with 100% recycled sand may be up to twice as cost-effective. This is attributed to the proximity of recycled sand sources to the utilization sites. The obtained results are consistent with the results from the literature, which confirms the possibility of using recycled sand in mortar production. However, the article attempts to extend the analysis to additional features that cannot be ignored in a holistic analysis of sustainable building materials. In particular, the extension of the analysis to the carbon footprint analysis of aspect A4 related to the transport of materials proved to be significant in the case of fine aggregates. It will also become increasingly important due to the limited resources of sand that can be used as a component of mortars and cement concretes in Europe. Therefore, it is important to take into account the distance between the place of obtaining sand and the place of its application, as well as the type and amount of fuel consumed. Only then can a correct assessment be made of the impact of recycled sand on the environment and the economy.
5. Conclusions
The article presents a multi-criteria analysis of the environmental, economic, and technical aspects of using recycled sand from construction and demolition waste as a fine aggregate for mortar production. The analysis shows that the use of recycled sand can reduce the carbon footprint, cost, and natural resource consumption of the mortar, while maintaining acceptable compressive strength. The article suggests that the process should be analyzed in the widest possible range of the life cycle of the building object. However, even the analysis in aspects from A1 to A4, i.e., the production of mortar components plus transport, indicates a significant impact of the distance of raw material extraction on the total carbon footprint of the mortar. The main conclusions of the article are:
- The use of recycled sand from concrete rubble in mortar production has a positive impact on the sustainability of the construction industry, as it reduces the carbon footprint, the waste management index, and the natural resource consumption of the material.
- The optimal replacement level of natural sand with recycled sand is between 40% and 60%, as it provides satisfactory flexural and compressive strengths, as well as minimizing the cost and the environmental impact of the mortar.
- The curing time is an important factor that affects the properties of mortar with recycled sand, as the differences in strength between natural and recycled sand decrease over time.
- The transport of materials is a significant aspect of the life cycle analysis of mortar with recycled sand, especially in the case of fine aggregates, which have limited availability in Europe.
Author Contributions
Conceptualization. M.K. and P.Ł.; methodology. M.K..; validation. M.K. and P.Ł.; formal analysis. M.K.; investigation. M.K.; resources. P.Ł.; data curation. P.Ł.; writing—original draft preparation. M.K.; writing—review and editing. P.Ł.; visualization. M.K.; supervision. P.Ł. All authors have read and agreed to the published version of the manuscript.
Funding
This research received no external funding.
Institutional Review Board Statement
Not applicable.
Informed Consent Statement
Not applicable.
Data Availability Statement
No new data were created or analyzed in this study. Data sharing is not applicable to this article.
Conflicts of Interest
The authors declare no conflicts of interest.
References
- Feng, J.; Hou, H. Review of Research on Urban Social Space and Sustainable Development. Sustainability 2023, 15, 16130. [Google Scholar] [CrossRef]
- Pozzoli, M.; Nastari, R.; Pisano, S.; Venuti, M. How Circular Economy Disclosure Responds to Institutional Determinants Empirical Evidences in Non-Financial European Firms. Sustainability 2023, 15, 16069. [Google Scholar] [CrossRef]
- Korhonen, J.; Honkasalo, A.; Seppälä, J. Circular Economy: The Concept and its Limitations. Ecol. Econ. 2018, 143, 37–46. [Google Scholar] [CrossRef]
- Liao, L.; Ma, E.; Long, H.; Peng, X. Land Use Transition and Its Ecosystem Resilience Response in China during 1990–2020. Land 2023, 12, 141. [Google Scholar] [CrossRef]
- Zdeb, M.; Papciak, D. Disinfection of Rainwater for Economic Purposes. Sustainability 2023, 15, 16121. [Google Scholar] [CrossRef]
- Statista.com. Available online: https://www.statista.com/ (accessed on 26 November 2023).
- Abed, M.; Rashid, K.; Ul Rehman, M.; Ju, M. Performance keys on self-compacting concrete using recycled aggregate with fly ash by multi-criteria analysis. J. Clean. Prod. 2022, 378, 134398. [Google Scholar] [CrossRef]
- Bahrami, N.; Zohrabi, M.; Mahmoudy, S.A.; Akbari, M. Optimum recycled concrete aggregate and micro-silica content in self-compacting concrete: Rheological. mechanical and microstructural properties. J. Build. Eng. 2020, 31, 101361. [Google Scholar] [CrossRef]
- Behera, M.; Bhattacharyya, S.K.; Minocha, A.K.; Deoliya, R.; Maiti, S. Recycled aggregate from C&D waste & its use in concrete—A breakthrough towards sustainability in construction sector: A review. Constr. Build. Mater. 2014, 68, 501–516. [Google Scholar] [CrossRef]
- Ul Rehman, M.; Rashid, K.; Zafar, I.; Alqahtani, F.K.; Iqbal Khan, M. Formulation and characterization of geopolymer and conventional lightweight green concrete by incorporating synthetic lightweight aggregate. J. Build. Eng. 2020, 31, 101363. [Google Scholar] [CrossRef]
- Wang, B.; Yan, L.; Fu, Q.; Kasal, B. A Comprehensive Review on Recycled Aggregate and Recycled Aggregate Concrete. Resour. Conserv. Recycl. 2021, 171, 105565. [Google Scholar] [CrossRef]
- Verian, K.P.; Ashraf, W.; Cao, Y. Properties of recycled concrete aggregate and their influence in new concrete production. Resour. Conserv. Recycl. 2018, 133, 30–49. [Google Scholar] [CrossRef]
- Hossain, M.U.; Poon, C.S.; Lo, I.; Cheng, J. Comparative environmental evaluation of aggregate production from recycled waste materials and virgin sources by LCA. Resour. Conserv. Recycl. 2016, 109, 67–77. [Google Scholar] [CrossRef]
- Da, S.; Le Billon, P. Sand mining: Stopping the grind of unregulated supply chains. Extr. Ind. Soc. 2022, 10, 101070. [Google Scholar] [CrossRef]
- Kępniak, M.; Woyciechowski, P. Influence of sand substitution with waste lime powder on the concrete carbonation. Arch. Civ. Eng. 2021, 67, 383–392. [Google Scholar] [CrossRef]
- Kępniak, M.; Woyciechowski, P.; Franus, W. Transition Zone Enhancement with Waste Limestone Powder as a Reason for Concrete Compressive Strength Increase. Materials 2021, 14, 7254. [Google Scholar] [CrossRef] [PubMed]
- Chyliński, F.; Bobrowicz, J.; Łukowski, P. Undissolved Ilmenite Mud from TiO2 Production—Waste or a Valuable Addition to Portland Cement Composites? Materials 2020, 13, 3555. [Google Scholar] [CrossRef]
- Reshma, T.V.; Patnaikuni, C.K.; Tanu, H.M.; Bharath, A. Evaluation of strength, durability, and microstructure characteristics of slag-sand-induced concrete. Clean. Mater. 2023, 10, 100212. [Google Scholar] [CrossRef]
- Jiang, X.; Zhang, Y.; Zhang, Y.; Ma, J.; Xiao, R.; Guo, F.; Bai, Y.; Huang, B. Influence of size effect on the properties of slag and waste glass-based geopolymer paste. J. Clean. Prod. 2023, 383, 135428. [Google Scholar] [CrossRef]
- Dinh, H.L.; Liu, J.; Ong, D.; Doh, J.H. A sustainable solution to excessive river sand mining by utilizing by-products in concrete manufacturing: A state-of-the-art review. Clean. Mater. 2022, 6, 100140. [Google Scholar] [CrossRef]
- Zhao, D.; Hong, L.; Yu, Z.; Guo, B.; Gao, P.; Chen, L.; Zhan, B.; Yu, Q. Quick extraction of recycled sand morphology parameters based on deep learning and their effect on mortar property. Case Stud. Constr. Mater. 2023, 19, e02644. [Google Scholar] [CrossRef]
- Jiang, X.; Xiao, R.; Bai, Y.; Huang, B.; Ma, Y. Influence of waste glass powder as a supplementary cementitious material (SCM) on physical and mechanical properties of cement paste under high temperatures. J. Clean. Prod. 2022, 340, 130778. [Google Scholar] [CrossRef]
- Li, L.; Zhan, B.J.; Lu, J.; Poon, C.S. Systematic evaluation of the effect of replacing river sand by different particle size ranges of fine recycled concrete aggregates (FRCA) in cement mortars. Constr. Build. Mater. 2019, 209, 147–155. [Google Scholar] [CrossRef]
- Singh, R.; Nayak, D.; Pandey, A.; Kumar, R.; Kumar, V. Effects of recycled fine aggregates on properties of concrete containing natural or recycled coarse aggregates: A comparative study. J. Build. Eng. 2022, 45, 103442. [Google Scholar] [CrossRef]
- Estephane, P.; Garboczi, E.J.; Bullard, J.W.; Wallevik, O.H. Three-dimensional shape characterization of fine sands and the influence of particle shape on the packing and workability of mortars. Cem. Concr. Compos. 2019, 97, 125–142. [Google Scholar] [CrossRef]
- Feng, Y.; Zhang, B.; Xie, J.; Xue, Z.; Huang, K.; Tan, J. Effects of recycled sand and nanomaterials on ultra-high performance concrete: Workability. compressive strength and microstructure. Constr. Build. Mater. 2023, 378, 131180. [Google Scholar] [CrossRef]
- Regulation (EU) 2020/852 of the European Parliament and of the Council of 18 June 2020 on the Establishment of a Framework to Facilitate Sustainable Investment. and Amending Regulation (EU) 2019/2088 (Text with EEA Relevance) PE/20/2020/INIT. Available online: http://data.europa.eu/eli/reg/2020/852/oj (accessed on 1 January 2024).
- Czarnecki, L.; Sokołowska, J.J. Material model and revealing the truth. Bull. Pol. Acad. Sci. Tech. 2015, 63, 7–14. [Google Scholar] [CrossRef][Green Version]
- Garbacz, A.; Sokołowska, J.J. Concrete-like polymer composites with fly ashes—Comparative study. Constr. Build. Mater. 2013, 38, 689–699. [Google Scholar] [CrossRef]
- EN 933-11; Tests for Geometrical Properties of Aggregates—Part 11: Classification Test for the Constituents of Coarse Recycled Aggregate. European Committee for Standardization (CEN): Brussels, Belgium, 2005.
- EN 1015-3:1999; Methods of Test for Mortar for Masonry—Part 3: Determination of Consistence of Fresh Mortar (by Flow Table). European Committee for Standardization (CEN): Brussels, Belgium, 1999.
- EN 196-1; Methods of Testing Cement—Part 1: Determination of Strength. European Committee for Standardization (CEN): Brussels, Belgium, 2016.
- EN 15804; Environmental Product Declaration. European Committee for Standardization (CEN): Brussels, Belgium, 2012.
- Environmental Declaration Type III—EPD Cements CEM I. CEM II. CEM III. CEM IV. CEM V Manufactured in Poland. Available online: https://www.polskicement.pl/ (accessed on 26 November 2023).
- Ehsani, M.; Ahmadi, A.; Fadai, D. Modeling of vehicle fuel consumption and carbon dioxide emission in road transport. Renew. Sustain. Energy Rev. 2016, 53, 1638–1648. [Google Scholar] [CrossRef]
- Jakhrani, A.Q.; Rigit, A.R.H.; Othman, A.-K.; Samo, S.R.; Kamboh, S.A. Estimation of carbon footprints from diesel generator emissions. In Proceedings of the 2012 International Conference on Green and Ubiquitous Technology, Bandung, Indonesia, 7–8 July 2012; pp. 78–81. [Google Scholar] [CrossRef]
- Botto, S. Tap Water vs. Bottled Water in a Footprint Integrated Approach. Nat. Preced. 2009, 1, 1–18. [Google Scholar] [CrossRef]
- Zhu, X.; Zhang, Y.; Liu, Z.; Qiao, H.; Ye, F.; Lei, Z. Research on carbon emission reduction of manufactured sand concrete based on compressive strength. Constr. Build. Mater. 2023, 403, 133101. [Google Scholar] [CrossRef]
- Harrington, E.C. The desirability function. Ind. Qual. Control 1965, 10, 494–498. [Google Scholar]
Disclaimer/Publisher’s Note: The statements, opinions and data contained in all publications are solely those of the individual author(s) and contributor(s) and not of MDPI and/or the editor(s). MDPI and/or the editor(s) disclaim responsibility for any injury to people or property resulting from any ideas, methods, instructions or products referred to in the content. |
© 2024 by the authors. Licensee MDPI, Basel, Switzerland. This article is an open access article distributed under the terms and conditions of the Creative Commons Attribution (CC BY) license (https://creativecommons.org/licenses/by/4.0/).