Article

The Use of Chlorella species to Remove Nutrients from Dairy Wastewater to Produce Livestock Feed

1
Department of Bioproducts and Biosystems Engineering, University of Minnesota, St. Paul, MN 55108, USA
2
Department of Animal Science, University of Minnesota, St. Paul, MN 55108, USA
*
Author to whom correspondence should be addressed.
Sustainability 2024, 16(4), 1382; https://doi.org/10.3390/su16041382
Submission received: 6 November 2023 / Revised: 1 February 2024 / Accepted: 1 February 2024 / Published: 6 February 2024

Abstract

:
The goal of the study was to utilize Chlorella sp. to recycle nutrients from a dairy wastewater lagoon producing microalgae biomass for dairy cattle. Chlorella sp. was cultured in mixotrophic conditions with various ratios of raw dairy wastewater with a lab-scale (1.25 L) environment and a pilot-scale (70 L) environment. The influence of extra CO2, pH, temperature, solar radiation, and photosynthetic active radiation were tested for cell growth, biomass productivity and nutrient (ammonium, nitrate, and phosphate) removal from wastewater. The objective of this study was to determine the alternative ratios (control, 1:10, 1:20, 1:30, or 1:40) of dairy wastewater, where Chlorella sp. biomass could be produced to remove nutrients. Additionally, the study evaluated the addition of CO2 into the cultivation system to increase biomass yield. During the first experiment, the lab-scale and pilot-scale experiments showed similar biomass growth after seven days of growth. The control had the highest biomass, followed by 1:10. For the pilot-scale experiment, the treatments (control, controlN, 1:10, 1:10 N, 1:30, and 1:30 N) were different from each other for nutrient removal rates and biomass production. The bioreactors designed for this study may be used on farms to recycle dairy wastewater and produce enriched biomass for use to feed livestock.

1. Introduction

Microalgae represent an intricate and well-organized cell with multiple complex structures and mechanisms. Numerous research studies have indicated that microalgae are an ancestor of plants and can transform sunlight energy into chemical energy [1]. However, it is a challenge to find the correct classification for microalgae since they are photosynthetic because they are unicellular and cannot be classified as Protists.
The microalgae need at least three key components to grow: sunlight, a carbon source, and a moisturized environment [2]. These microalgae are responsible for about half of the world atmospheric oxygen production and they naturally use carbon dioxide (CO2) from the atmosphere as a carbon source, water (H2O) as a source of electrons, oxygen (that will be released later), and sunlight (when working in a laboratory, lamps replace sunlight) as the catalyst for photosynthesis [3,4]. Furthermore, the presence of chlorophyll in microalgae is a crucial factor, as it enables these organisms to transform substrates like carbon dioxide and water into glucose and oxygen. Chlorophyll, a vital pigment for photosynthesis, facilitates the conversion of light into chemical energy within the cell. For microalgae, the most common type is chlorophyll α, which has a maximum absorption range between 430 nm and 450 nm and between 673 nm and 695 nm [5,6].
Chlorella sp., a microalgae species, has been extensively studied for many years. The macroalgae is known for its versatility, particularly in biological wastewater treatment, as demonstrated in studies This microalgae is capable of producing a high lipid content, which can be converted into biofuels [7,8,9,10,11]. Additionally, its high protein content makes it a viable option for both human and livestock consumption [12,13,14,15].
Microalgae, despite sometimes reducing oxygen levels in certain water bodies, play a crucial role in nutrient capture and fixation [4]. The environmental impact of dairy farming, particularly through dairy wastewater, is a significant concern. This wastewater typically contains milk, fats, cleaning detergents, and various nutrients like nitrates, ammonium, nitrites, phosphate, sulfur, and organic carbon. Due to its nutrient richness, it is often used as a fertilizer on croplands [16,17]. The integration of microalgae’s ability to remove nutrients from dairy wastewater with its biomass growth potential offers both environmental and economic benefits. It could help farmers improve water quality through nutrient recycling and generate a high-protein feed for livestock. However, the feasibility of this approach on farms is challenged by the high costs associated with adding extra CO2 to boost microalgae growth [18,19]. Therefore, a comparative evaluation of biomass production with and without the addition of extra CO2 is necessary, paving the way for the practical implementation of the technology developed in this study.
The utilization of Chlorella sp. for nutrient removal from dairy wastewater and the subsequent production of livestock feed presents a promising avenue for promoting sustainability in the dairy industry [20]. Chlorella has shown remarkable efficiency in the removal of nutrients, particularly nitrogen and phosphorus, from dairy wastewater. This ability is crucial in mitigating the eutrophication and contamination of natural water bodies, ultimately contributing to improved water quality and ecosystem health. Reduced nutrient discharge from dairy farms aids in compliance with environmental regulations and promotes sustainable dairy practices [21]. Chlorella’s nutritional profile is well-suited for livestock feed production [22]. It is rich in protein, essential amino acids, vitamins, and minerals, making it a valuable and sustainable source of nutrition for livestock [23]. Studies have demonstrated that Chlorella-based feed can enhance animal growth, reproductive performance, and overall health. The environmental benefits of using Chlorella for nutrient removal and feed production extend to reduced greenhouse gas emissions and resource conservation [24,25]. Chlorella cultivation requires less land and freshwater [26,27] compared to traditional feed crops, and it captures carbon dioxide during growth. These factors align with sustainable agricultural practices and the reduction in the dairy industry’s ecological footprint. Several real-world examples highlight the success of Chlorella-based dairy wastewater treatment and livestock feed production [28,29,30,31]. By reducing nutrient pollution, providing high-quality nutrition for livestock, and contributing to the circular economy, this approach aligns with the principles of sustainable agriculture and resource conservation [32].
The utilization of Chlorella species in the context of dairy wastewater treatment and livestock feed production is intricately linked to sustainability, addressing critical challenges in both environmental and agricultural sectors [33]. Utilizing Chlorella’s exceptional ability to extract surplus nutrients from dairy wastewater addresses environmental issues such as nutrient pollution and eutrophication, while simultaneously converting a problematic byproduct into a valuable asset for sustainable agriculture [34,35]. The nutrients reclaimed in the Chlorella biomass provide a rich source for livestock feed, lessening the environmental impact typically associated with standard feed production. This circular strategy not only conserves resources but also diminishes the reliance on synthetic fertilizers. In doing so, it enhances the sustainability of agricultural practices by effectively completing the nutrient cycle. Chlorella’s nutritional composition, rich in protein, essential amino acids, vitamins, and minerals [1,36], offers a sustainable solution to meet the dietary needs of livestock.
Furthermore, use of Chlorella sp. for livestock feed supports the concept of a circular and efficient agricultural economy. By repurposing nutrients from dairy wastewater into livestock feed, it not only minimizes waste but also reduces the need for resources. The integration of Chlorella-based treatment of dairy wastewater with livestock feed production exemplifies a holistic and synergistic approach. This method shows great promise in improving the sustainability of dairy farming and the wider agricultural sector. By adopting this strategy, it paves the way for a more environmentally friendly and economically robust future in agriculture.
Therefore, the objectives of this study were to (1) conduct lab-scale experiments with various ratios of dairy wastewater to recycle the highest amount of nutrient and to maximize Chlorella biomass; (2) conduct pilot-scale experiments (70 L) with various ratios of dairy wastewater to optimize microalgae growth and nutrients removal rates outdoors; (3) measure nutrient removal rates, growth capacity, and biomass yield during lab and pilot-scale experiments; (4) Evaluate the effect of adding CO2 as an extra source of carbon and pH regulator to optimize microalgae growth; and (5) evaluate the biochemical composition of the biomass produced during the pilot-scale experiment aiming to conduct palatable livestock feeding studies.

2. Materials and Methods

2.1. Algae Cultivation

The Chlorella sp. used in this study was isolated from a dairy wastewater lagoon located at the University of Minnesota West Central Research and Outreach Center (WCROC) in Morris, MN, USA (45°35′38.0″ N, 95°52′17.4″ W). The dairy farm at the WCROC milks two hundred and seventy-five cows twice a day. The strain was chosen based on its ability to grow fast, to resist high pH, and to not be harmful to the livestock that would consume the algae. The microalgae were cultivated in BG-11 modified medium AM6 [37]. The AM6 media was composed of 0.25 g/L of NaNO3, 0.05 g/L NH4Cl, 0.075 g/L MgSO4.7H2O, 0.025 g/L CaCl2.2H2O, 0.025 g/L NaCl, 0.01 g/L (NH4)5[Fe(C6H4O7)2], 0.025 g/L K2HPO4, 0.025 g/L Na2CO3, and 1ml/L of a trace elements solution that contained H3BO3, MnCl2.4H2O, ZnCl2, CuCl2, Na2MoO4.2H2O, CoCl2.6H2O, NiCl2.6H2O, V2O5, and KBr.
The medium used during lab-scale and pilot-scale experiments (dairy wastewater, AM6 and deionized water) were not sterilized to see how the microalgae would respond to the toxicity and the interactions with other microorganisms. Four different ratios would have a better response and balance between cell growth, biomass production, and nutrients removal.
To ascertain the ideal proportion of dairy wastewater for optimal microalgae growth and maximum biomass production, along with the most efficient nutrient removal, four varying ratios of dairy wastewater to water were experimented with: 1:10, 1:20, 1:30, and 1:40 (i.e., 1 L of dairy wastewater to 10 L deionized water) out with AM6 medium. In the experiment testing different ratios, an extra supply of CO2 was introduced both as an additional carbon source and for pH control. A second experiment was then conducted to assess the need for this extra CO2, aiming to enhance the feasibility of implementing this system on farms and to reduce costs. This subsequent experiment utilized the 1:10 and 1:30 ratios, along with controls, to compare the outcomes between systems with and without additional CO2 supplementation. The nutrient analysis of Chlorella sp. was carried out by Rock River Laboratory Inc. located in Watertown, WI, USA. The analysis of calf starters adhered to various methods prescribed by AOAC International [38]. Crude protein was determined using method 990.03, ether extract was analyzed using method 920.39, and starch content was measured with method 996.11. For fiber content, Neutral Detergent Fiber (NDF) was assessed using method 2002.04, and Acid Detergent Fiber (ADF) was determined by method 973.18. The ash content was analyzed using method 942.05. Additionally, the mineral composition of the samples was ascertained through wet chemistry and measured using inductively coupled plasma (ICP), following method 2015.01.

2.2. Dairy Wastewater

In this study, the dairy wastewater was sourced from the dairy wastewater lagoon at WCROC. It was initially stored in a funnel-shaped tank, where it was allowed to settle through gravity for a period of three to five days before its first use in either lab-scale or pilot-scale experiments. For experimental purposes, the wastewater was drawn from the top of the tank and utilized in the reactors, diluted to varying degrees with water. Deionized water was used for lab-scale experiments, while well water was employed for the pilot-scale tests.
The composition of the initial dairy wastewater used in the experiments was as follows: it had a biochemical oxygen demand (BOD) of 498 mg/L, a chemical oxygen demand (COD) of 3552 mg/L, ammoniacal nitrogen content of 301 mg/L, and a total carbon concentration of 1630 mg/L. This detailed characterization of the wastewater is critical for understanding its impact on the experimental outcomes and the efficiency of the wastewater treatment process.

2.3. Lab-Scale Bioreactors

The lab-scale bioreactors were composed of two boxes made of glass (height = 0.48 m, length = 0.76 m, width = 0.31 m) opened on top, with an acrylic support for eight glass tubes (diameter = 0.075 m, height = 0.05 m) positioned in parallel to each other. Rubber stoppers were used to keep the system closed. A glass tube (diameter = 3 mm) passing through the rubber stopper was used to inject air into the system and CO2 when needed. Each one of the systems had one blower injecting air at a rate of 0.8 L/min ± 0.1 L/min in each one of the tubes, adjusted by flowmeters. Carbon dioxide was used to control the pH and as a carbon source.
The 100% CO2 was added without being diluted, but it was mixed with air before going into the glass tube and inside the reactor. The pressure of the CO2 was 17 kPa (16 psi) of the cylinder. The lights used during the lab-scale experiment were Philips model F28T5/830 ALTO, warm white, 2900 lumens, and 28 watts, and the light was continuous. The “N” in the concentration of dairy wastewater to water signifies the addition of CO2 into the algae system.
During the lab-scale experiment, the temperature inside the glass tubes varied between 22.8 °C and 29.1 °C. In the pilot-scale experiments, the temperature variation was between 18.2 °C and 40 °C. During the lab-scale experiment, in addition to controlling and monitoring pH, and monitoring the temperature, it was possible to use the Apex Fusion® system to monitor the photosynthetic active radiation (PAR) that the microalgae culture was receiving from the lights. The PAR sensor was positioned in between tubes, to measure the photosynthetic active radiation that the tubes were receiving, and it varied between 331 and 338 µmol/m2/s. Furthermore, the lights were set up to be on every day between 5 a.m. and 9 p.m. to imitate the duration of the sunlight received by the bags during pilot-scale experiment.

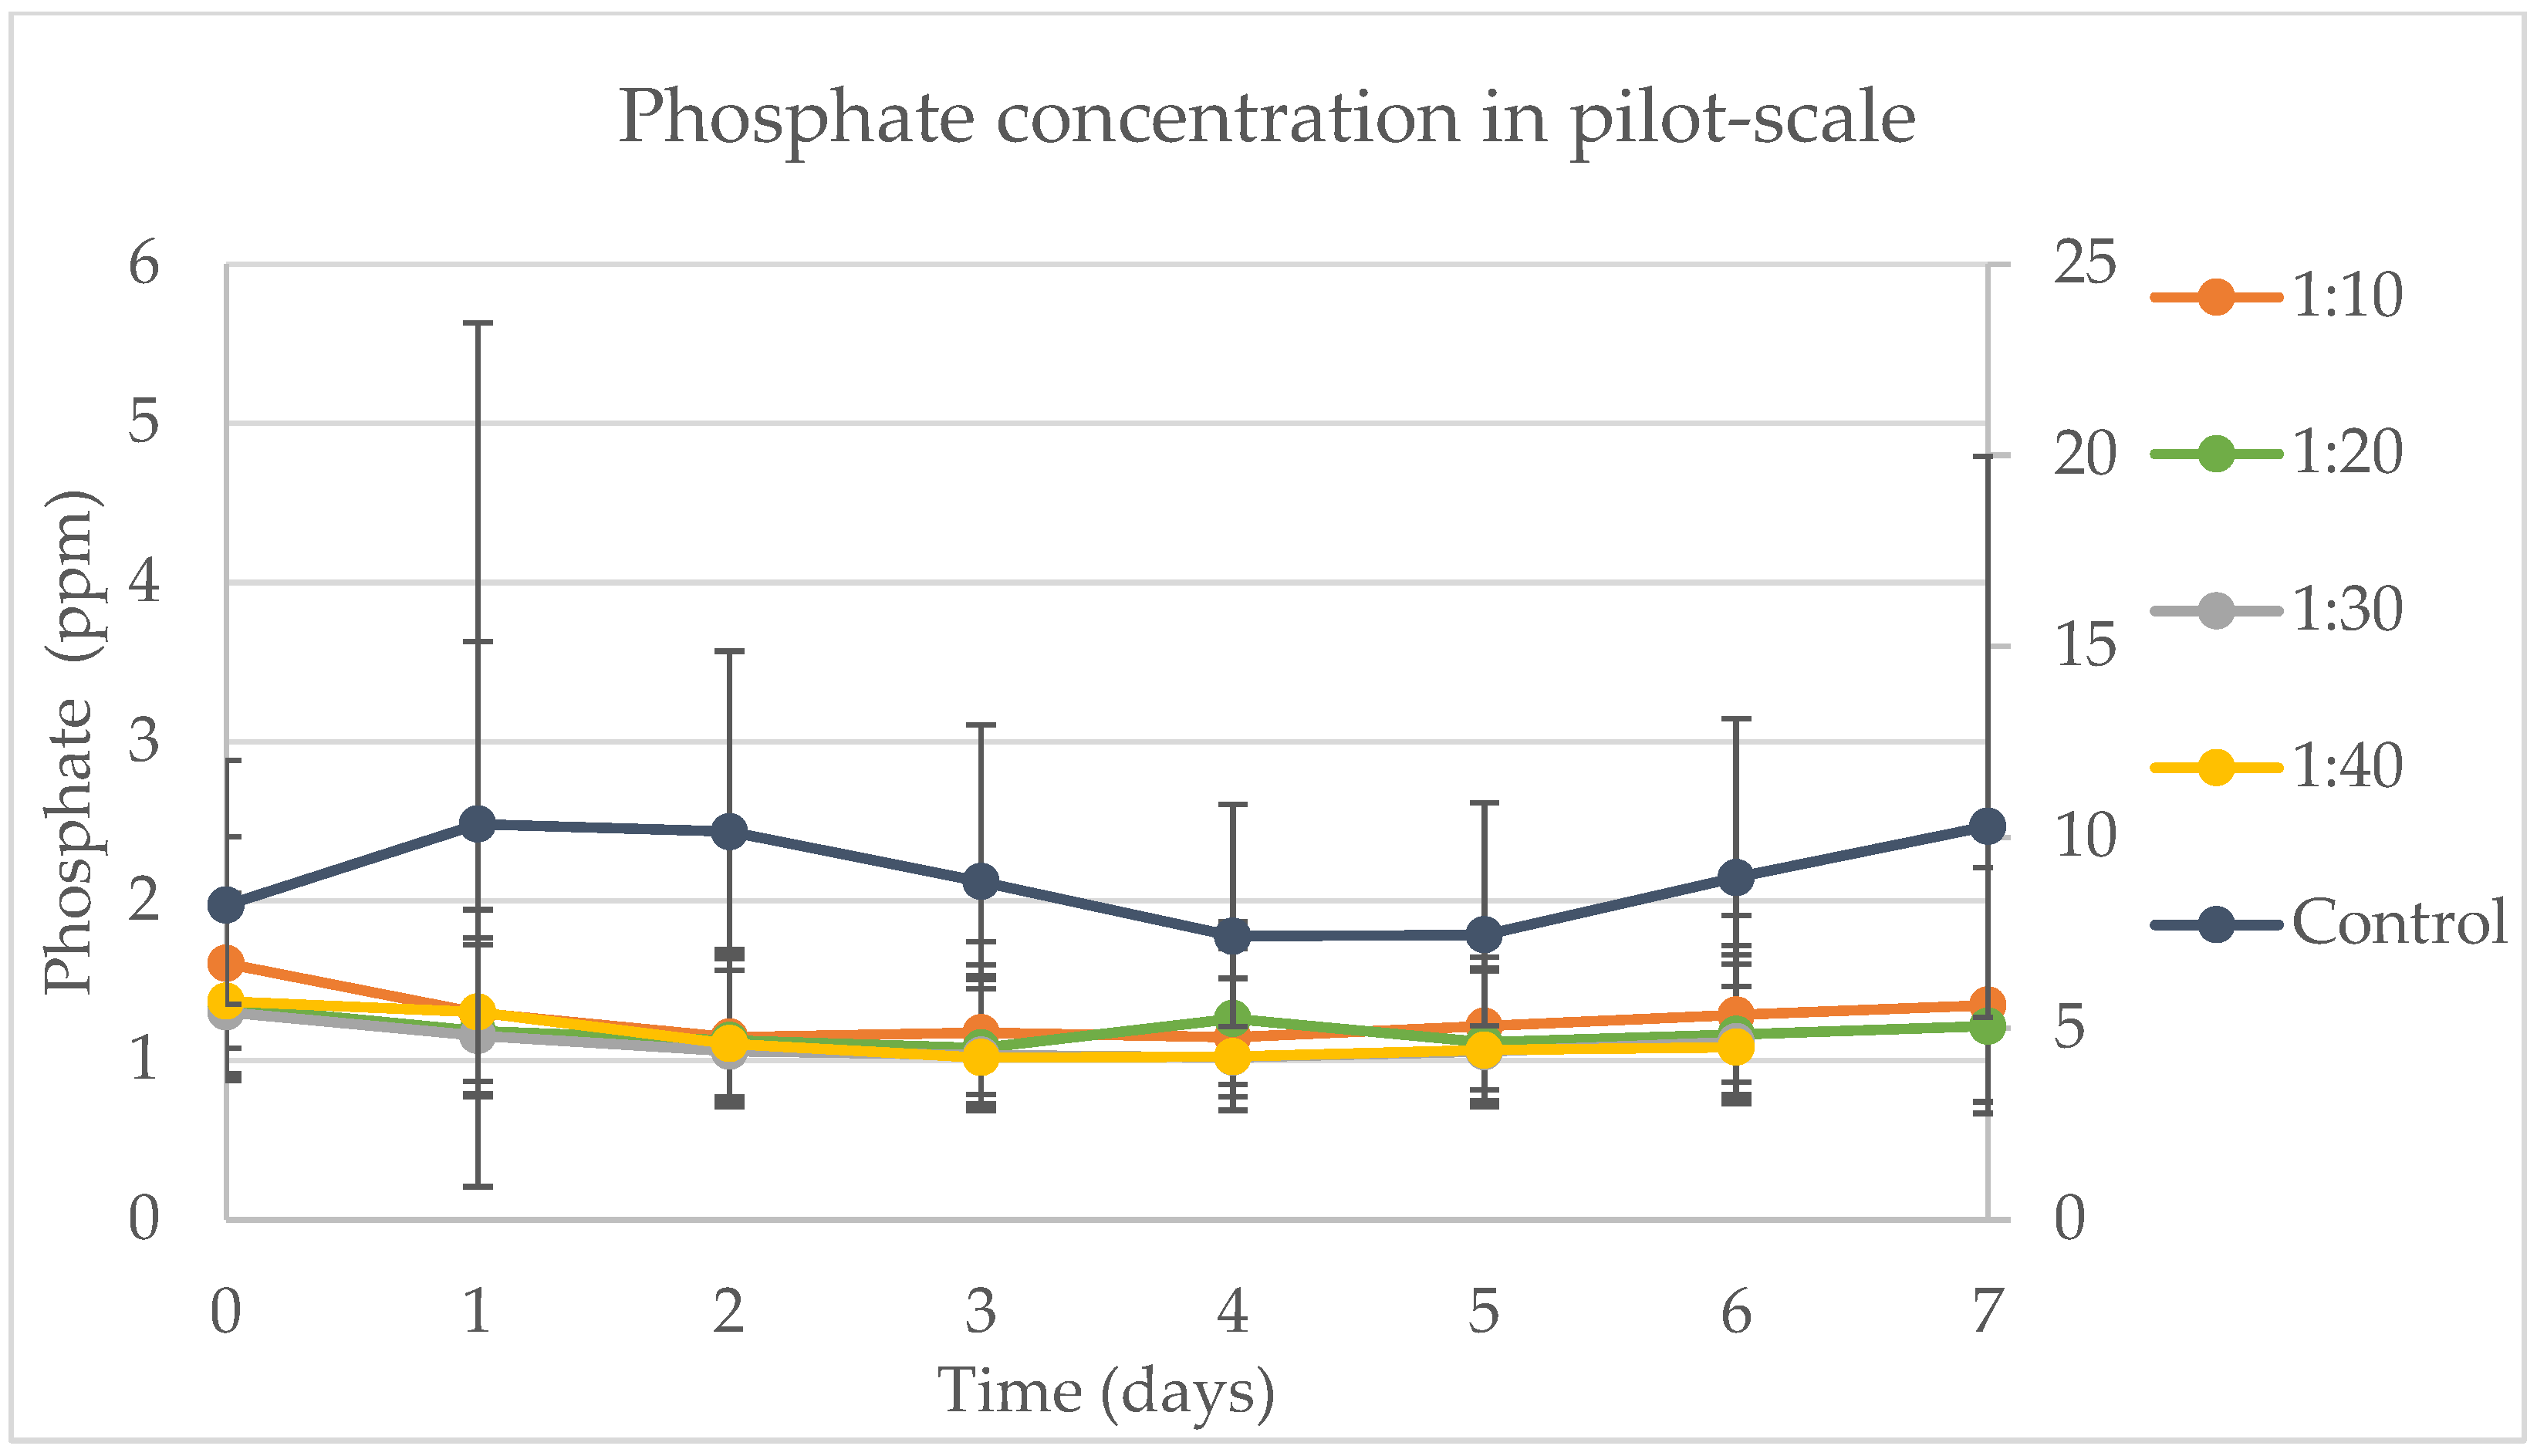
2.4. Pilot-Scale Photobioreactors

The pilot-scale photobioreactors (PBR; Figure 1) were designed to have six bags in one system, where all bags may receive approximately the same amount of solar radiation during the day. The structure was made using treated pinewood (height = 1.73 m, length = 2.06 m and width = 1.22 m). Three parts of flexible metal bars (diameter = 0.05 m, height = 1.34 m), 0.03 m from each other, were installed to support the shape of the hanging bags. The PVC tubes (diameter = 0.015 m, height = 1.33 m, length = 0.52 m) were used to blow oxygen into the bags and carbon dioxide, when needed. At the bottom of each PVC tube, twelve holes (diameter = 0.5 mm) were drilled for the air to flow, aerating and mixing the whole system.
The PBRs were set up outside of the dairy barn at the WCROC in Morris, Minnesota. Each of the pallets featured a box on one side, equipped with a system to monitor and control pH and temperature. A liquid CO2 tank served as the carbon source and was used for pH adjustment when necessary. The setup included two bioreactors, each capable of accommodating six hanging bags with a maximum capacity of 80 L each. However, for all experiments, the volume was maintained at 70 L of total volume of the culture mixture. The airflow was measured using an 8360 VelociCalc® Plus from TSI Incorporated (Shoreview, MN, USA), and it was flowing in a rate of 4.61 ± 0.09 m3/min from the blower into the bag through the larger black hose. The air flow system was composed of a neoprene hose (diameter = 0.48 cm) to add carbon dioxide, and a rubber hose (diameter = 3.5 cm) to insert air from the blower into the bag. To not insert 100% CO2 into the system, ideally, the two fluids mixed while entering together with the PVC tube and then flowed into the algal system.
The Apex Fusion® is an electronic system developed by Neptune Company (Morgan Hill, CA, USA), primarily designed to monitor various parameters in aquariums. In this study, the Apex Fusion® was utilized as part of a system to monitor and control temperature and pH levels. The primary goal of employing this system was to leverage the pH probes from the Apex Fusion® to accurately measure the pH and temperature in each of the bags used in the experiments.
The system’s functionality extended to controlling pH levels by programming the Apex Fusion®. This programming enabled the automatic activation of a solid-state relay, which, in turn, opened a valve on a manifold to release CO2 into each bag when the pH reached a predetermined maximum value of 8.6. The valve would then close once the pH decreased to the minimum threshold of 7.4. It is important to note that the pH values could occasionally drop below 7.4 due to a delay between the pH measurement and the closing of the valve, a factor considered in the experiment’s design and execution. Throughout the pilot-scale experiments, the bioreactors were positioned outside, exposed to ambient temperature changes between July and August 2018. The orientation of the bags was east to west. The average radiation for the day ranged between 40.56 and 303.55 W/m2. To be able to compare lab-scale and pilot-scale experiments, an approximate conversion was used, where, for sunlight conversion, 1 µmol/m2/s was equal to 4.57 W/m2 [39], which means that the solar radiation received by the pilot-scale PBRs varied between 185.34 and 1387.23 µmol/m2/s.

2.5. Cell Count, Biomass, Nitrate, Ammonium, and Phosphate Concentration

The hemocytometer protocol [40], using a Neubauer chamber, was used to determine the cell density (cells/L). The cells density and microscope were used to determine cell density with the equation (cell density = (SC×D)/V), where SC is the average number of cells per small square, D is the dilution factor, and V is the volume of a small square in mL (in this case, V = 0.0001 mL). For biomass estimation, the process involved using a 0.22 µm nitrocellulose membrane. Initially, this membrane was left to dry for at least one hour and then weighed. Following this, a 15 mL sample was filtered through the membrane with the aid of a vacuum pump. Subsequently, the filter with the sample residue was dried at a temperature of 65 °C until a constant weight was achieved. The difference in weight of the membrane before and after the process provided an estimate of the dry weight biomass (g/L) for each treatment on that day.
To ascertain the daily concentrations of nitrate, ammonium, and phosphate (AOAC 990.03, 2001.11, 965.17, [38]) in the samples, a 30 mL portion was filtered using a 0.22µm nitrocellulose membrane (Merck Millipore Ltd., Darmstadt, Germany) in a 500 mL filtration unit attached to a vacuum pump. For nitrate and ammonium concentration measurements, 15 mL of this filtered sample was used. To preserve the sample for analysis, they were refrigerated at 8 °C after adding 0.3 mL of concentrated sulfuric acid. In the case of the phosphate analysis, a separate 15 mL portion of the filtered sample was stored at −4 °C. This meticulous process ensured the accurate measurement of these key nutrients in the biomass.

2.6. Harvesting of Chlorella sp.

The lab-scale experiments were not harvested because of the small amount of biomass produced. For the lab-scale experiment, only the biomass production per day was evaluated by filtering 15 mL of the sample through a 0.22 µm filter paper. However, for the pilot-scale experiment, two different harvesting techniques were used.
For the pilot scale experiment, when harvesting the biomass from the pilot-scale experiments, the blower was turned off after the last sampling. It was anticipated that the microalgae biomass would settle at the bottom of the 70 L bag within three to five hours, accumulating there. However, observations from the control groups revealed that the microalgae remained dispersed throughout the entire water column, with only a minimal amount settling to the bottom. Because of that, the entire bag had to be centrifuged. To make the process more efficient and less time-consuming, a cream milk electric centrifugal separator (version 100-18), designed by Motor Sich JSC, was used. The initial capacity of this product was to separate 100 L in one hour at 75 rpm. In the process, the microalgae were captured within the centrifuge, while the liquid component exited the separation system. Consequently, whenever the water exiting the system began to exhibit a dark green color, indicating a high concentration of microalgae, the separator was switched off. This allowed for the harvesting of the biomass from inside the centrifuge system. After collecting the biomass, it was sterilized under 121 °C and a pressure of 15 psi, for 30 min. The biomass was then kept frozen at −4 °C after drying in an incubator for eight days at 65 °C.
Following the collection of the final sample in each experiment, the blower was deactivated. This action allowed the microalgae biomass within the bags containing dairy wastewater to settle, requiring a minimum of 3 h. In this scenario, a volume of less than five liters, comprising a mixture of water and wastewater infused with Chlorella sp. biomass, was subjected to centrifugation. This process was conducted using a Sorvall Legend XTR Centrifuge from Thermo Scientific, operating at 6500× g for 2 min. The biomass was collected, sterilized under 121 °C and a pressure of 15 psi, for 30 min. The biomass was then kept frozen at −4 °C after drying in an incubator for eight days at 65 °C. The biomass was sterilized because the algae was used in a subsequent study with dairy calves [28].

2.7. Statistical Analysis

The lab-scale sample experiment was conducted over a one-week period and included two replicates. It featured duplicates of five different ratios: control, 1:10, 1:20, 1:30, and 1:40. A similar experiment was carried out on a pilot scale, this time with three replicates, each lasting one week. This pilot-scale experiment also included duplicates of five different ratios, comprising two controls and the ratios 1:10, 1:20, 1:30, and 1:40. In both lab-scale and pilot-scale experiments, data collection spanned from day 0 to day 6 for the 1:30 and 1:40 ratios, and from day 0 to day 7 for the control, 1:10, and 1:20 ratios. Additionally, all the ratios in these experiments received a supplementary addition of CO2. The “N” in the concentration of dairy wastewater to water signifies the addition of CO2 into the algae system. Data from the study were subjected to analysis of variance statistical analysis using a linear mixed model approach in SAS (SAS Institute Inc., Cary, NC, USA). The fixed effects in this model included day, wastewater concentration, and the interaction between day and concentration. Additionally, covariates such as temperature, pH, and solar radiation were incorporated into the model when the F-test indicated statistical significance (p < 0.05). The random effects accounted for in the analysis were replicate, bag, and the interaction between replicate and pallet. The model also featured a repeated effect for day, which was specified using a first-order autoregressive covariance structure. To adjust the p-values, the Tukey procedure was employed. For the specific analysis of data from day 7, which focused on the ratios 1:10, 1:20, and the control, a different model was constructed. However, the analytical technique employed for this model was consistent with the approach used for analyzing data from day 0 through 6.
For the investigation of CO2 addition, lab-scale experiments spanned one week and included two replicates, each featuring duplicates of six different ratios (control, 1:10, 1:30, controlN, 1:10 N, and 1:30 N). Similarly, pilot-scale experiments, also lasting one week, involved duplicates of these six ratios. For both lab-scale and pilot-scale experiments, data collection for the control, controlN, 1:10, and 1:10 N occurred from day 0 to day 6, whereas for the 1:30 and 1:30 N ratios, data were gathered from day 0 to day 4. For days 0 to 4, data analysis was conducted using a mixed model, which included fixed effects of day, wastewater concentration, and the interaction between day and concentration. Covariates such as temperature, pH, and solar radiation were incorporated into the model when the F-test showed statistical significance (p < 0.05). The random effects included replicate, bag, and the interaction between replicate and pallet. The model also specified a repeated effect for day, based on a first-order autoregressive covariance structure. p-values were adjusted using the Tukey procedure.
To analyze data from days 5 and 6 for the control, 1:10, and 1:10 N concentrations, a different model was constructed. However, the same model used for days 0 through 4 was applied to analyze the data from these last two days of the experiment. Data were log transformed for analysis and then back transformed for reporting purposes. All treatment results are reported as least squares means with standard errors, with significance declared at p < 0.05.

3. Results and Discussion

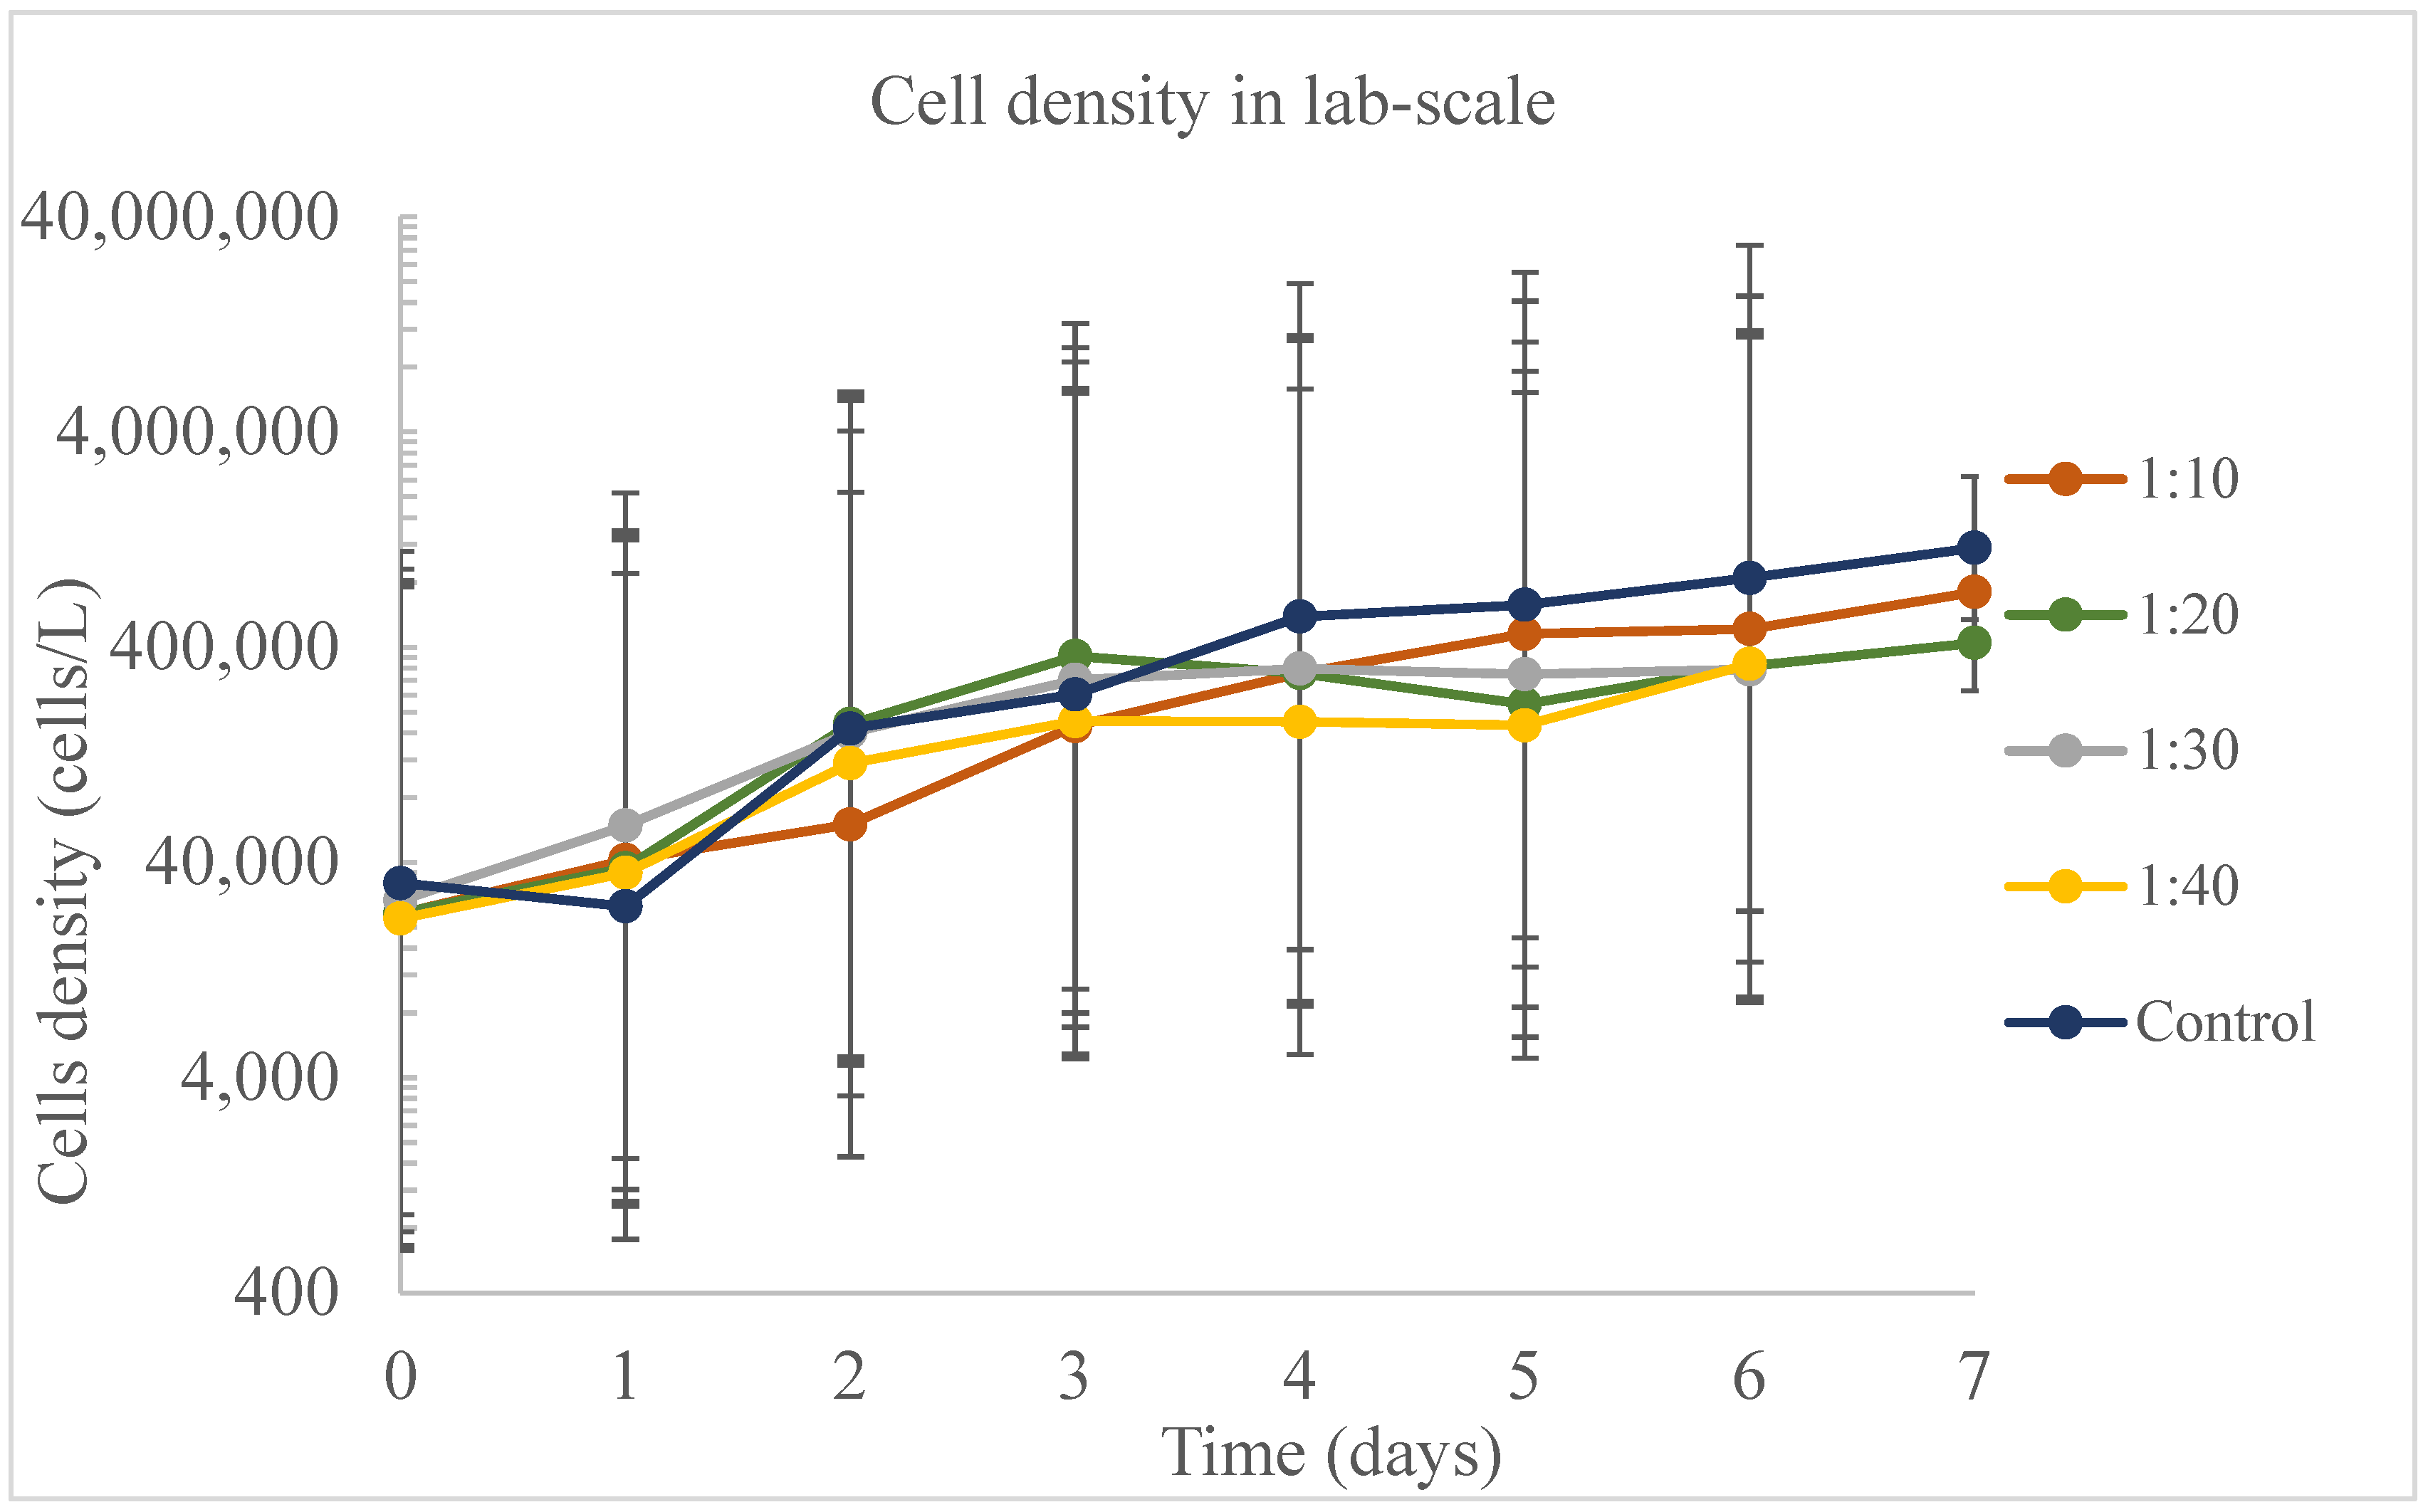
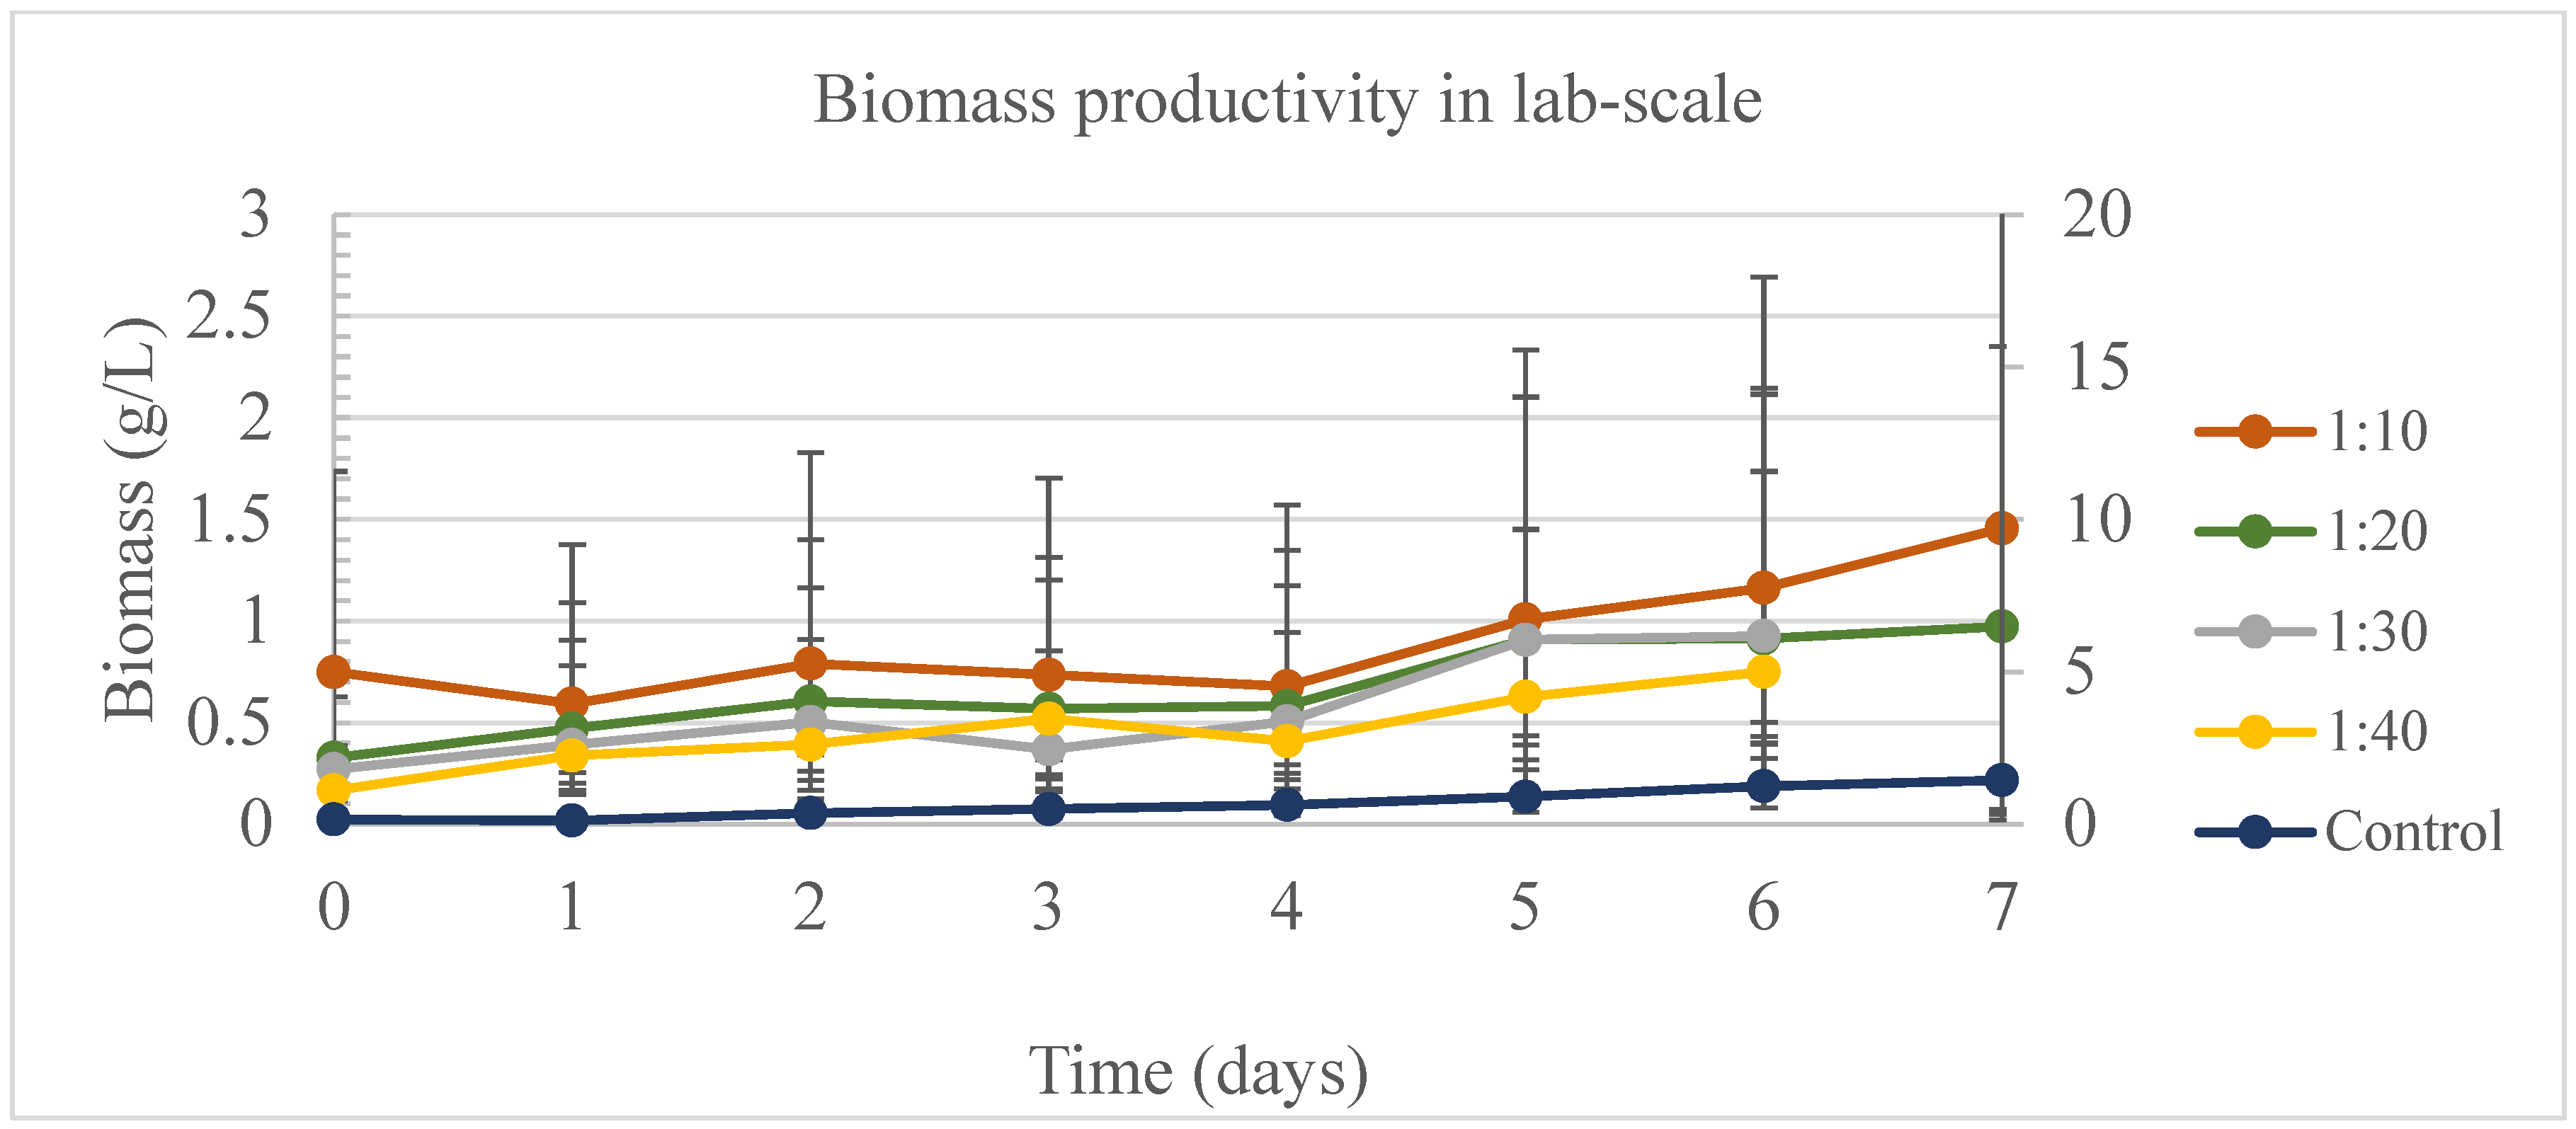
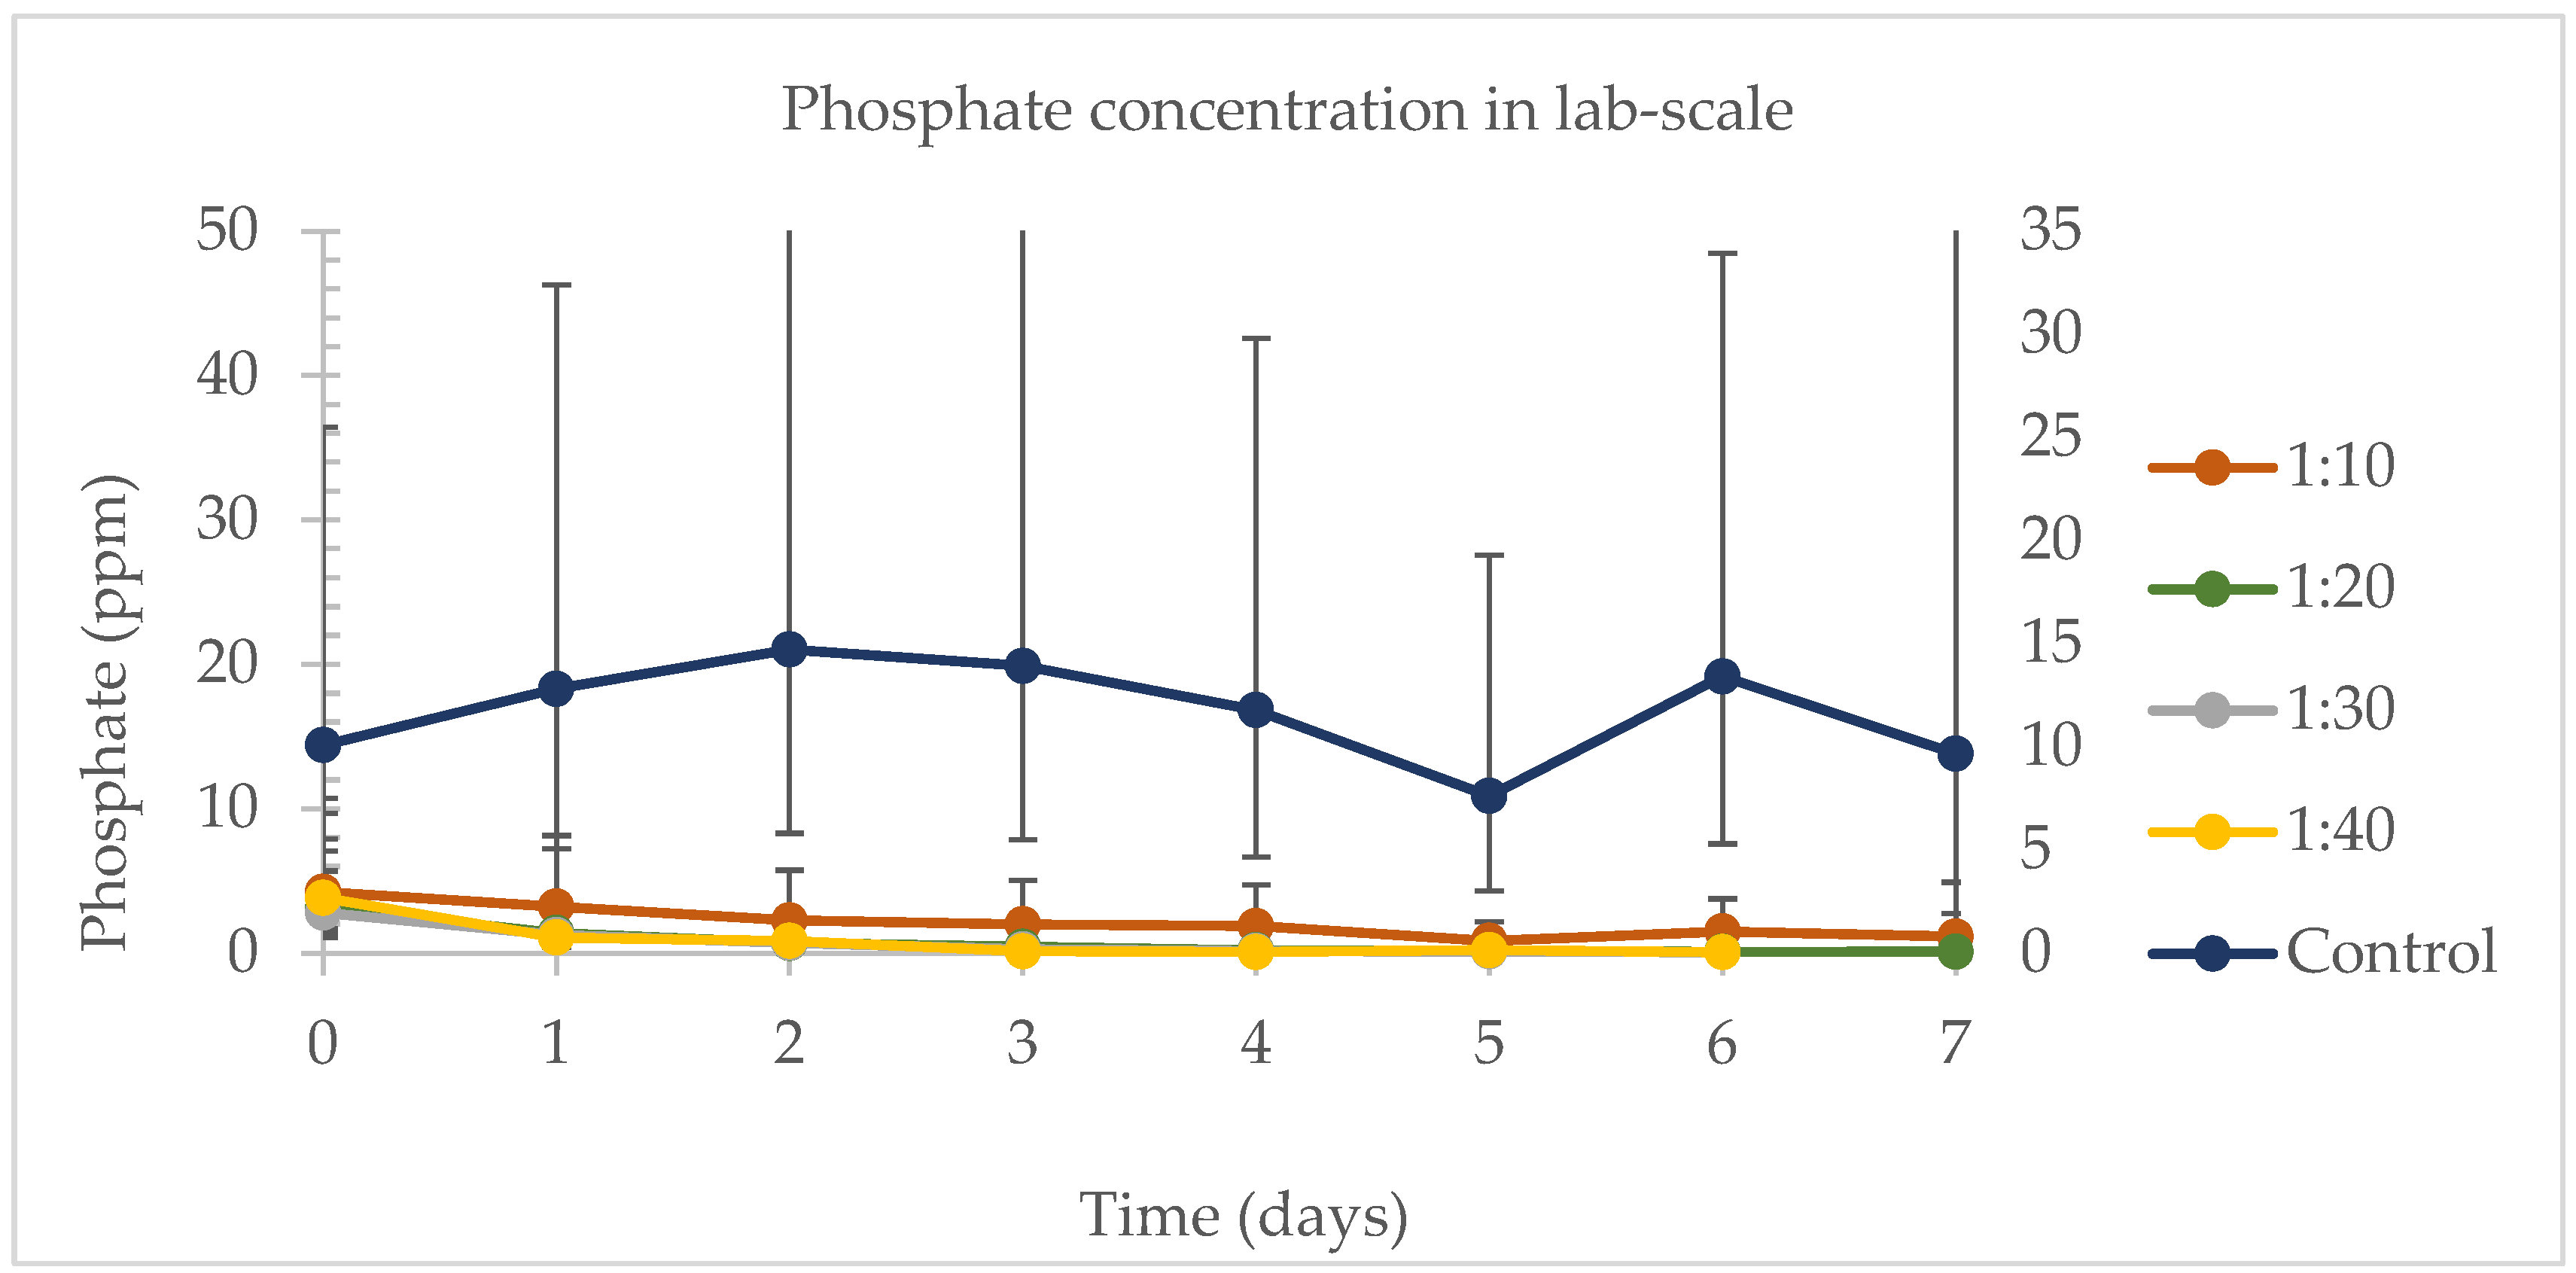
3.1. Dairy Wastewater Ratios in Water to Optimize Nutrients Removal and Microalgae Biomass Production

During the lab-scale experiment, cell density was observed to be higher in the control (Figure 2), followed by ratios 1:10 and 1:20. Temperature and day were significant effects (p < 0.05) on the cell density during this experiment. However, in the first six days of the experiment, only the control and ratio 1:40 were significantly different, while on day 7, control and 1:20 were significantly different. Temperature and dilution were not significant (p > 0.05) effects for the samples harvested on day 7. Delgadillo-Mirquez et al. [41] also ran experiments at lab scale (200 mL) with the medium where the microalgae was mixed with bacteria cultures, and the temperature was a significant effect on cell growth, as found in the present study. However, the authors also found that the temperature influenced the biomass productivity, phosphate removal, and ammonium removal, which was not found in the models of this study at lab scale.
The biomass for lab-scale experiments had a considerable variation between experiments on day 7. On the harvesting day, the control had the highest cumulative production, followed by the sample 1:10 and 1:20 (Figure 3). During lab-scale experiments, the only effects influencing the biomass productivity were day, sample, and the interaction between day and sample. Before harvesting the samples 1:30 and 1:40, on day 6, the only significant different comparison was between 1:40 and the control. By day 7, upon harvesting the various samples and the control, there was no notable difference observed between the control and the 1:10 sample. This outcome indicates that a 1:10 sample holds promise for biomass production, potentially useful in feeding studies with ruminants or in the creation of biofertilizer, while simultaneously facilitating nutrient removal from wastewater. Åkerström et al. [42] cultivated Chlorella sp. using different dilutions of sludge liquor in municipal wastewater, and the lowest concentration was 12%, very close to the sample 1:10 used in this study. The authors harvested 0.96 ± 0.18 g/L of dry weight biomass after ten days of treatment, which is close to the dry weight produced during this study for the sample 1:10 (1.575 ± 0.599 g/L).
The daily phosphate removal rates are in Figure 4. Except for day 0, the controls were significantly different from all the samples in the experiment. The samples were not different from each other on any experimental day. On day 6, the control and 1:10 were significantly different from all the other treatments. For the samples and the control harvested on day 7, no difference was observed in the phosphate removal rate. The 1:10 sample, representing the lowest dairy wastewater to water proportion tested in this study, showed promise in effectively removing a significant amount of phosphate from dairy wastewater, achieving a removal efficiency of 73.13%. The control had higher levels of phosphorus, and algae removed phosphate from all mixtures compared to the control, and this provides an indication that microalgae reduces and removed phosphate in dairy wastewater.
Table 1 shows the removal rates of ammonium for the lab-scale experiment, where 1:10 was significantly different from samples 1:30 and 1:40, on day 0. The samples 1:30 and 1:40 were harvested on day 6 for this experiment, and there was no difference in the ammonium levels between any of the other samples or the control. However, treatments harvested on day 7 were all different from each other. Throughout this experiment, the control removed 99.21% of the ammonium, while samples 1:10 and 1:20 removed 99.53% and 99.37%, respectively (Table 1).
Figure 5 shows the nitrate removal rates for the lab-scale experiment. Samples 1:30 and 1:40 were harvested on day 6, where all the tubes showed no difference on the nitrate concentrations, and the same was observed for the tubes harvested on day 7. Temperature, day, sample, and the interaction between day and sample were significant variables for the nitrate removal. No significant difference was observed for any of the effects on the tubes harvested on day 7. The highest nitrate removal rates were found for the control (97.03%), 1:10 (74.96%), and 1:20 (36.35%), on the last day of the experiment.
Cell density during pilot-scale experiment was observed to be higher in the control (Figure 6), followed by samples 1:10 and 1:20. On day 0, there were no significant differences (p > 0.05) in cell density across all treatments, indicating that the bags started with a similar number of cells per liter in each of the three different batches of this experiment. From day 0 to day 6, both the sample and the interaction between day and sample significantly impacted cell density. Here, cell density was influenced by factors such as temperature and solar radiation. However, for the samples harvested on day 7, neither temperature nor solar radiation showed significant effects; the only significant variable influencing the model was the sample.
In the pilot-scale experiment aimed at identifying the optimal concentration of dairy wastewater to water, the control bags containing AM6 artificial medium consistently outperformed those with dairy wastewater in water. Although there was no difference in initial biomass weight among the bags on day 0, a variation in biomass yield was observed on the final day of the experiment when compared to the control, as illustrated in Figure 7. The control produced an estimate of 0.64 g/L (0.39–1.05 g/L) of biomass, while 1:10 (DW in water) produced 0.33 g/L (0.22–0.50 g/L) during the last day. Day, sample, and the interaction between day and sample were significant variables for biomass productivity. In this case, biomass productivity was dependent on the pH and solar radiation. For the samples that were harvested on day 7, pH and solar radiation were not significant, and the only variable significant for the model was sample.
Figure 8 illustrates the daily phosphate removal rates observed in the experiment. The control groups, containing the AM6 medium which has a high phosphorus content in its formulation, showed significantly different phosphate removal rates compared to all the tested samples on each day of the experiment. However, among the various samples themselves, there were no significant differences in phosphate removal on any day. Interestingly, the peak of phosphate removal in the dairy wastewater (DW)/water mixtures for the samples 1:10, 1:30, and 1:40 coincided with the last day of the log phase of cell growth, occurring on day 4. Following this, as cell numbers began to decrease after day 4, the phosphate levels in the mixture started to rise again.
The DW used in this experiment was not sterilized, meaning all of the many bacteria and pathogens typically present in such effluent remained active. These organisms could potentially affect the fluctuation in phosphate concentration. The factors influencing phosphate removal in this study were the day and the ratio of DW to water. In this context, the temperature was found to be a key determinant in the rate of phosphate removal. For the samples that were harvested on day 7 of the experiment, the temperature did not present a significant impact. Whitton et al. [43] reported a low phosphate removal rate, ranging from 12.5 to 19.6%, while in this study, 1:10 removed 27.05% and 1:30 removed 21.54%. Also, the authors presented results where Chlorella vulgaris had an increase in the phosphorous concentration after ten days of remediation trials. Additionally, when correlating cell growth with phosphate removal, as shown in Figure 8, it is observed that the cells enter their stationary phase between the third and fourth day. This phase aligns with the period when the phosphate concentration decreases, reinforcing the idea that phosphate is one of the primary nutrients essential for algal growth and metabolic regulation [19,44,45,46].
Figure 9 presents the ammonium removal rates, showing that the controls differed significantly from all dairy wastewater water samples on each day of the experiment. However, there were no significant differences among the various samples themselves on any day. Notably, all the samples and the control demonstrated high removal rates, effectively reducing ammonium levels close to zero across all three weeks of the experiment. Specifically, the control achieved a 98.12% removal rate, while the 1:10 and 1:30 samples achieved 97.55% and 95.53% removal rates, respectively. The factors influencing ammonium removal were the day and the sample. In this context, ammonium removal was found to be dependent on solar radiation. For the samples harvested on day 7, solar radiation did not have a significant impact, leaving the sample as the only significant variable for the model. Whitton et al. [43] performed similar experiments to the ones presented in this study, where they had batch reactions for 10 days using dilutions of wastewater in artificial medium (BG11) and a mix of different microalgae, including Chlorella. They found ammonium removal rates above 99% in liquid phase reactions.
Nitrate removal rates are shown in Figure 10. The control rate was lower during the length of the study, but none of the samples were significantly different from each other on any day. All bags, except for the 1:30 samples, had the same behavior with respect to nitrate removal rates. A decrease was observed after day 3 in the cultivation system. The highest removal rates were observed for the control (84.11%), 1:10 (39.27%), and 1:20 (34.96%) samples on the last day of the experiment. The day, sample, and interaction between day and sample had an effect on nitrate removal rates. For the samples harvested on day 7, the sample was the only variable significant for the model. In evaluating the nitrogen-to-phosphorus (N:P) balance in this reaction, it is crucial to observe that a decrease in phosphate concentration occurs within the first three days. During this period, the levels of ammonium and nitrate remained relatively stable, close to their initial amounts. It is only after the fourth day that these levels began to be utilized, dropping close to zero in most of the samples, including the control. Such fluctuations in nutrient levels, particularly in relation to different N:P samples and their variations over time, have been noted by several researchers who have conducted similar experiments with varying conditions [42,47,48].

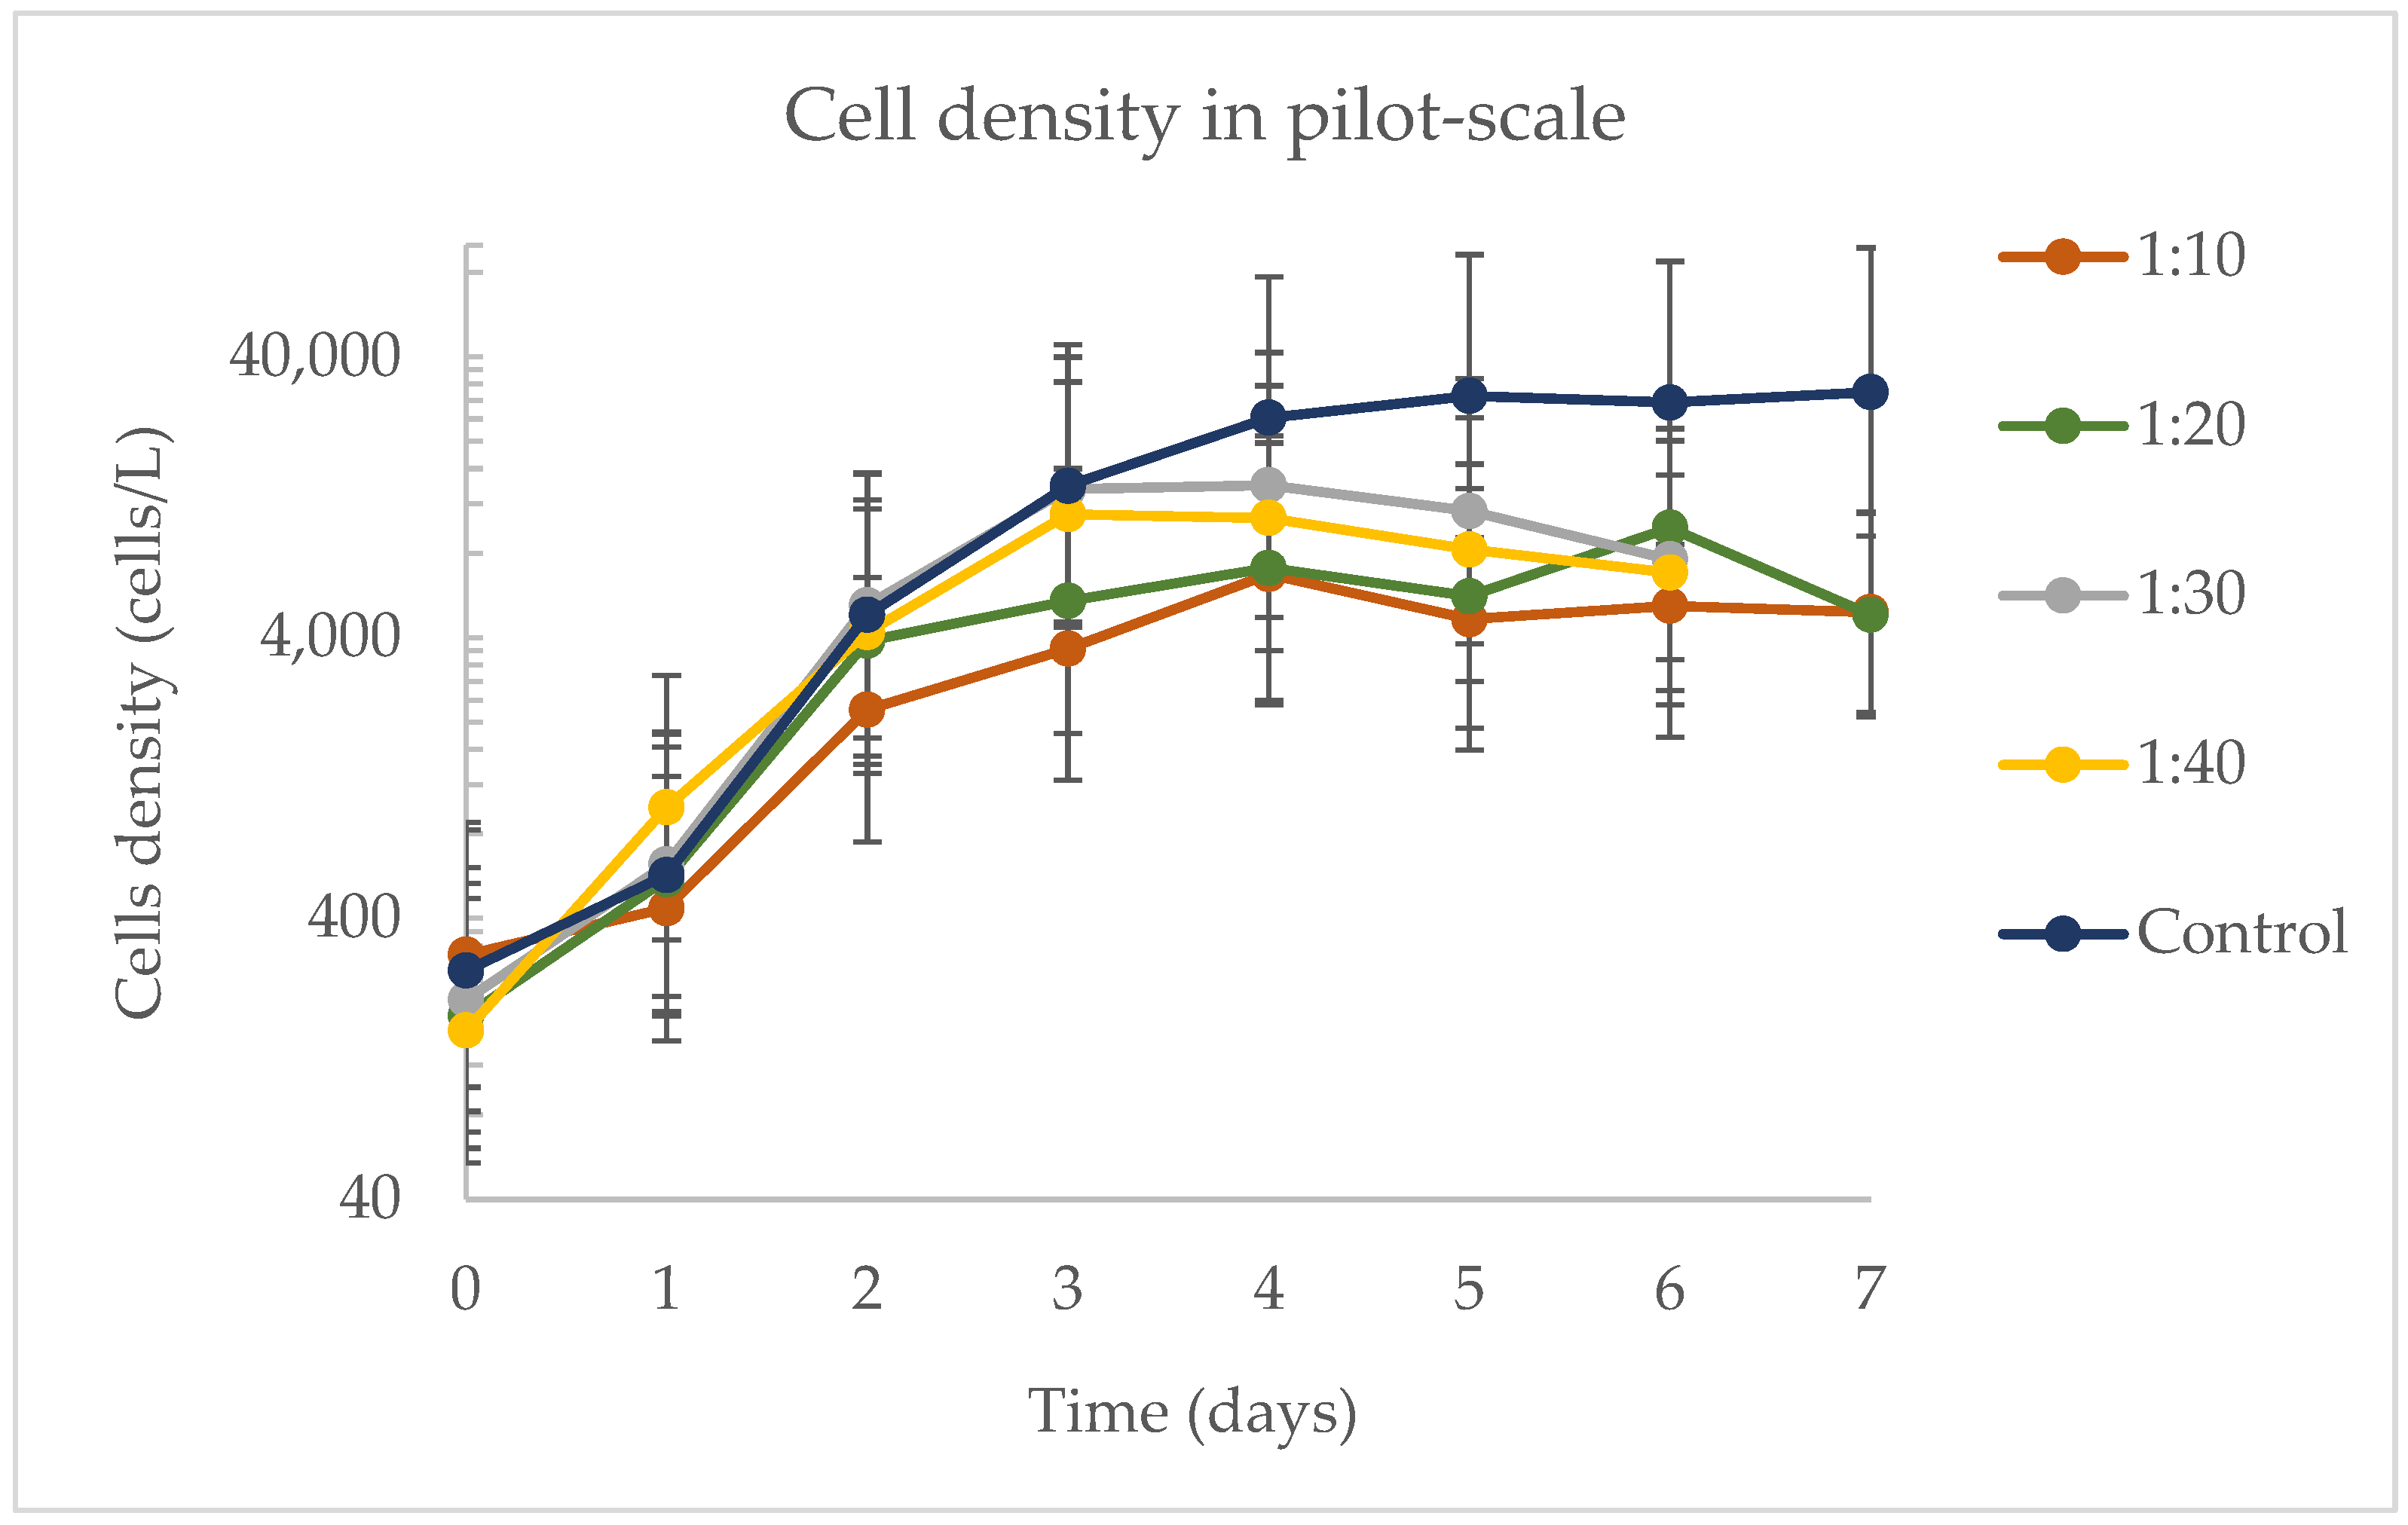
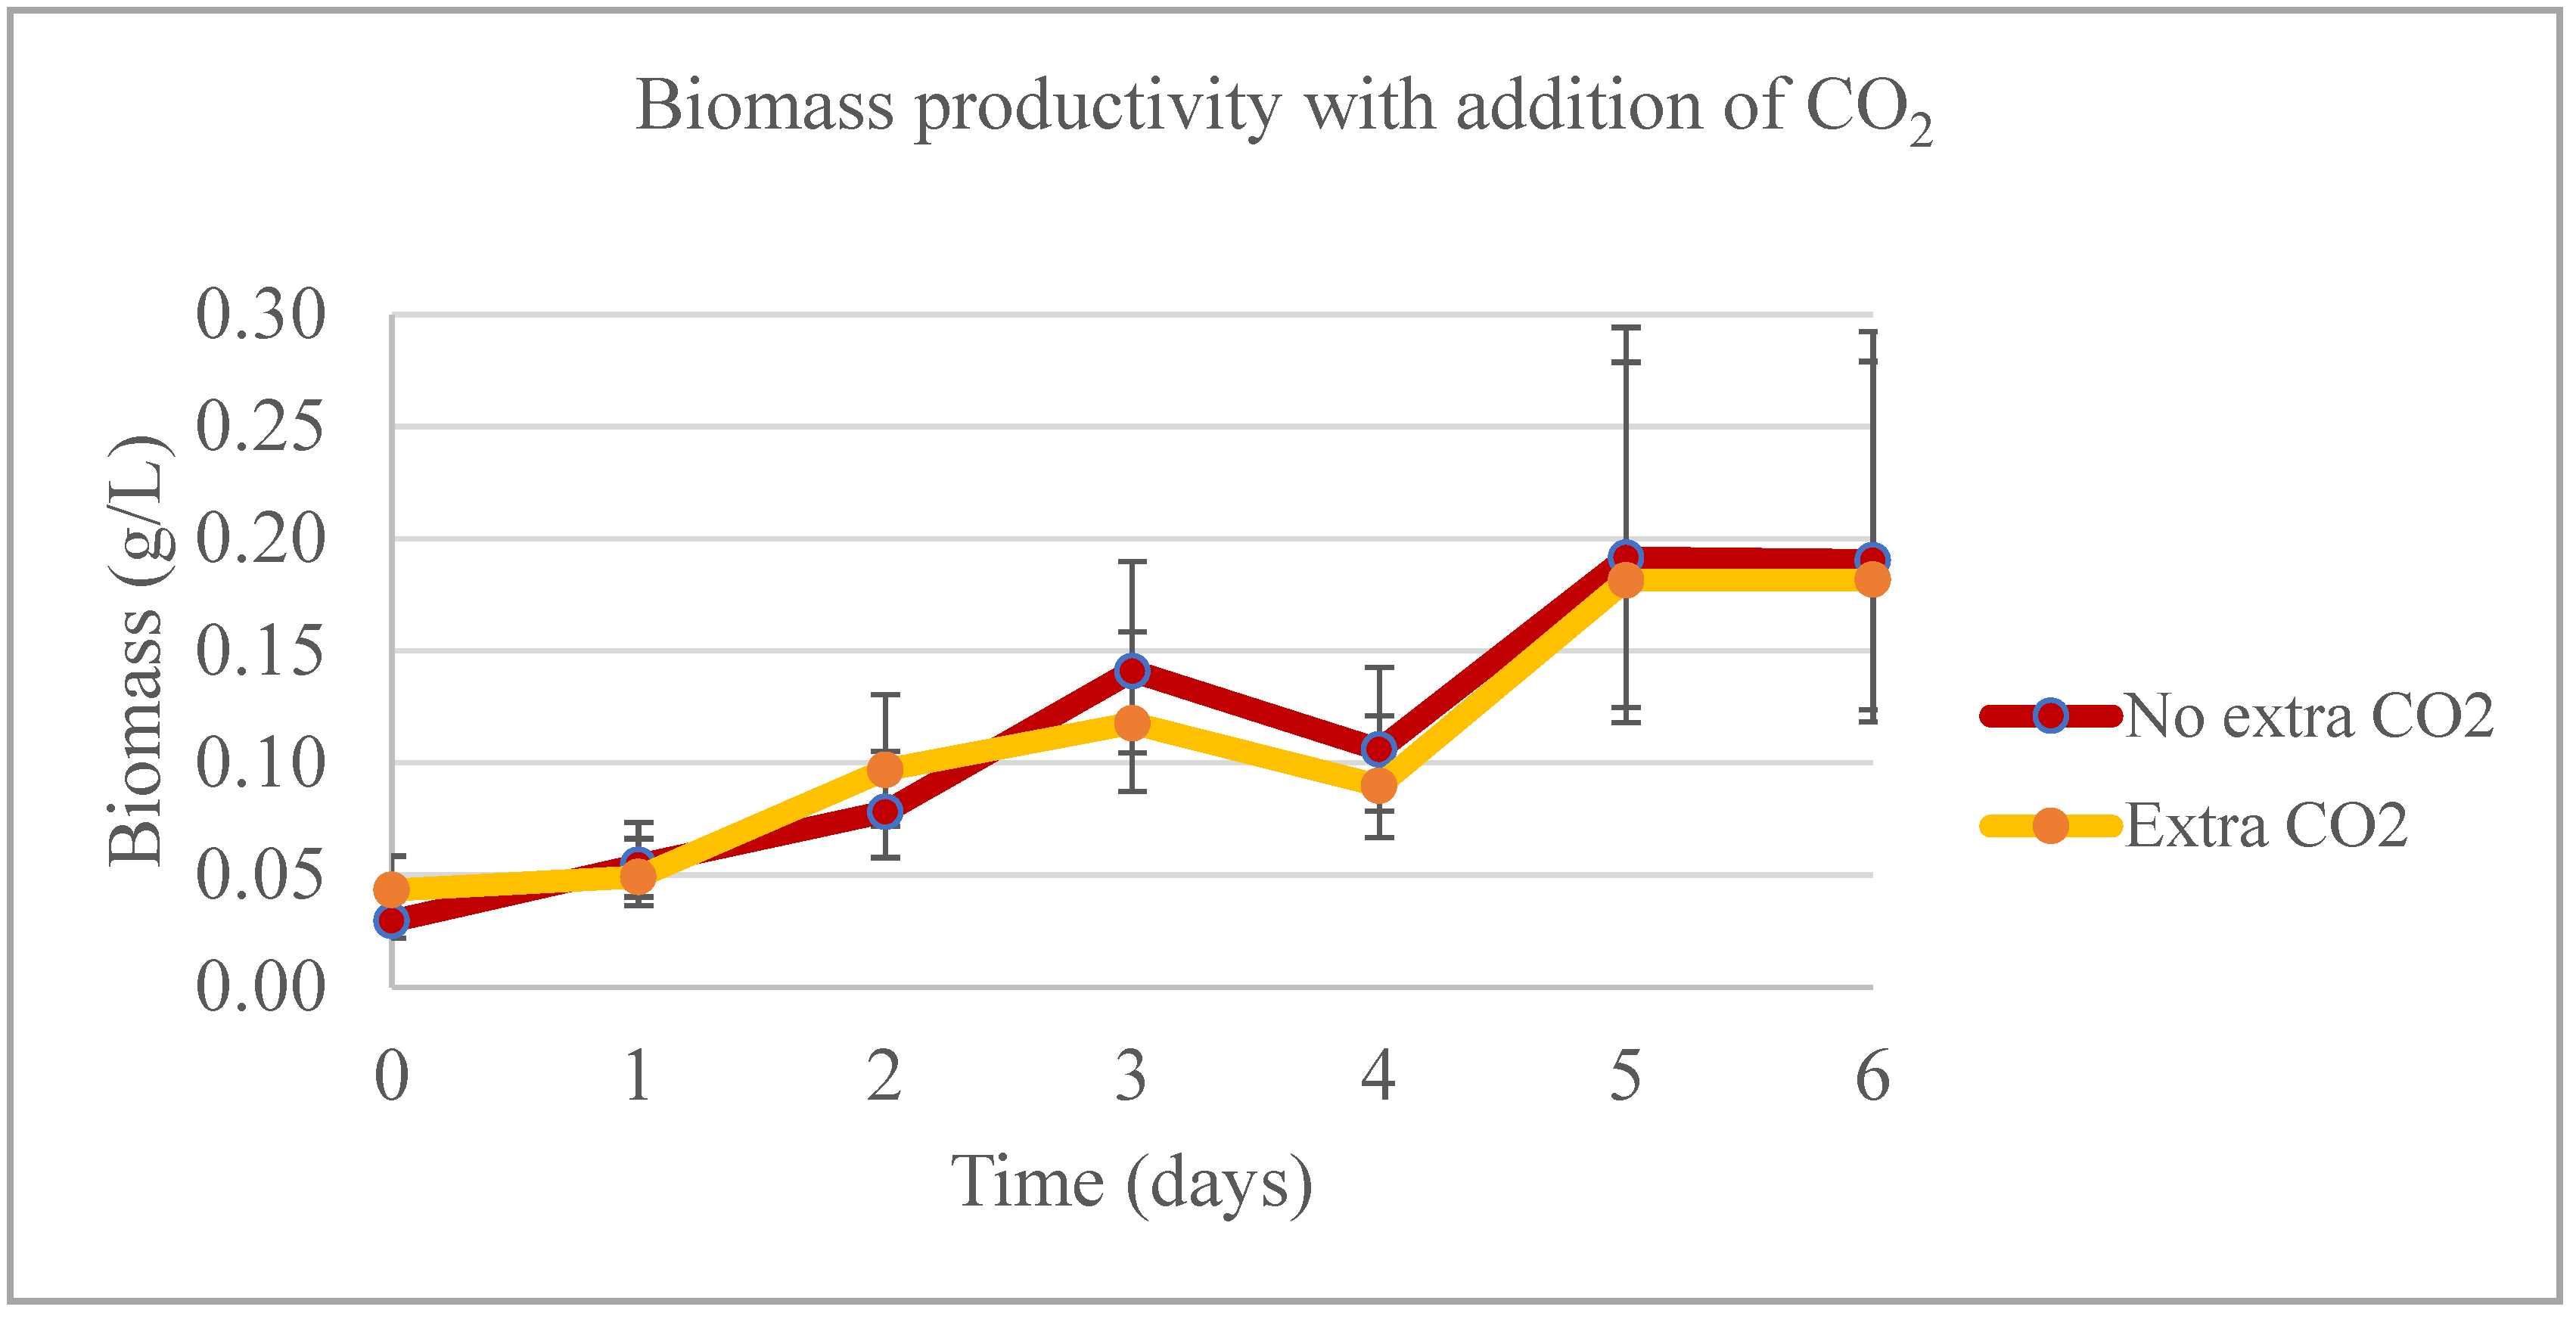
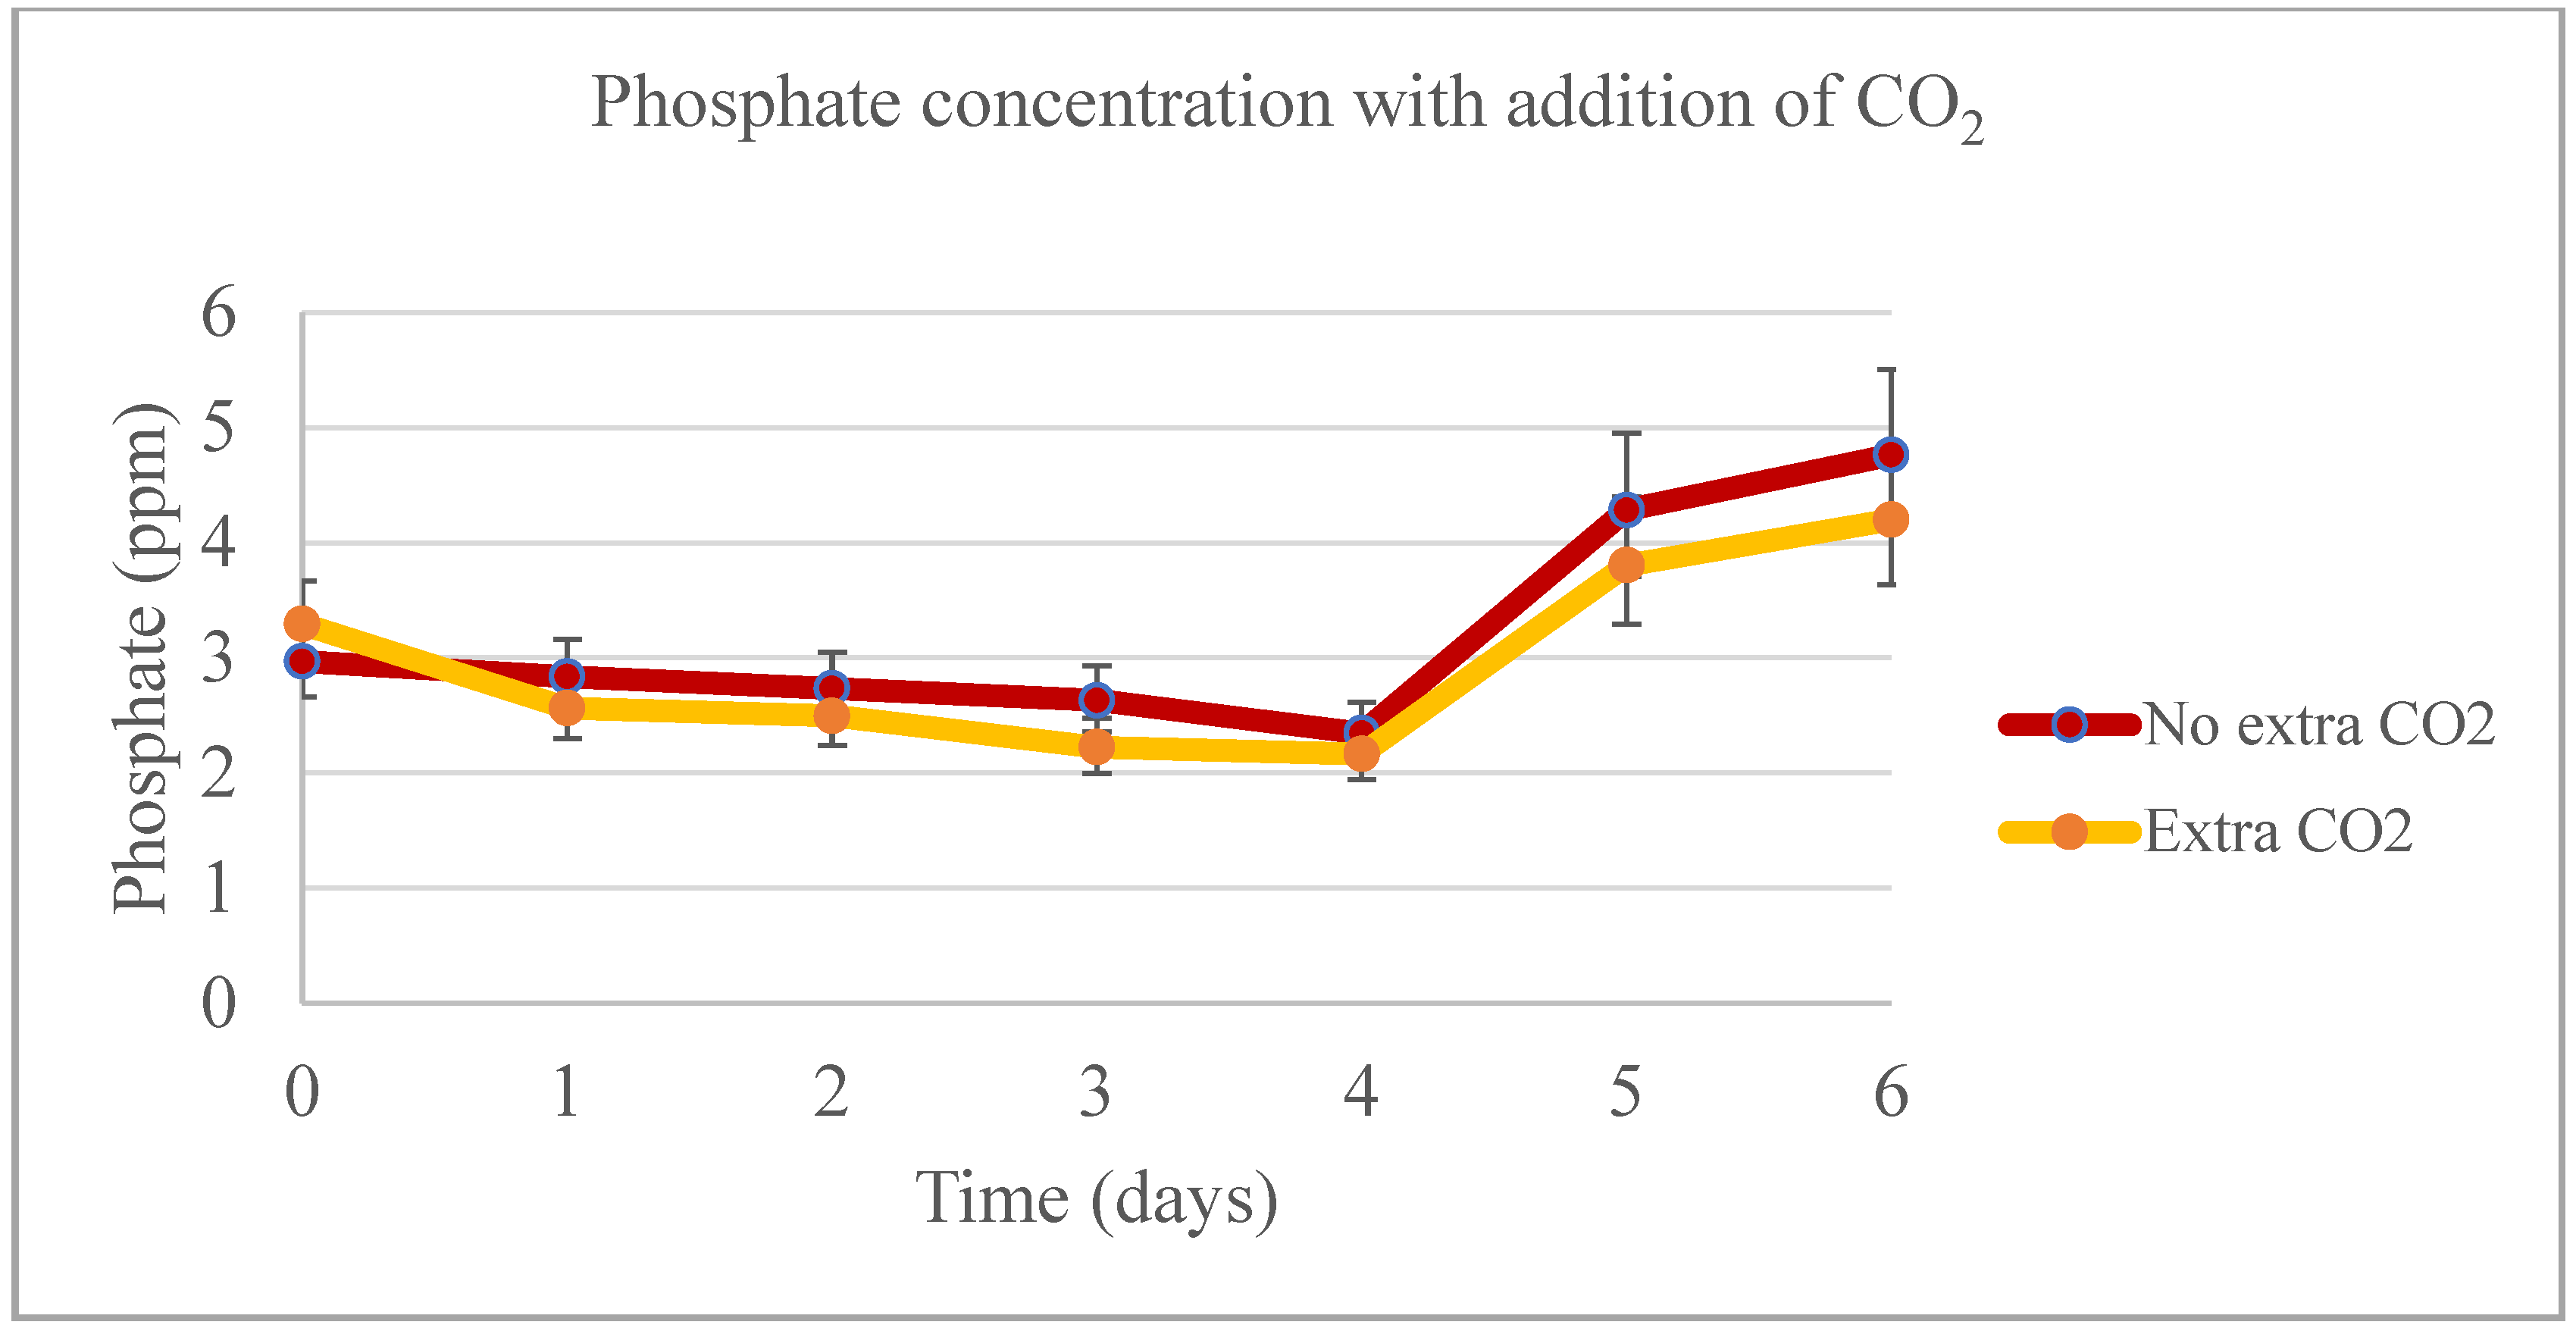
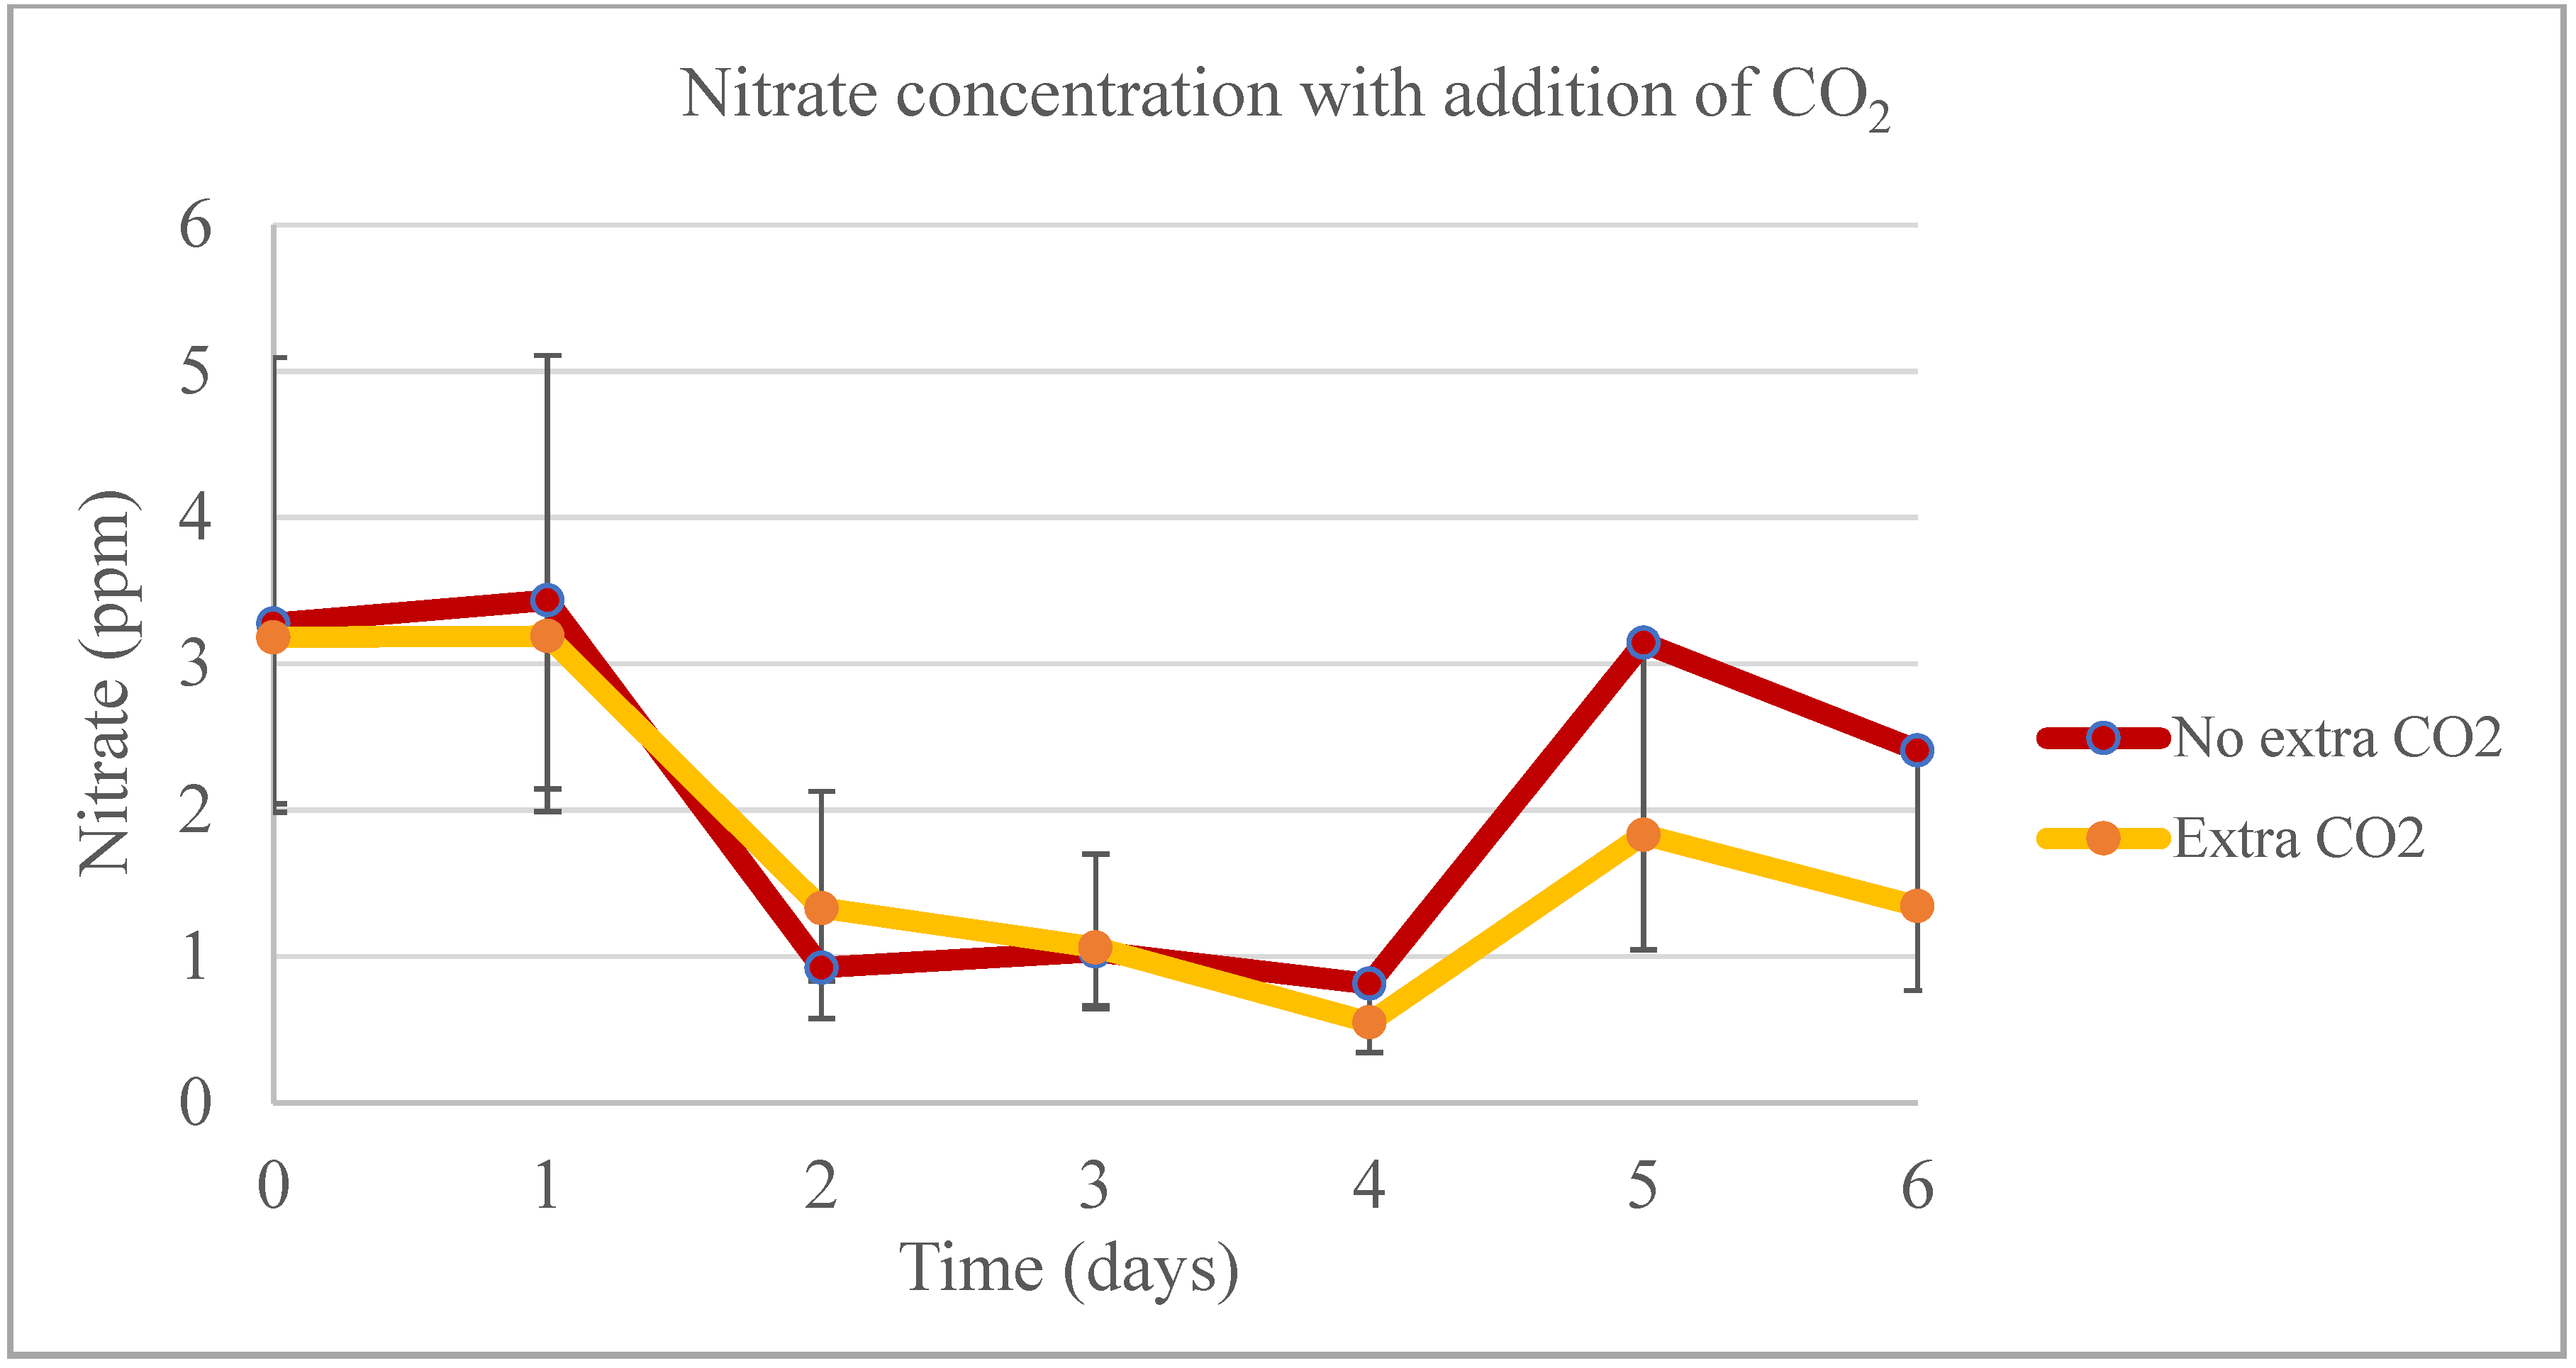
3.2. Testing the Necessity of Extra Addition of CO2 as a Carbon Source and to Control pH When Using Different Concentrations of Dairy Wastewater in Water

This experiment was designed to assess the capability of Chlorella sp. to grow and remove nutrients from (DW) in photobioreactors, without the addition of extra CO2. This approach is particularly relevant for farm applications where there is a need to treat wastewater and produce livestock feed on site, but where adding extra CO2 could be prohibitively expensive.
During the lab-scale phase of the experiment, the temperature was the only significant factor (p < 0.05) affecting biomass production from days 0 to 4 (Figure 11). On day 4, when the 1:30 sample was harvested, no significant difference was observed in biomass productivity across different dilutions. However, from days 5 and 6, the temperature ceased to be a significant factor for the model, and the addition of CO2 continued to show no significant impact on biomass productivity. In the treatments with extra CO2, a higher proportion of biomass production was noted, particularly in the last two days of the experiment. However, between days 0 and 4, there was no significant difference in biomass productivity. The highest phosphate removal rate was observed in the 1:30 sample for both experiments, irrespective of whether extra CO2 was added (with a removal rate as high as 96.11%) or not (with a removal rate as high as 98.61%) (Figure 12). In the first four days of the experiment, nitrate concentrations were significantly different between the control and the 1:10 and 1:30 samples, but not between these two samples themselves. During the last two days of the experiment, no significant difference was found between the control and the 1:10 sample (Figure 13).
The temperature, sample, and interactions between cell culture day and CO2, and day and sample significantly affected the nitrate removal rate from day 0 to 4. However, on days 5 and 6, these effects were not significant, but the presence of CO2 was (p = 0.0421). While the tubes with extra CO2 seemed to have higher nitrate removal rates on the final day, those without the extra gas achieved higher removal rates throughout the experiment: 78.66% without extra CO2 compared to 75.18% with it. Ammonium concentrations from day 0 to 4 were significantly different only for the sample 1:10 and 1:10 N. For the last two days of experiments, there was no significant difference between the dilutions. Furthermore, during the first four days of the experiment, the temperature, the different samples, and the interaction between the rationing and addition of CO2 produced significant effects (Figure 14). On the last experimental day, the dilutions without extra CO2 removed up to 96.56% of the initial ammonium concentration, while the tubes with extra CO2 addition removed up to 97.74%. Wang et al. [49] seemed to not have added CO2 during their nine-day experiments involving four different wastewater from the same treatment plan, and the authors could remove 74.7% of the ammonium from the wastewater used in this experiment, 90.6% of the phosphate, and up to 62.5% of the nitrate. Liu et al. [18] found that Chlorella vulgaris takes long periods of time to deplete ammonium from wastewater when no extra CO2 is added to the system. For example, they found that for the microalgae to deplete ammonium close to zero, it would take three days for concentrations of 1%, 5%, and 10% CO2, three and a half days for 20% CO2, and five days and a half when not mixing CO2 in the aeration system.
Cell density had a higher concentration in the control and sample 1:10 that had the extra CO2. The day and the interaction between day and ration were the only significant effects for this model during day 0 to 4. However, they were not significant (p > 0.05) on the last two days of the experiment when the CO2 was the only significant effect influencing in the cells’ density. Chlorella sp. is known as a species that has its growth limited when CO2 levels exceed 10% [50,51,52]. However, Klinthong et al. [53] stated that some Chlorella sp. can grow without added CO2, in levels of up to 15%. Moreover, some species of that microalgae can grow with the addition of CO2 in concentrations of up to 100% and tolerate it, supporting the findings of the study presented in this thesis, where Chlorella sp. biomass can be produced by mixing 100% CO2 in different treatments.
In terms of biomass productivity, the highest amounts were generated by the control groups, followed by the 1:10 sample. An analysis of the data revealed no significant differences between the samples from day 0 to 4. However, the day and the interaction between day and sample were significant factors in the model. On days 5 and 6, the different samples were the only significant effect. This indicates that CO2 did not have an impact on biomass productivity during the experiment. A notable observation throughout the experiment was the formation of biofilm on the walls of the bags, which hindered proper sampling for cell and biomass measurements. Consequently, at the time of harvesting each bag, the greatest biomass weight was collected from the control group with the additional CO2, showing a significant difference compared to the 1:10 and 1:30 samples under the same conditions. However, when harvesting from the bags without extra CO2, there was no significant difference between the control and the 1:10 sample, but both differed from the 1:30 sample. This suggests that while CO2 addition did not affect overall biomass productivity, it did influence the distribution and accumulation of biomass within the system. The maximum removal rates of phosphate were on day 4 for all the bags, with 1:30 being the sample with higher removal rates, either with extra CO2 (98.29%) or not (93.05%), followed by 1:10 (82.80% with extra CO2 and 72.11% without extra amount of the gas), and the controls (45.68% with extra CO2 and 15.79% without additional amount of the gas).
In the current experiment, nitrate removal rates were found to be influenced by the day, the DW concentration, and the interaction between these factors, particularly on days 0 through 4. However, for days 5 and 6, nitrate removal was solely dependent on the concentration. Day 4 marked the peak of nitrate removal for the 1:10 and 1:30 samples. Conversely, the controls achieved their maximum nitrate removal on the experiment’s final day. On this day, the 1:10 sample without extra CO2 showed a removal rate of 69.78%, while the control with added CO2 achieved a 73.66% removal rate on day 6. It is notable that there was no significant difference between the different concentrations and the addition of extra CO2 in terms of nitrate removal rates on any day of the experiment. However, overall, the concentrations and the control with added CO2 removed higher rates of nitrate. The initial concentration of ammonium was higher in the controls compared to the concentrations, attributed to the AM6 medium used in the experiments. By the time of harvesting, all bags showed a similar ammonium concentration, with levels estimated below 1 ppm. The control without extra CO2 had the highest ammonium removal rate at 94.47%, followed by the 1:10 sample without extra CO2, which removed 92.19% during the experiment. The bags with additional CO2 demonstrated an overall lower ammonium removal. The addition of extra CO2 was not a significant factor for ammonium removal on any experimental day.

3.3. Chlorella sp. Biomass Biochemical Characteristics

Table 2 shows the biochemical composition of the biomass produced throughout this study. The findings indicate a high protein content of 49.2%, a low fat percentage of 2.32%, the absence of mycotoxins, and a substantial presence of various minerals including calcium, iron, and zinc. This nutrient profile positions the biomass as a highly promising candidate for livestock feed, contingent on its acceptance by animals. In animal nutrition, microalgae stand out as they offer a combination of essential nutrients, minerals, vitamins and fatty acids and a high protein content [22,54,55].
Chlorella sp. was cultivated under mixotrophic conditions using a range of raw dairy wastewater concentrations. The bioreactors developed for this research have potential applications on farms for recycling dairy wastewater while simultaneously producing nutrient-rich biomass suitable for livestock feed. The removal of nutrients, especially nitrogen and phosphorus, from wastewater is an increasingly important regulatory requirement. Utilizing microalgae in this context offers a novel integration of dairy wastewater treatment with livestock feed production. This study focused on assessing the taste preferences of heifer calves for specific quantities of algae derived from dairy wastewater. An integrated system on a dairy farm could effectively recycle nutrients and carbon dioxide emissions, thereby producing not only clean water and “green” energy but also sustainable food and feed options. Such an approach exemplifies the concept of a circular economy, maximizing resource efficiency and environmental sustainability in agricultural practices.

4. Conclusions

After seven days of growth, both lab-scale and pilot-scale experiments exhibited similar levels of biomass growth. In both setups, the control groups achieved the highest biomass, closely followed by the 1:10 sample. In the pilot-scale experiment, the control, 1:10, 1:10 N, 1:30, and 1:30 N mixtures of dairy wastewater showed distinct results in terms of nutrient removal rates and biomass production, indicating variability across different culture conditions. This study underscores the importance of evaluating the practical applications of scaling algae biomass production for industrial purposes. It is imperative to consider how the processes and results obtained in laboratory or pilot-scale environments can be effectively translated to an industrial scale. This translation entails a thorough analysis of factors such as cost-effectiveness, resource allocation, environmental implications, and the technological aspects required for upscale production. Furthermore, the potential of algae biomass as a source of animal feed, while acknowledged, necessitates a more detailed discussion. This discussion should encompass the examination of the nutritional benefits of algae biomass, its acceptance across various animal species, and its advantages over conventional feed options. Furthermore, identifying and addressing any challenges or limitations associated with the use of algae biomass in animal feed will provide a more holistic understanding and valuable insights for industrial implementation. Ultimately, the ability to bridge the gap between research outcomes and their real-world applications is crucial. Doing so not only ensures the practical utility of the research but also significantly contributes to advancing industry standards and achieving sustainability objectives.

Author Contributions

Conceptualization, B.J.H. and R.G.G.; methodology, B.J.H. and R.G.G.; software, B.J.H. and R.G.G.; validation, S.C.L., B.J.H. and R.G.G.; formal analysis, S.C.L.; investigation, S.C.L., B.J.H. and R.G.G.; resources, S.C.L., B.J.H., and R.G.G.; data curation, S.C.L.; writing—original draft preparation, S.C.L.; writing—review and editing, S.C.L. and B.J.H.; visualization, S.C.L. and B.J.H.; supervision, B.J.H. and R.G.G.; project administration, B.J.H.; funding acquisition, B.J.H. All authors have read and agreed to the published version of the manuscript.

Funding

Funding for this project was provided by the Minnesota Environment and Natural Resources Trust Fund as recommended by the Legislative-Citizen Commission on Minnesota Resources (LCCMR). The Trust Fund is a permanent fund constitutionally established by the citizens of Minnesota to assist in the protection, conservation, preservation, and enhancement of the state’s air, water, land, fish, wildlife, and other natural resources. Currently, 40% of net Minnesota State Lottery proceeds are dedicated to growing the Trust Fund and ensuring future benefits for Minnesota’s environment and natural resources.

Institutional Review Board Statement

All animal care and management for the study was approved by the University of Minnesota Institutional Animal Care and Use Committee (Animal Subjects Code #1709–35098A).

Informed Consent Statement

Not applicable.

Data Availability Statement

Data are available upon request from the corresponding author.

Conflicts of Interest

The authors declare no conflicts of interest. The funders had no role in the design of the study; in the collection, analyses, or interpretation of data; in the writing of the manuscript; or in the decision to publish the results.

References

  1. Safi, C.; Zebib, B.; Merah, O.; Pontalier, P.-Y.; Vaca-Garcia, C. Morphology, Composition, Production, Processing and Applications of Chlorella vulgaris: A Review. Renew. Sustain. Energy Rev. 2014, 35, 265–278. [Google Scholar] [CrossRef]
  2. Rizwan, M.; Mujtaba, G.; Memon, S.A.; Lee, K.; Rashid, N. Exploring the Potential of Microalgae for New Biotechnology Applications and beyond: A Review. Renew. Sustain. Energy Rev. 2018, 92, 394–404. [Google Scholar] [CrossRef]
  3. Falkowski, P.G.; Barber, R.T.; Smetacek, V. Biogeochemical Controls and Feedbacks on Ocean Primary Production. Science 1998, 281, 200–206. [Google Scholar] [CrossRef]
  4. Singh, A.; Nigam, P.S.; Murphy, J.D. Mechanism and Challenges in Commercialisation of Algal Biofuels. Bioresour. Technol. 2011, 102, 26–34. [Google Scholar] [CrossRef] [PubMed]
  5. Barsanti, L.; Gualtieri, P. Algae: Anatomy, Biochemistry, and Biotechnology, 2nd ed.; CRC Press: Boca Raton, FL, USA, 2014; ISBN 978-0-429-10718-4. [Google Scholar]
  6. Brown, J.S.; French, C.S. Absorption Spectra and Relative Photostability of the Different Forms of Chlorophyll in Chlorella. Plant Physiol. 1959, 34, 305–309. [Google Scholar] [CrossRef] [PubMed]
  7. Hu, B.; Min, M.; Zhou, W.; Du, Z.; Mohr, M.; Chen, P.; Zhu, J.; Cheng, Y.; Liu, Y.; Ruan, R. Enhanced Mixotrophic Growth of Microalga Chlorella Sp. on Pretreated Swine Manure for Simultaneous Biofuel Feedstock Production and Nutrient Removal. Bioresour. Technol. 2012, 126, 71–79. [Google Scholar] [CrossRef]
  8. Espinosa-Gonzalez, I.; Parashar, A.; Bressler, D.C. Heterotrophic Growth and Lipid Accumulation of Chlorella Protothecoides in Whey Permeate, a Dairy by-Product Stream, for Biofuel Production. Bioresour. Technol. 2014, 155, 170–176. [Google Scholar] [CrossRef]
  9. Lu, W.; Wang, Z.; Wang, X.; Yuan, Z. Cultivation of Chlorella Sp. Using Raw Dairy Wastewater for Nutrient Removal and Biodiesel Production: Characteristics Comparison of Indoor Bench-Scale and Outdoor Pilot-Scale Cultures. Bioresour. Technol. 2015, 192, 382–388. [Google Scholar] [CrossRef]
  10. Church, J.; Hwang, J.-H.; Kim, K.-T.; McLean, R.; Oh, Y.-K.; Nam, B.; Joo, J.C.; Lee, W.H. Effect of Salt Type and Concentration on the Growth and Lipid Content of Chlorella vulgaris in Synthetic Saline Wastewater for Biofuel Production. Bioresour. Technol. 2017, 243, 147–153. [Google Scholar] [CrossRef] [PubMed]
  11. Bindra, S.; Kulshrestha, S. Converting Waste to Energy: Production and Characterization of Biodiesel from Chlorella pyrenoidosa Grown in a Medium Designed from Waste. Renew. Energy 2019, 142, 415–425. [Google Scholar] [CrossRef]
  12. Kang, H.K.; Salim, H.M.; Akter, N.; Kim, D.W.; Kim, J.H.; Bang, H.T.; Kim, M.J.; Na, J.C.; Hwangbo, J.; Choi, H.C.; et al. Effect of Various Forms of Dietary Chlorella Supplementation on Growth Performance, Immune Characteristics, and Intestinal Microflora Population of Broiler Chickens. J. Appl. Poult. Res. 2013, 22, 100–108. [Google Scholar] [CrossRef]
  13. Szabo, N.J.; Matulka, R.A.; Chan, T. Safety Evaluation of Whole Algalin Protein (WAP) from Chlorella Protothecoides. Food Chem. Toxicol. 2013, 59, 34–45. [Google Scholar] [CrossRef]
  14. Gruenwald, J. Human Outposts on Mars: Engineering and Scientific Lessons Learned from History. CEAS Space J. 2014, 6, 73–77. [Google Scholar] [CrossRef]
  15. Das, B.; Mandal, T.K.; Patra, S. A Comprehensive Study on Chlorella pyrenoidosa for Phenol Degradation and Its Potential Applicability as Biodiesel Feedstock and Animal Feed. Appl. Biochem. Biotechnol. 2015, 176, 1382–1401. [Google Scholar] [CrossRef] [PubMed]
  16. Cheung, Y.H.; Wong, M.H. Properties of Animal Manures and Sewage Sludges and Their Utilisation for Algal Growth. Agric. Wastes 1981, 3, 109–122. [Google Scholar] [CrossRef]
  17. Daneshvar, E.; Zarrinmehr, M.J.; Koutra, E.; Kornaros, M.; Farhadian, O.; Bhatnagar, A. Sequential Cultivation of Microalgae in Raw and Recycled Dairy Wastewater: Microalgal Growth, Wastewater Treatment and Biochemical Composition. Bioresour. Technol. 2019, 273, 556–564. [Google Scholar] [CrossRef]
  18. Liu, X.; Ying, K.; Chen, G.; Zhou, C.; Zhang, W.; Zhang, X.; Cai, Z.; Holmes, T.; Tao, Y. Growth of Chlorella Vulgaris and Nutrient Removal in the Wastewater in Response to Intermittent Carbon Dioxide. Chemosphere 2017, 186, 977–985. [Google Scholar] [CrossRef] [PubMed]
  19. Ramaraj, R.; Tsai, D.D.-W.; Chen, P.H. Carbon Dioxide Fixation of Freshwater Microalgae Growth on Natural Water Medium. Ecol. Eng. 2015, 75, 86–92. [Google Scholar] [CrossRef]
  20. te Pas, M.F.W.; Veldkamp, T.; de Haas, Y.; Bannink, A.; Ellen, E.D. Adaptation of Livestock to New Diets Using Feed Components without Competition with Human Edible Protein Sources—A Review of the Possibilities and Recommendations. Animals 2021, 11, 2293. [Google Scholar] [CrossRef]
  21. von Keyserlingk, M.A.G.; Martin, N.P.; Kebreab, E.; Knowlton, K.F.; Grant, R.J.; Stephenson, M.; Sniffen, C.J.; Harner, J.P.; Wright, A.D.; Smith, S.I. Invited Review: Sustainability of the US Dairy Industry. J. Dairy Sci. 2013, 96, 5405–5425. [Google Scholar] [CrossRef]
  22. Madeira, M.S.; Cardoso, C.; Lopes, P.A.; Coelho, D.; Afonso, C.; Bandarra, N.M.; Prates, J.A.M. Microalgae as Feed Ingredients for Livestock Production and Meat Quality: A Review. Livest. Sci. 2017, 205, 111–121. [Google Scholar] [CrossRef]
  23. Costa, D.F.A.; Castro-Montoya, J.M.; Harper, K.; Trevaskis, L.; Jackson, E.L.; Quigley, S. Algae as Feedstuff for Ruminants: A Focus on Single-Cell Species, Opportunistic Use of Algal By-Products and On-Site Production. Microorganisms 2022, 10, 2313. [Google Scholar] [CrossRef] [PubMed]
  24. Maity, J.P.; Bundschuh, J.; Chen, C.-Y.; Bhattacharya, P. Microalgae for Third Generation Biofuel Production, Mitigation of Greenhouse Gas Emissions and Wastewater Treatment: Present and Future Perspectives—A Mini Review. Energy 2014, 78, 104–113. [Google Scholar] [CrossRef]
  25. D’Imporzano, G.; Veronesi, D.; Salati, S.; Adani, F. Carbon and Nutrient Recovery in the Cultivation of Chlorella vulgaris: A Life Cycle Assessment Approach to Comparing Environmental Performance. J. Clean. Prod. 2018, 194, 685–694. [Google Scholar] [CrossRef]
  26. Chiu, S.-Y.; Kao, C.-Y.; Chen, T.-Y.; Chang, Y.-B.; Kuo, C.-M.; Lin, C.-S. Cultivation of Microalgal Chlorella for Biomass and Lipid Production Using Wastewater as Nutrient Resource. Bioresour. Technol. 2015, 184, 179–189. [Google Scholar] [CrossRef]
  27. Guccione, A.; Biondi, N.; Sampietro, G.; Rodolfi, L.; Bassi, N.; Tredici, M.R. Chlorella for Protein and Biofuels: From Strain Selection to Outdoor Cultivation in a Green Wall Panel Photobioreactor. Biotechnol. Biofuels 2014, 7, 84. [Google Scholar] [CrossRef]
  28. Luzzi, S.; Gardner, R.; Heins, B. Taste Preference of Chlorella Sp. Algae from Dairy Wastewater by Weaned Dairy Calves. JDS Commun. 2020, 1, 41–44. [Google Scholar] [CrossRef]
  29. Kholif, A.E.; Gouda, G.A.; Abu Elella, A.A.; Patra, A.K. Replacing the Concentrate Feed Mixture with Moringa oleifera Leaves Silage and Chlorella vulgaris Microalgae Mixture in Diets of Damascus Goats: Lactation Performance, Nutrient Utilization, and Ruminal Fermentation. Animals 2022, 12, 1589. [Google Scholar] [CrossRef]
  30. Spínola, M.P.; Costa, M.M.; Prates, J.A.M. Enhancing Digestibility of Chlorella vulgaris Biomass in Monogastric Diets: Strategies and Insights. Animals 2023, 13, 1017. [Google Scholar] [CrossRef]
  31. Morais, T.; Inácio, A.; Coutinho, T.; Ministro, M.; Cotas, J.; Pereira, L.; Bahcevandziev, K. Seaweed Potential in the Animal Feed: A Review. J. Mar. Sci. Eng. 2020, 8, 559. [Google Scholar] [CrossRef]
  32. Kuo, C.-M.; Sun, Y.-L.; Lin, C.-H.; Lin, C.-H.; Wu, H.-T.; Lin, C.-S. Cultivation and Biorefinery of Microalgae (Chlorella Sp.) for Producing Biofuels and Other Byproducts: A Review. Sustainability 2021, 13, 13480. [Google Scholar] [CrossRef]
  33. Dudek, M.; Dębowski, M.; Kazimierowicz, J.; Zieliński, M.; Quattrocelli, P.; Nowicka, A. The Cultivation of Biohydrogen-Producing Tetraselmis subcordiformis Microalgae as the Third Stage of Dairy Wastewater Aerobic Treatment System. Sustainability 2022, 14, 12085. [Google Scholar] [CrossRef]
  34. Vieira Costa, J.A.; Cruz, C.G.; da Rosa, A.P.C. Insights into the Technology Utilized to Cultivate Microalgae in Dairy Effluents. Biocatal. Agric. Biotechnol. 2021, 35, 102106. [Google Scholar] [CrossRef]
  35. Gumbi, S.T.; Mutanda, T.; Olaniran, A.O. Nutrient Removal from Dairy and Poultry Wastewater with Simultaneous Biomass and Biodiesel Production by Chlorella Sp. T4 Isolated from a Freshwater Stream in South Africa. Waste Biomass Valor. 2021, 12, 6931–6943. [Google Scholar] [CrossRef]
  36. Wild, K.J.; Trautmann, A.; Katzenmeyer, M.; Steingaß, H.; Posten, C.; Rodehutscord, M. Chemical Composition and Nutritional Characteristics for Ruminants of the Microalgae Chlorella vulgaris Obtained Using Different Cultivation Conditions. Algal Res. 2019, 38, 101385. [Google Scholar] [CrossRef]
  37. Andersen, R.A. Algal Culturing Techniques; Elsevier/Academic Press: Burlington, MA, USA, 2005; ISBN 978-0-12-088426-1. [Google Scholar]
  38. AOAC International. Official Methods of Analysis of AOAC International, 22nd ed.; Latimer, G.W., Jr., Latimer, G.W., Jr., Eds.; Oxford University Press: Oxford, UK, 2023; ISBN 978-0-19-761013-8. [Google Scholar]
  39. Langhans, R.W.; Tibbitts, T.W. Plant Growth Chamber Handbook; Iowa State University of Science and Technology: Ames, IA, USA, 1997. [Google Scholar]
  40. Maramorosch, K.; Maramorosch, K. Tissue Culture: Methods and Applications by Paul F. Kruse, Jr., M.K. Patterson, Jr. J. N. Y. Entomol. Soc. 1974, 82, 201. [Google Scholar]
  41. Delgadillo-Mirquez, L.; Lopes, F.; Taidi, B.; Pareau, D. Nitrogen and Phosphate Removal from Wastewater with a Mixed Microalgae and Bacteria Culture. Biotechnol. Rep. 2016, 11, 18–26. [Google Scholar] [CrossRef]
  42. Åkerström, A.M.; Mortensen, L.M.; Rusten, B.; Gislerød, H.R. Biomass Production and Nutrient Removal by Chlorella Sp. as Affected by Sludge Liquor Concentration. J. Environ. Manag. 2014, 144, 118–124. [Google Scholar] [CrossRef]
  43. Whitton, R.; Le Mével, A.; Pidou, M.; Ometto, F.; Villa, R.; Jefferson, B. Influence of Microalgal N and P Composition on Wastewater Nutrient Remediation. Water Res. 2016, 91, 371–378. [Google Scholar] [CrossRef]
  44. Powell, N.; Shilton, A.N.; Pratt, S.; Chisti, Y. Factors Influencing Luxury Uptake of Phosphorus by Microalgae in Waste Stabilization Ponds. Environ. Sci. Technol. 2008, 42, 5958–5962. [Google Scholar] [CrossRef]
  45. Kim, W.; Park, J.M.; Gim, G.H.; Jeong, S.-H.; Kang, C.M.; Kim, D.-J.; Kim, S.W. Optimization of Culture Conditions and Comparison of Biomass Productivity of Three Green Algae. Bioprocess Biosyst. Eng. 2012, 35, 19–27. [Google Scholar] [CrossRef]
  46. Razzak, S.A.; Hossain, M.M.; Lucky, R.A.; Bassi, A.S.; de Lasa, H. Integrated CO2 Capture, Wastewater Treatment and Biofuel Production by Microalgae Culturing—A Review. Renew. Sustain. Energy Rev. 2013, 27, 622–653. [Google Scholar] [CrossRef]
  47. Beuckels, A.; Smolders, E.; Muylaert, K. Nitrogen Availability Influences Phosphorus Removal in Microalgae-Based Wastewater Treatment. Water Res. 2015, 77, 98–106. [Google Scholar] [CrossRef]
  48. Choi, H.J.; Lee, S.M. Effect of the N/P Ratio on Biomass Productivity and Nutrient Removal from Municipal Wastewater. Bioprocess Biosyst. Eng. 2015, 38, 761–766. [Google Scholar] [CrossRef] [PubMed]
  49. Wang, L.; Li, Y.; Chen, P.; Min, M.; Chen, Y.; Zhu, J.; Ruan, R.R. Anaerobic Digested Dairy Manure as a Nutrient Supplement for Cultivation of Oil-Rich Green Microalgae Chlorella Sp. Bioresour. Technol. 2010, 101, 2623–2628. [Google Scholar] [CrossRef]
  50. Silva, H.J.; Pirt, S.J. Carbon Dioxide Inhibition of Photosynthetic Growth of Chlorella. Microbiology 1984, 130, 2833–2838. [Google Scholar] [CrossRef]
  51. Lee, Y.-K.; Tay, H.-S. High CO2 Partial Pressure Depresses Productivity and Bioenergetic Growth Yield of Chlorella pyrenoidosa Culture. J. Appl. Phycol. 1991, 3, 95–101. [Google Scholar] [CrossRef]
  52. Cheng, L.; Zhang, L.; Chen, H.; Gao, C. Carbon Dioxide Removal from Air by Microalgae Cultured in a Membrane-Photobioreactor. Sep. Purif. Technol. 2006, 50, 324–329. [Google Scholar] [CrossRef]
  53. Klinthong, W.; Yang, Y.-H.; Huang, C.-H.; Tan, C.-S. A Review: Microalgae and Their Applications in CO2 Capture and Renewable Energy. Aerosol Air Qual. Res. 2015, 15, 712–742. [Google Scholar] [CrossRef]
  54. Kotrbáček, V.; Doubek, J.; Doucha, J. The Chlorococcalean Alga Chlorella in Animal Nutrition: A Review. J. Appl. Phycol. 2015, 27, 2173–2180. [Google Scholar] [CrossRef]
  55. Christaki, E.; Florou-Paneri, P.; Bonos, E. Microalgae: A Novel Ingredient in Nutrition. Int. J. Food Sci. Nutr. 2011, 62, 794–799. [Google Scholar] [CrossRef] [PubMed]
Figure 1. Pilot-scale photobioreactors at the UMN WCROC dairy in Morris, MN.
Sustainability 16 01382 g001
Figure 2. Cell density at lab scale during the experiment to find the best ratio of dairy wastewater (DW) in water.
Sustainability 16 01382 g002
Figure 3. Biomass productivity per day of experiment at lab scale to find the best ratio of DW in water. Primary vertical axis (on the left) is correspondent to the results for samples 1:10, 1:20, 1:30, and 1:40. Secondary vertical axis (on the right) is correspondent to the results for the control.
Sustainability 16 01382 g003
Figure 4. Daily phosphate concentration for the lab-scale experiment during the different ratios of DW in water experiments. The primary vertical axis (on the left) is correspondent to the results for the samples 1:10, 1:20, 1:30, and 1:40. The secondary vertical axis (on the right) is correspondent to the results for the control.
Sustainability 16 01382 g004
Figure 5. Nitrate concentration for the lab-scale experiment when evaluating the better sample of DW in water. The primary vertical axis (on the left) is correspondent to the results for samples 1:10, 1:20, 1:30, and 1:40. The secondary vertical axis (on the right) is correspondent to the results for the control.
Sustainability 16 01382 g005
Figure 6. Cell density at pilot scale during the experiment to find the best concentration of DW in water.
Sustainability 16 01382 g006
Figure 7. Biomass productivity per day of experiment at pilot scale during the experiment to find the best concentration of DW in water.
Sustainability 16 01382 g007
Figure 8. Daily phosphate concentration at the pilot scale for the different experiments. The primary vertical axis (on the left) is correspondent to the results for 1:10, 1:20, 1:30, and 1:40. The secondary vertical axis (on the right) is correspondent to the results for the control.
Sustainability 16 01382 g008
Figure 9. Ammonium concentration for the pilot-scale experiment when evaluating the better concentration of DW in water.
Sustainability 16 01382 g009
Figure 10. Shows the nitrate concentration for the pilot-scale experiment when evaluating the DW in water. The primary vertical axis (on the left) is correspondent to the results for samples 1:10, 1:20, 1:30, and 1:40. The secondary vertical axis (on the right) is correspondent to the results for the control.
Sustainability 16 01382 g010
Figure 11. Biomass productivity for the pilot-scale experiment when adding additional CO2.
Sustainability 16 01382 g011
Figure 12. Phosphate productivity for the pilot-scale experiment when adding additional CO2.
Sustainability 16 01382 g012
Figure 13. Nitrate productivity for the pilot-scale experiment when adding additional CO2.
Sustainability 16 01382 g013
Figure 14. Ammonium productivity for the pilot-scale experiment when adding additional CO2.
Sustainability 16 01382 g014
Table 1. Least square means for the ammonium concentration at lab scale during the experiment to find the best sample of DW in water (n = 20).
Sample
Day1:101:201:301:40Control
057.23724.83613.74511.6219.607
117.4982.9710.7290.4060.943
23.8530.5420.1880.1180.124
31.0000.2500.1710.1810.125
40.6570.2620.1380.1200.373
50.2060.1340.1130.0890.143
60.2340.1310.3410.3500.125
70.2690.157 0.075
Table 2. Biochemical analysis of Chlorella sp. biomass produced using dairy effluent.
AnalysisDry Weight (DW)Units
Protein49.2%
Fat2.32%
Carbohydrates38.5%
Fiber6.6%
Neutral detergent fiber32.8%
Acid detergent fiber11.6%
Ash9.91%
Total digestible nutrients71.6%
Digestible energy1.43%
Metabolizable energy1.23%
Calcium1.17%
Phosphorus1.70%
Potassium1.12%
Sodium0.48%
Iron5020ppm
Manganese157ppm
Zinc46ppm
Disclaimer/Publisher’s Note: The statements, opinions and data contained in all publications are solely those of the individual author(s) and contributor(s) and not of MDPI and/or the editor(s). MDPI and/or the editor(s) disclaim responsibility for any injury to people or property resulting from any ideas, methods, instructions or products referred to in the content.

