Abstract
Soil health indicators based on microbial biodiversity are increasingly used in agricultural sustainability assessments. However, little is known about how microbial communities vary within micro-environmental gradients across different land uses, which is crucial for designing field sampling and monitoring protocols. Our objective was to assess how soil microbial communities changed with soil depth and spatial distance across land-use types. We sampled soils in four spatial distances (within 0.1–70 m) and four depths (within 0–40 cm) in forests, grasslands, and horticultural lands, and combined 16S rRNA gene sequencing, DNA quantification and soil chemical characterization to explore micro-environmental variation in microbial biomass, α-β-diversity, and communities’ assembly processes. Depth and spatial distance had differential effects on microbial biodiversity within different land uses. Microbial biomass was most sensitive to depth, α-diversity to spatial distance, and β-diversity to both depth and spatial distance. Deterministic processes dominate microbial communities’ assembly along depth in all land uses, which is a promising result for developing soil quality indicators based on microbial biodiversity. Overall, our results suggest that collecting soil samples separated by at least 12 m is adequate to capture biodiversity changes across land uses. However, collecting randomly within the first 10 cm is recommended for native forests, while systematic sampling within the first 20 cm is advised for grasslands and horticultural lands. Our findings underscore the need for land use-specific sampling frameworks in soil life-based sustainability assessments for meaningful regional comparisons.
1. Introduction
Sustainability assessments in agricultural systems increasingly rely on measuring and monitoring soil characteristics and biological diversity and activity [1,2,3]. This is because soils can be conceptualised as complex and dynamic ecosystems that support key biological processes (e.g., nutrient cycling, bioremediation, or plant growth promotion) with a role in ecosystem services (e.g., primary production, pest and disease control, or greenhouse gas regulation) [4]. The maintenance of these ecosystem services depends closely on soil biodiversity [5]. Soil biodiversity is defined as “the variety of life belowground, from genes and species to the communities they form, as well as the ecological complexes to which they contribute and to which they belong, from soil micro-habitats to landscapes” [5]. This definition highlights the multidimensionality of soil biodiversity, covering the diversity, abundance, and activity of soil organisms, as well as the relationships among them.
In particular, soil microbial diversity is crucial for soil health—the continued capacity of soil to function as a vital living ecosystem that sustains plants, animals, and humans—[5,6] and sustainable land management [7,8]. Therefore, there is growing global interest in developing soil health indicators to monitor the impact of conservation and management strategies integrating soil microbial diversity [9,10]. However, soil microbial diversity is subject to large space and time heterogeneity [11,12,13,14], which poses serious challenges when establishing reference values for its longitudinal monitoring in sustainability assessments.
Soil microbial diversity is determined by both natural and anthropogenic factors operating at the global, regional, or local scale [15,16]. At the global scale, it has been recently reported that spatial patterns of microbial communities are best explained when interactions among vegetation cover, climate, and soil properties are considered [17]. Among the anthropogenic factors, changes in the abundance, composition, and trophic/genic networks of soil organisms have been reported as the result of land use intensification, farming systems and climate change [18,19,20,21,22,23,24]. Soil microbial diversity is also determined by micro-environmental variation across natural and managed ecosystems [7,25,26,27,28]; changes in soil physicochemical characteristics with spatial distance or depth have been revealed as crucial factors. Stochastic (i.e., random proliferation, death, and dispersal) and deterministic (i.e., inter-species interactions and environmental selection) processes could also differentially shape soil microbial communities. For example, the relative impact of stochastic and deterministic processes varies with the type of soil organisms, their relative abundance (rare vs. abundant organisms), and soil depth or spatial distance [29,30,31,32]. Such microvariability must be considered when designing sampling and monitoring schemes, especially because any indicator-based sustainability assessment requires reference values, such as benchmarks or desirable thresholds against which their values are to be compared. Knowledge about micro-environmental variation of soil microbial communities is therefore central for the development of soil health indicators across different ecosystems.
In forest frontier ecosystems, forest soils are often used as a benchmark to compare soil health indicators measured in other land-use types [33,34,35,36,37]. This is because forest soils are thought to harbour the original, native soil microbial diversity. Forests represent around one third of the global land, covering 4.06 billion hectares worldwide and harbouring most of the Earth’s terrestrial biodiversity, including soil microbial biodiversity [5,15,38]. Deforestation and forest degradation due to agricultural expansion remain major contributors to forest biodiversity loss [38]. Evidence indicates that following land conversion from native forests, there are changes in the abundance, diversity, and community composition of soil organisms, along with alterations in their micro-environmental organization. These changes are expected to impact ecosystem functionality [39,40,41], underscoring the importance of monitoring changes in soil microbial diversity. However, most monitoring indicators for soil biodiversity scarcely consider how soil communities vary at the micro-environmental scale and how these patterns change after land use conversion [42]. This knowledge is key to designing field sampling protocols for adequate monitoring of soil microbial diversity in sustainability assessments.
We hypothesized that the micro-environmental variation patterns of soil microbial communities in native forest differ from those in areas of alternative land use after land conversion. Therefore, we assessed the micro-environmental variation in soil microbial communities under contrasting land uses that differ in their degree of soil disturbance. In particular, we focus on (I) soil microbial communities, as they represent one of the major functional groups of soils organisms; (II) soil depth and spatial heterogeneity, as they are the main drivers of micro-environmental heterogeneity; and (III) the comparison of native forest and alternative land uses (i.e., grassland and horticulture) that represent common land use changes worldwide. In addition, we studied such variability around native temperate forest in Northern Patagonia (Argentina) where, as in other southern ecosystems, the environmental variation in soil microbial communities has been seldom studied [43].
2. Materials and Methods
2.1. Study Site and Soil Sampling Design
The study was conducted in El Manso Valley (41°35′ S, 71°38′ W), a subregion of the Comarca Andina del Paralelo 42° (CAP42). The CAP42 is an approximately 7500 km2 socio-ecological region located in northern Patagonia, Argentina, intersected by the 42nd parallel south of the equator (Figure 1a,b). In El Manso Valley, highly diversified crop–livestock smallholder farmers produce within a matrix of Nothofagus dombeyi-Austrocedrus chilensis mixed native forests. Crop production is mainly related to horticulture (especially vegetables), soft fruit (mainly berries), and, to a smaller extent, cereals. Meanwhile, the livestock is primarily composed of sheep and cows. Soils of this area are Andosols (FAO Soil Taxonomy) [44] of sandy-loam to silt-loam texture (average 12% clay, 46% silt, 42% sand) [45] and are characterized by high permeability, good drainage, high water retention capacity, and an abundant content of organic matter [46].
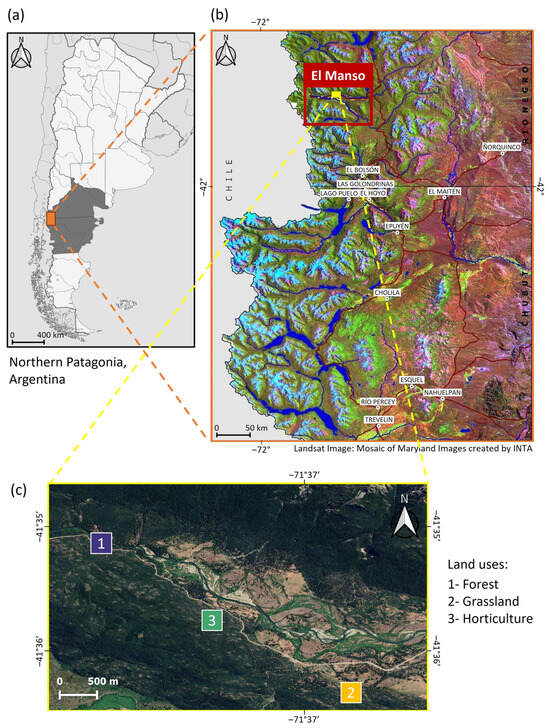
Figure 1.
Geographic location of the study site. (a) Argentinean provinces of Río Negro and Chubut in northern Patagonia, the boundary between both provinces is determined by the 42nd parallel south of the equator; (b) Comarca Andina del Paralelo 42° and location of El Manso Valley (in red); and (c) central part of El Manso Valley where the three land uses where sampled.
Current landscape heterogeneity in the study area originated from the land use conversion of native forests by the first farmer–settlers in the late 19th century, intensifying around 15 years ago. The three main land uses in the study area, representing a management intensity gradient, were selected for soil sampling: non-managed native forest and two alternative land uses, grassland and horticulture (Figure 2a). Land uses were separated by an average distance of 3 km, allowing comparisons among them by minimizing environmental variation (Figure 1c). In the case of horticulture, the main vegetables cultivated in mixed plots are Solanum tuberosum, Daucus carota, Allium sativum, Allium cepa, Spinacia oleracea, Beta vulgaris, Lactuca sativa, and Brassica oleracea, and tillage is performed by a two-wheel tractor at a maximum soil depth of 20 cm.
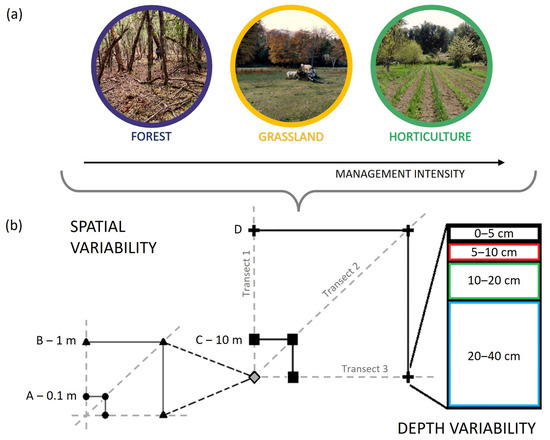
Figure 2.
Soil sampling design. (a) Land uses in a gradient of management intensity; (b) sampling design to evaluate micro-environmental variation considering spatial distance and depth. “D” distance corresponds to 50 m in forest, 46 m in grassland, and 32 m in horticulture.
In each land use area, the soil sampling design followed three transects of four distances: 0.1 m, 1 m, 10 m, and 50 m in forest, 0.1 m, 1 m, 10 m, and 46 m in grassland, and 0.1 m, 1 m, 10 m, and 32 m in horticultural land (Figure 2b). The variation in the maximum distance responded to the field size, which was smaller in horticultural land uses. The maximum spatial distance between samples was 70 m (diagonally). Four soil sampling depths were considered: 0–5, 5–10, 10–20, and 20–40 cm (Figure 2b). This sampling design resulted in 48 (3 × 4 × 4) soil samples for each land use, totalling 144 soil samples. The sampling scheme was designed to generate variable distances, which allows for evaluating the spatial autocorrelation of soil observations through geostatistical analysis (see below), while it was also adequate to support all other analyses. Soil samples were air-dried and sieved through 2 mm mesh, homogenised, and stored at room temperature for further analyses.
2.2. Soil Microbial Biomass and Chemical Characteristics
Soil microbial diversity is commonly the primary and often the sole dimension of biodiversity included in biological soil assessments. Expanding this to include other dimensions of biodiversity could provide new insights into the occurrence of common or differentiated variation patterns. Therefore, we included an analysis of soil microbial biomass to complement the assessments of soil microbial diversity. Soil microbial biomass was estimated by quantification of soil DNA extractions. This method for the estimation of soil microbial biomass has been previously validated and used for different soil types [47,48,49,50,51,52]. Soil DNA was quantified for each sample by spectrophotometry at 260 nm (NanoDrop One/Onec, Isogen life science, De Meern, Utrecht, The Netherlands). The accuracy of DNA quantification by spectrophotometry was validated by fluorescence-based DNA quantification (Qubit, Invitrogen, Waltham, MA, USA) on a subset of the samples, showing a significant linear correlation between measures with a Pearson’s R of 0.86 (Figure S1).
Additionally, we assessed soil chemical characteristics to evaluate their correlation with soil microbial biomass and soil microbial diversity. Soil pH and electric conductivity (EC) were determined for all samples after soil suspension in water (1:2.5 ratio) [53]. Total carbon and nitrogen were determined for samples of the first three depths (0–5, 5–10, and 10–20 cm) by combustion (900 °C) in a carbon–nitrogen analyser (Thermo Electron Corporation, Waltham, MA, USA, NC Soil analyzer Flash EA 1112) [53]. The C/N ratio was calculated based on total C and N measures. All soil characteristics were determined at the Soil laboratory of the Centro Regional Universitario Bariloche–Universidad Nacional del Comahue.
2.3. Bacterial and Archaeal Diversity Characterization based on 16S Amplicon Sequencing
Amplicon sequencing is one of the methods most frequently used for microbial diversity characterization [54]. Different amplicon regions (i.e., the region of the genome that is amplified and sequenced) have been traditionally used to characterize different organism groups (e.g., 16S rRNA gene for procaryotes, and 18S rRNA gene or ITS region for eucaryotes). We focused on the 16S rRNA gene that encodes a conserved component of the DNA transcriptional machinery, and we particularly amplified a region of this gene from soil bacteria and archaea. Therefore, soil microbial diversity characterization covered only these two groups of soil microorganisms. Soil DNA extractions were performed using 0.25 mg of soil and the PowerSoil DNA Isolation Kit (MoBio Laboratories Inc., Carlsbad, CA, USA) following the manufacturer’s instructions. Soil DNA extractions were submitted to the University of Minnesota Genomics Center (UMGC) for Illumina Sequencing. MiSeq Illumina sequencing (paired-end 2 × 300 bp) was focused on the V4 hypervariable region of the bacterial and archaeal 16S rRNA gene using the 515F (5′-GTGCCAGCMGCCGCGGTAA-3′) and 806R (5′-GGACTACHVGGGTWTCTAAT-3′) primer pair [55].
The 16S rRNA sequence data were processed using the Quantitative Insights Into Microbial Ecology pipeline (QIIME2 version 2020.8, https://docs.qiime2.org/2020.8 (accessed on 7 September 2021)) for the data set [56]. The demultiplexed sequences were truncated to 240 bp on forward reads and to 200 bp on reverse reads and denoised to infer Amplicon Sequence Variants (ASVs, DNA sequences distinguished by a single nucleotide change) using DADA2 plugin with default settings [57]. All ASVs affiliated with eukaryotes, chloroplasts and mitochondria, and singletons (ASVs with only one sequence) were removed from the dataset. Soil microbial diversity characterization focused on α-diversity (diversity of the community within the sample) and β-diversity (diversity of the communities between samples). In both cases analyses were performed with and without consideration of phylogeny. To make soil samples comparable, the ASVs table was rarefied to a depth of 1200 sequences per sample. For the analysis of changes in community composition with soil depth, taxonomy of ASVs was assigned using the Silva 138 Naive Bayes 515F/806R taxonomy classifier [58].
Microbial α-diversity was estimated by community richness (observed number of ASVs) and the Shannon–Wiener and inverse Simpson indices, while phylogenetic α-diversity was estimated using Faith’s PD index. To calculate Faith’s PD index, we initially generated a de novo phylogenetic tree from ASVs by aligning sequence fragments via MAFFT [59], masking ambiguous alignments, and inferring a tree using the FastTree algorithm [60]. Then, a rooted tree was created by putting the root at the midpoint of the farthest tips. Afterwards, the calculation of Faith’s PD index involves summing the branch lengths of the phylogenetic tree that represent the evolutionary relationships among the ASVs in a community. A lower Faith’s PD value suggests low phylogenetic diversity, indicating closely related species or a recent common ancestor; while a higher value suggests greater phylogenetic diversity, representing more distantly related species or a broader range of evolutionary history. Estimates of the Shannon–Wiener and inverse Simpson indices were calculated using the function ‘estimate_richness’ from the R package phyloseq [61], while Faith’s PD index was calculated using QIIME2 version 2020.8.
Shannon–Wiener index was calculated according to Equation (1),
where indicates the total number of ASVs (richness), and corresponds to the proportion of total sample represented by ASVi. The negative sign is applied to the entire summation, making the index a positive value. A higher Shannon–Wiener index value indicates greater biodiversity.
Inverse Simpson index was calculated according to Equation (2),
where indicates the total number of ASVs (richness), and corresponds to the proportion of total sample represented by ASVi. A higher inverse Simpson’s index value indicates higher diversity.
Microbial β-diversity was estimated using Bray–Curtis and weighted UniFrac (phylogenetic) dissimilarity distance matrices of ASVs. To calculate the weighted UniFrac matrix the phylogenetic tree previously described was used. Bray–Curtis and weighted UniFrac matrices were calculated using QIIME2.
Bray–Curtis’ matrix was calculated according to Equation (3),
where and represent the relative abundances of the i-th ASV in a pair of samples. The summation is performed over all ASVs. The Bray–Curtis dissimilarity ranges from 0 to 1, where 0 indicates identical compositions, and 1 indicates completely different compositions.
Weighted UniFrac matrix was calculated according to Equation (4),
where is the number of ASVs, represents the weight assigned to the i-th ASV, corresponding to the relative abundance, and is the phylogenetic distance associated with the i-th ASV. The weighted UniFrac dissimilarity ranges from 0 to 1, where 0 indicates identical compositions, and 1 indicates completely different compositions.
2.4. Statistical Analyses
All subsequent analyses were carried out in R (v 4.2.1) [62,63] and focused on micro-environmental variation within each land use. To examine the effect of soil depth and spatial distance on microbial biomass and α-diversity indices the nonparametric two-way Scheirer–Ray–Hare (SRH) test was applied using the ‘scheirerRayHare’ function from the R package rcompanion [64,65]. We used the SRH test because ANOVA assumptions (i.e., normal distribution and homogeneity of variance) were not verified. For the SRH test, the spatial distance was considered a categorical variable with four levels (A to D, each level including samples of the three sampling points located at 0.1, 1, 10, and 50 m). A post hoc nonparametric pairwise multiple comparisons tests (Dunn’s test) was performed using the function ‘dunnTest’ from the R package FSA [66,67].
Additionally, the spatial micro-environmental variation of microbial biomass and α-diversity indices was analysed by calculating a semivariogram using ‘variog’ and ‘variofit’ functions in the R package geoR [68]. The semivariogram analysis allows the evaluation of differences in pairwise distance among all samples, complementing analyses based on distance classes (i.e., SRH test). A semivariogram represents the spatial autocorrelation of the samples at different sampling points with respect to a measured variable. For each pair of samples, their spatial distance (Euclidean distance) and the semivariance of the measured variable are calculated. Once each pair of samples has been plotted, according to the empirical semivariogram, a model is fitted across them, shaping the empirical semivariogram. In a semivariogram, the nugget is the semivariance value (y-axis) at zero distance, the sill is the semivariance value (y-axis) at which the model is flatted (constant value of the variogram when the samples do not influence each other), and the practical range (limit of spatial dependence) is the distance value (x-axis) at which the model reaches the sill. Samples separated by distances shorter than the practical range are spatially autocorrelated. For this analysis, the spherical model was fitted to the empirical semivariograms, and the nugget, sill, and practical range were then determined. Spatial autocorrelation occurs when observations at nearby locations are more similar to each other than expected, by chance. Semivariograms help researchers detect the occurrence and understand the characteristics of spatial autocorrelation.
Principal Coordinates Analysis (PCoA) was used, for each land use, to visualize microbial community structure and its association with soil depth and spatial distance. The analyses were based on the Bray–Curtis and weighted UniFrac distance matrices previously calculated and were performed using the function ‘pcoa’ from the R package ape [69]. Permutational multivariate analysis of variance (PERMANOVA) was used to examine the effect of depth and spatial distance on microbial community structure. The analyses were based on Bray–Curtis and weighted UniFrac distance matrices using the ‘adonis2’ function in the R package vegan [70]. A post hoc pairwise multiple comparisons test was performed using the ‘pairwise.adonis2’ function from the R package pairwiseAdonis [71] for significant factors (simplest PERMANOVA model). The analysis of multivariate homogeneity of group dispersions (variances) was performed with the function ‘betadisper’ from the R package vegan, which implements the PERMDISP2 procedure. Considering the PERMANOVA results (see below), a SIMPER (Similarity Percentage) analysis was additionally performed to assess the main taxonomic groups responsible for the difference in community assembly among different depths. The analysis was performed on a Bray–Curtis matrix based on the taxonomical assignation of AVSs at the phylum level and using the function ‘simper’ from the R vegan package.
During field sampling, the maximal spatial distance (D distance in Figure 2b) was not equal for all land uses (i.e., forest 50, grassland 46, and horticulture 32 m). Therefore, to evaluate the potential impact of these differences on micro-environmental variation, the correlation between Bray–Curtis and weighted UniFrac distance matrices and the Euclidean distance matrix of spatial distance was calculated. The statistical significance of the comparisons was determined by Mantel’s statistic based on Spearman’s rank correlation with 9999 permutations, adding the distances sequentially to estimate the ’punctual’ (samples of A distance), ’micro’ (samples of A and B distances), ’meso’ (samples of A, B, and C distances), and ’macro’ (samples of all distances) variability. The analysis was performed using the ‘mantel’ function of the vegan R package. The highest distance value in each sequential Euclidean distance matrix of spatial distance for forest, grassland, and horticultural land was considered as the maximal distance between samples for each land use.
Based on the results of the sequential Mantel test, distance matrices of Bray–Curtis, weighted UniFrac, β-nearest taxon index (β-NTI) and Bray–Curtis-based Raup–Crick metric (RCbray) indices were regressed against Euclidean distance matrix of spatial distance by depth. The β-NTI index compares the observed phylogenetic turnover in species between pairs of communities and a null distribution while the RCbray compares the ASV turnover between a pair of communities and the null distribution. Both indices were calculated according to Jia et al. [72] following the procedure detailed in Supplementary Information.
The relative influence of deterministic (homogeneous selection and variable selection) and stochastic (homogenizing dispersal, dispersal limitation, and undominated) processes on community turnover were assessed according to Stegen et al. [73]. The combination of the β-NTI and the RCbray was used to estimate the relative influence of each process on microbial assembly and the variation according to soil depth for each land use [74,75]. |β-NTI|> 2 indicates that observed phylogenetic turnover between a pair of communities is significantly less than or greater than expected by chance and is governed primarily by deterministic processes. The relative contribution of homogeneous and variable selection was estimated as the percentage of pairwise β-NTI values < (−2) and >2, respectively. On the other side, |βNTI| < 2 indicates the absence of selection, and a greater influence of stochastic processes. In these cases, the relative contribution of homogenizing dispersal and dispersal limitation was estimated as the percentage of pairwise RCbray metric values < (−0.95) and > 0.95, respectively. The combination of |βNTI| < 2 and |RCbray| < 0.95 indicates that both phylogenetic and ASVs community turnover in observed communities are not different from the expected by chance. Hence, neither selection nor dispersal dominates the assembly processes but their influences on community turnover act together with drift, thus being designated as ‘undominated processes’. Considering the results reported by Tripathi et al. [76], revealing that soil pH mediates the balance between stochastic and deterministic processes in the assembly of soil bacterial communities, the β-NTI values were regressed against Euclidean distance matrices of soil pH calculated using the function ‘vegdist’ from vegan R package for each land use and by depth.
Finally, a partial Mantel’s test (based on Spearman’s rank correlation with 9999 permutations) was used to evaluate the correlation of microbial biomass (DNA), richness and Faith’s PD index, and Bray–Curtis and weighted UniFrac distance matrices with the distance matrix of soil chemical characteristics and the Euclidean spatial distance. Partial Mantel’s test allows us to evaluate the correlation between two distance matrices but controlling by the effect of a third distance matrix. In this case, using the spatial distance matrix as a controlling matrix permit removing the spatial autocorrelation between soil samples and evaluating the ‘pure’ effect of the correlation between soil biological and chemical property matrices. This control was performed by calculating the correlation between the residuals of each of the two main distance matrices after a linear regression on the third distance matrix. The analysis was performed by the ‘mantel.partial’ function in the R package vegan, and visualized using the R package ggcor [77], along with Pearson’s correlation of soil chemical characteristics (i.e., pH, EC, Total C, Total N, and C/N). We excluded the data from the deepest layer (20–40 cm) for this analysis due to the missing data for this depth on total C and N.
3. Results
3.1. Micro-Environmental Variation Patterns
3.1.1. Soil Microbial Biomass
Soil microbial biomass was affected by soil depth and spatial distance, while no significant depth × distance interactions were detected according to the SRH test (Table S1). Soil microbial biomass decreased with depth in each land use. However, the decrease in microbial biomass in forest soils distinguished two main groups of soil depths (0–10 vs. 10–40 cm—Figure 3a). In grassland soils, the decrease followed a transition along depth (Figure 3b), and in the horticultural land only the 0–5 cm of topsoil differed statistically from the rest of the soil depths (Figure 3c). Spatial distance only affected microbial biomass in the horticultural land (Table S1, Figure S2). In this type of land use, the microbial biomass of samples from spatial distance classes A and B (0.1 and 1 m, respectively) was higher than that of samples from spatial distance class C (10 m). In comparison, the microbial biomass of the distance class D (32 m) was not different from the other classes (Figure S2c). Spatial autocorrelation was not detected for microbial biomass, except for the horticultural land where spatial autocorrelation was detected at 8.7 m among samples of 10–20 cm depth (Figure S3).
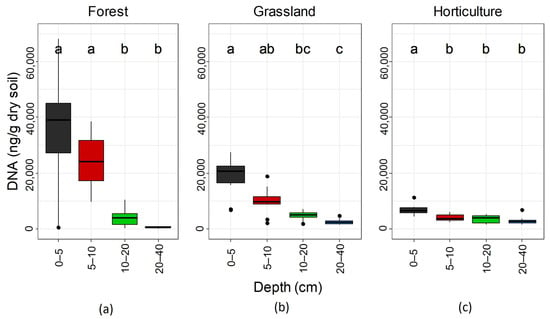
Figure 3.
Depth effect on soil microbial biomass (estimated by quantification of soil DNA extraction) in (a) forest, (b) grassland, and (c) horticultural land. Different letters above boxes indicate significant differences in pairwise comparisons (Dunn’s test; p < 0.05).
3.1.2. α-Diversity
Spatial distance significantly affected α-diversity in the forest and horticultural land. In contrast, no effect of depth or the interaction depth x spatial distance was detected in the forest, grassland, or horticultural land (Table S1). In the forest, lower values of richness and lower Shannon–Wiener and inverse Simpson indices were detected for spatial distance class A than for class D, while lower values of Faith’s PD were detected for spatial distance class A than for class C (Table 1). Conversely, higher values of all α-diversity indices were detected in the horticultural land for spatial distance classes A and B than for class D, with intermediate values for class C (Table 1). No impact of spatial distance on α-diversity indices was detected in the grasslands (Table S1). Species richness exhibited spatial autocorrelation in the forest at 8.3 m among samples of 20–40 cm depth and in the grassland at 7.6 m among samples of 5–10 cm depth (Figure 4a,b). A similar pattern was detected for the Shannon–Wiener and inverse Simpson indices (Figure S4A,B). Similarly, Faith’s PD index showed spatial autocorrelation in the forest at 8.7 m among samples of 20–40 cm depth and in the grassland at 7.5 m among samples of 5–10 cm depth (Figure 4d,e). Spatial autocorrelation in horticulture was only detected for the Shannon–Wiener index at 12.3 m among samples of 0–5 cm depth (Figure S4A,B).

Table 1.
Mean value of α-diversity index according to spatial distance classes in forest, horticultural, and grassland soils.
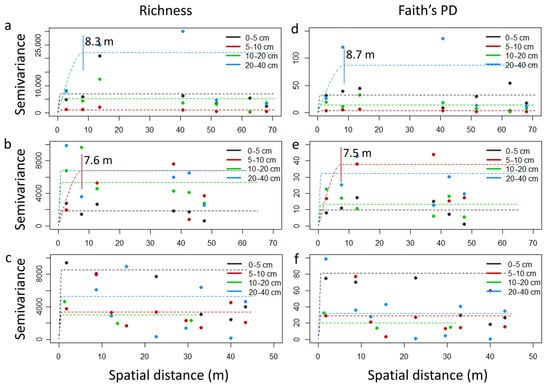
Figure 4.
Micro-environmental variation patterns of α-diversity. Empirical semivariograms (dots) and spherical fitted model (dash lines) for richness (a–c) and Faith’s PD (d–f) indices in forest (a,d), grassland (b,e), and horticultural (c,f) soils. Vertical lines indicate the limit of spatial dependence and the corresponding practical range value in cases where autocorrelation exist. (a–f) are provided in higher resolution as Supplementary Figure S5A,B.
3.1.3. β-Diversity
PCoA analysis for Bray–Curtis’ distance matrix only explains a mean of 7,4% of the data variation when the two first dimensions are considered (Figure S6a–c); to explain at least 50% of the variation, ~17 dimensions would have to be considered. In the case of PCoA analysis for the weighted UniFrac distance matrix, the first two dimensions explain a mean of 36% of the data variation (Figure S6d–f) and ~5 dimensions would have to be considered to explain 50% of the data variation. Globally, a trend of higher community structure was detected for the forest than for the grassland or horticultural land. PERMANOVA revealed an effect of depth and spatial distance on β-diversity, while no effect was detected for their interaction. Different patterns of micro-environmental variation were detected among land uses (Table S2). In the forest, soil microbial community composition was only affected by depth, while in grasslands and horticultural land, it was affected by depth and spatial distance. The pairwise contrast revealed that, in the forest, the community turnover was similar among depth classes, being more robust when the phylogenetic distance was considered (Figure S7). Conversely, in grasslands and horticultural land, the community turnover was only detected among some depth or spatial distance classes and the patterns were stronger when the phylogenetic distance was considered (Figure S7). In the grassland, significant differences were mainly detected at 10–20 cm depth; while in the horticultural land the statistically different classes were 0–5 and 20–40 cm. Regarding community turnover among spatial distance classes, classes A (0.1 m) and C (10 m) differed significantly in the grassland and A (0.1 m) and D (32 m) differed significantly in the horticultural land.
In the forest, sequential Mantel’s tests showed no correlation between the Bray–Curtis matrix and the spatial distance matrix (Table 2). The same result was obtained for the weighted UniFrac matrix (Table 2). In contrast, for the grassland and horticultural land, the spatial distance matrix showed a strong positive correlation with both matrices (Bray–Curtis and weighted UniFrac) for distances greater than 1.4 m. Even for the grassland, the correlation with the Bray–Curtis matrix was significant at distances smaller than 1.4 m (Table 2). Therefore, correlation analyses between the diversity distance matrices and the Euclidean distance of spatial distance were not influenced by differences in maximal spatial distance of sampling among land uses.
Table 2.
Mantel’s statistic based on Spearman’s rank correlation (9999 permutations) of β-diversity distance matrices vs. Euclidean pairwise distance of spatial distance among samples by land use.
In fact, significant correlations were globally not detected in the forest, except for a negative correlation for the weighted UniFrac matrix at 0–5 and 20–40 cm depths (Figure 5). Conversely, the dissimilarity in microbial communities showed a significant correlation with spatial distance in the grassland and horticultural land (Figure 5). In the horticultural land, the dissimilarity in microbial communities increased with spatial distance, and the correlation was stronger at lower depths. In grassland, on the other hand, although the correlation was stronger at lower depths, the decrease in the correlation with depth was also associated with a change in its sense (from positive to negative). This pattern was stronger when considering the phylogenetic distance between communities (Figure 5b). For the β-nearest taxon index (β-NTI) a similar trend was detected; while for the Raup–Crick (Bray–Curtis) dissimilarity index, some differences were detected within each land use (Figure S8).
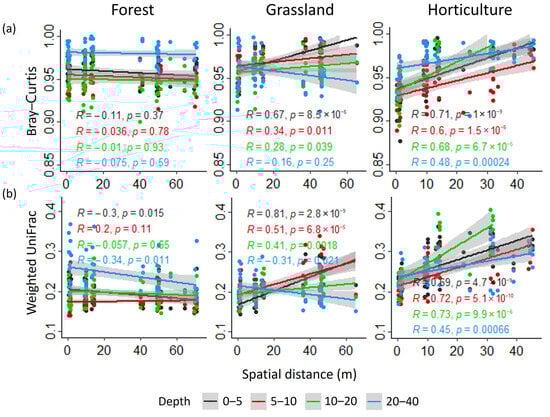
Figure 5.
Micro-environmental variation patterns of β-diversity. Correlation of (a) Bray–Curtis and (b) Weighted UniFrac distance matrices and Euclidean distance matrix of spatial distance for each soil depth at each land use.
3.1.4. Changes in the Relative Abundance of Taxa
SIMPER analysis revealed that changes in bacterial and archaeal phyla contributed to differences among soil depth classes within each land use (Figure S9). In particular, Acidobacteriota, Actinobacteriota, Bacteroidota, Chloroflexi, Planctomycetota, Proteo-bacteria, Thermoplasmatota, and Verrucomicrobiota were the most important phyla contributing to community turnover among depth classes in the forest, grasslands, and horticultural lands (Figure S10). Firmicutes and Myxococcota also contributed to community turnover in the forest and horticultural land. In contrast, Crenarchaeota contributed to community turnover in the grasslands and horticultural land (Figure S10). In the forest, a decreasing trend in the relative abundance of Actinobacteriota was detected along the depth. At the same time, Firmicutes only appeared below 10 cm depth, and Thermoplasmatota between 5 and 20 cm depth. In grasslands, a decreasing trend in Bacteroidota and Myxococcota and an increasing trend in Crenarchaeota and Chloroflexi were detected along the depth, while Thermoplasmatota appeared below 10 cm depth. In the horticultural land, a decreasing trend in Myxococcota and a growing trend for Acidobacteriota along depth was detected, while Thermoplasmatota appeared below 20 cm depth. Globally, the first depth class (0–5 cm) showed a higher relative abundance of Proteobacteria and Bacteriodota and a lower relative abundance of Chloroflexi than the other depth classes. Moreover, a decrease in the relative abundance of Acidobacteria, Proteobacteria, and Planctomycetota, and an increase in Actinobacteriota, Chloroflexi, Crenarchaeota, and Firmicutes followed land conversion from forest to horticultural land.
3.2. Processes Governing Microbial Community Assembly
Deterministic processes, mainly represented by homogeneous selection, dominated microbial communities’ assembly in all land uses. However, within each land use, differences were detected in the relative influence of stochastic processes on community assembly along the depth (Figure 6a). In the forest, dispersal limitation showed the highest impact on community assembly in the 20–40 cm depth class, while undominated processes influenced community assembly in the 0–5 and 20–40 cm depth classes (Figure 6a). In grasslands, dispersal limitation showed greater influence on community assembly at 0–5 and 5–10 cm than in the 10–20 and 20–40 cm depth classes (Figure 6a). In the horticultural land, the contribution of these stochastic processes was mainly important at the 10–20 cm depth (Figure 6a). Moreover, the importance of deterministic vs. stochastic processes on the assembly of soil microbial communities was correlated with soil pH in grasslands and horticultural land but not in the forest (Figure 6b). Patterns of this correlation showed, however, differences for both grassland and horticultural land. In the horticultural land, a correlation was detected at all depths, being especially strong at the 5–10 and 10–20 cm depths. The correlation was globally weak in grasslands at all depths and only significant at a depth of 10–20 cm. Positive correlations indicate that, as the difference in soil pH increased, the contribution of stochastic processes to microbial community assembly also increased.
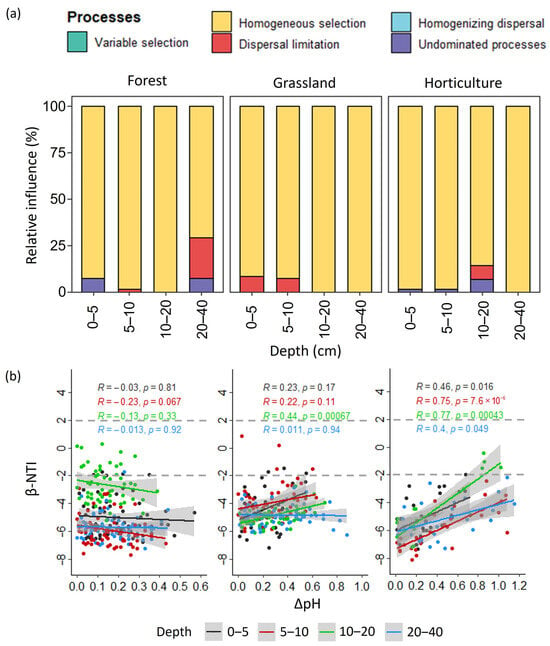
Figure 6.
Processes governing microbial community assembly. (a) Relative contribution of deterministic (homogeneous selection, variable selection) and stochastic (homogenizing dispersal, undominated processes, dispersal limitation) assembly processes on community turnover; (b) Correlation between β-NTI and differences in soil pH among depth classes in each land use.
3.3. Chemical Drivers of Micro-Environmental Variation
Partial Mantel’s tests showed strong correlations between soil microbial biodiversity variables and soil chemical characteristics, although different patterns were detected for each land use (Figure 7). In the forest, the number of correlations showed the following trend: Bray–Curtis (5) > weighted UniFrac and microbial biomass (4) > richness and Faith’s PD (1). Globally, correlations with electric conductivity (EC), total N, and total C were stronger than correlations with pH or C/N ratio. No correlations with pH were detected in grasslands, and richness and Faith’s PD showed no correlation with any soil chemical property. Microbial biomass and weighted UniFrac showed the highest number of correlations (4), while Bray–Curtis showed a lower number of (3) and weaker values for correlations with soil chemical characteristics. A similar pattern was detected for horticultural land, although pH correlation was also seen for weighted UniFrac. Interestingly, pHs correlation with EC, total C, total N, and C/N ratio showed different patterns according to land use. Comparing forest to grassland, significant correlations were lower and among different chemical characteristics (Figure 7). Comparing forest to horticulture, significant correlations of pH with other soil variables were completely inversed (from negative to positive correlations), and the correlation with C/N ratio that was not detected in forest was also added (Figure 7). Means and standard deviations of soil chemical characterization by depth and spatial distance class are shown on Table S3 and Table S4, respectively.
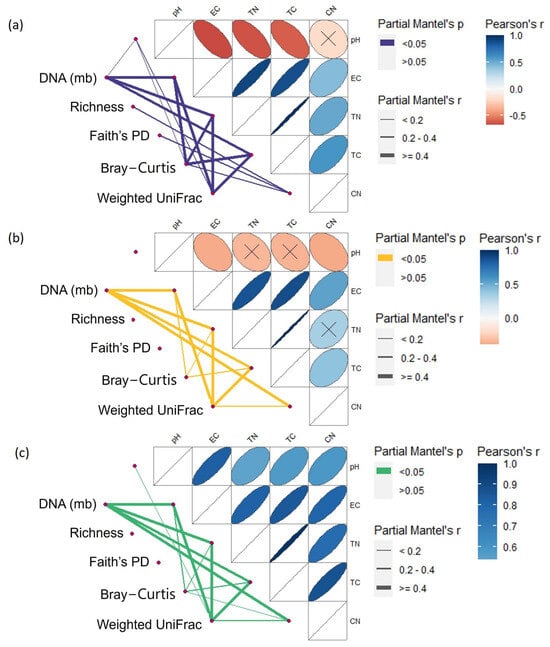
Figure 7.
Chemical drivers of micro-environmental variation. Correlation of quantification of soil DNA extraction (microbial biomass), richness, Faith’s PD index, Bray–Curtis, and weighted UniFrac distance matrices with distance matrix of soil chemical characteristics for forest (a), grassland (b), and horticultural (c) land uses combining 0–5, 5–10, and 10–20 cm depths. Pairwise comparisons of soil characteristics are shown with a colour gradient representing Pearson’s correlation coefficients, and crosses denote non-statistically significant correlations (p > 0.01). Edge width corresponds to the partial Mantel’s r statistic for the corresponding distance correlations (controlling for the effect of spatial distance matrix), and edge colour represents the statistical significance based on 9999 permutations. EC: electric conductivity; TN: total nitrogen; TC: total carbon; CN: carbon/nitrogen ratio.
4. Discussion
The analysis of soil microbial biodiversity in native forests, grasslands, and horticultural land indicates that small variations in both soil depth and spatial heterogeneity affected soil microbial diversity differently (Figure 4, Figure 5 and Figures S5–S7; Table 1, Table 2, Tables S1 and S2). Our results indicate that deterministic processes dominate microbial communities’ assembly along depths in all land uses, while the contribution of stochastic processes varied across land uses (Figure 6a). The phylogenetic diversity indices showed stronger patterns than indices based only on sequence data, but the combination of both is crucial for evaluating the relative influence of deterministic and stochastic processes (Figure 5, Figures S7 and S8). Further, the correlation between soil chemical characteristics and soil microbial diversity indices changed after land use conversion, and the relative contribution of deterministic and stochastic processes correlated with pH after conversion (Figure 6b and Figure 7). In the following sections, we discuss the implications of our findings for the design of sampling schemes for monitoring soil health through soil microbial diversity in sustainability assessments.
4.1. How to Sample for Soil Microbial Biodiversity Studies?
In recent years, especially since high-throughput sequencing technologies became more widely accessible, several studies focused on the effects of land use change or agricultural intensification on soil biodiversity at the macro-environmental scale [78,79,80]. However, our results revealed that soil biodiversity also varied at a micro-environmental scale and that the detected patterns differ across land uses. We showed that depth and spatial distance are important factors regulating the micro-environmental variation in soil biodiversity indices. Furthermore, we showed that the effect of depth and spatial distance differed among biological variables across land uses. In general terms, in our study, microbial biomass was sensitive to soil depth (cf. Figure 3, Figures S2 and S3, Table S1), α-diversity was affected by spatial distance (cf. Figure 4 and Figure S4, Table 1 and Table S1), and β-diversity was affected by both soil depth and spatial distance (cf. Figure 5 and Figure S7, Table S2). These results highlight that micro-environmental variation in different aspects of soil biodiversity should be considered during sampling design for the assessment and monitoring of soil use and management.
In the case of the forest soil analysed here, the variation in soil microbial biomass, α-diversity, and β-diversity indicate that, globally, soil microbial communities have high a micro-environmental variation but also that this variation was mostly homogenously distributed and not autocorrelated. This means that a random collection of topsoil samples (0–10 cm depth) separated at least by 10 m should be adequate to capture the micro-environmental variation in soil microbial communities (cf. Figure 3, Figure 4 and Figures S4–S7). However, a different pattern of micro-environmental variation in soil biodiversity indices was observed in the alternative land uses.
Horticultural soil exhibited high variability, and this variation was heterogeneously distributed and autocorrelated. The differences observed between forest and horticultural land could be associated with land fragmentation due to horticultural practices and soil management effects, such as tillage, planting rows separated by bare soil (inter-rows), fertilization, irrigation in cultivated rows, high crop rotation, low density, and the penetration of plant roots [35]. Regarding designing a sampling scheme for assessing this horticultural soil, results indicate that soil microbial biodiversity characterization should consider the regular collection of soil samples separated at least by 12 m (according to autocorrelation results) and covering the first 20 cm of soil depth (cf. Figure 3, Figure 4 and Figures S4–S7).
In the case of grassland soil, variation with space and depth was less intense than in horticultural land, and could mostly be explained by soil compaction, low organic matter input, high nitrogen input, high density of roots but with less rooting depth, all of which are associated with continuous animal grazing [81]. The results indicate that soil microbial biodiversity characterization of grassland in our study conditions should consider the regular collection of soil samples separated at least by 8 m (according to autocorrelation results) and covering the first 20 cm of depth (cf. Figure 3, Figure 4 and Figures S4–S7).
Hence, the observed patterns suggest that a standardized soil sampling method, i.e., same depth range and spatial distance, would not necessarily capture the same type and magnitude of soil microbial variability across different land uses. However, a simple sampling design could be proposed considering the detected differences across land uses. Based on our results, the collection of soil samples separated at least by 12 m should be adequate to capture soil biodiversity changes across these land uses, considering a random collection covering the first 10 cm of soil for native forests and a regular collection covering the first 20 cm of soil for grasslands and horticultural lands. However, this sampling design should be validated through further research, incorporating new cases of forests, grasslands, and horticulture, as well as other land uses not considered in this study (e.g., managed forests, perennial crops, among others).
4.2. Why Consider the Micro-Environmental Scale in the Development of Biodiversity-Based Indicators of Soil Health
The decrease in microbial biomass with depth, observed in the forest, grassland, and horticultural soils, is consistent with previously reported results from different land uses, such as grasslands, croplands, and forests [28,82]. In our study, soil depth variation patterns differed across land uses, mainly due to the greater microbial biomass present in forest topsoil (cf. Figure 3). Such patterns of decreasing microbial biomass with soil depth across land uses was also detected for soil chemical characteristics, such as total C and N (cf. Table S3). These patterns have been previously associated with the effect of tillage [83,84,85]. Grazing may affect the rooting pattern of grazed species and create differential soil compaction [86], hence changing soil characteristics and nutrient availability. The grassland analysed in our study was not established through tillage and the sowing of fodder species, but simply by removing the forest and letting the spontaneous herbaceous vegetation colonise the soil. Spatial micro-variability may also be associated with the spots where trees grew before deforestation took place, as seen in other studies [87].
Spatial autocorrelation of microbial biomass variables was previously reported at different scales and land uses by several authors [88,89,90,91]. The decrease in microbial biomass with spatial distance in horticultural land could be affected by the spatial pattern of cropping activities. Soil samples taken at 0.1–1 m have a high chance of belonging to cropping rows and those taken 10 m away have the chance of falling in the inter-row space, while those taken at 32 m distance may include even greater variability and fall within a different horticultural field plot. Heterogeneity may also be associated with fertilization and tillage patterns, influencing the autocorrelation results and explaining the correlation we observed with chemical soil characteristics (pH, electric conductivity, total C, total N, and C/N ratio). Differences in soil microbial biodiversity and chemical characteristics between soil samples from row and inter-row have been previously reported in raspberry production in this region [35]. In grasslands, spatial micro-variability patterns may result from animal depositions, differential trampling or selective grazing of most palatable species [92].
We found that α-diversity was only affected by spatial distance, which is consistent with the results reported previously at multiple scales [93,94,95,96]. Nonetheless, other works have found that α-diversity is also affected by soil depth [97,98,99]. These differences reinforce the idea that the microenvironment could have differential effects on soil biodiversity across land uses, geographies, climates, or soil history, among other factors. Considering soil chemical characteristics, the C/N ratio was the only variable that correlated with α-diversity in the forest. The low variation in the C/N ratio for grassland and horticulture could explain the absence of correlation.
On the other hand, β-diversity showed a more complex behaviour, as it was affected by both depth and spatial distance. Multiple studies suggest that changes in microbial community composition are greater between sites than within sites and that microorganisms are specialized to certain environments (e.g., land uses) [21]. In addition, the prevalence of deterministic processes in the assemblage of soil microbial communities is a promising outcome in developing biodiversity-based indicators of soil health since changes in communities can then be explained by land uses.
Furthermore, we deem it crucial to consider both diversity estimators (α-diversity and β-diversity) based on presence/absence (e.g., richness) or abundance data (e.g., Shannon–Wiener or Simpson indices, Bray–Curtis distance), as well as estimators based on phylogeny (e.g., Faith’s PD index, UniFrac distance). Although the presence/absence and abundance of microbial groups are informative and easier to calculate, the phylogenetic dimension of diversity is key to understanding the structure and functioning of microbial communities. Microbial communities with higher phylogenetic α-diversity and/or β-diversity are thought to be more resilient to disturbances owing to their evolutionary potential to adapt to changing environmental conditions [100]. Phylogenetic diversity can also be a proxy for the potential functional diversity in a microbial community, as closely related microorganisms often share similar ecological traits [100,101]. Regarding the evaluation and monitoring of land use conversion, our results indicate that phylogenetic diversity shows to be more sensitive to micro-environmental changes, and similar results were previously found by Liu et al. [102].
4.3. Limitation of the Study and Further Research
We find it appropriate to point out certain limitations of our work and discuss further steps. By design, our soil sampling took place in a single season and at a single site per land use. This was meant to limit background variability to a minimum, by avoiding meso- and macro-environmental variation such as differences in soil type, slope, exposition, altitude, rainfall, and broad differences in soil management. Moreover, we selected land uses separated by less than 3 km, which are representative—in terms of biological and chemical characteristics of the soil—of a broader range of sites at El Manso Valley (Figure S11). Thus, the observed differences in soil biodiversity could mainly be attributed to the micro-environmental variability of each land use type. A more comprehensive range of environmental variability, land uses, and soil management will result, however, in more comprehensive assessments allowing us to validate our results. Furthermore, as previous studies found that land use influences how microbial communities change over time [12], it would be interesting to follow our study over several years and add cases of recently converted land.
We used the quantification of DNA extracted from soil as a proxy for microbial biomass in our study without validation, which could, to some extent, have created bias within our results due to, for example, differences in the contribution of soil fauna and/or plant DNA to total DNA. However, the correlation between the quantity of DNA extracted from soil and the microbial C biomass (based on the reference method of chloroform-fumigation-extraction of Vance et al. [103]) has been previously validated in different soil types around the world (range of r values = 0.64–0.96), and has been used to assess differences in soil microbial biomass among geographic regions or farming systems and to assess the effects of soil characteristics and management on microbial biomass [47,48,49,50,51,52,104,105,106,107,108]. Therefore, based on previous reports, we consider that, in our case, the potential bias should not substantially affect the micro-environmental variation pattern within each land use.
Regarding 16S rRNA gene sequencing we used a low number of reads for rarefaction aiming to retain most of the soil samples and sampling conditions (depth and spatial distance) for the three land uses in the analyses. This decision should determine an underestimation of bacterial and archaeal diversity, which could explain why an effect of depth was not detected for α-diversity. However, across a wide range of soils, bacterial communities are dominated by a few phylotypes, i.e., 2% of the bacterial phylotypes account for around 41% of 16S rRNA gene sequences [109], suggesting that our decision should have low effect on representativeness of community composition. This hypothesis is supported by the main bacterial phyla identified in our work, which are consistent with those reported in the global atlas of dominant soil bacteria [109]. Our results are also supported previous reports on the main microbial groups for different land uses, such as a higher relative abundance of Acidobacteria and Proteobacteria, and a lower relative abundance of Firmicutes and Chloroflexi in natural compared to in agricultural soils [110,111]. They are also supported by the similar trend found among different depths for each land use, showing that compositional change with land use was successfully captured (cf. Figures S9 and S10).
Although our main goal was to assess how soil microbial biodiversity changed with soil depth and spatial distance, we recognize that this micro-environmental variation could be driven by soil characteristics. Therefore, we assessed the correlation between biodiversity indices and soil characteristics focusing on chemical characteristics more likely affected by land use change and associated soil management (i.e., pH, electric conductivity, total C, total N, and C/N ratio). Clearly, other soil chemical and physical characteristics could be also relevant, and their assessment should be considered in further research, especially in studies involving a more comprehensive range of environmental variability, in which case differences in soil type could be also expected. Finally, we have not included in this study any biodiversity variable associated with the functionality of microbial communities, such as biological or enzymatic activity. This may reveal a different pattern that could have important implications for sampling designs.
5. Conclusions
The combined analyses of soil microbial biodiversity in native forest, grassland, and horticultural land conducted in our study reveal that several microbial communities varied at a micro-environmental scale, following different patterns across land uses. Both soil depth and spatial distance play pivotal roles in shaping such micro-environmental variations in soil biodiversity, and the patterns of microbial biodiversity indices differ broadly between native forest and alternative land uses. Notably, phylogenetic diversity indices exhibit more pronounced spatial patterns compared to indices based solely on sequence data. However, considering both types of indices in combination is essential to assess the relative influence of deterministic and stochastic processes on community turnover. Moreover, our study elucidates that deterministic processes predominantly govern the assembly of microbial communities along soil depth across all land uses, with the contribution of stochastic processes varying according to land-use types. The predominance of deterministic over stochastic processes is a promising result for the development of soil quality indicators based on microbial biodiversity. In addition, we observed a correlation between the relative contributions of deterministic and stochastic processes and soil pH levels following conversion. Lastly, we found that the correlation between soil chemical characteristics and soil microbial biodiversity indices undergoes changes after land-use conversion. This has implications for soil sampling design in sustainability monitoring schemes. Future research on sustainability assessments based on soil microbial biodiversity should consider not only macro-environmental but also micro-environmental variations within land uses, particularly the occurrence of spatial autocorrelation patterns. Our findings emphasise the need to develop land use-specific sampling frameworks in sustainability assessments. For example, by randomly sampling the first 10 cm of forest soils and systematically sampling the first 20 cm of grasslands and horticultural land, as illustrated in the present case from the Patagonian Forest frontier ecosystems. Moreover, we recommend exploring different variables of soil biodiversity—including those based on phylogeny—as they exhibit diverse responses to micro-environmental variation, contributing to a more comprehensive evaluation of soil health.
Supplementary Materials
The following supporting information can be downloaded at: https://www.mdpi.com/article/10.3390/su16031236/s1, Supplementary Information on Deterministic and stochastic processes modelling microbial community assembly; Table S1: p-values for nonparametric two-way Scheirer–Ray–Hare test of microbial biomass and α-diversity micro-environmental variation in forest, grassland and horticulture land; Table S2: PERMANOVA test statistics (R2 and significance) of the effect of depth and spatial distance factors and their interaction on the β-diversity of soil microbial communities; Table S3: Mean value and standard deviance of soil chemical properties according to soil depth classes in forest, grassland and horticulture lands; Table S4: Mean value and standard deviance of soil chemical properties according to spatial distance classes in forest, grassland and horticulture lands; Figure S1: Pearson’s correlation between spectrophotometric-based DNA quantification and florescence-based DNA quantification; Figure S2: Spatial distance effect on soil microbial biomass (estimated by quantification of soil DNA extraction) in forest (a), grassland (b) and horticulture (c) soils; Figure S3: Empirical semivariograms (dots) and spherical fitted model (dash lines) for microbial biomass in forest (a), grassland (b), and horticultural (c) soils; Figure S4A: Empirical semivariograms (dots) and spherical fitted model (dash lines) for Shannon–Wiener index in forest (a), grassland (b) and horticulture (c) soils; Figure S4B: Empirical semivariograms (dots) and spherical fitted model (dash lines) for inverse Simpson index in forest (d), grassland (e), and horticultural (f) soils; Figure S5A: Empirical semivariograms (dots) and spherical fitted model (dash lines) for richness index in forest (a), grassland (b), and horticultural (c) soils; Figure S5B: Empirical semivariograms (dots) and spherical fitted model (dash lines) for Faith’s PD index in forest (d), grassland (e), and horticultural (f) soils; Figure S6: Soil microbial community structure. Principal Coordinates Analysis (PCoA) plots based on Bray-Curtis (a–c) and weighted UniFrac (d–f) distance matrices of microbial communities of forest (a,d), grassland (b,e), and horticultural (c,f) soils; Figure S7: Post hoc pairwise permutational multivariate analysis of variance test (pairwise PERMANOVA, 9999 permutations) for microbial community composition according to depth and spatial distance; Figure S8: Correlation of Raup–Crick (Bray–Curtis) dissimilarity (a) and β-nearest taxon index (β-NTI) (b) and Euclidean distance matrix of spatial distance for each soil depth at forest, grassland, and horticultural land use; Figure S9: Relative abundance of microbial taxa at phylum level for each depth class by land use; Figure S10: Relative abundance of main microbial phyla contributing to community turnover among depth classes in the forest, grassland, and horticultural soils resulting from SIMPER analysis; Figure S11: Comparison of soil biological and chemical characteristics between different sites for different land uses within sites at El Manso Valley in Río Negro Province, Northern Patagonia, Argentina. References [70,73,74,75,112,113] are cited in the supplementary materials.
Author Contributions
Conceptualization, V.E.Á., V.A.E.M., J.F.S. and P.A.T.; methodology, V.E.Á., V.A.E.M. and P.A.T.; software, V.E.Á. and X.J.; formal analysis, V.E.Á.; investigation, V.E.Á. and E.C.; resources, V.E.Á., V.A.E.M. and A.G.C.; data curation, V.E.Á.; writing—original draft preparation, V.E.Á. and V.A.E.M.; writing—review and editing, V.E.Á., V.A.E.M. and P.A.T.; visualization, V.E.Á.; supervision, V.A.E.M. and P.A.T.; project administration, V.A.E.M., J.F.S. and P.A.T.; funding acquisition, V.A.E.M., J.F.S. and P.A.T. All authors have read and agreed to the published version of the manuscript.
Funding
This work was supported by the National Agency for the Promotion of Research, Technological Development and Innovation (ANPCyT, Argentina) [PICT 2018-03880]; the National Institute of Agricultural Technology (INTA, Argentina) [2019-PE-E1-I020-001, 2019-PD-E2-I037-002]; the National Council for Scientific and Technical Research (CONICET, Argentina) [PUE 0069]; the World Wildlife Fund (WWF); and the ERA-NET Cofund SusCrop project potatoMETAbiome [Grant No. 771134], supported by EU Horizon 2020 research and innovation program and the Dutch Research Council (NWO), and part of the Joint Programming Initiative on Agriculture, Food Security and Climate Change (FACCE-JPI).
Institutional Review Board Statement
Not applicable.
Informed Consent Statement
Not applicable.
Data Availability Statement
The datasets generated and analysed during the current study are available in the NCBI Sequence Read Archive (SRA) under BioProject ID PRJNA892123, http://www.ncbi.nlm.nih.gov/bioproject/892123 (accessed on 19 October 2022).
Acknowledgments
We would like to thank the family farmers from El Manso Valley (Rio Negro province, Argentina) for their priceless cooperation, Juan Manuel Agϋero, Juan Pablo Duprez and Juan De Pascuale for their help in fieldwork, and the Center for Information Technology of the University of Groningen for their support and for providing access to the Peregrine High-Performance computing cluster.
Conflicts of Interest
The authors declare no conflicts of interest.
References
- Huera-Lucero, T.; Labrador-Moreno, J.; Blanco-Salas, J.; Ruiz-Téllez, T. A Framework to Incorporate Biological Soil Quality Indicators into Assessing the Sustainability of Territories in the Ecuadorian Amazon. Sustainability 2020, 12, 3007. [Google Scholar] [CrossRef]
- Bhaduri, D.; Sihi, D.; Bhowmik, A.; Verma, B.C.; Munda, S.; Dari, B. A Review on Effective Soil Health Bio-Indicators for Ecosystem Restoration and Sustainability. Front. Microbiol. 2022, 13, 938481. [Google Scholar] [CrossRef]
- Lee, S.H.; Kim, M.S.; Kim, J.G.; Kim, S.O. Use of Soil Enzymes as Indicators for Contaminated Soil Monitoring and Sustainable Management. Sustainability 2020, 12, 8209. [Google Scholar] [CrossRef]
- Smith, P.; Keesstra, S.D.; Silver, W.L.; Adhya, T.K.; De Deyn, G.B.; Carvalheiro, L.G.; Giltrap, D.L.; Renforth, P.; Cheng, K.; Sarkar, B.; et al. Soil-Derived Nature’s Contributions to People and Their Contribution to the Un Sustainable Development Goals. Philos. Trans. R. Soc. B Biol. Sci. 2021, 376, 20200185. [Google Scholar] [CrossRef]
- FAO; ITPS; GSBI; CBD; EC. State of Knowledge of Soil Biodiversity—Status, Challenges and Potentialities; Food and Agriculture Organization: Rome, Italy, 2020. [Google Scholar]
- Doran, J.W.; Sarrantonio, M.; Liebig, M.A. Soil Health and Sustainability. Adv. Agron. 1996, 56, 1–54. [Google Scholar] [CrossRef]
- Costantini, E.A.C.; Mocali, S. Soil Health, Soil Genetic Horizons and Biodiversity. J. Plant Nutr. Soil Sci. 2022, 185, 24–34. [Google Scholar] [CrossRef]
- Lehmann, J.; Bossio, D.A.; Kögel-Knabner, I.; Rillig, M.C. The Concept and Future Prospects of Soil Health. Nat. Rev. Earth Environ. 2020, 1, 544–553. [Google Scholar] [CrossRef] [PubMed]
- FAO. Keep Soil Alive, Protect Soil Biodiversity, 19–22 April 2021—Outcome Document; FAO: Rome, Italy, 2021. [Google Scholar]
- Guerra, C.A.; Delgado-Baquerizo, M.; Duarte, E.; Marigliano, O.; Görgen, C.; Maestre, F.T.; Eisenhauer, N. Global Projections of the Soil Microbiome in the Anthropocene. Glob. Ecol. Biogeogr. 2021, 30, 987–999. [Google Scholar] [CrossRef] [PubMed]
- Ranjard, L.; Dequiedt, S.; Chemidlin Prévost-Bouré, N.; Thioulouse, J.; Saby, N.P.A.; Lelievre, M.; Maron, P.A.; Morin, F.E.R.; Bispo, A.; Jolivet, C.; et al. Turnover of Soil Bacterial Diversity Driven by Wide-Scale Environmental Heterogeneity. Nat. Commun. 2013, 4, 1434. [Google Scholar] [CrossRef] [PubMed]
- Lauber, C.L.; Ramirez, K.S.; Aanderud, Z.; Lennon, J.; Fierer, N. Temporal Variability in Soil Microbial Communities across Land-Use Types. ISME J. 2013, 7, 1641–1650. [Google Scholar] [CrossRef] [PubMed]
- Nunan, N.; Schmidt, H.; Raynaud, X. The Ecology of Heterogeneity: Soil Bacterial Communities and C Dynamics. Philos. Trans. R. Soc. B Biol. Sci. 2020, 375, 20190249. [Google Scholar] [CrossRef]
- Fierer, N. Microbial Biogeography: Patterns in Microbial Diversity across Space and Time. In Accessing Uncultivated Microorganisms: From the Environment to Organisms and Genomes and Back; ASM Press: Washington, DC, USA, 2014; pp. 95–115. [Google Scholar] [CrossRef]
- Orgiazzi, A.; Bardgett, R.D.; Barrios, E.; Behan-Pelletier, V.; Briones, M.J.I.; Chotte, J.-L.; De Deyn, G.B.; Eggleton, P.; Fierer, N.; Fraser, T.; et al. Global Soil Biodiversity Atlas European Commission; Publications Office of the European Union: Luxembourg, 2016; ISBN 9789279481697. [Google Scholar]
- Turbé, A.; De Toni, A.; Benito, P.; Lavelle, P.; Lavelle, P.; Ruiz, N.; Van der Putten, W.H.; Labouze, E.; Mudgal, S.; De Toni, A.; et al. Soil Biodiversity: Functions, Threaths and Tools for Policy Makers; European Commission: Luxembourg, 2010; ISBN 9789279206689.
- Labouyrie, M.; Ballabio, C.; Romero, F.; Panagos, P.; Jones, A.; Schmid, M.W.; Mikryukov, V.; Dulya, O.; Tedersoo, L.; Bahram, M.; et al. Patterns in Soil Microbial Diversity across Europe. Nat. Commun. 2023, 14, 3311. [Google Scholar] [CrossRef]
- El Mujtar, V.A.; Gregorutti, V.C.; Eclesia, R.P.; Wingeyer, A.; Lezana, L.; Canavelli, S.B.; Tittonell, P. Assessing Soil Microbial Biodiversity as Affected by Grazing and Woody Vegetation Cover in a Temperate Savannah. Ann. Appl. Biol. 2021, 179, 231–245. [Google Scholar] [CrossRef]
- Lupatini, M.; Korthals, G.W.; Roesch, L.F.W.; Kuramae, E.E. Long-Term Farming Systems Modulate Multi-Trophic Responses. Sci. Total Environ. 2019, 646, 480–490. [Google Scholar] [CrossRef] [PubMed]
- Marsden, C.; Martin-Chave, A.; Cortet, J.; Hedde, M.; Capowiez, Y. How Agroforestry Systems Influence Soil Fauna and Their Functions—A Review. Plant Soil 2020, 453, 29–44. [Google Scholar] [CrossRef]
- Romdhane, S.; Spor, A.; Banerjee, S.; Breuil, M.C.; Bru, D.; Chabbi, A.; Hallin, S.; van der Heijden, M.G.A.; Saghai, A.; Philippot, L. Land-Use Intensification Differentially Affects Bacterial, Fungal and Protist Communities and Decreases Microbiome Network Complexity. Environ. Microbiomes 2022, 17, 1. [Google Scholar] [CrossRef] [PubMed]
- Singh, J.; Schädler, M.; Demetrio, W.; Brown, G.G.; Eisenhauer, N. Climate Change Effects on Earthworms—A Review. Soil Org. 2019, 91, 114–138. [Google Scholar] [CrossRef]
- Yang, T.; Lupwayi, N.; Marc, S.A.; Siddique, K.H.M.; Bainard, L.D. Anthropogenic Drivers of Soil Microbial Communities and Impacts on Soil Biological Functions in Agroecosystems. Glob. Ecol. Conserv. 2021, 27, e01521. [Google Scholar] [CrossRef]
- Zulu, S.G.; Motsa, N.M.; Sithole, N.J.; Magwaza, L.S.; Ncama, K. Soil Macrofauna Abundance and Taxonomic Richness under Long-Term No-Till Conservation Agriculture in a Semi-Arid Environment of South Africa. Agronomy 2022, 12, 722. [Google Scholar] [CrossRef]
- Baldrian, P.; Merhautová, V.; Cajthaml, T.; Petránková, M.; Šnajdr, J. Small-Scale Distribution of Extracellular Enzymes, Fungal, and Bacterial Biomass in Quercus Petraea Forest Topsoil. Biol. Fertil. Soils 2010, 46, 717–726. [Google Scholar] [CrossRef]
- Nielsen, U.N.; Osler, G.H.R.; Campbell, C.D.; Burslem, D.F.R.P.; van der Wal, R. Predictors of Fine-Scale Spatial Variation in Soil Mite and Microbe Community Composition Differ between Biotic Groups and Habitats. Pedobiologia 2012, 55, 83–91. [Google Scholar] [CrossRef]
- Štursová, M.; Bárta, J.; Šantrůčková, H.; Baldrian, P. Small-Scale Spatial Heterogeneity of Ecosystem Properties, Microbial Community Composition and Microbial Activities in a Temperate Mountain Forest Soil. FEMS Microbiol. Ecol. 2016, 92, fiw185. [Google Scholar] [CrossRef]
- Sun, T.; Wang, Y.; Lucas-Borja, M.E.; Jing, X.; Feng, W. Divergent Vertical Distributions of Microbial Biomass with Soil Depth among Groups and Land Uses. J. Environ. Manag. 2021, 292, 112755. [Google Scholar] [CrossRef] [PubMed]
- Bahram, M.; Kohout, P.; Anslan, S.; Harend, H.; Abarenkov, K.; Tedersoo, L. Stochastic Distribution of Small Soil Eukaryotes Resulting from High Dispersal and Drift in a Local Environment. ISME J. 2016, 10, 885–896. [Google Scholar] [CrossRef] [PubMed]
- Du, X.; Deng, Y.; Li, S.; Escalas, A.; Feng, K.; He, Q.; Wang, Z.; Wu, Y.; Wang, D.; Peng, X.; et al. Steeper Spatial Scaling Patterns of Subsoil Microbiota Are Shaped by Deterministic Assembly Process. Mol. Ecol. 2021, 30, 1072–1085. [Google Scholar] [CrossRef]
- Jiménez, J.J.; Decaëns, T.; Lavelle, P.; Rossi, J.P. Dissecting the Multi-Scale Spatial Relationship of Earthworm Assemblages with Soil Environmental Variability. BMC Ecol. 2014, 14, 26. [Google Scholar] [CrossRef]
- Richter-Heitmann, T.; Hofner, B.; Krah, F.S.; Sikorski, J.; Wüst, P.K.; Bunk, B.; Huang, S.; Regan, K.M.; Berner, D.; Boeddinghaus, R.S.; et al. Stochastic Dispersal Rather Than Deterministic Selection Explains the Spatio-Temporal Distribution of Soil Bacteria in a Temperate Grassland. Front. Microbiol. 2020, 11, 01391. [Google Scholar] [CrossRef]
- Wang, Y.; Chen, L.; Xiang, W.; Ouyang, S.; Zhang, T.; Zhang, X.; Zeng, Y.; Hu, Y.; Luo, G.; Kuzyakov, Y. Forest Conversion to Plantations: A Meta-Analysis of Consequences for Soil and Microbial Properties and Functions. Glob. Chang. Biol. 2021, 27, 5643–5656. [Google Scholar] [CrossRef]
- Muñoz-Arenas, L.C.; Fusaro, C.; Hernández-Guzmán, M.; Dendooven, L.; Estrada-Torres, A.; Navarro-Noya, Y.E. Soil Microbial Diversity Drops with Land-Use Change in a High Mountain Temperate Forest: A Metagenomics Survey. Environ. Microbiol. Rep. 2020, 12, 185–194. [Google Scholar] [CrossRef]
- Prack McCormick, B.; El Mujtar, V.A.; Cardozo, A.; Álvarez, V.E.; Rodríguez, H.A.; Tittonell, P.A. Nutrient Source, Management System and the Age of the Plantation Affect Soil Biodiversity and Chemical Properties in Raspberry Production. Eur. J. Soil Biol. 2022, 111, 103420. [Google Scholar] [CrossRef]
- Zhu, X.; Liu, W.; Chen, H.; Deng, Y.; Chen, C.; Zeng, H. Effects of Forest Transition on Litterfall, Standing Litter and Related Nutrient Returns: Implications for Forest Management in Tropical China. Geoderma 2019, 333, 123–134. [Google Scholar] [CrossRef]
- Liu, T.; Wu, X.; Li, H.; Alharbi, H.; Wang, J.; Dang, P.; Chen, X.; Kuzyakov, Y.; Yan, W. Soil Organic Matter, Nitrogen and PH Driven Change in Bacterial Community Following Forest Conversion. For. Ecol. Manag. 2020, 477, 118473. [Google Scholar] [CrossRef]
- FAO; UNEP. The State of the World’s Forests 2020. Forests, Biodiversity and People; FAO & UNEP: Rome, Italy, 2020. [Google Scholar]
- Delgado-Baquerizo, M.; Reich, P.B.; Trivedi, C.; Eldridge, D.J.; Abades, S.; Alfaro, F.D.; Bastida, F.; Berhe, A.A.; Cutler, N.A.; Gallardo, A.; et al. Multiple Elements of Soil Biodiversity Drive Ecosystem Functions across Biomes. Nat. Ecol. Evol. 2020, 4, 210–220. [Google Scholar] [CrossRef] [PubMed]
- Jiao, S.; Lu, Y.; Wei, G. Soil Multitrophic Network Complexity Enhances the Link between Biodiversity and Multifunctionality in Agricultural Systems. Glob. Chang. Biol. 2022, 28, 140–153. [Google Scholar] [CrossRef] [PubMed]
- Wagg, C.; Bender, S.F.; Widmer, F.; Van Der Heijden, M.G.A. Soil Biodiversity and Soil Community Composition Determine Ecosystem Multifunctionality. Proc. Natl. Acad. Sci. USA 2014, 111, 5266–5270. [Google Scholar] [CrossRef] [PubMed]
- Eisenhauer, N.; Bender, S.F.; Calderón-Sanou, I.; de Vries, F.T.; Lembrechts, J.J.; Thuiller, W.; Wall, D.H.; Zeiss, R.; Bahram, M.; Beugnon, R.; et al. Frontiers in Soil Ecology—Insights from the World Biodiversity Forum 2022. J. Sustain. Agric. Environ. 2022, 1, 245–261. [Google Scholar] [CrossRef]
- El Mujtar, V.; Muñoz, N.; Prack Mc Cormick, B.; Pulleman, M.; Tittonell, P. Role and Management of Soil Biodiversity for Food Security and Nutrition; Where Do We Stand? Glob. Food Sec. 2019, 20, 132–144. [Google Scholar] [CrossRef]
- Panigatti, J.L. Argentina 200 Años, 200 Suelos; INTA: Buenos Aires, Argentina, 2010; ISBN 9789871623853. [Google Scholar]
- Basso, P. Characterization and N Flow Analysis of Farming Systems in the Andes Valleys of North Patagonia; Wageningen University & Research: Wageningen, The Netherlands, 2018. [Google Scholar]
- IICA (Ed.) Desarrollo Territorial Con Enfoque de Sistemas Agroalimentarios Localizados (AT-SIAL): La Comarca Andina Del Paralelo 42°, Argentina; IICA: Ciudad de México, Mexico, 2013; ISBN 9789292484880. [Google Scholar]
- Bragato, G.; Fornasier, F.; Brus, D.J. Characterization of Soil Fertility and Soil Biodiversity with DsDNA as a Covariate in a Regression Estimator for Mean Microbial Biomass C. Eur. J. Soil Sci. 2016, 67, 827–834. [Google Scholar] [CrossRef]
- Fornasier, F.; Ascher, J.; Ceccherini, M.T.; Tomat, E.; Pietramellara, G. A Simplified Rapid, Low-Cost and Versatile DNA-Based Assessment of Soil Microbial Biomass. Ecol. Indic. 2014, 45, 75–82. [Google Scholar] [CrossRef]
- Gangneux, C.; Akpa-Vinceslas, M.; Sauvage, H.; Desaire, S.; Houot, S.; Laval, K. Fungal, Bacterial and Plant DsDNA Contributions to Soil Total DNA Extracted from Silty Soils under Different Farming Practices: Relationships with Chloroform-Labile Carbon. Soil Biol. Biochem. 2011, 43, 431–437. [Google Scholar] [CrossRef]
- Gong, H.; Du, Q.; Xie, S.; Hu, W.; Akram, M.A.; Hou, Q.; Dong, L.; Sun, Y.; Manan, A.; Deng, Y.; et al. Soil Microbial DNA Concentration Is a Powerful Indicator for Estimating Soil Microbial Biomass C and N across Arid and Semi-Arid Regions in Northern China. Appl. Soil Ecol. 2021, 160, 103869. [Google Scholar] [CrossRef]
- Santoni, M.; Verdi, L.; Imran Pathan, S.; Napoli, M.; Dalla Marta, A.; Dani, F.R.; Pacini, G.C.; Ceccherini, M.T. Soil Microbiome Biomass, Activity, Composition and CO2 Emissions in a Long-Term Organic and Conventional Farming Systems. Soil Use Manag. 2023, 39, 588–605. [Google Scholar] [CrossRef]
- Semenov, M.; Blagodatskaya, E.; Stepanov, A.; Kuzyakov, Y. DNA-Based Determination of Soil Microbial Biomass in Alkaline and Carbonaceous Soils of Semi-Arid Climate. J. Arid Environ. 2018, 150, 54–61. [Google Scholar] [CrossRef]
- Sparks, D.L.; Page, A.L.; Helmke, P.A.; Loeppert, R.H.; Soltanpour, P.N.; Tabatabai, M.A.; Johnston, C.T.; Sumner, M.E. (Eds.) Methods of Soil Analysis; SSSA Book Series; Soil Science Society of America; American Society of Agronomy: Madison, WI, USA, 1996; ISBN 9780891188667. [Google Scholar]
- Wydro, U. Soil Microbiome Study Based on DNA Extraction: A Review. Water 2022, 14, 3999. [Google Scholar] [CrossRef]
- Caporaso, J.G.; Lauber, C.L.; Walters, W.A.; Berg-Lyons, D.; Lozupone, C.A.; Turnbaugh, P.J.; Fierer, N.; Knight, R. Global Patterns of 16S RRNA Diversity at a Depth of Millions of Sequences per Sample. Proc. Natl. Acad. Sci. USA 2011, 108, 4516–4522. [Google Scholar] [CrossRef] [PubMed]
- Bolyen, E.; Rideout, J.R.; Dillon, M.R.; Bokulich, N.A.; Abnet, C.C.; Al-Ghalith, G.A.; Alexander, H.; Alm, E.J.; Arumugam, M.; Asnicar, F.; et al. Reproducible, Interactive, Scalable and Extensible Microbiome Data Science Using QIIME 2. Nat. Biotechnol. 2019, 37, 852–857. [Google Scholar] [CrossRef] [PubMed]
- Callahan, B.J.; McMurdie, P.J.; Rosen, M.J.; Han, A.W.; Johnson, A.J.A.; Holmes, S.P. DADA2: High-Resolution Sample Inference from Illumina Amplicon Data. Nat. Methods 2016, 13, 581–583. [Google Scholar] [CrossRef] [PubMed]
- Yilmaz, P.; Parfrey, L.W.; Yarza, P.; Gerken, J.; Pruesse, E.; Quast, C.; Schweer, T.; Peplies, J.; Ludwig, W.; Glöckner, F.O. The SILVA and “All-Species Living Tree Project (LTP)” Taxonomic Frameworks. Nucleic Acids Res. 2014, 42, 643–648. [Google Scholar] [CrossRef] [PubMed]
- Katoh, K.; Standley, D.M. MAFFT Multiple Sequence Alignment Software Version 7: Improvements in Performance and Usability. Mol. Biol. Evol. 2013, 30, 772–780. [Google Scholar] [CrossRef] [PubMed]
- Price, M.N.; Dehal, P.S.; Arkin, A.P. Fasttree: Computing Large Minimum Evolution Trees with Profiles Instead of a Distance Matrix. Mol. Biol. Evol. 2009, 26, 1641–1650. [Google Scholar] [CrossRef]
- McMurdie, P.J.; Holmes, S. Phyloseq: An R Package for Reproducible Interactive Analysis and Graphics of Microbiome Census Data. PLoS ONE 2013, 8, e61217. [Google Scholar] [CrossRef]
- R-Core-Team. R: A Language and Environment for Statistical Computing; R Foundation for Statistical Computing: Vienna, Austria, 2020. [Google Scholar]
- RStudio-Team. RStudio: Integrated Development for R; RStudio, Inc.: Boston, MA, USA, 2015. [Google Scholar]
- Mangiafico, S. Rcompanion: Functions to Support Extension Education Program Evaluation; The Comprehensive R Archive Network: Wien, Austria, 2022. [Google Scholar]
- Sokal, R.R.; Rohlf, F.J. (Eds.) Biometry, 3rd ed.; W.H. Freeman: New York, NY, USA, 1995. [Google Scholar]
- Dunn, O.J. Multiple Comparisons Using Rank Sums. Technometrics 1964, 6, 241–252. [Google Scholar] [CrossRef]
- Ogle, D.H.; Dolll, J.C.; Wheeler, P.; Dinno, A. FSA: Fisheries Stock Analysis; The Comprehensive R Archive Network: Wien, Austria, 2022. [Google Scholar]
- Ribeiro, P.J.; Diggle, P.J. GeoR: A Package for Geostatistical Data Analysis Using the R Software. R News 2016, 1, 15–18. [Google Scholar]
- Paradis, E.; Schliep, K. Ape 5.0: An Environment for Modern Phylogenetics and Evolutionary Analyses in R. Bioinformatics 2019, 35, 526–528. [Google Scholar] [CrossRef] [PubMed]
- Oksanen, J.; Kindt, G.L.; Roeland, S.F.; Blanchet, G.; Legendre, P.; Minchin, P.R.; O’Hara, R.B.; Solymos, P.; Stevens, M.H.H.; Szoecs, E.; et al. Vegan: Community Ecology Package; The Comprehensive R Archive Network: Wien, Austria, 2022. [Google Scholar]
- Martínez Arbizu, P. PairwiseAdonis: Pairwise Multilevel Comparison Using Adonis; CRAN: Wien, Austria, 2020. [Google Scholar]
- Jia, X.; Dini-Andreote, F.; Salles, J.F. Comparing the Influence of Assembly Processes Governing Bacterial Community Succession Based on DNA and RNA Data. Microorganisms 2020, 8, 798. [Google Scholar] [CrossRef]
- Stegen, J.C.; Lin, X.; Fredrickson, J.K.; Chen, X.; Kennedy, D.W.; Murray, C.J.; Rockhold, M.L.; Konopka, A. Quantifying Community Assembly Processes and Identifying Features That Impose Them. ISME J. 2013, 7, 2069–2079. [Google Scholar] [CrossRef]
- Dini-Andreote, F.; Stegen, J.C.; Van Elsas, J.D.; Salles, J.F. Disentangling Mechanisms That Mediate the Balance between Stochastic and Deterministic Processes in Microbial Succession. Proc. Natl. Acad. Sci. USA 2015, 112, E1326–E1332. [Google Scholar] [CrossRef]
- Stegen, J.C.; Lin, X.; Konopka, A.E.; Fredrickson, J.K. Stochastic and Deterministic Assembly Processes in Subsurface Microbial Communities. ISME J. 2012, 6, 1653–1664. [Google Scholar] [CrossRef]
- Tripathi, B.M.; Stegen, J.C.; Kim, M.; Dong, K.; Adams, J.M.; Lee, Y.K. Soil PH Mediates the Balance between Stochastic and Deterministic Assembly of Bacteria. ISME J. 2018, 12, 1072–1083. [Google Scholar] [CrossRef]
- Huang, H.; Zhou, L.; Chen, J.; Wei, T. Ggcor: Extended Tools for Correlation Analysis and Visualization; CRAN: Wien, Austria, 2019. [Google Scholar]
- Goss-Souza, D.; Mendes, L.W.; Borges, C.D.; Baretta, D.; Tsai, S.M.; Rodrigues, J.L.M. Soil Microbial Community Dynamics and Assembly under Long-Term Land Use Change. FEMS Microbiol. Ecol. 2017, 93, fix109. [Google Scholar] [CrossRef]
- Jangid, K.; Williams, M.A.; Franzluebbers, A.J.; Schmidt, T.M.; Coleman, D.C.; Whitman, W.B. Land-Use History Has a Stronger Impact on Soil Microbial Community Composition than Aboveground Vegetation and Soil Properties. Soil Biol. Biochem. 2011, 43, 2184–2193. [Google Scholar] [CrossRef]
- Thomson, B.C.; Tisserant, E.; Plassart, P.; Uroz, S.; Griffiths, R.I.; Hannula, S.E.; Buée, M.; Mougel, C.; Ranjard, L.; Van Veen, J.A.; et al. Soil Conditions and Land Use Intensification Effects on Soil Microbial Communities across a Range of European Field Sites. Soil Biol. Biochem. 2015, 88, 403–413. [Google Scholar] [CrossRef]
- Tittonell, P.; Hara, S.M.; Álvarez, V.E.; Aramayo, V.M.; Bruzzone, O.A.; Easdale, M.H.; Enriquez, A.S.; Laborda, L.; Trinco, F.D.; Villagra, S.E.; et al. Ecosystem Services and Disservices Associated with Pastoral Systems from Patagonia, Argentina—A Review. Cah. Agric. 2021, 30, 43. [Google Scholar]
- Van Leeuwen, J.P.; Djukic, I.; Bloem, J.; Lehtinen, T.; Hemerik, L. Effects of Land Use on Soil Microbial Biomass, Activity and Community Structure at Different Soil Depths in the Danube Floodplain. Eur. J. Soil Biol. 2017, 79, 14–20. [Google Scholar] [CrossRef]
- Balota, E.L.; Filho, A.C.; Andrade, D.S.; Dick, R.P. Long-Term Tillage and Crop Rotation Effects on Microbial Biomass and C and N Mineralization in a Brazilian Oxisol. Soil Tillage Res. 2004, 77, 137–145. [Google Scholar] [CrossRef]
- Li, Y.; Chang, S.X.; Tian, L.; Zhang, Q. Conservation Agriculture Practices Increase Soil Microbial Biomass Carbon and Nitrogen in Agricultural Soils: A Global Meta-Analysis. Soil Biol. Biochem. 2018, 121, 50–58. [Google Scholar] [CrossRef]
- Mgelwa, A.S.; Hu, Y.L.; Xu, W.B.; Ge, Z.Q.; Yu, T.W. Soil Carbon and Nitrogen Availability Are Key Determinants of Soil Microbial Biomass and Respiration in Forests along Urbanized Rivers of Southern China. Urban For. Urban Green. 2019, 43, 126351. [Google Scholar] [CrossRef]
- Hoogsteen, M.J.J.; Bakker, E.; Van Eekeren, N.; Tittonell, P.A.; Groot, J.C.J.; Van Ittersum, M.K.; Lantinga, E.A. Do Grazing Systems and Species Composition A Ff Ect Root Biomass and Soil Organic Matter Dynamics in Temperate Grassland Swards ? Sustainability 2020, 12, 1260. [Google Scholar] [CrossRef]
- Kintché, K.; Guibert, H.; Sogbedji, J.M. Carbon Losses and Primary Productivity Decline in Savannah Soils under Cotton-Cereal Rotations in Semiarid Togo. Plant Soil 2010, 336, 469–484. [Google Scholar] [CrossRef]
- Bach, L.H.; Frostegård, Å.; Ohlson, M. Variation in Soil Microbial Communities across a Boreal Spruce Forest Landscape. Can. J. For. Res. 2008, 38, 1504–1516. [Google Scholar] [CrossRef]
- Boeddinghaus, R.S.; Nunan, N.; Berner, D.; Marhan, S.; Kandeler, E. Do General Spatial Relationships for Microbial Biomass and Soil Enzyme Activities Exist in Temperate Grassland Soils? Soil Biol. Biochem. 2015, 88, 430–440. [Google Scholar] [CrossRef]
- Loureiro, D.C.; De-Polli, H.; Ceddia, M.B.; de Aquino, A.M. Spatial Variability of Microbial Biomass and Organic Matter Labile Pools in a Haplic Planosol Soil. Bragantia 2010, 69, 85–95. [Google Scholar] [CrossRef]
- Wang, Y.; Zhu, H.; Li, Y. Spatial Heterogeneity of Soil Moisture, Microbial Biomass Carbon and Soil Respiration at Stand Scale of an Arid Scrubland. Environ. Earth Sci. 2013, 70, 3217–3224. [Google Scholar] [CrossRef]
- Modernel, P.; Picasso, V.; Do Carmo, M.; Rossing, W.A.H.; Corbeels, M.; Soca, P.; Dogliotti, S.; Tittonell, P. Grazing Management for More Resilient Mixed Livestock Farming Systems on Native Grasslands of Southern South America. Grass Forage Sci. 2019, 74, 636–649. [Google Scholar] [CrossRef]
- Griffiths, R.I.; Thomson, B.C.; James, P.; Bell, T.; Bailey, M.; Whiteley, A.S. The Bacterial Biogeography of British Soils. Environ. Microbiol. 2011, 13, 1642–1654. [Google Scholar] [CrossRef] [PubMed]
- Peng, W.; Zhu, Y.; Song, M.; Du, H.; Song, T.; Zeng, F.; Zhang, F.; Wang, K.; Luo, Y.; Lan, X.; et al. The Spatial Distribution and Drivers of Soil Microbial Richness and Diversity in a Karst Broadleaf Forest. For. Ecol. Manag. 2019, 449, 117241. [Google Scholar] [CrossRef]
- Plassart, P.; Prévost-Bouré, N.C.; Uroz, S.; Dequiedt, S.; Stone, D.; Creamer, R.; Griffiths, R.I.; Bailey, M.J.; Ranjard, L.; Lemanceau, P. Soil Parameters, Land Use, and Geographical Distance Drive Soil Bacterial Communities along a European Transect. Sci. Rep. 2019, 9, 605. [Google Scholar] [CrossRef] [PubMed]
- Ramette, A.; Tiedje, J.M. Multiscale Responses of Microbial Life to Spatial Distance and Environmental Heterogeneity in a Patchy Ecosystem. Proc. Natl. Acad. Sci. USA 2007, 104, 2761–2766. [Google Scholar] [CrossRef] [PubMed]
- Eilers, K.G.; Debenport, S.; Anderson, S.; Fierer, N. Digging Deeper to Find Unique Microbial Communities: The Strong Effect of Depth on the Structure of Bacterial and Archaeal Communities in Soil. Soil Biol. Biochem. 2012, 50, 58–65. [Google Scholar] [CrossRef]
- Hao, J.; Chai, Y.N.; Lopes, L.D.; Ordóñez, R.A.; Wright, E.E.; Archontoulis, S.; Schachtman, D.P. The Effects of Soil Depth on the Structure of Microbial Communities in Agricultural Soils in Iowa (United States). Appl. Environ. Microbiol. 2021, 87, e02673-20. [Google Scholar] [CrossRef] [PubMed]
- Li, W.; Kuzyakov, Y.; Zheng, Y.; Li, P.; Li, G.; Liu, M.; Alharbi, H.A.; Li, Z. Depth Effects on Bacterial Community Assembly Processes in Paddy Soils. Soil Biol. Biochem. 2022, 165, 108517. [Google Scholar] [CrossRef]
- Srivastava, D.S.; Cadotte, M.W.; Macdonald, A.A.M.; Marushia, R.G.; Mirotchnick, N. Phylogenetic Diversity and the Functioning of Ecosystems. Ecol. Lett. 2012, 15, 637–648. [Google Scholar] [CrossRef]
- Mouquet, N.; Devictor, V.; Meynard, C.N.; Munoz, F.; Bersier, L.F.; Chave, J.; Couteron, P.; Dalecky, A.; Fontaine, C.; Gravel, D.; et al. Ecophylogenetics: Advances and Perspectives. Biol. Rev. 2012, 87, 769–785. [Google Scholar] [CrossRef]
- Liu, Y.; Zhang, M.; Peng, W.; Qu, X.; Zhang, Y.; Du, L.; Wu, N. Phylogenetic and Functional Diversity Could Be Better Indicators of Macroinvertebrate Community Stability. Ecol. Indic. 2021, 129, 107892. [Google Scholar] [CrossRef]
- Vance, E.D.; Brookes, P.C.; Jenkinson, D.S. An Extraction Method for Measuring Soil Microbial Biomass C. Soil Biol. Biochem. 1987, 19, 703–707. [Google Scholar]
- Widmer, F.; Rasche, F.; Hartmann, M.; Fliessbach, A. Community Structures and Substrate Utilization of Bacteria in Soils from Organic and Conventional Farming Systems of the DOK Long-Term Field Experiment. Appl. Soil Ecol. 2006, 33, 294–307. [Google Scholar] [CrossRef]
- Dequiedt, S.; Saby, N.P.A.; Lelievre, M.; Jolivet, C.; Thioulouse, J.; Toutain, B.; Arrouays, D.; Bispo, A.; Lemanceau, P.; Ranjard, L. Biogeographical Patterns of Soil Molecular Microbial Biomass as Influenced by Soil Characteristics and Management. Glob. Ecol. Biogeogr. 2011, 20, 641–652. [Google Scholar] [CrossRef]
- Hartmann, M.; Frey, B.; Kölliker, R.; Widmer, F. Semi-Automated Genetic Analyses of Soil Microbial Communities: Comparison of T-RFLP and RISA Based on Descriptive and Discriminative Statistical Approaches. J. Microbiol. Methods 2005, 61, 349–360. [Google Scholar] [CrossRef] [PubMed]
- Hofman, J.; Dušek, L. Biochemical Analysis of Soil Organic Matter and Microbial Biomass Composition—A Pilot Study. Eur. J. Soil Biol. 2003, 39, 217–224. [Google Scholar] [CrossRef]
- Marstorp, H.; Guan, X.; Gong, P. Relationship between DsDNA, Chloroform Labile C and Ergosterol in Soils of Different Organic Matter Contents and PH. Soil Biol. Biochem. 2000, 32, 879–882. [Google Scholar]
- Delgado-Baquerizo, M.; Oliverio, A.M.; Brewer, T.E.; Benavent-González, A.; Eldridge, D.J.; Bardgett, R.D.; Maestre, F.T.; Singh, B.K.; Fierer, N. A Global Atlas of the Dominant Bacteria Found in Soil. Science 2018, 359, 320–325. [Google Scholar] [CrossRef] [PubMed]
- Kim, H.S.; Lee, S.H.; Jo, H.Y.; Finneran, K.T.; Kwon, M.J. Diversity and Composition of Soil Acidobacteria and Proteobacteria Communities as a Bacterial Indicator of Past Land-Use Change from Forest to Farmland. Sci. Total Environ. 2021, 797, 148944. [Google Scholar] [CrossRef] [PubMed]
- Trivedi, P.; Delgado-Baquerizo, M.; Anderson, I.C.; Singh, B.K. Response of Soil Properties and Microbial Communities to Agriculture: Implications for Primary Productivity and Soil Health Indicators. Front. Plant Sci. 2016, 7, 990. [Google Scholar] [CrossRef] [PubMed]
- Jia, X.; Dini-Andreote, F.; Falcão Salles, J. Community Assembly Processes of the Microbial Rare Biosphere. Trends Microbiol. 2018, 26, 738–747. [Google Scholar] [CrossRef]
- Kembel, S.W.; Cowan, P.D.; Helmus, M.R.; Cornwell, W.K.; Morlon, H.; Ackerly, D.D.; Blomberg, S.P.; Webb, C.O. Picante: R Tools for Integrating Phylogenies and Ecology. Bioinformatics 2010, 26, 1463–1464. [Google Scholar] [CrossRef]
Disclaimer/Publisher’s Note: The statements, opinions and data contained in all publications are solely those of the individual author(s) and contributor(s) and not of MDPI and/or the editor(s). MDPI and/or the editor(s) disclaim responsibility for any injury to people or property resulting from any ideas, methods, instructions or products referred to in the content. |
© 2024 by the authors. Licensee MDPI, Basel, Switzerland. This article is an open access article distributed under the terms and conditions of the Creative Commons Attribution (CC BY) license (https://creativecommons.org/licenses/by/4.0/).