Abstract
The purpose of this study was to employ Resource Value Mapping (REVAM) and carbon footprint assessments to evaluate the resource efficiency and environmental impact of the aquaculture sector in Thailand. Focusing on tilapia production, a case study that compares the innovative In-Pond Raceway System (IPRS) with the traditional pond system was conducted to serve as a guideline for small-scale producers toward achieving the Sustainable Development Goals (SDGs). The assessment applied lean classification to the agriculture context and used both machine and non-machine resources. Moreover, the Muda Index (MI) and the concurrent assessment of greenhouse gas (GHG) emissions through the proposed map were introduced to identify resource efficiencies and environmental impacts across activities, respectively. The analysis highlighted resources with the highest MI values, waste proportions, and emissions requiring improvement. This study shows that addressing specific resources in REVAM can enhance resource management, facilitate control over variable costs, and ensure sustainability in both of these dimensions. Finally, a feasibility analysis was incorporated to weigh investment between in-pond and IPRS systems, in addition to resource use efficiency and environmental impact dimensions, creating an opportunity to meet the increasing demands in the international market.
1. Introduction
Amongst the numerous challenges confronting the globe, climate change is a major concern, which is primarily driven by the increased utilization of resources and energy by various human activities. Responding to this critical issue, the European Union (EU) has taken proactive steps and implemented a range of environmental measures, including carbon border adjustment policies, environmental standards, and trade barriers [1]. These initiatives have fostered a growing consumer preference for sustainable and environmentally friendly products and services [2]. Consequently, all sectors are facing heightened pressure to enhance their production processes, reduce raw material consumption, and increase resource recycling to maximize sustainability outcomes. The Greenhouse Gas Protocol (GHG Protocol) is a widely recognized global standard used by both the public and private sectors to calculate and report greenhouse gas emissions. It categorizes these emissions into three scopes that assist in determining the carbon footprint of individuals or companies: Scope 1 focuses on direct emissions from owned or controlled sources, Scope 2 deals with indirect emissions from purchased electricity or energy consumption, and Scope 3 encompasses all other indirect emissions throughout a company’s value chain.
The food and agriculture sector holds great importance, as it provides sustenance and resources for people around the world. However, at the same time, it accounts for approximately 20.1% of global greenhouse gas (GHG) emissions across all sectors [3], and this trend is expected to continue, driven by increasing population demands. A report from the World Economic Forum highlights a 48% surge in demand for food and agriculture products over the past 18 years (2001–2018), more than double the population growth [4]. The aquaculture industry, in particular, is rapidly expanding and expected to play an increasingly critical role in meeting the global food demand in the future. Therefore, effective resource management in agriculture is vital for promoting sustainable production and consumption, aligning with Sustainable Development Goal (SDG) 13 on sustainable consumption and production [5] and SDG 2 on zero hunger.
Thailand, one of the world’s foremost agricultural and food-exporting nations, stands 20th in greenhouse gas emissions, contributing 437.18 Mt CO2e in 2019, with agricultural emissions accounting for 15% of this total [6]. The majority of Thai farmers operate as small-scale producers and are facing limited access to capital, resources, technology, and market influence. Cultivating accessible knowledge and skills in streamlined resource assessment and management is imperative, as it empowers small-scale farmers to optimize resource utilization, mitigate environmental impacts, and foster sustainability [7].
Resource assessment and management incorporate the systematic planning, potential evaluation, and regulatory control of diverse resources, including natural, human-made, and financial resources. Many studies indicate that resource management can be approached through two primary dimensions: (1) optimizing the efficient use of resources, such as water, materials, and energy, and (2) mitigating emissions and environmental impacts, including global warming, acidification, and eutrophication, for enhanced sustainability in production and consumption [8,9].
1.1. Resource Use Efficiency
Resource use efficiency is used to assess the patterns and trends in optimizing limited resources in order to achieve predetermined goals by analyzing the demand and supply in the system. In tandem with resource use control, a reduction in losses and waste during production, a tenet of lean manufacturing, stands as a crucial principle for enhancing resource efficiency and trimming production costs. Losses often stem from activities that consume resources without yielding the intended output—such as a machine running without production due to raw material delays or repairs, resulting in wasted oil or electricity. Simultaneously, waste arises from the unnecessary depletion of resources, exemplified by overproduction, surplus inventory, and reproduced products [10].
There are numerous indicators, according to an extensive literature review, such as water, land, nutrient, or energy use per unit of production, that have been proposed and applied to enhance input allocation in production. To a large extent, many studies focus on the efforts to enhance resource use efficiency, spanning all three dimensions of sustainability: environmental; social; and economic aspects, such as labor hours per unit of production and the income-to-investment ratio [11,12]. However, these indicators only provide a holistic view and cannot specify the areas that require improvements to reduce loss and waste [13,14,15,16,17]. In the pursuit of waste reduction, lean tools have been continuously developed.
The implementation of lean manufacturing concepts has been applied across a range of agricultural sectors, including rice cultivation, shrimp farming, and poultry farming [18,19]. Each lean tool employs a distinct method for minimizing losses and waste, tailored to the specific production process. For instance, Heijunka is utilized to level production and mitigate customer demand fluctuations. This approach promotes judicious resource and workflow utilization and prevents over/underproduction. However, this tool may necessitate setup costs and software infrastructure, potentially leading to the underutilization of equipment, machinery, or labor.
Layout optimization aims to enhance workspace efficiency and minimize waste by reorganizing equipment, creating task-specific areas, incorporating ergonomic tools, and adding more storage. However, it is essential to consider the potential costs alongside these benefits. It optimizes the use of resources, including space, equipment, and labor, by reducing unnecessary movements, storage, and energy consumption. This results in efficient resource utilization, contributing to cost savings and reducing the environmental impact of the facility. Furthermore, this focus on resource efficiency aligns with sustainability goals and can lead to long-term economic and environmental benefits [20].
Value Stream Mapping (VSM) is another commonly applied tool for distinguishing non-value-added activities from value-added ones based on customer demand, offering a visual depiction of resource utilization either in the product supply chain or in operating processes to identify waste. However, improper VSM mapping can introduce complexity, necessitating expertise and time for effective communication [18,19]. VSM has evolved to incorporate environmental considerations, beginning with the assessment of energy usage through Energy Value Stream Mapping [21]. Its scope has expanded to encompass the analysis of water, air resources, and machine emissions. Additionally, it is used to evaluate the safety and working conditions of employees, recognizing their significance as essential resources in operations aligned with social sustainability [12,22,23,24,25].
Unfortunately, the aforementioned traditional lean tools, including VSM, only focus on reducing lead time and the limited access to critical resource utilization points. Hence, Papetti et al. (2019) recently proposed the Resource Value Mapping (REVAM) tool [26]. Unlike traditional lean tools, REVAM prioritizes efficiency by minimizing resource use in non-value-added activities (resource waste). It outlines the flow of resources in production, classifies activities based on customer demand, and identifies critical points through financial perspectives. Although case studies employing REVAM have demonstrated its rapid identification of areas for improvement and ease of communication, it can also be used to assess energy use in SMEs [27]. Apparently, it has been widely used in the industrial sector but has had fewer applications in aquaculture.
1.2. Environment Impact Mitigation
Environment impact mitigation is a process for identifying and assessing the potential environmental impacts of resource use, including greenhouse gas emissions. Beyond the principles of reducing, reusing, and recycling, resource selection is crucial, as different resources contribute to varying levels of greenhouse gas emissions. Reducing or preventing the emission of greenhouse gases may involve adopting innovative technologies and sustainable energy sources, enhancing the energy efficiency of older equipment, or modifying management approaches and consumption behavior [28].
Life Cycle Assessment (LCA) is an organizational tool used for evaluating resources, enhancing production, and mitigating environmental impacts. It is commonly applied both independently and in combination with other tools [29]. Conversely, when it comes to assessments that exclusively focus on carbon dioxide and greenhouse gas impacts stemming from human activities, a carbon footprint analysis [8,30,31] is often utilized. Compared to the LCA method, it requires less time for data collection, less expertise for analysis and interpretation, and lower installation costs [7].
1.3. Research Framework
A literature review of resource management found that many tools can be employed to separately assess resource use efficiency and environment impact mitigation, whilst some tools can address both dimensions together. However, the proper selection of tools remains a complex process, particularly for small-scale producers. Therefore, this study aims to establish criteria for selecting relevant tools, which can assess and manage resources in both dimensions, and then it provides the recommended tools that are specifically beneficial for smallholders based on the established criteria, as shown in Figure 1.
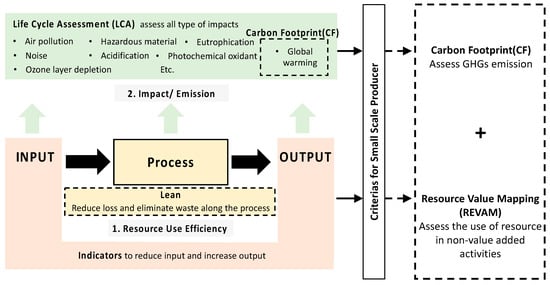
Figure 1.
The framework of two combined methods for resource management.
These criteria, which encompass input data, usage, data analysis, assessment interpretation, and practical recommendations, tailored for the convenience of small-business operators, are illustrated in Table 1. Meanwhile, the criteria for tool and indicator analyses are outlined in Table 2.

Table 1.
Assessment criteria for energy and resource evaluation methods and tools.
Table 2.
Evaluation of energy and resource methods/tools based on the identified criteria for small-scale producers.
In the criteria table, the light circle symbol in each criterion indicates that small-scale producers can use these methods/tools to assess both resource use efficiency and impacts. Furthermore, they can readily employ and obtain practical recommendations. However, half-dark and dark circles indicate a greater level of complexity in the operation of the methods/tools, leading to more intricate outcomes as a result of the involvement of experts to interpret the results. For instance, the LCA and Input–Output (IO) analysis model has three half-dark circles and one dark circle, indicating that this tool possesses abundant data, is relatively simple to analyze, and offers valuable insights but can only evaluate impact in a specific dimension.
The findings indicate that most of the resource efficiency indicators and tools based on lean concepts can mostly collect data from production but require expert skills for usage, data analysis, and interpretation. However, the REVAM tool, derived from VSM, stands out for its accessibility in terms of analysis and interpretation. In cases requiring a simultaneous environmental impact assessment, a simplified LCA can be proposed to streamline data collection and enhance usability [32,34,35], yet it still requires expert interpretation. However, carbon footprints, used for assessing greenhouse gas emissions, are more straightforward and require less advanced skills.
This research, as a result, presents a thorough framework for comprehensively assessing resource use efficiency and environmental impact in the agricultural sector, with a focus on assisting small-scale producers in the response to the increasing demand for sustainable food production. The goal of the framework is to reduce greenhouse gas (GHG) emissions, specifically focusing on Scopes 1 and 2. Furthermore, this particular framework also deals with the management of resources linked to acquired purchased products and services within Scope 3. Furthermore, numerous research studies have put forth models that can be used to decrease GHG (greenhouse gas) emissions. The initial step involves evaluating the present level of greenhouse gas (GHG) emissions, similar to established frameworks such as the Greenhouse Gas Protocol (GHG Protocol), Carbon Disclosure Project (CDP), or Partnership for Carbon Accounting Financials (PCAF) [36]. These models facilitate the process of assessing and evaluating greenhouse gas (GHG) emissions by providing a comprehensive comparison of emissions within organizations across various scopes. Next, employing the Sustainability Impact and Effects Analysis model, operating strategies are formulated [37]. This model is utilized in risk management to aid companies in designing sustainable product development plans. Subsequently, continuous monitoring and evaluation of performance are conducted to enhance it.
Therefore, these purpose-driven models (REVAM and CF) significantly contribute to enhancing environmental impact management, aiding established models [36,37]. By enhancing their ability to rapidly scan and analyze resource utilization and greenhouse gas emissions during the initial phase of business operations, these models can improve our understanding of resource impacts, identify key areas for operational enhancements, and pinpoint significant emission sources. Combining these purpose-driven models with the exemplified models offers a comprehensive approach that could significantly mitigate risks and foster increased sustainability in business operations.
The key contributions of this study, compared to related research, include the following:
- (i)
- This study provides fisheries with a cost-effective tool for self-monitoring, managing resource use, identifying inefficiencies, pinpointing greenhouse gas sources, and fostering sustainable and profitable agricultural practices in terms of production and environmental impact.
- (ii)
- This study provides insights into the opportunities for improving resource utilization and reducing environmental impacts in the agricultural sector for small-scale producers.
2. Materials and Methods
This study introduces an alternative resource management approach for small-scale aquaculture fisheries by merging the REVAM and carbon footprint methodologies to comprehensively assess resource use efficiency and environmental impacts. This section outlines the five steps of REVAM to understand the original process [26]; afterward, the proposed REVAM is applied in the context of the agriculture and food sector. Section 2.1 elaborates on the application of carbon footprints within the proposed model, while Section 2.2 presents a case study on tilapia farming using both in-pond and IPRS systems to test the assessment methods.
2.1. Resource Value Mapping (REVEM)
A five-step innovative method, introduced by Papetti et al., 2019 [26], was applied to analyze and optimize manufacturing processes to achieve optimal energy and resource utilization:
Step 1. Set goal and boundary definitions.
Step 2. Develop an overall site plan for a comprehensive understanding of resource utilization in each process and for providing an overview of the production process and its workflows.
Step 3. Collect and categorize all data related to the following:
- (i)
- Resources: the consumption of resources in each production process.
- (ii)
- Assets: all asset characteristics, such as name, power, and operating time (including machines and non-machines in an agricultural context).
- (iii)
- Processes: production flow, which consists of the classification of activities according to the lean philosophy principles:
- Value-added (VA) activities are the operations that directly benefit the customer by enhancing the product or service.
- Non-value-added (NVA) activities include the operations that are necessary but do not directly affect the customer.
- Waste (W) activities are operations that are entirely unnecessary and should be eliminated to improve efficiency and reduce costs.
Step 4. Apply Resource Value Mapping.
REVAM presents a visualization of resource consumption contributions for each process and highlights the VA, NVA, and W percentages using the “Process Box” format in order to identify areas for improvement within each activity. As shown in Figure 2a, there are three distinct sections.
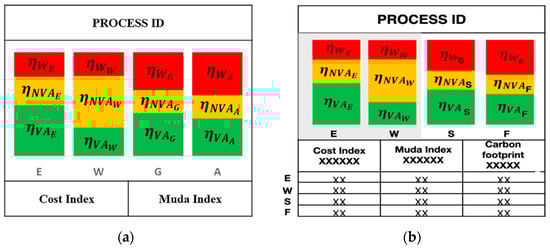
Figure 2.
(a) Conventional REVAM process and (b) proposed REVAM combined with carbon footprint process.
- (i)
- The upper part of the box contains the ID process.
- (ii)
- The middle part displays the resources allocated to each activity, categorized by yield and colored bars. The equations for calculating the indicators contained in the process box are detailed below.
is the yield related to resource consumed by VA activities in relation to the total resource consumption. Ideally, it should be 100%.
is the yield related to resource consumed by NVA activities compared to the total resource consumption. This value should be minimized.
is the yield related to resource consumed by W activities compared to the total resource consumption. Ideally, it should be 0%.
Meanwhile, is the minimum quantity of resource required (in theory) to transform a material into a product consumed by VA activities (). is calculated as the sum of hourly consumptions per unit of VA activities () multiplied by the duration (). This calculation accounts for any discrepancy between theoretical and measured/estimated values, which reflects machinery inefficiency (resource waste). The equation is shown below:
is the amount of resource consumed by NVA activities , which refers to the quantity of essential auxiliary resources needed for a process that does not directly enhance the material or semi-finished product. It is calculated as the sum of hourly consumptions per unit of NVA activities multiplied by the duration ():
is the amount of resource consumed by W activities , which refers to the resource loss due to machinery misuse, failures, or improper equipment use. It is calculated as the sum of hourly consumptions per unit of W activities ( multiplied by the duration :
- (iii)
- The bottom part displays the results through two financial indicators:
The Cost Index (CI) helps in identifying the processes responsible for the highest cost related to resource consumption. This is calculated as the sum of the unit cost of the resource ( multiplied by the relative total amount of resource consumed:
The Muda Index (MI) quantifies the cost of resources not related to VA activities, highlighting critical flows. A higher MI value indicates a greater need for corrective actions in the considered process. As for the resources consumed by W activities, they are multiplied by a coefficient greater than one to specifically emphasize the indicator’s focus on wasted resources from W compared to NVA activities [9]. This is calculated using the following equation:
Step 5. To formulate improvement strategies, define an action plan to eliminate W resources, reduce the consumption of NVA resources, and maximize the resource efficiency of VA activities by focusing on processes with the highest MI values.
2.2. Carbon Footprint
In order to estimate the greenhouse gas emissions per unit of available activity, the use of an emission factor (EF), which acts as a coefficient that converts activity data into GHG emissions, is necessary, as illustrated in Equation (9). The EF can be obtained from either the IPCC report or the Thai Greenhouse Gas Management Organization (Appendix B) [38]. The quantification of GHG emissions is expressed as the carbon dioxide equivalent (CO2e), which is aligned within the scope of the production process.
GHG emissions = Activity data × Emission Factors
We recognized that there is a potential synergy between carbon footprint activity data and the data collected in step 3 of REVAM, as both datasets reveal the extent of resource utilization in each process. Consequently, a proposed process box (Figure 2b) was introduced to cohesively present CI, MI, and emission data for comprehensive resource assessment and management. Moreover, the proposed process box can facilitate a clear differentiation between contributions from resources used with machines (gray side) and those used without machines (white side). These results can serve as a foundation for devising strategies to enhance resource efficiency and, more specifically, address environmental impact.
2.3. The Proposed REVAM Model
In step 3 of conventional REVAM, lean principles are applied to guide activity classification in the industrial context. By transitioning these lean principles into the agricultural context, small-scale producers can gain a better understanding of agricultural production’s unique aspects, including both machinery- and non-machinery-related resource use (as detailed in Table 3), which is crucial for the accurate classification of activities. Subsequently, conventional equations 1–8 in step 4 are applied in a similar manner as in the proposed REVAM for visualization.
Table 3.
Eight wastes from lean manufacturing principles in agriculture context.
2.4. Study Area and System Description
Monoculture and polyculture are both efficient fish farming methods. Each method possesses unique advantages and disadvantages. Monoculture, despite its advantages such as higher productivity, easier management of feeding and harvesting, consistent growth rates, and specialization in niche markets, is susceptible to risks such as pests, diseases, and market fluctuations. However, polyculture, while effectively using resources and manage waste, is less productive than monoculture methods. Nevertheless, it offers benefits such as organic pest management and enhanced biodiversity.
This study applied the proposed REVEM model by utilizing data from a Thai farm, referred to as the “case”, which is experimenting with an In-Pond Raceway System (IPRS) for Nile tilapia production. The goal was to enhance production standards and use the innovative water circulation system as a guide for advancing Nile tilapia farming compared to the conventional pond-based system (Figure 3a,b). The comparison of Nile tilapia production in ponds and the IPRS innovation highlights the unique strengths and challenges of each method.
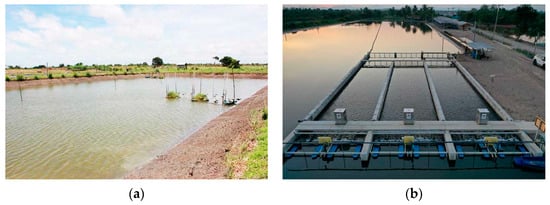
Figure 3.
(a) Conventional tilapia production system and (b) In-Pond Raceway System. Source: siamwaterflame.com, https://bangkokbanksme.com/en/passion-manit-group (accessed on 13 July 2022).
- Conventional Tilapia Production Systems
In Thailand, the predominant method for tilapia production, which accounts for approximately 90% of all production, is rearing tilapia in ponds with a natural environment conducive to their growth. This process includes soil preparation, irrigation, and stocking juvenile tilapia at a rate of 1–3 fish per square meter or 2000–5000 fish per rai (a unit of area equal to 1600 square meters). The rearing cycle lasts for 150–180 days, yielding approximately 1.5–2 tons per rai. For commercial farming, it is advisable to have multiple ponds to allow for pond drying to decompose fish waste between cycles, which typically takes around 30–60 days [39].
- b.
- In-Pond Raceway Systems (IPRSs)
This is an innovative aquaculture approach that combines the strengths of in-pond and raceway systems, offering disease risk reduction and precise water quality control. The raceway was designed with a sloped bottom at the head-end to facilitate the movement of fish waste, such as feces and uneaten feed, acting as a filtration system. This arrangement allows for the convenient removal of debris from the pond, which is connected to the sludge suction tank, providing the opportunity to repurpose waste as valuable “biological fertilizers” for plant cultivation. This facilitates a sustainable process of nutrient utilization. Within IPRSs, fish are densely contained in raceways, making them highly susceptible to rapid disease outbreaks. Nevertheless, these systems facilitate the prompt identification of disease indicators, thereby enabling more rapid confinement than larger ponds. Eliminating lifeless or deceased fish is a simple task that helps to decrease the spread of infections. Moreover, the use of medicated feed can effectively control diseases in fish that still consume food, thereby improving disease management techniques within the system [40]. A noteworthy benefit is being able to avoid the post-harvest pond drainage and drying stage, facilitating uninterrupted aquaculture operations for extended periods often reaching up to 3 consecutive years or more, subject to the specific environmental conditions of the region [41].
Most studies on IPRSs predominantly concentrate on aspects within the domains of fisheries science and chemistry, such as dissolved oxygen levels, the feed conversion ratio (FCR) compared to economic analyses, biomass productivity, and microalgae growth. A significant challenge in IPRSs lies in their heavy reliance on round-the-clock electricity to support water circulation and sludge removal systems, thereby encouraging a comprehensive assessment of their resource efficiency and environmental impact to address this energy-intensive aspect in this study.
Rearing tilapia in both pond systems and IPRSs allows for a choice between monoculture and polyculture. In particular, an IPRS facilitates both approaches in the same pond by isolating a tilapia monoculture within specific cells in the IPRS rearing area while enabling cohabitation with other aquatic species, like white shrimp, outside these cells. This practice effectively reduces expenses while enhancing productivity and generating additional income from shrimp sales during the tilapia growth phase. Alternatively, various fish species can be concurrently reared in separate cells within the system.
- c.
- Tilapia Production
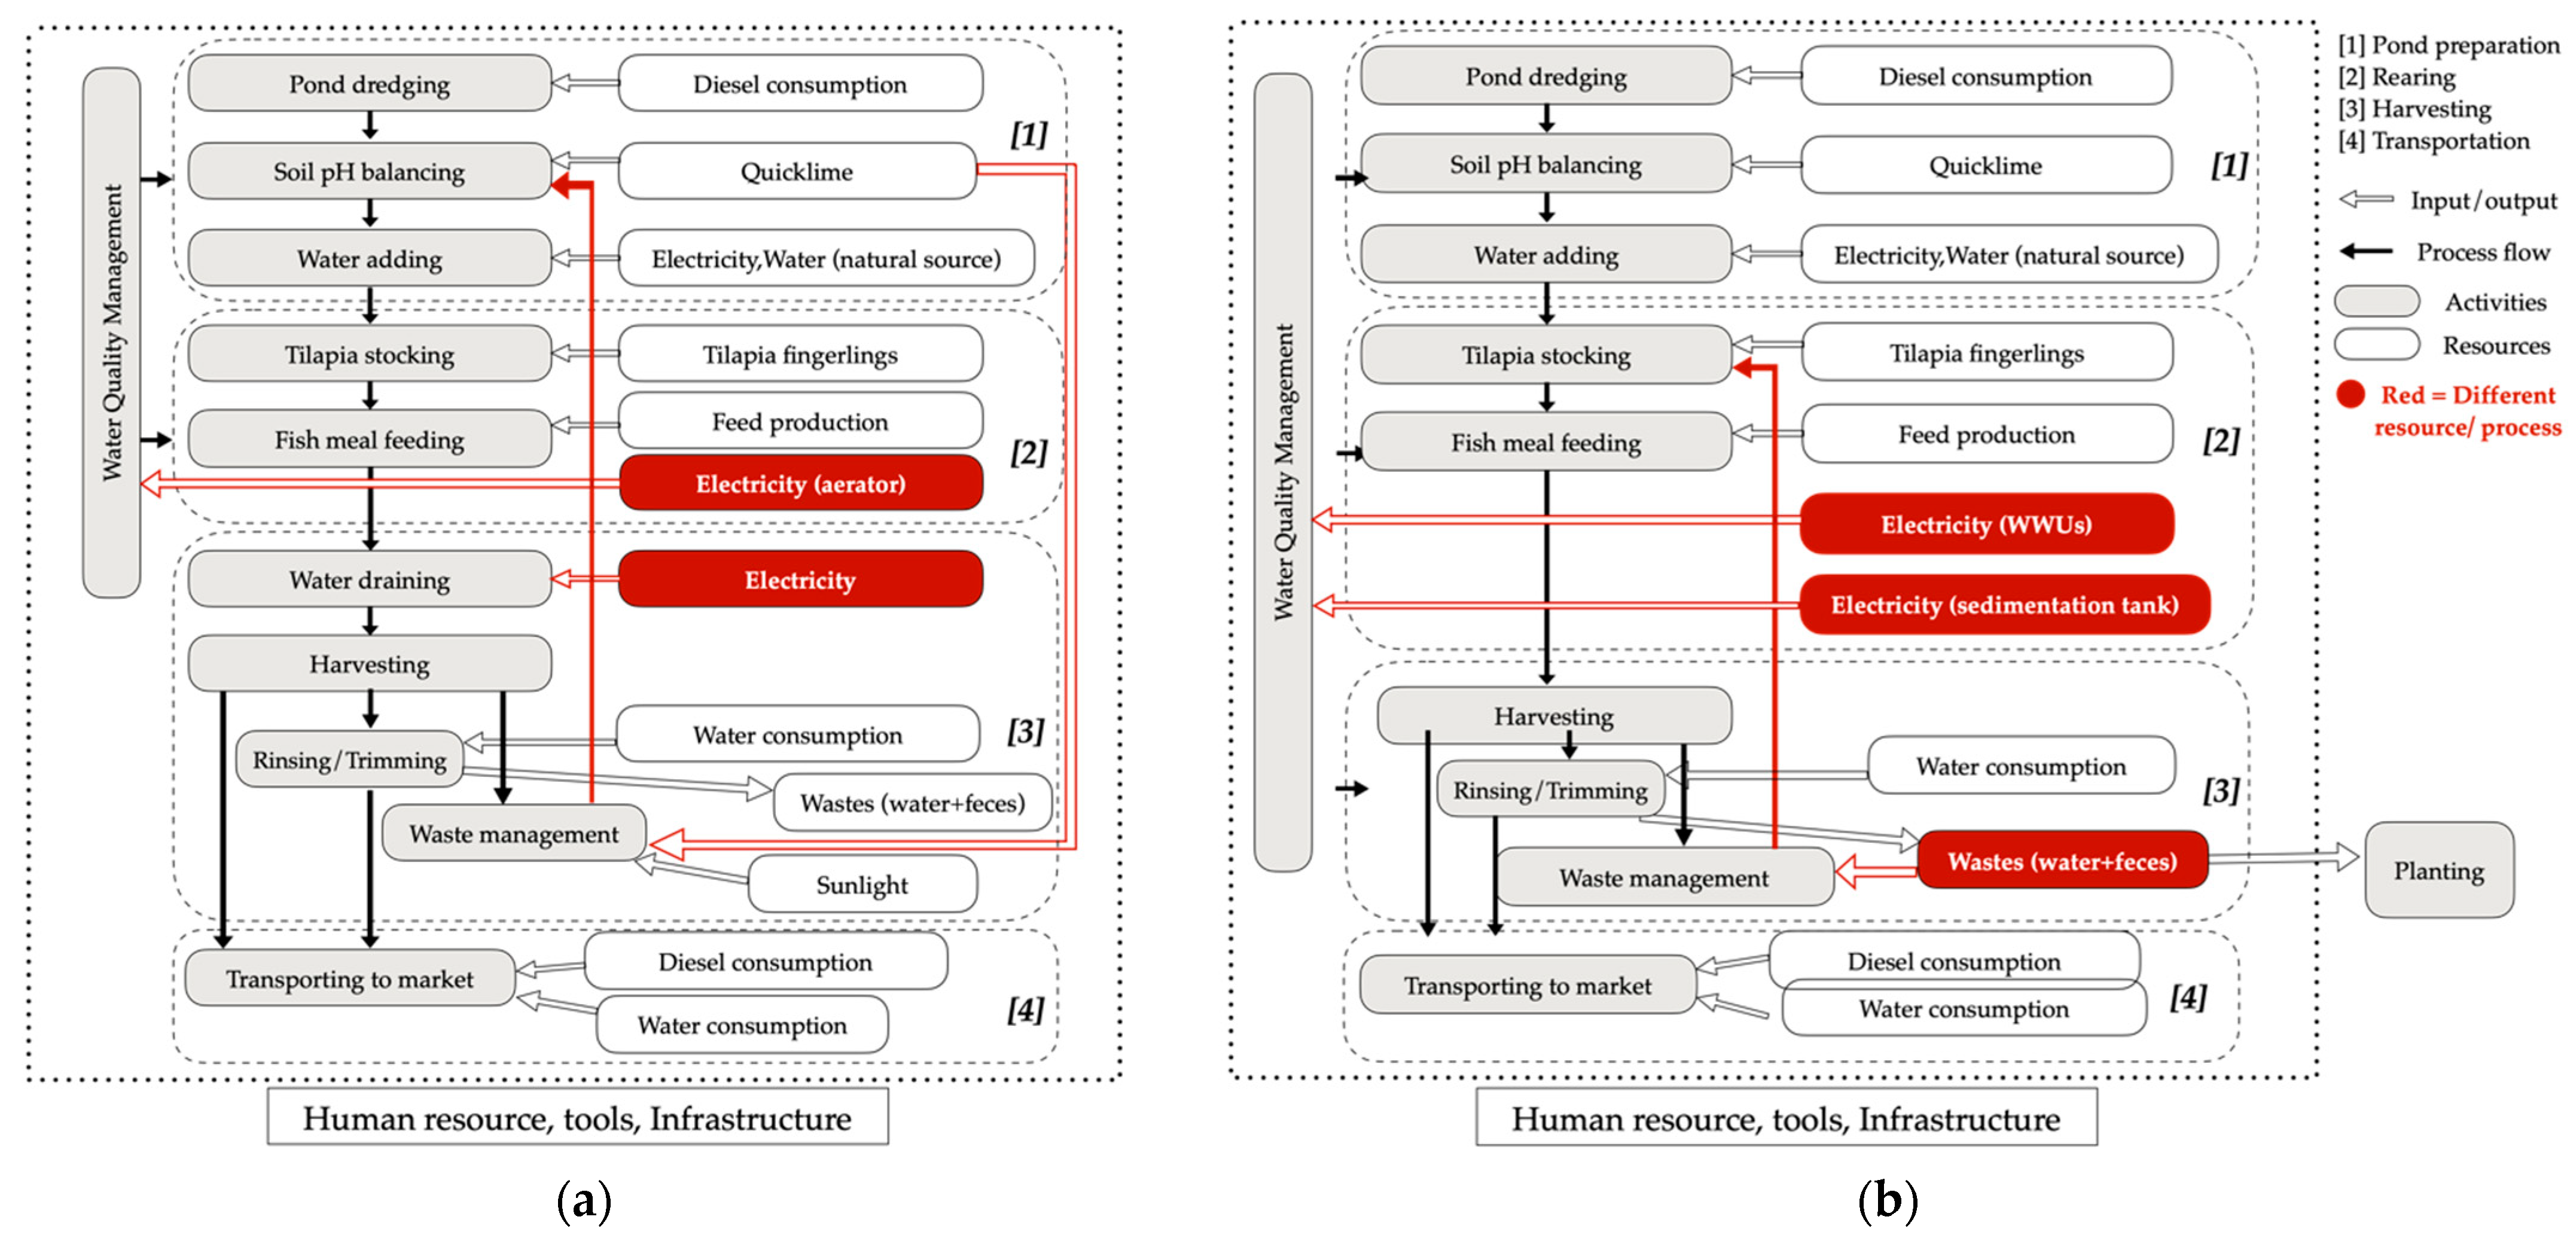
As the majority of farmers typically do not engage in fish breeding but instead purchase fingerlings and subsequently nurture them until they attain the desired market weight, tilapia farming can be segmented into four principal phases: (1) pond preparation, (2) rearing, (3) fish harvesting, and (4) transportation. While each phase of tilapia production in both in-pond systems and IPRSs entails similar activities, IPRS farming differs in the feeding system and water quality maintenance, leading to divergent resource utilization patterns, as depicted in Figure 4a,b.
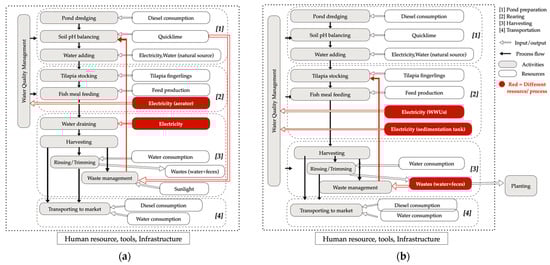
Figure 4.
Resource use and tilapia production flow process. (a) Conventional tilapia production; (b) IPRS tilapia production.
3. Application of REVAM and Carbon Footprint Methodology to the Case Study
The data regarding the operation of the IPRS, resource utilization, rearing duration, and yield were acquired from a case study that conducted experiments involving an IPRS in tandem with conventional tilapia farming in ponds.
Tilapia Aquaculture Farm Analysis
Aquaculture relies on diverse resources, encompassing electricity; water; and primary components such as fish feed, fingerlings, and chemicals. Even with machinery, it is vital to prioritize production control and resource awareness. REVAM’s goal is to understand the resource flow and value within activities to devise strategies for reducing waste.
This study focused on the grow-out period to customer transportation, involving the four core processes mentioned in Section 2.4 (c). For pond preparation, both tilapia production systems use ponds of the same size and share the same resources, such as diesel, electricity, water, and quicklime. However, the water quality maintenance systems are different, as pond systems employ electricity for water aerators, while IPRSs use White Water Units (WWUs) for water circulation and sludge removal. Resource usage for fingerlings and fish feed varies following the system capacity. After harvesting, the fish undergo a cleaning process using water: rinsing and trimming. Then, chilled fish are transported using diesel-powered vehicles, while living fish are transported in water tanks. Hence, six key resources—diesel, water, electricity, fish feed, fingerlings, and quicklime—were assessed in this study. The evaluation encompassed the utilization of these resources per production cycle, as detailed in Table 4.
Table 4.
Quantification of resource consumption by process.
The activities within the four core processes were classified to identify the appropriate resource allocation, as outlined in Table 5. Non-value-added (NVA) and waste (W) activities arise from waiting time, engine start-up, fish mortality, or excessive resource consumption. Due to the limited available data, we made assumptions to derive the diesel and electricity consumption rates and fish survival rates, which are aligned with the recommended benchmarks for resource utilization by the Food and Agriculture Organization (FAO) [42].
Table 5.
Classification of tilapia production.
4. Results
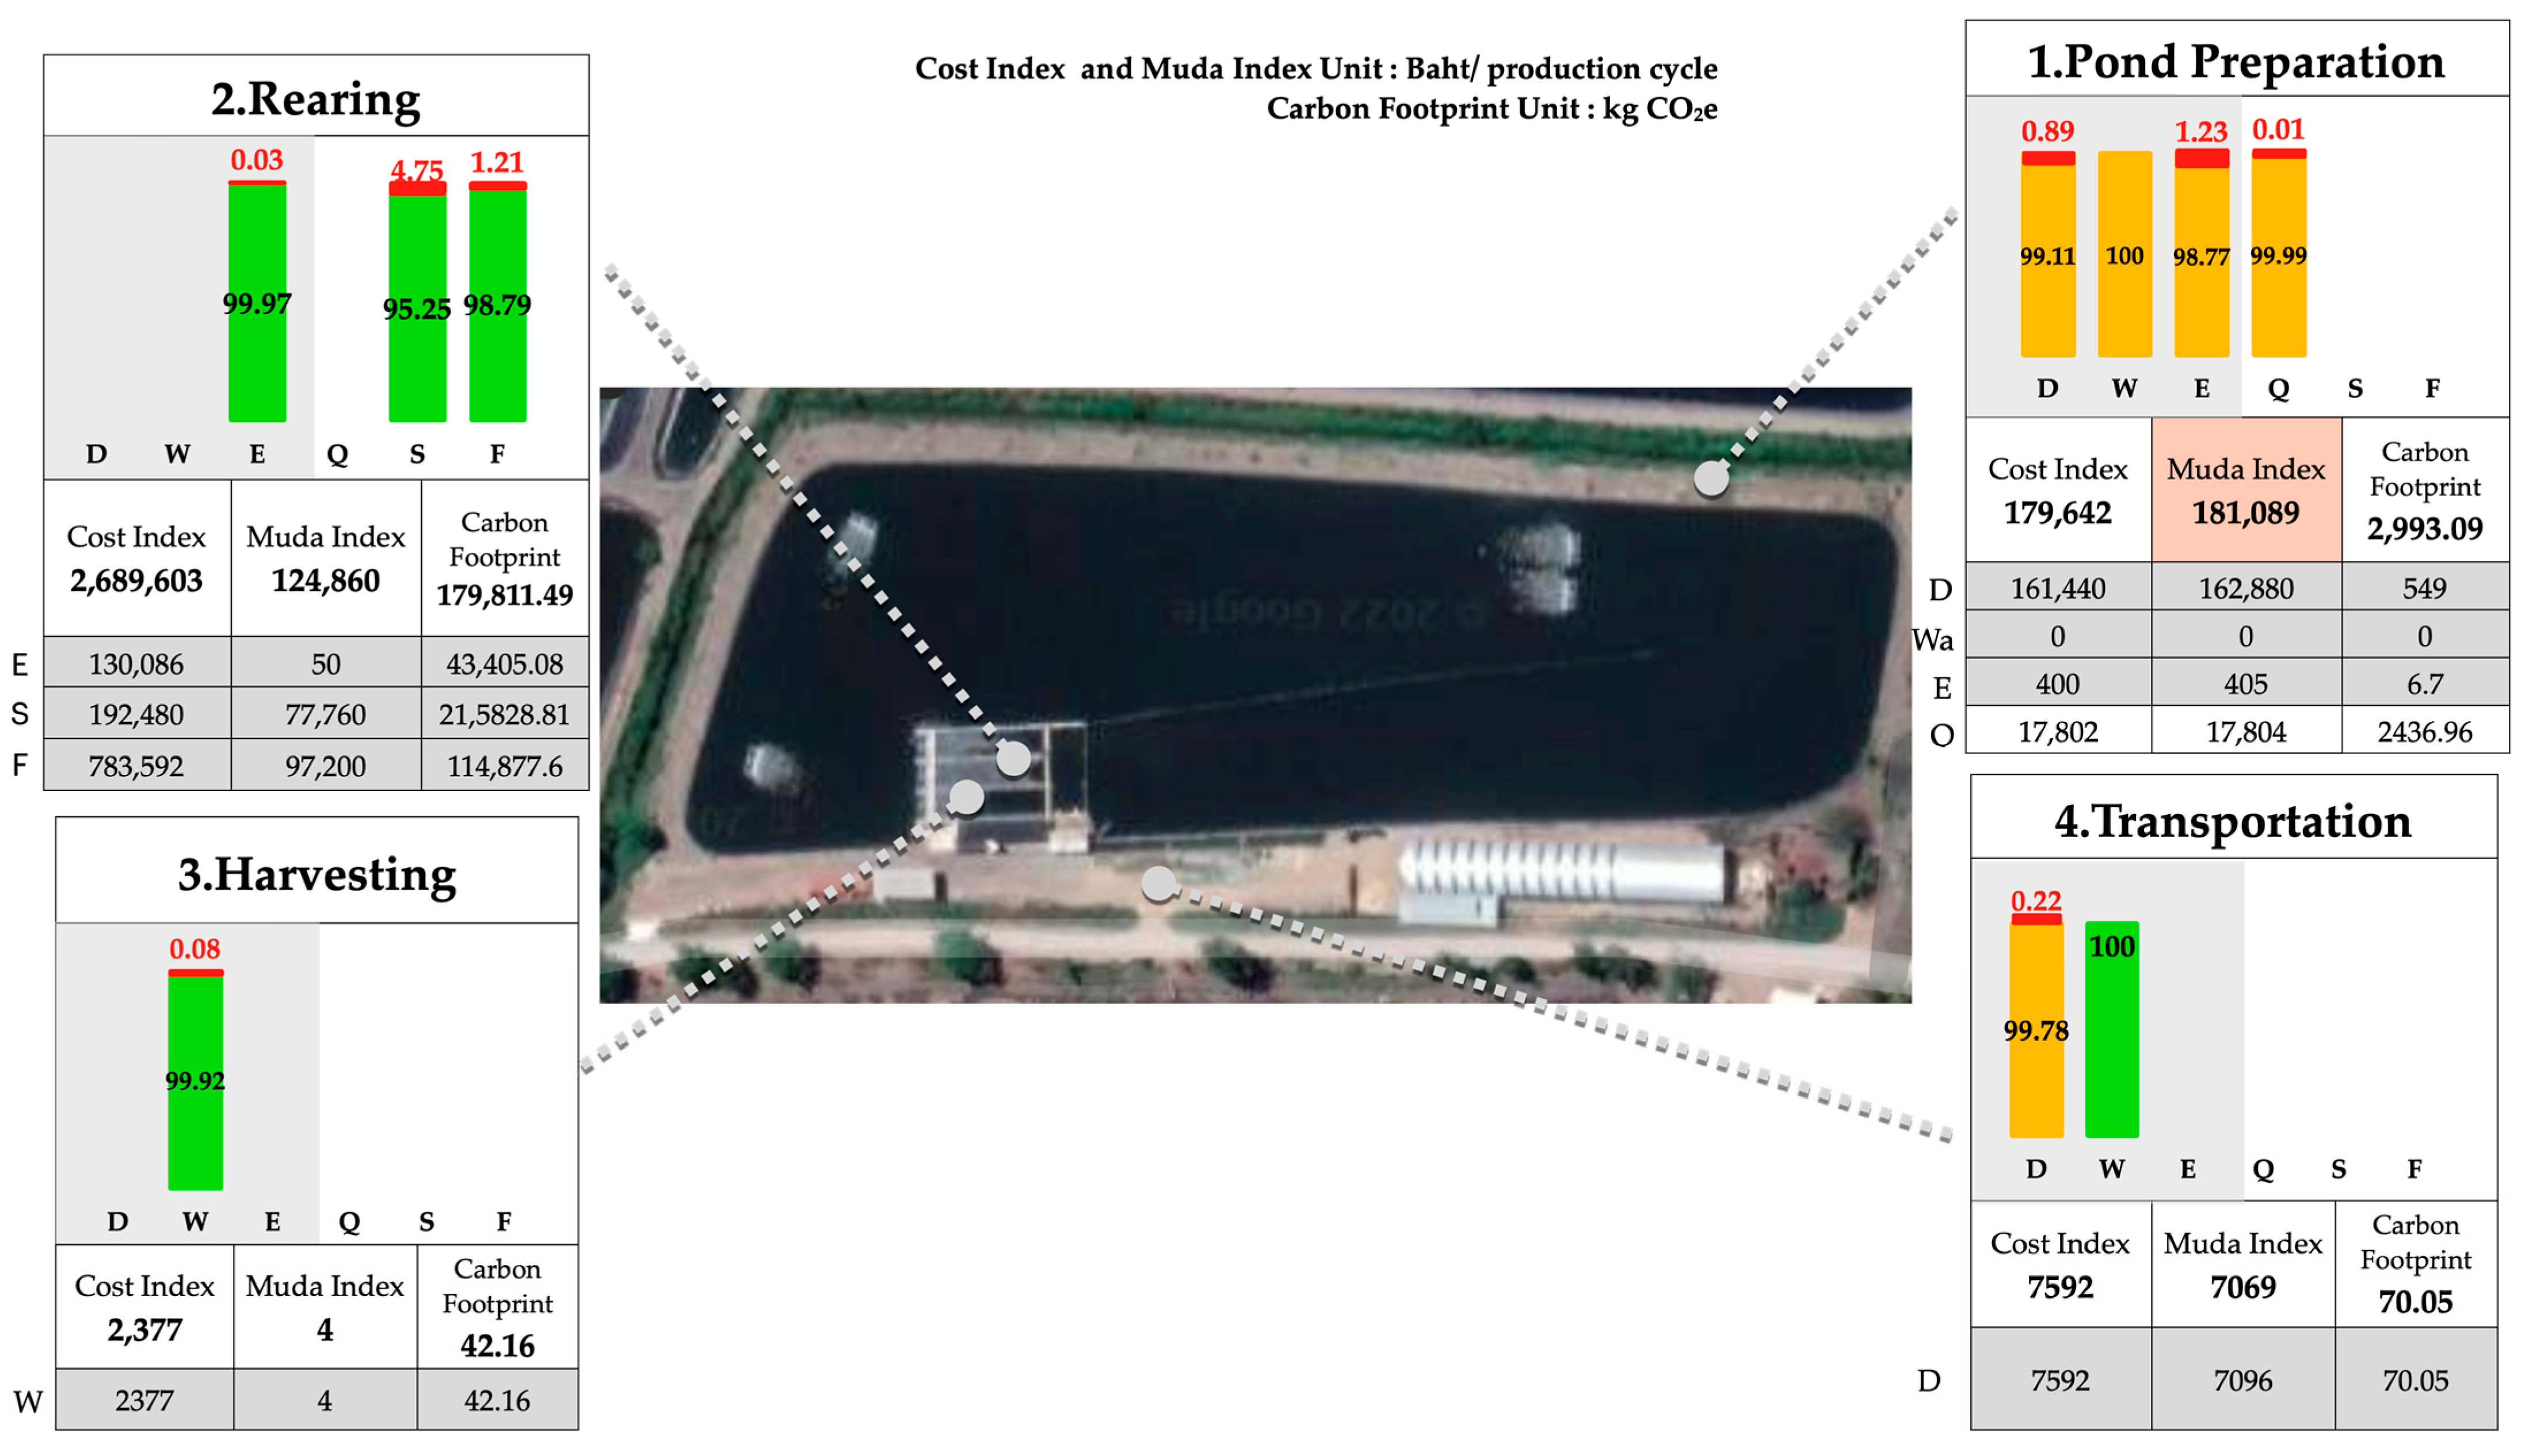
The collected data were analyzed according to the indicators, and the results, calculated follow by the Appendix A, are presented in Figure 5 and Figure 6, with detailed information on MI and GHG emissions in Table 6. The findings highlight that pond preparation was the most critical process in both systems, with identical CI and MI values, in which pond excavation was the primary contributor to MI values at 89.95%, followed by quicklime for pond conditioning at 9.83% and electricity for water pumping at 0.22%.
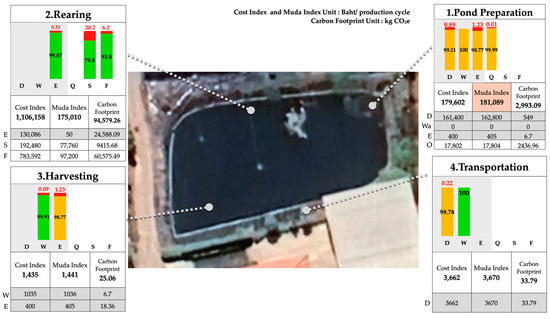
Figure 5.
In-pond tilapia production (conventional) [43].
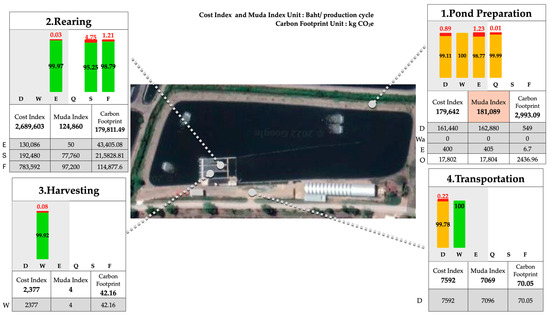
Figure 6.
IPRS tilapia production [43].
Table 6.
Muda Index and GHG emissions in tilapia production: pond system vs. IPRS.
Feeding and water quality management involving water aerators (pond) and WWUs (IPRS), as well as fish harvesting within the rearing and harvesting processes in both systems, were the core activities that directly impacted quality and customer demands and were classified as VA activities; they exhibited lower MI values than pond preparation. Nonetheless, they involved the highest resource cost , which varied with production capacity. In ponds, 60.70% of the cost was attributed to fish feed, 14.19% to the fingerlings, and 10.08% to the electricity used for water aeration during rearing. Of the costs for the pond preparation process, 12.51% was used for diesel used in pond excavation, 1.38% for quicklime, and 0.03% for the electricity employed in water pumping. Of the transportation costs, 0.28% was used for diesel; however, there was no associated cost for transporting living fish, as the water used was directly drawn from the pond.
Regarding the rearing process, the IPRS was three times more productive than the pond system and consequently incurred more resource costs due to substantial expenses for fish feed (53.47%), fingerlings (32.01%), and electricity for water circulation and sediment removal during rearing (7.93%). The second most expensive process was pond preparation, including expenditures for the diesel used in pond excavation (5.61%), quicklime (0.62%), and electricity for water pumping (0.01%). The transportation costs included the cost of the diesel (0.26%), while there was no extra cost for living fish transportation using pond water. Harvesting was the least resource-intensive process in both systems, with the primary cost being tap water for fish rinsing and trimming (0.08%). In comparison, in the pond system, there was an additional cost associated with electricity for water draining before harvesting (0.03%).
Supporting activities like water draining (only in the pond system), fish rinsing, trimming, and transportation (in both the pond system and IPRS) are non-value-added activities, except for in cases in which customers demand living fish, where water resources become value-added resources during transportation. Consequently, the waste in these processes only had minimal effects on the MI value.
The GHG emissions associated with the production of Nile tilapia in both systems revealed that the rearing process was the primary contributor to the emissions. In the pond system, a total of 94,579.26 kg CO2e were emitted, with fish feeding activities accounting for 60,575.49 kg CO2e. The second-highest emissions were attributed to the pond preparation process, emitting 2993.09 kg CO2e. Transportation contributed 33.79 kg CO2e to the total emissions, while the harvesting process had the lowest greenhouse gas emissions at 25.06 kg CO2e. The cumulative emissions from all processes amounted to 97,640.74 kg CO2e.
The IPRS generated a total of 179,811.49 kg CO2e in GHG emissions, with fish feeding activities contributing the most at 114,877.60 kg CO2e. The second-highest emissions were from pond preparation, totaling 2993.09 kg CO2e. Transportation accounted for 70.05 kg CO2e, while the harvesting process had the lowest emissions at 42.16 kg CO2e. The cumulative emissions from all processes amounted to 182,916.80 kg CO2e.
Improvement Strategy
The resource efficiency assessment using the MI indicator revealed that the excavation activities during pond preparation in both Nile tilapia production systems had the highest MI values. Elevated MI values in machine resources were linked to losses during engine start-up, waiting time, and delays. The strategies for improvement involve machine shutdown during idle time [26], minimizing system losses, and considering the use of fuel-efficient excavators or biomass fuels [44,45,46]. Non-machine resource losses were primarily due to excessive use, particularly with quicklime for pond conditioning. The strategy for improvement entails more controlled usage through efficient management practices, including precise quantity measurement and the use of suitable measuring equipment [47].
Moreover, the greatest environmental impact arose from non-machine resources. The carbon footprint assessment of Nile tilapia production in the pond system and IPRS revealed that the rearing process exhibited the highest GHG emissions, primarily attributed to the fish feed. To mitigate this impact, adjusting the feeding method, such as employing a swing pattern [48], or utilizing innovative approaches like IPRS, which confines fish to a limited area and ensures uniform feeding [49], can reduce the excess usage of fish feed. If reducing the amount of food is challenging, adjusting the fish feed formula by substituting fish meal and fish oil with alternatives like soybean meal, poultry feed, and fish trimming by-products offers a less environmentally impactful option [50,51]. Subsequent to the rearing process, it is noteworthy that quicklime in pond preparation, with both a high MI value and equivalent carbon dioxide emissions, can be replaced with finely ground eggshells to adjust the soil pH balance for fish farming, thereby reducing the carbon footprint [52,53].
Therefore, improvement strategies were previously introduced with the aim of reducing GHG emissions across different scopes. This involved decreasing the energy and fuel consumption through the adoption of biofuels (Scope 1) and reducing electricity usage via shutdowns (Scope 2) or loss minimization (Scopes 1 and 2). To address the environmental impacts, changes in feeding practices, the utilization of weighing equipment, the adoption of alternative raw materials, and the incorporation of closed-system fish farming technologies were implemented within Scope 3.
5. Discussion
Balancing production demands with environmental concerns, especially amid amplified climate change challenges, is crucial. All sectors are under increasing pressure to boost production efficiency and reduce raw material use for sustainability. In particular, in agriculture, small-scale farmers facing resource limitations need specialized tools for efficient resource management and environmental impact reduction to attain sustainability. This study introduces a framework focusing on resource efficiency and environmental impact for small-scale producers by proposing a combined REVAM and carbon footprint method. The objective was to provide a method for conducting a comprehensive assessment of resource utilization efficiency and environmental impact within the agricultural sector to allow small-scale producers to identify critical areas that utilize resources without generating value, facilitating the identification of areas with significant greenhouse gas (GHG) emissions, leading to improvements in resource utilization and a reduction in GHG emissions.
The results from both the pond system and IPRS (Figure 5 and Figure 6) indicate that the rearing process, particularly fish feed (F), exhibited the highest waste ratios, at 20.20% and 4.75%, respectively, surpassing all other processes and resources. Despite not holding the highest MI value, the rearing process demonstrated a notable waste ratio (red bar graph). Therefore, REVAM not only guides improvements in areas with high MI values but also identifies waste in other areas, contributing to an overall improvement in resource use efficiency.
The REVAM analysis commences by identifying the process with the highest MI value to pinpoint critical areas for improving resource use through financial indicators. Subsequently, it prioritizes resource enhancement based on the percentage of waste from the bar chart. Lastly, it addresses the process with the highest GHG emission value to minimize environmental impacts.
The application of REVAM in tandem with a carbon footprint analysis for waste reduction, resource optimization, and GHG emission minimization within diverse agricultural activities, as presented in Section 3, underscores the significance of contextual factors in waste and loss generation for activity classification. Natural environmental variables, such as mortality rates, waiting times, and uncontrollable excess yields, substantially impact agricultural and aquacultural processes [54]. By consolidating non-machine resource usage into the results presented within the process box, a comprehensive analysis of resources can be conducted, and the origins of waste can be specifically clarified.
The rearing process, driven by the high EF value of the fish feed used, contributed the most to GHG emissions. Consistent with LCA studies on tilapia farming, feed emerged as a major environmental impact factor [55,56]. Emissions are not solely dependent on the amount; the type of resource used is equally crucial [9]. Different resources or processes for the same product yield can have different environmental impacts. The recommendations for enhancing resource use include setting operational guidelines for resource control, improving feeding efficiency (e.g., feeding control in bucket cages) [57], exploring alternative resources (e.g., eggshells instead of quicklime and adjusted fish feed formulas), and transitioning to closed-system aquaculture to reduce environmental impacts [58,59].
Moreover, the case study involved tilapia production in both ponds and the IPRS innovation. In addition, in order to enhance this study’s utility, the financial feasibility of raising 1 t of tilapia in both systems was analyzed, incorporating calculations of the NPV and payback period, alongside assessments of resource efficiency and environmental impact. This analysis aimed to offer preliminary guidance for adopting new aquaculture innovations, based on data from the 2020 Fisheries Economics Group and model farms. The findings revealed that the IPRS exhibited a lower cost for each tonne of fish than the traditional pond system, owing to the generation of a higher annual income due to a threefold increase in production and the maintenance of an average fish weight of 1 kg, resulting in an enhanced selling price. However, the system had a higher installation cost, leading to extended payback and investment periods. Nonetheless, it offered opportunities to enhance product quality and production capacity for foreign markets. With a 30% revenue increase, the IPRS showed payback and investment periods comparable to those of traditional ponds. The detailed results are shown in Table 7.
Table 7.
Comparing tilapia farming methods: pond system vs. IPRS in resource usage, environmental impact, and investment costs.
6. Conclusions
Here, we provided a practical resource management strategy to reduce GHG emissions in agriculture, especially among smallholder farmers. It involves merging REVAM and carbon footprint analyses to aid smallholders in improving resource efficiency and meeting environmental objectives and consumer demands.
This study makes a contribution to this research field by adapting a waste identification method from industry to agriculture and merging GHG emission calculations with the Muda Index to track non-value-added resource use. Additionally, it evaluates the environmental impact of IPRS aquaculture, guiding technology adoption for improved production and market expansion in regions valuing standardized farming and environmental responsibility.
Aside from its academic value, the studied tool has practical applications as a guideline for small-scale producers in assessing resource efficiency and environmental impacts. This was illustrated through a case study on aquaculture with an IPRS, which is crucial for export-oriented production control. If adopted within the agriculture and food industry’s value chain, this tool could empower small-scale producers to independently calculate their carbon footprint, potentially aiding in future carbon credit management within the supply chain. However, the study’s CI and MI values primarily reflect resource costs for customers rather than the overall operational expenses. It is crucial to note that these findings are based on a single location and the Department of Fisheries, which might vary in real-world applications due to data inputs, location-specific features, and other factors. Additionally, the financial feasibility analysis, spanning three years, serves as a comparative reference for technology adoption to improve aquaculture efficiency and address environmental concerns.
Future research should include labor as a crucial resource that might lead to resource wastage during production, prompting the inclusion of additional indicators for comprehensive resource utilization to lead toward optimal efficiency.
Author Contributions
Writing—original draft, P.P.; Supervision, K.K. All authors have read and agreed to the published version of the manuscript.
Funding
This research received no external funding.
Institutional Review Board Statement
Not applicable.
Informed Consent Statement
Not applicable.
Data Availability Statement
The datasets used and analyzed during the current study are available from the corresponding author upon reasonable request.
Acknowledgments
This study was supported by Graduate School of Management and Innovation and the Petchra Pra Jom Klao Master’s Degree Research Scholarship from King Mongkut’s University of Technology Thonburi.
Conflicts of Interest
The authors declare no conflicts of interest.
Appendix A
Table A1.
Steps to calculate the resource use in each process of Nile tilapia production in a pond system.
Table A1.
Steps to calculate the resource use in each process of Nile tilapia production in a pond system.
| Process | Resource (i) | Activity (j) | Amount of Resource i Consumed by VA, NVA, and W Activities | Yield Related to Resource i Consumed by VA, NVA, and W Activities |
|---|---|---|---|---|
| Pond preparation | Diesel (D) | Dredging (NVA) | ||
| Electricity (E) | Adding water (NVA) | |||
| Water (Wa) | Irrigation (NVA) | |||
| Quicklime (Q) | Soil pH balancing (NVA) | |||
| Rearing | Stocking (S) | Fish stocking (VA) | ||
| Fish meal feeding (F) | Feed (VA) | |||
| Electricity (E) | Water treatment (VA) | |||
| Harvesting | Water (Wa) | Washing/ cutting (VA) | ||
| Electricity (E) | Water draining (NVA) | |||
| Transportation | Diesel (D) | Transport (NVA) | ||
| Water (Wa) | Transport (VA) |
Table A2.
Steps to calculate the resource use in each process of Nile tilapia production in the IPRS.
Table A2.
Steps to calculate the resource use in each process of Nile tilapia production in the IPRS.
| Process | Resource (i) | Activity (j) | Amount of Resource i Consumed by VA, NVA, and W Activities | Yield Related to Resource i Consumed by VA, NVA, and W Activities |
|---|---|---|---|---|
| Pond preparation | Diesel (D) | Dredging (NVA) | ||
| Electricity (E) | Adding water (NVA) | |||
| Water (Wa) | Irrigation (NVA) | |||
| Quicklime (Q) | Soil pH balancing (NVA) | |||
| Rearing | Stocking (S) | Fish stocking (VA) | ||
| Fish meal feeding (F) | Feed (VA) | |||
| Electricity (E) | WWUs (VA) | | ||
| Sedimentation (VA) | ||||
| Harvesting | Water (Wa) | Washing/ cutting (VA) | ||
| Transportation | Diesel (D) | Transport (NVA) | ||
| Water (Wa) | Transport (VA) |
Appendix B
Table A3.
Emission factors by type of resource and energy.
Table A3.
Emission factors by type of resource and energy.
| Activity | GHG Source(s) | Unit | EF (kg CO2e/Unit) | Reference |
|---|---|---|---|---|
| 1. Transportation | Diesel | kg | 0.3522 | Thai National LCI Database, TIIS-MTEC-NSTDA (with TGO electricity 2016–1018) |
| 2. Irrigation | Electricity, grid mix | kWh | 0.5986 | Thai National LCI Database, TIIS-MTEC-NSTDA (with TGO electricity 2016–1018) |
| 3. Sedimentation tank | Electricity, grid mix | kWh | 0.5986 | Thai National LCI Database, TIIS-MTEC-NSTDA (with TGO electricity 2016–1018) |
| 4. Using WWUs to circulate water | Electricity, grid mix | kWh | 0.5986 | Thai National LCI Database, TIIS-MTEC-NSTDA (with TGO electricity 2016–1018) |
| 5. Water aerator | Electricity, grid mix | kWh | 0.5986 | Thai National LCI Database, TIIS-MTEC-NSTDA (with TGO electricity 2016–1018) |
| 6. Liming (pond pH balancing) (quicklime: Q) | Calcium carbonate, limestone (milled, loose) | kg | 1.0154 | Ecoinvent 2.2, IPCC 2007 GWP 100a |
| 7. Feeding (fish meal: F) | Soybean meal, fish meal produced from trash fish | kg | 1.0240 1.7598 | Thai National LCI Database, TIIS-MTEC-NSTDA (with TGO electricity 2016–1018) |
| 8. Rearing (stocking: S) | Tilapia (rearing in a pond) | kg | 0.3678 | Thai National LCI Database/MTEC |
| 9. Rinsing/trimming (water: Wa) | Provincial Waterworks Authority | m3 | 0.2843 | Thai National LCI Database, TIIS-MTEC-NSTDA (with TGO electricity 2016–1018) |
References
- Paris Agreement. Department of International Organizations, Ministry of Foreign Affairs, Bangkok, Thailand. Available online: https://thai-inter-org.mfa.go.th/th/page/%E0%B8%84%E0%B8%A7%E0%B8%B2%E0%B8%A1%E0%B8%95%E0%B8%81%E0%B8%A5%E0%B8%87%E0%B8%9B%E0%B8%B2%E0%B8%A3%E0%B8%B5%E0%B8%AA?menu=5d847835517e9b159b5eba97 (accessed on 26 April 2023).
- Shao, J.; Ünal, E. What do consumers value more in green purchasing? Assessing the sustainability practices from demand side of business. J. Clean. Prod. 2019, 209, 1473–1483. [Google Scholar] [CrossRef]
- FAO. Emissions Due to Agriculture Global, Regional and Country Trends; FAO: Rome, Italy, 2000. [Google Scholar]
- Rising Demand for Agricultural Products Adds to Competing Pressures on Tropical Forest Landscapes > Press Releases|World Economic Forum. Available online: https://www.weforum.org/press/2021/09/rising-demand-for-agricultural-products-adds-to-competing-pressures-on-tropical-forest-landscapes (accessed on 8 March 2023).
- SDG Move. SDG 101. Available online: https://www.sdgmove.com/sdg-101/ (accessed on 14 June 2022).
- Thailand’s Greenhouse Gas Emissions. ClimateWatch. Available online: https://www.climatewatchdata.org/countries/THA?end_year=2019&start_year=1990 (accessed on 17 April 2023).
- Drempetic, S.; Klein, C.; Zwergel, B. The Influence of Firm Size on the ESG Score: Corporate Sustainability Ratings Under Review. J. Bus. Ethics 2020, 167, 333–360. [Google Scholar] [CrossRef]
- Mwambo, F.M.; Fürst, C.; Martius, C.; Jimenez-Martinez, M.; Nyarko, B.K.; Borgemeister, C. Combined application of the EM-DEA and EX-ACT approaches for integrated assessment of resource use efficiency, sustainability and carbon footprint of smallholder maize production practices in sub-Saharan Africa. J. Clean. Prod. 2021, 302, 126132. [Google Scholar] [CrossRef]
- Sfez, S.; Dewulf, J.; De Soete, W.; Schaubroeck, T.; Mathieux, F.; Kralisch, D.; De Meester, S. Toward a framework for resource efficiency evaluation in industry: Recommendations for research and innovation projects. Resources 2017, 6, 5. [Google Scholar] [CrossRef]
- Zhou, B. Lean principles, practices, and impacts: A study on small and medium-sized enterprises (SMEs). Ann. Oper. Res. 2016, 241, 457–474. [Google Scholar] [CrossRef]
- Valenti, W.C.; Kimpara, J.M.; de Preto, B.L.; Moraes-Valenti, P. Indicators of sustainability to assess aquaculture systems. Ecol. Indic. 2018, 88, 402–413. [Google Scholar] [CrossRef]
- Faulkner, W.; Badurdeen, F. Sustainable Value Stream Mapping (Sus-VSM): Methodology to visualize and assess manufacturing sustainability performance. J. Clean. Prod. 2014, 85, 164–179. [Google Scholar] [CrossRef]
- Boyd, C.E.; Tucker, C.; McNevin, A.; Bostick, K.; Clay, J. Indicators of Resource Use Efficiency and Environmental Performance in Fish and Crustacean Aquaculture. Rev. Fish. Sci. 2007, 15, 327–360. [Google Scholar] [CrossRef]
- Ammerman, G.R. Processing; Channel Catfish Culture; Elsevier: Amsterdam, The Netherlands, 1985. [Google Scholar]
- Boyd, C.E.; McNevin, A.A.; Clay, J.; Johnson, H.M. Certification Issues for Some Common Aquaculture Species. Rev. Fish. Sci. 2005, 13, 231–279. [Google Scholar] [CrossRef]
- Boyd, C.E.; Polioudakis, M. Land use for aquaculture production. Glob. Aquac. Advocate 2006, 9, 64–65. [Google Scholar]
- Claude, E.B.; Tucker, C.S. Pond Aquaculture Water Quality Management; Kluwer Academic Publishers: Boston, MA, USA, 1998. [Google Scholar]
- de Martins, A.O.; dos Anjos, F.E.V.; da Silva, D.O. The Lean Farm: Application of Tools and Concepts of Lean Manufacturing in Agro-Pastoral Crops. Sustainability 2023, 15, 2597. [Google Scholar] [CrossRef]
- Melin, M.; Barth, H. Lean in Swedish agriculture: Strategic and operational perspectives. Prod. Plan. Control 2018, 29, 845–855. [Google Scholar] [CrossRef]
- Ali Naqvi, S.A.; Fahad, M.; Atir, M.; Zubair, M.; Shehzad, M.M. Productivity improvement of a manufacturing facility using systematic layout planning. Cogent Eng. 2016, 3, 1207296. [Google Scholar] [CrossRef]
- Wen, X.; Cao, H.; Hon, B.; Chen, E.; Li, H. Energy value mapping: A novel lean method to integrate energy efficiency into production management. Energy 2021, 217, 119353. [Google Scholar] [CrossRef]
- Choi, J.K.; Thangamani, D.; Kissock, K. A systematic methodology for improving resource efficiency in small and medium-sized enterprises. Resour. Conserv. Recycl. 2019, 147, 19–27. [Google Scholar] [CrossRef]
- Plehn, J.; Sproedt, A.; Gontarz, A.; Reinhard, J. From strategic goals to focused eco-efficiency improvement in production: Bridging the gap using environmental value stream mapping. In Proceedings of the 10th Global Conference of Sustainable Manufacturing, Istanbul, Turkey, 31 October–2 November 2012. [Google Scholar]
- Schmidt, M.; Raible, C.; Keil, R.; Gräber, M. Energy and Material Stream Mapping. Available online: https://www.demea.de (accessed on 14 July 2023).
- Muñoz-Villamizar, A.; Santos, J.; Garcia-Sabater, J.J.; Lleo, A.; Grau, P. Green value stream mapping approach to improving productivity and environmental performance. Int. J. Product. Perform. Manag. 2019, 68, 608–625. [Google Scholar] [CrossRef]
- Papetti, A.; Menghi, R.; Di Domizio, G.; Germani, M.; Marconi, M. Resources value mapping: A method to assess the resource efficiency of manufacturing systems. Appl. Energy 2019, 249, 326–342. [Google Scholar] [CrossRef]
- Menghi, R.; Di Domizio, G.; Papetti, A.; Germani, M.; Marconi, M. An energy assessment method for SMEs: Case study of an Italian mechanical workshop. In Procedia Manufacturing; Elsevier B.V.: Amsterdam, The Netherlands, 2020; Volume 43, pp. 56–63. [Google Scholar]
- UN Environmental Programme, Mitigation; UN Environmental Programme: Nairobi, Kenya, 2021; Available online: https://www.unep.org/explore-topics/climate-action/what-we-do/mitigatio (accessed on 28 October 2023).
- Pishgar-Komleh, S.H.; Zylowski, T.; Rozakis, S.; Kozyra, J. Efficiency under different methods for incorporating undesirable outputs in an LCA + DEA framework: A case study of winter wheat production in Poland. J. Environ. Manag. 2020, 260, 110138. [Google Scholar] [CrossRef]
- Rebolledo-Leiva, R.; Angulo-Meza, L.; González-Araya, M.C.; Iriarte, A.; Vásquez-Ibarra, L.; Meza Rengel, F. A new method for eco-efficiency assessment using carbon footprint and network data envelopment analysis applied to a beekeeping case study. J. Clean. Prod. 2021, 329, 129585. [Google Scholar] [CrossRef]
- Roibás, L.; Loiseau, E.; Hospido, A. A simplified approach to determine the carbon footprint of a region: Key learning points from a Galician study. J. Environ. Manag. 2018, 217, 832–844. [Google Scholar] [CrossRef]
- Danilecki, K.; Mrozik, M.; Smurawski, P. Changes in the environmental profile of a popular passenger car over the last 30 years—Results of a simplified LCA study. J. Clean. Prod. 2017, 141, 208–218. [Google Scholar] [CrossRef]
- Beccali, M.; Cellura, M.; Longo, S.; Guarino, F. Solar heating and cooling systems versus conventional systems assisted by photovoltaic: Application of a simplified LCA tool. Sol. Energy Mater. Sol. Cells 2016, 156, 92–100. [Google Scholar] [CrossRef]
- Pascual-González, J.; Pozo, C.; Guillén-Gosálbez, G.; Jiménez-Esteller, L. Combined use of MILP and multi-linear regression to simplify LCA studies. Comput. Chem. Eng. 2015, 82, 34–43. [Google Scholar] [CrossRef]
- Marco, B.; Maurizio, C.; Sonia, L.; Daniel, M. A Simplified LCA Tool for Solar Heating and Cooling Systems. In Energy Procedia; Elsevier Ltd.: Amsterdam, The Netherlands, 2016; Volume 91, pp. 317–324. [Google Scholar]
- Bognár, F.; Böcskei, E. Potential Model to Support the Achievement of Corporate Carbon Neutrality. Public Financ. Q. 2022, 67, 379–395. [Google Scholar] [CrossRef]
- Schulte, J.; Knuts, S. Sustainability impact and effects analysis—A risk management tool for sustainable product development. Sustain. Prod. Consum. 2022, 30, 737–751. [Google Scholar] [CrossRef]
- Thailand Greenhouse Gas Management Organization (Public Organization). Emission Factor. Thailand Greenhouse Gas Management Organization (Public Organization), Bangkok, Thailand. Available online: http://thaicarbonlabel.tgo.or.th/admin/uploadfiles/emission/ts_af09c20f4f.pdf> (accessed on 6 August 2023).
- Tilapia Culture, Fisheries Technology Transfer Research and Development Group. Available online: https://www4.fisheries.go.th/local/file_document/20200415152840_1_file.pdf (accessed on 20 July 2022).
- Kubitza, F.; Chappell, J.A.; Hanson, T.R.; Arana, E. The Promise of In-Pond Raceway Systems, Part 2 Improved Feed-Conversion Ratio One of the Many Potential Beneets. 2017. Available online: https://www.aquaculturealliance.org/advocate/promise-pond-raceway-systems-part-2/?headlessPrint=AAAAAPIA9c8r7gs82oWZBA (accessed on 30 December 2023).
- USSEC. A Principle-Driven, Sustainable, Advanced Aquaculture Production Technology; USSEC: Singapore, 2022. [Google Scholar]
- FAO. World Fisheries and Aquaculture the State of Sustainability in Action; FAO: Rome, Italy, 2020. [Google Scholar]
- Google Maps. Manit Aquaculture Company Limited. 2023. Available online: https://maps.app.goo.gl/A66jassKvYDY3VPHA (accessed on 29 December 2023).
- Carneiro, M.L.N.; Pradelle, F.; Braga, S.L.; Gomes, M.S.P.; Martins, A.R.F.; Turkovics, F.; Pradelle, R.N. Potential of biofuels from algae: Comparison with fossil fuels, ethanol and biodiesel in Europe and Brazil through life cycle assessment (LCA). In Renewable and Sustainable Energy Reviews; Elsevier Ltd.: Amsterdam, The Netherlands, 2017; pp. 632–653. [Google Scholar]
- Hemanandh, J.; Ganesan, S.; Hemanandh, S.; Venkatesan, S.; Kumar, J.S.; Velkumar; Shanjit. Environmental impact of the waste fish fry oil in DI diesel engine. Mater. Today Proc. 2021. [Google Scholar] [CrossRef]
- Roschat, W.; Siritanon, T.; Yoosuk, B.; Sudyoadsuk, T.; Promarak, V. Rubber seed oil as potential non-edible feedstock for biodiesel production using heterogeneous catalyst in Thailand. Renew. Energy 2017, 101, 937–944. [Google Scholar] [CrossRef]
- Modern Manufacturing. Available online: https://www.mmthailand.com/%E0%B8%A5%E0%B8%94%E0%B8%95%E0%B9%89%E0%B8%99%E0%B8%97%E0%B8%B8%E0%B8%99-%E0%B8%9C%E0%B8%A5%E0%B8%9C%E0%B8%A5%E0%B8%B4%E0%B8%95%E0%B9%80%E0%B8%9E%E0%B8%B4%E0%B9%88%E0%B8%A1/ (accessed on 13 July 2022).
- Rakbankerd. Basic for Feeding Tilapia. Available online: https://www.rakbankerd.com/vdo.php?id=2109 (accessed on 13 July 2022).
- Twellman, B. Producing Fish Sustainably through In-Pond Raceway Systems (IPRS); USSOY: Chesterfield, MO, USA, 2022; Available online: https://ussoy.org/producing-fish-sustainably-through-in-pond-raceway-systems-iprs/?persona=feed-ingredients-animal-consumption&pillar=innovation-beyond-the-bushel®ion=americas&goal=inform-educat (accessed on 13 July 2022).
- Ghamkhar, R.; Hicks, A. Comparative environmental impact assessment of aquafeed production: Sustainability implications of forage fish meal and oil free diets. Resour. Conserv. Recycl. 2020, 161, 104849. [Google Scholar] [CrossRef]
- Maiolo, S.; Parisi, G.; Biondi, N.; Lunelli, F.; Tibaldi, E.; Pastres, R. Fishmeal partial substitution within aquafeed formulations: Life cycle assessment of four alternative protein sources. Int. J. Life Cycle Assess. 2020, 25, 1455–1471. [Google Scholar] [CrossRef]
- Saldanha, R.B.; da Rocha, C.G.; Caicedo, A.M.L.; Consoli, N.C. Technical and environmental performance of eggshell lime for soil stabilization. Constr. Build. Mater. 2021, 298, 123648. [Google Scholar] [CrossRef]
- Ok, Y.S.; Lee, S.S.; Jeon, W.T.; Oh, S.E.; Usman, A.R.A.; Moon, D.H. Application of eggshell waste for the immobilization of cadmium and lead in a contaminated soil. Environ. Geochem. Health 2011, 33 (Suppl. S1), 31–39. [Google Scholar] [CrossRef] [PubMed]
- Santeramo, F.G. Exploring the link among food loss, waste and food security: What the research should focus on? In Agriculture and Food Security; BioMed Central Ltd.: London, UK, 2021. [Google Scholar]
- Biermann, G.; Geist, J. Life cycle assessment of common carp (Cyprinus carpio L.)—A comparison of the environmental impacts of conventional and organic carp aquaculture in Germany. Aquaculture 2019, 501, 404–415. [Google Scholar] [CrossRef]
- Mungkung, R.; Aubin, J.; Prihadi, T.H.; Slembrouck, J.; Van Der Werf, H.M.G.; Legendre, M. Life cycle assessment for environmentally sustainable aquaculture management: A case study of combined aquaculture systems for carp and tilapia. J. Clean. Prod. 2013, 57, 249–256. [Google Scholar] [CrossRef]
- Amirkolaie, A.K. Reduction in the environmental impact of waste discharged by fish farms through feed and feeding. Rev. Aquac. 2011, 3, 19–26. [Google Scholar] [CrossRef]
- World Economic Forum. 5 Ways to Net a Sustainable Future for Aquaculture. Available online: https://www.weforum.org/agenda/2018/09/5-ways-to-guarantee-sustainable-aquaculture/ (accessed on 3 April 2023).
- Tobias Stern, D.; Reader, S.; Roberto Pastres, A. Assessing Nutrient Cycling and Resource Utilization in a Closed-Loop Aquaculture System: A Case Study of Fish Sludge Recycling for Aquafeed Fertilization. Ph.D. Dissertation, University of Venice, Venice, Italy, 2023. [Google Scholar]


Disclaimer/Publisher’s Note: The statements, opinions and data contained in all publications are solely those of the individual author(s) and contributor(s) and not of MDPI and/or the editor(s). MDPI and/or the editor(s) disclaim responsibility for any injury to people or property resulting from any ideas, methods, instructions or products referred to in the content. |
© 2024 by the authors. Licensee MDPI, Basel, Switzerland. This article is an open access article distributed under the terms and conditions of the Creative Commons Attribution (CC BY) license (https://creativecommons.org/licenses/by/4.0/).