Article

Automatic and Efficient Detection of Loess Landslides Based on Deep Learning

1
College of Mathematics and Physics, Chengdu University of Technology, Chengdu 610059, China
2
Geomathematics Key Laboratory of Sichuan Province, Chengdu University of Technology, Chengdu 610059, China
3
College of Resources and Environment, Fujian Agriculture and Forestry University, Fuzhou 350002, China
*
Author to whom correspondence should be addressed.
Sustainability 2024, 16(3), 1238; https://doi.org/10.3390/su16031238
Submission received: 18 December 2023 / Revised: 21 January 2024 / Accepted: 29 January 2024 / Published: 1 February 2024

Abstract

:
Frequent landslide disasters on the Loess Plateau in northwestern China have had a serious impact on the lives and production of the people in the region due to the fragile ecological environment and severe soil erosion. The effective monitoring and management of landslide hazards is hindered by the wide range of landslide features and scales in remotely sensed imagery, coupled with the shortage of local information and technology. To address this issue, we constructed a loess landslide dataset of 11,010 images and established a landslide detection network model. Coordinate Attention (CA) is integrated into the backbone with the aid of the YOLO model to capture precise location information and remote spatial interaction data from landslide images. Furthermore, the neck includes the Convolutional Block Attention Module (CBAM), which prompts the model to prioritize focusing on legitimate landslide objectives while also filtering out background noise to extract valid feature information. To efficiently extract classification and location details from landslide images, we introduce the lightweight Decoupled Head. This enhances detection accuracy for landslide objectives without excessively increasing model parameters. Furthermore, the utilization of the SIoU loss function improves angle perception for landslide detection algorithms and reduces the deviation between the predicted box and the ground truth box. The improved model achieves landslide object detection at multiple scales with a mAP of 92.28%, an improvement of 4.01% compared to the unimproved model.

1. Introduction

Landslides and mudslides have a significant worldwide impact, damaging various man-made structures and infrastructure from local to global scales. There is a need to prepare and manage these disasters to mitigate their effects [1]. On 22 June 2022, a 5.9 magnitude earthquake hit eastern Afghanistan, triggering landslides that claimed the lives of at least 1570 people and left nearly 6000 others injured. According to senior Taliban officials, the direct economic damage is estimated at $2 billion. On 9 April 2022, heavy rainfall persisted in eastern South Africa, causing floods and landslides that caused extensive damage to homes, bridges, and roads. Local officials reported that the floods caused 544 fatalities, 50 injuries, and over 40 missing persons. Moreover, over 40,000 people were left homeless, and over 8329 homes and more than 600 school buildings were damaged, including at least 4000 destroyed. The disaster affected some 13,556 households [2,3].
China has a varied terrain with constantly evolving geology that leads to frequent geological disasters, including landslides. These landslides have a damaging impact on local communities, affecting both their livelihoods and safety. Timely detection of landslide-prone areas can reduce the loss of life and property. Five types of landslides exist: falling, overturning, sliding, spreading, and flowing, with sizes ranging from a few hundred meters to several kilometers [4]. Accurate techniques for identifying landslides at multiple scales are critical for preventing and mitigating disasters and for monitoring and managing landslide hazards. These techniques are essential for maintaining safety and reducing the risk of geological disasters [5]. Traditional landslide identification and detection typically involve manual field surveys and judgments, which result in high labor and material costs. However, over time, remote sensing images have become a mainstream method for landslide identification. Currently, technologies for landslide identification based on remote sensing images can be categorized into the following parts: (1) Visual interpretation, in which geological professionals employ a combination of visual interpretation and manual judgment to accurately assess landslides. While this method relies on subjective experience, it produces more precise results than alternative approaches. However, this approach is time-consuming and laborious [6]. (2) The machine learning method, which covers many aspects; by extracting various relevant features of data, it requires less human involvement, but the recognition accuracy is usually lower, which has been the shortcoming of this method [7,8]. (3) In the deep learning method, which is a derivative of the machine learning method, the network model used has a more intricate and complex inherent relationship, and it can obtain more detailed information from remote sensing images during training. However, it requires a huge amount of data to support it.
Currently, researchers primarily use mainstream deep learning methods for landslide detection. Deep learning-based algorithms for object detection are usually categorized as single-stage or two-stage detection. YOLO and SSD represent single-stage detection algorithms [9,10]. The algorithms do not require generating region proposals. Instead, they directly classify and regress the extracted image features according to the object’s location and category through a specific network structure. In single-stage detection algorithms, the problem of object localization is converted into a regression problem to address, and the detection model uniformly analyses regression and classification outcomes. The two-stage detection algorithms are represented by R-CNN and Fast R-CNN, necessitating the generation of region proposals and feature extraction by CNN, followed by object classification and localization using classifiers [11,12]. Zhao et al. [13] enhanced the capability of YOLOv5 to identify remotely sensed images by integrating an extra cross-layer asymmetric transformer (CA-Trans) prediction head. The addition captures the asymmetric information between the head and others effectively, thanks to the use of a sparse local attention (SLA) module. Cheng et al. [14] utilized group convolution (Gconv) and ghost bottleneck (G-bneck) residual modules to replace the convolution components and residual modules consisting of standard convolution. The purpose was to reduce the model’s parameters, which consequently made the model less accurate. Later, the selection kernel (SK) attention mechanism was introduced to help the network model minimize the attention to background noise in remotely sensed landslide images. Niu et al. [15] integrated the attention mechanism into the Faster R-CNN network model to produce an attention-enhanced regional network model for detecting multi-scale landslides and debris flows. The study verifies that the enhanced model effectively eliminates irrelevant noise, but its larger size slightly reduces detection speed. Ju et al. [16] conducted a study on landslide object detection in the Loess Plateau region. A database of historical records data was created utilizing Google Earth images with expert manual annotation. Three object detection algorithms were then chosen for automatic landslide identification experiments, comprising the one-stage algorithms RetinaNet and YOLOv3 and the two-stage algorithm Mask R-CNN. It was ultimately confirmed that Mask R-CNN achieved the highest accuracy, offering a reference for future research. However, the major limitation is that the recognition accuracy of Mask R-CNN’s best result is still relatively low. Yu et al. [17] utilized Google Earth imagery to detect landslide patterns remotely through the use of the improved YOLOX algorithm, achieving a notable precision rate. Dynahead Yolo incorporates a unified attention mechanism that is scale-aware, space-aware, and task-aware into the YOLOv3 framework. This mechanism enables the network model to be more precise in capturing the details of variable-scale landslide images. It also provides valuable insight into the possibility of improving the detection accuracy of the model by including an attention mechanism. However, the model’s performance still requires detailed information for small-sample landslide detection [18].
Although scholars have extensively studied object detection in remotely sensed landslide images and explored challenges in solving the landslide object detection problem, the Loess Plateau region of China faces unique challenges. The scarcity of landslide imagery, along with the multiple scales and variable shapes of landslides in this region, has resulted in landslide hazards that have not been effectively managed. This motivates us to create numerous loess landslide datasets, which is a time-consuming process, and explore various models to address the challenge of loess landslide monitoring and management. This paper proposes the use of such a model for effective monitoring and management of loess landslides. Our experimentation aims to introduce an enhanced object detection model that accurately identifies loess landslide objectives with a lightweight design.

2. Materials and Methods

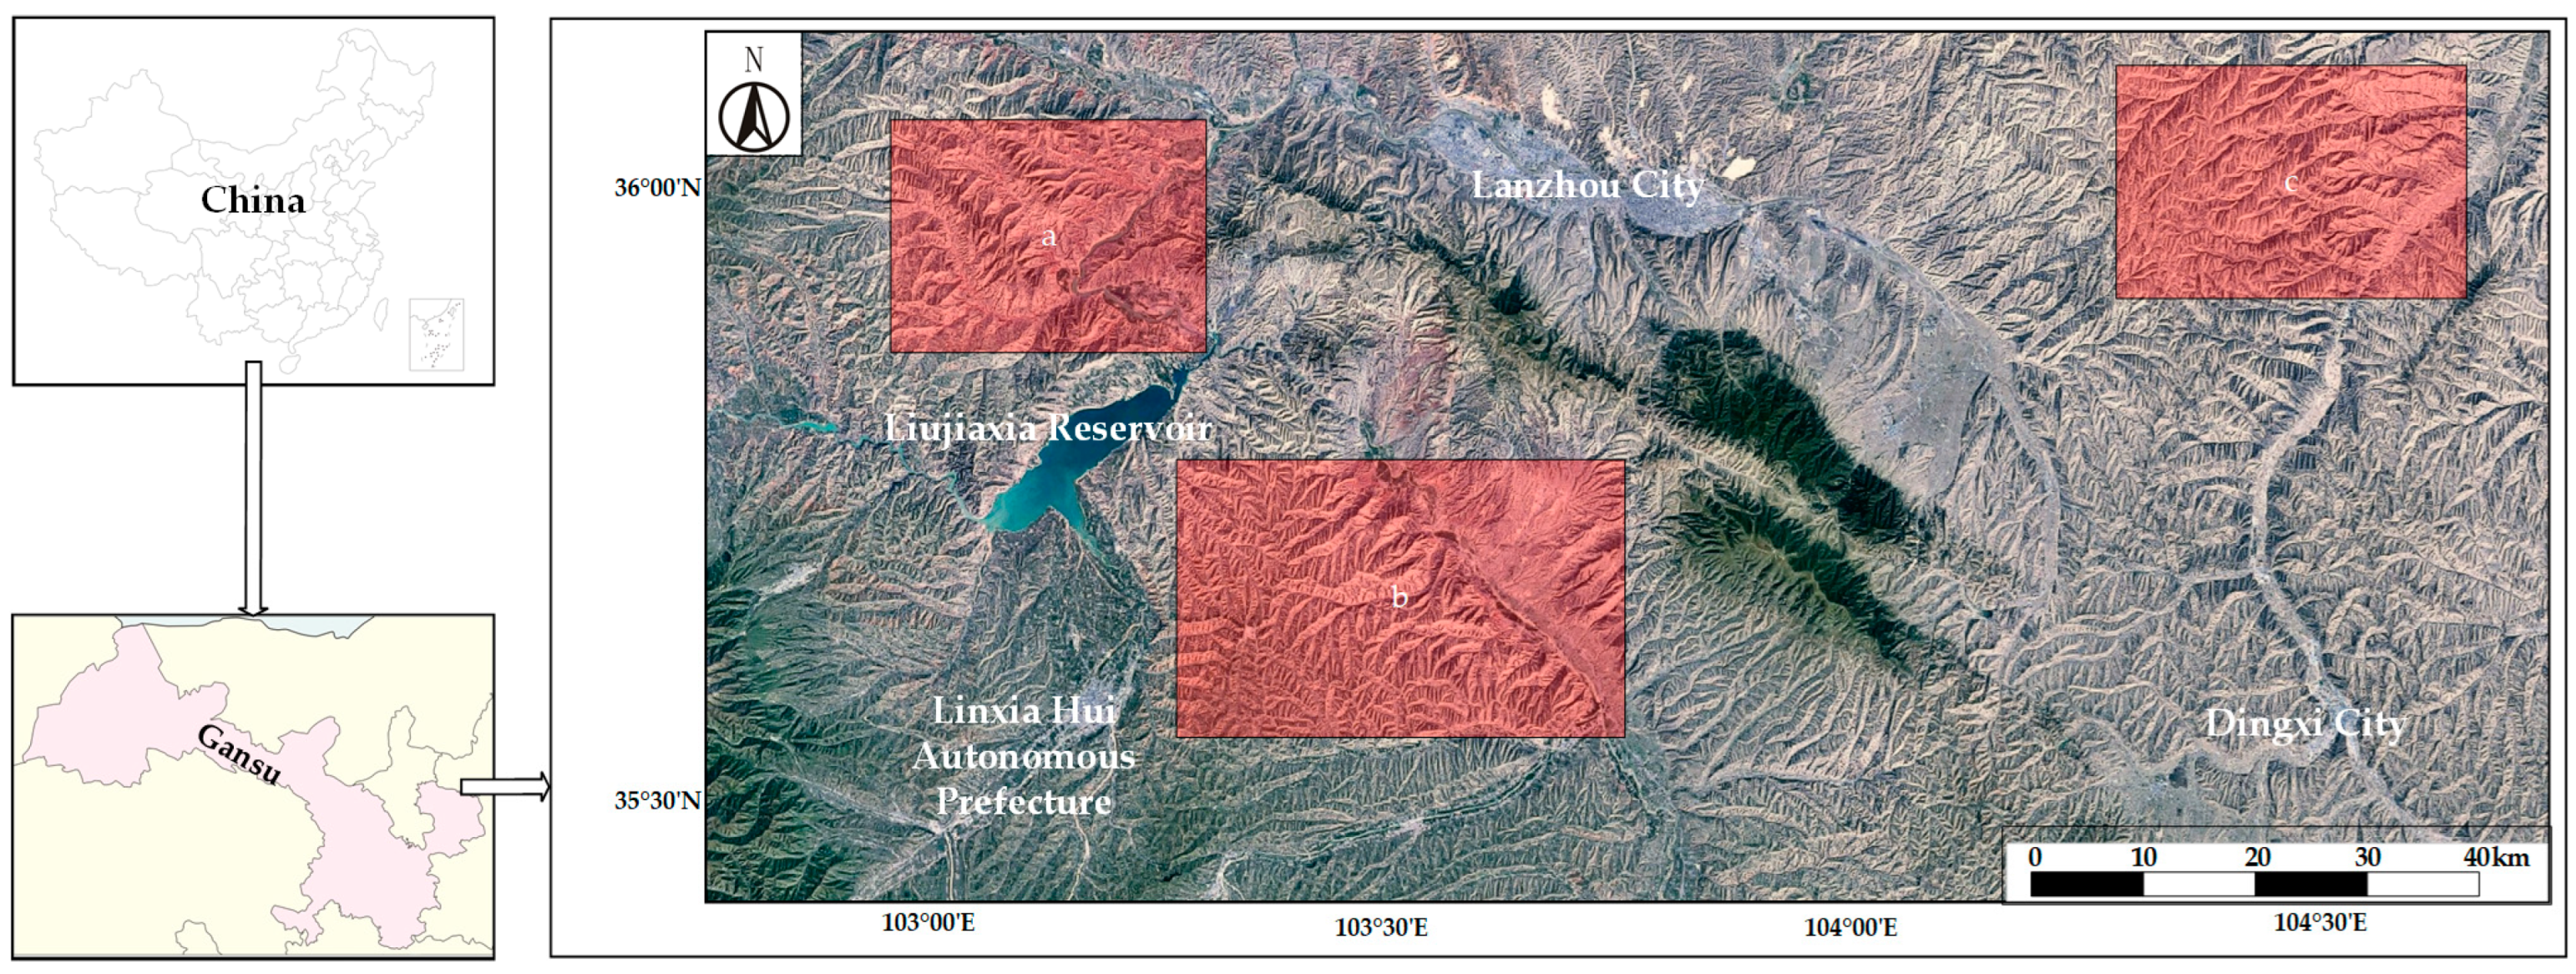
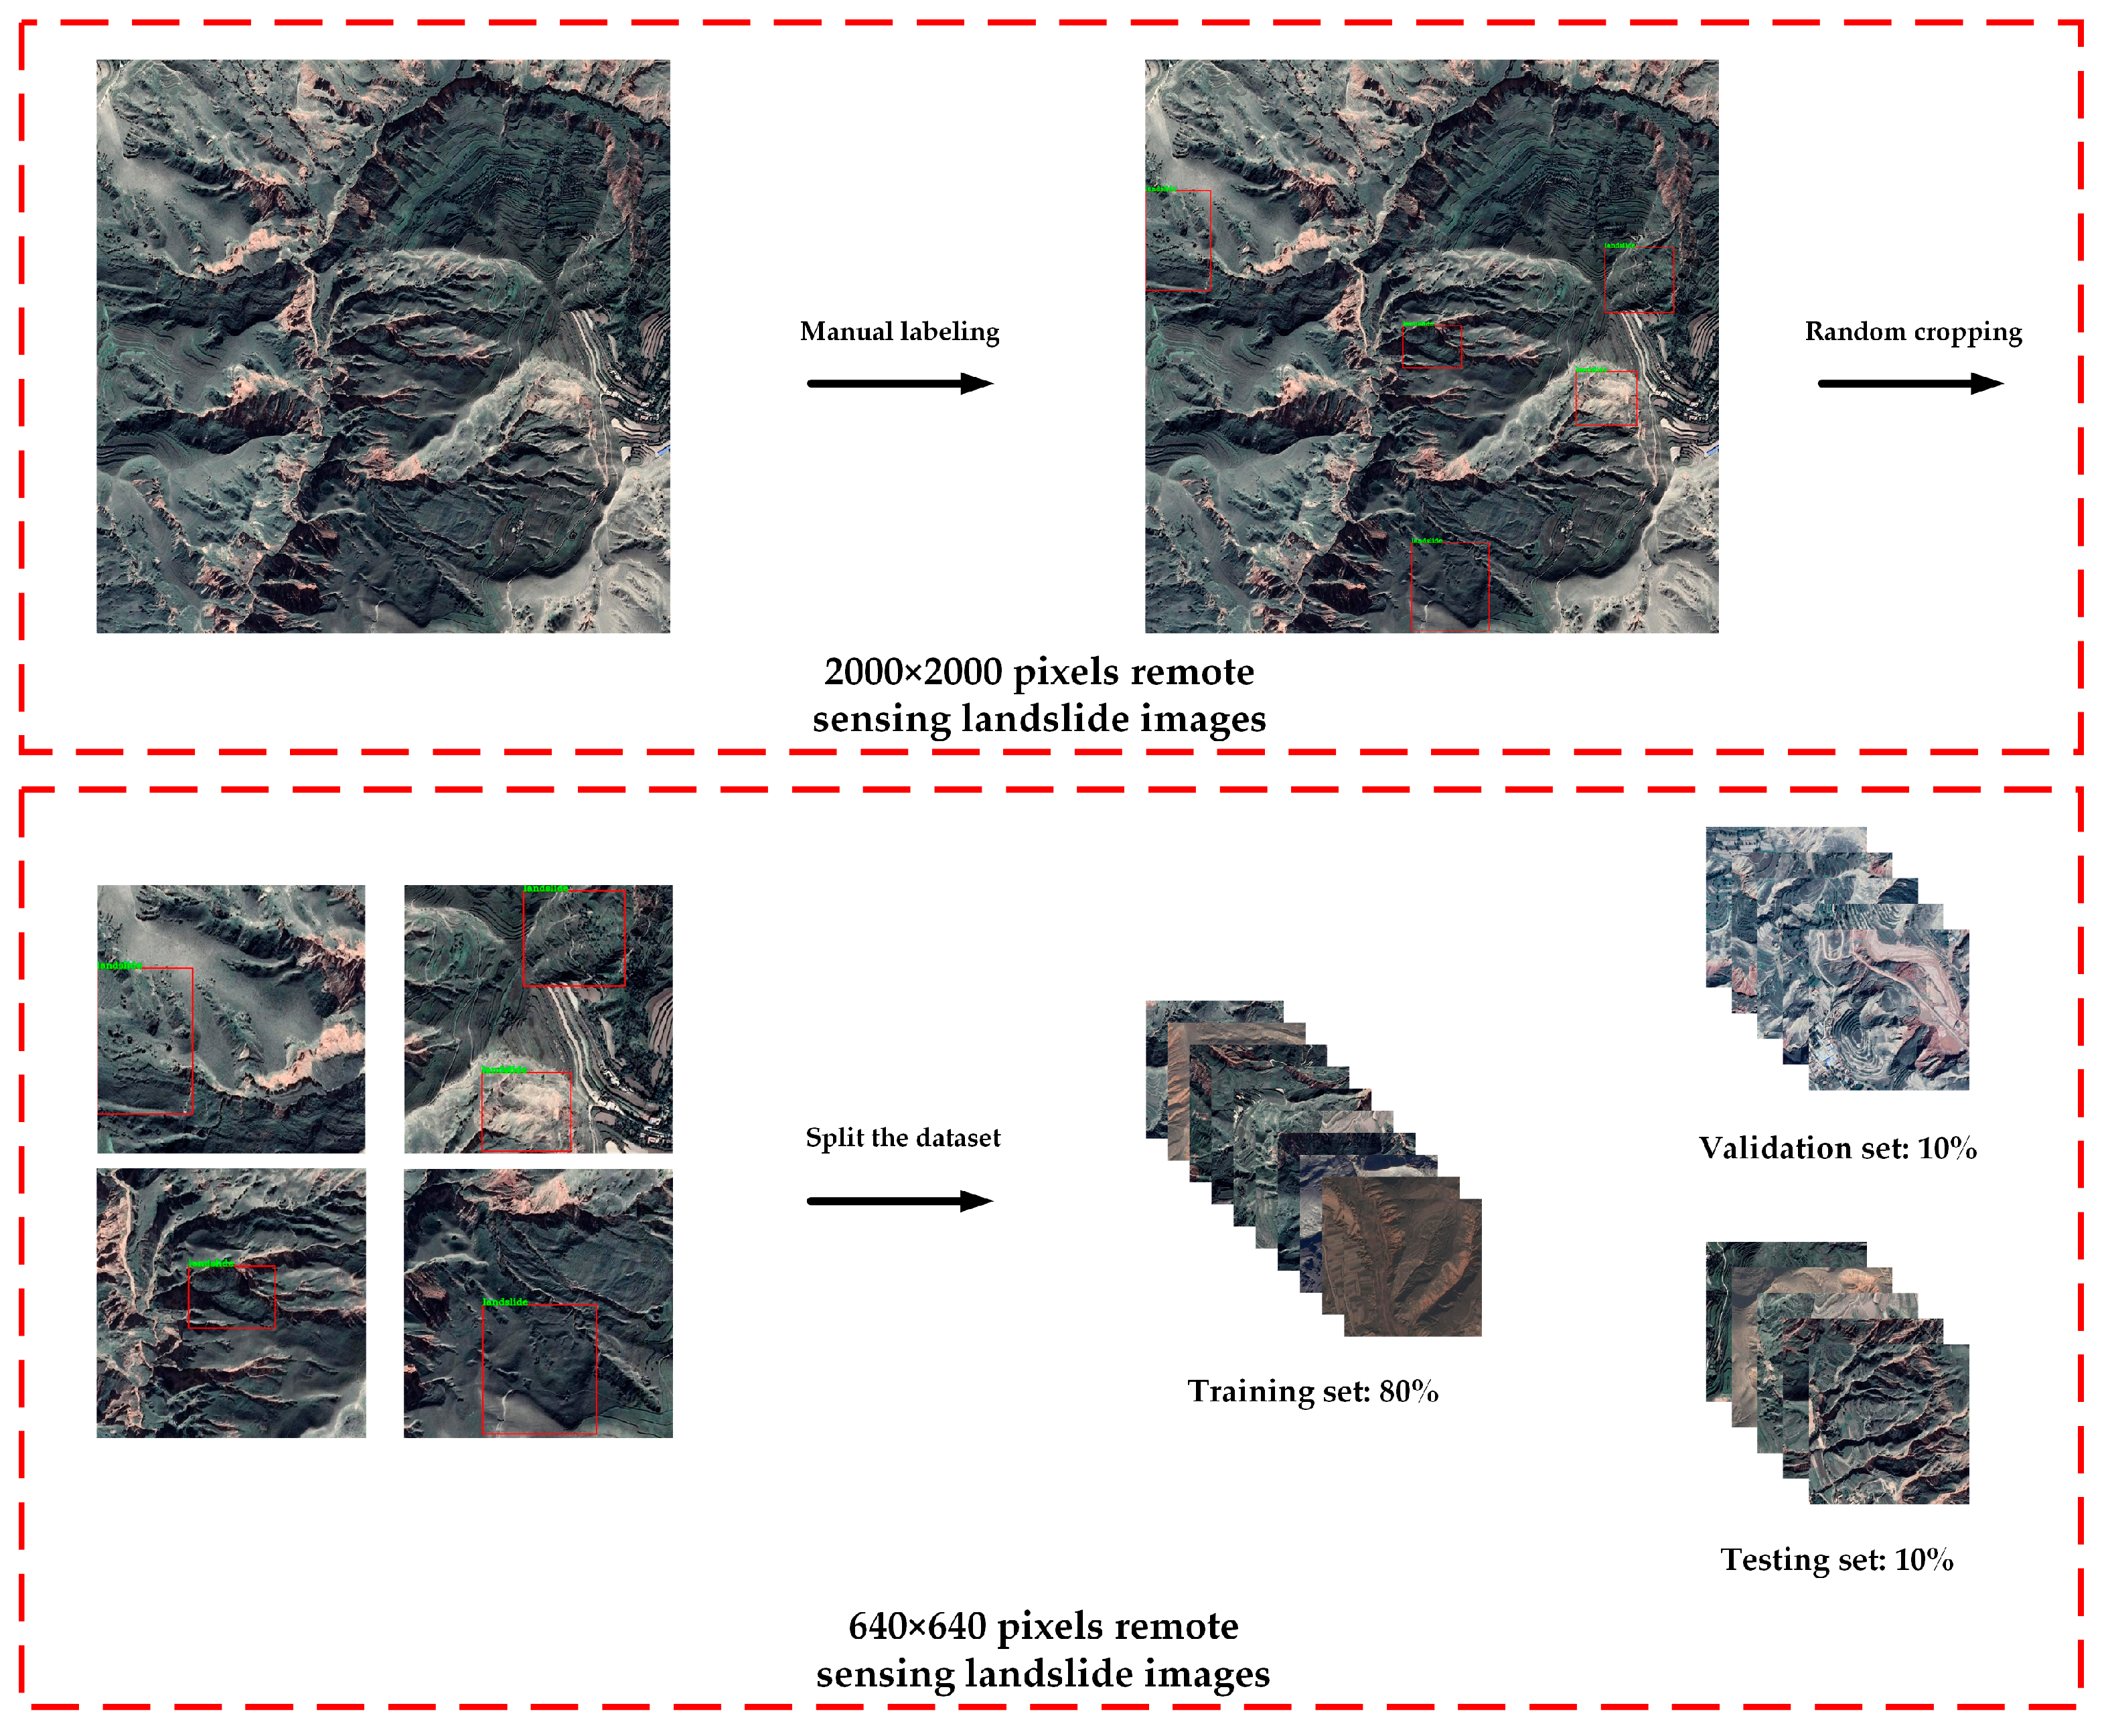
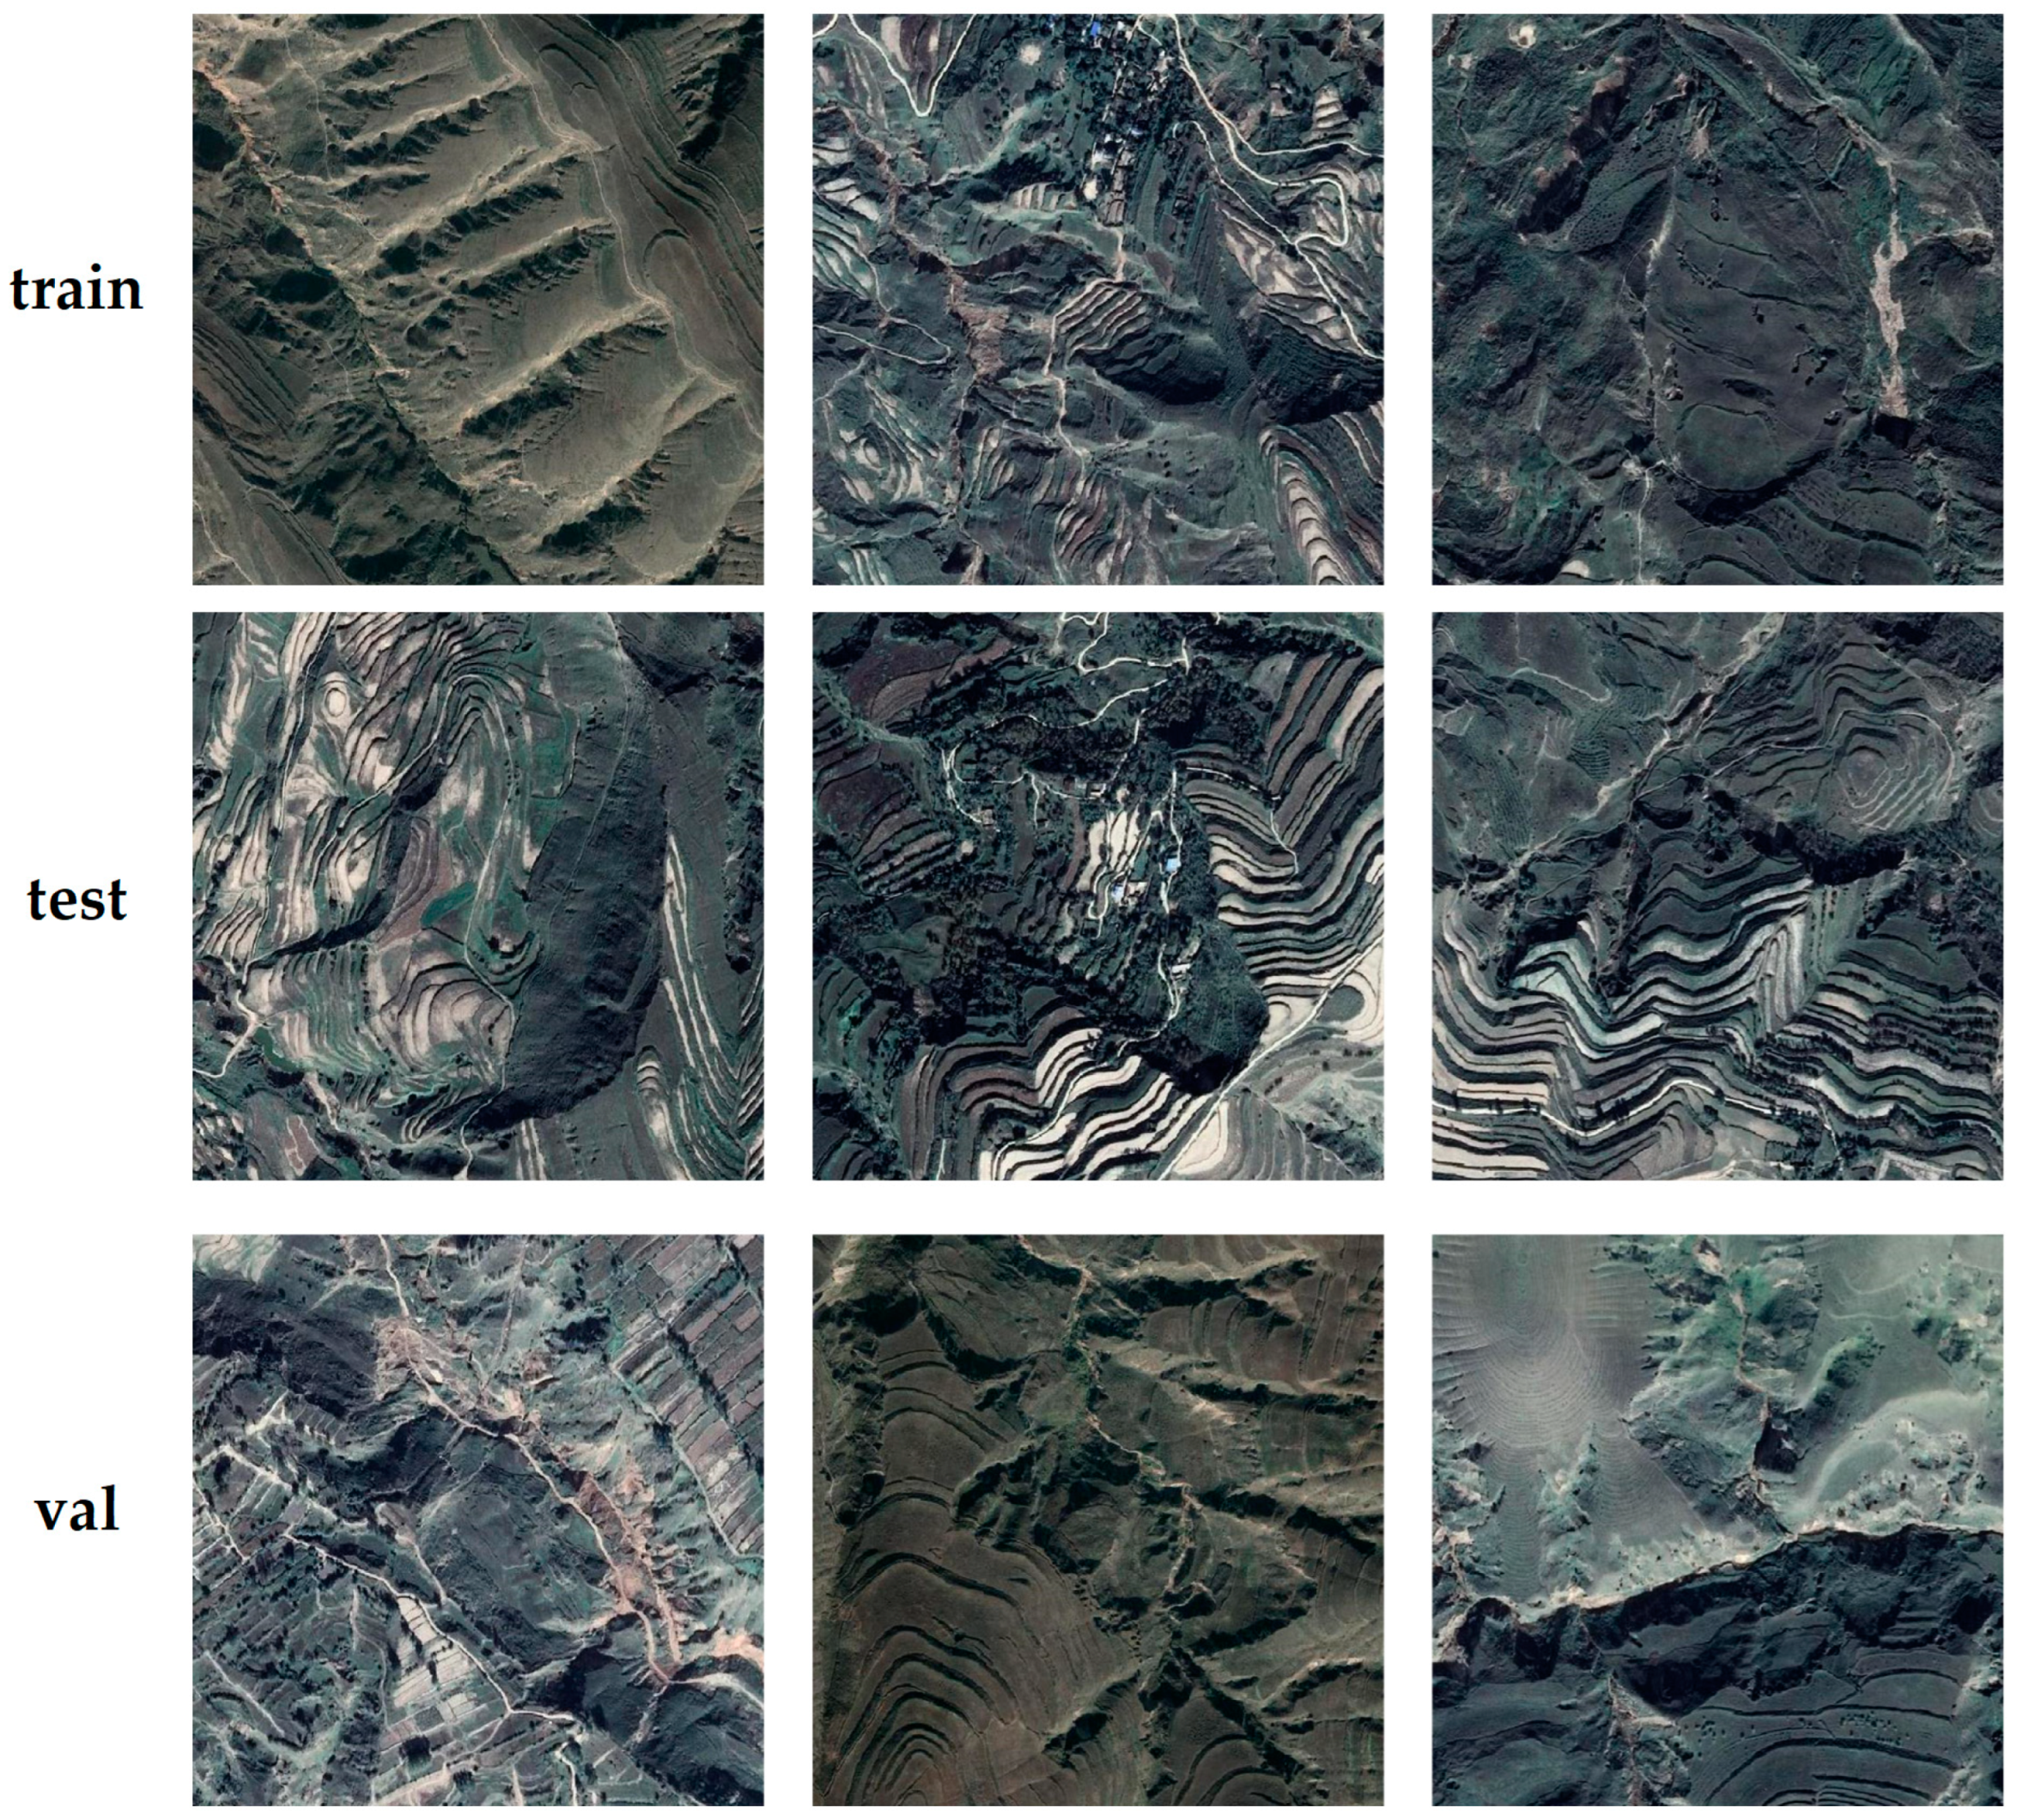
2.1. Data Collection
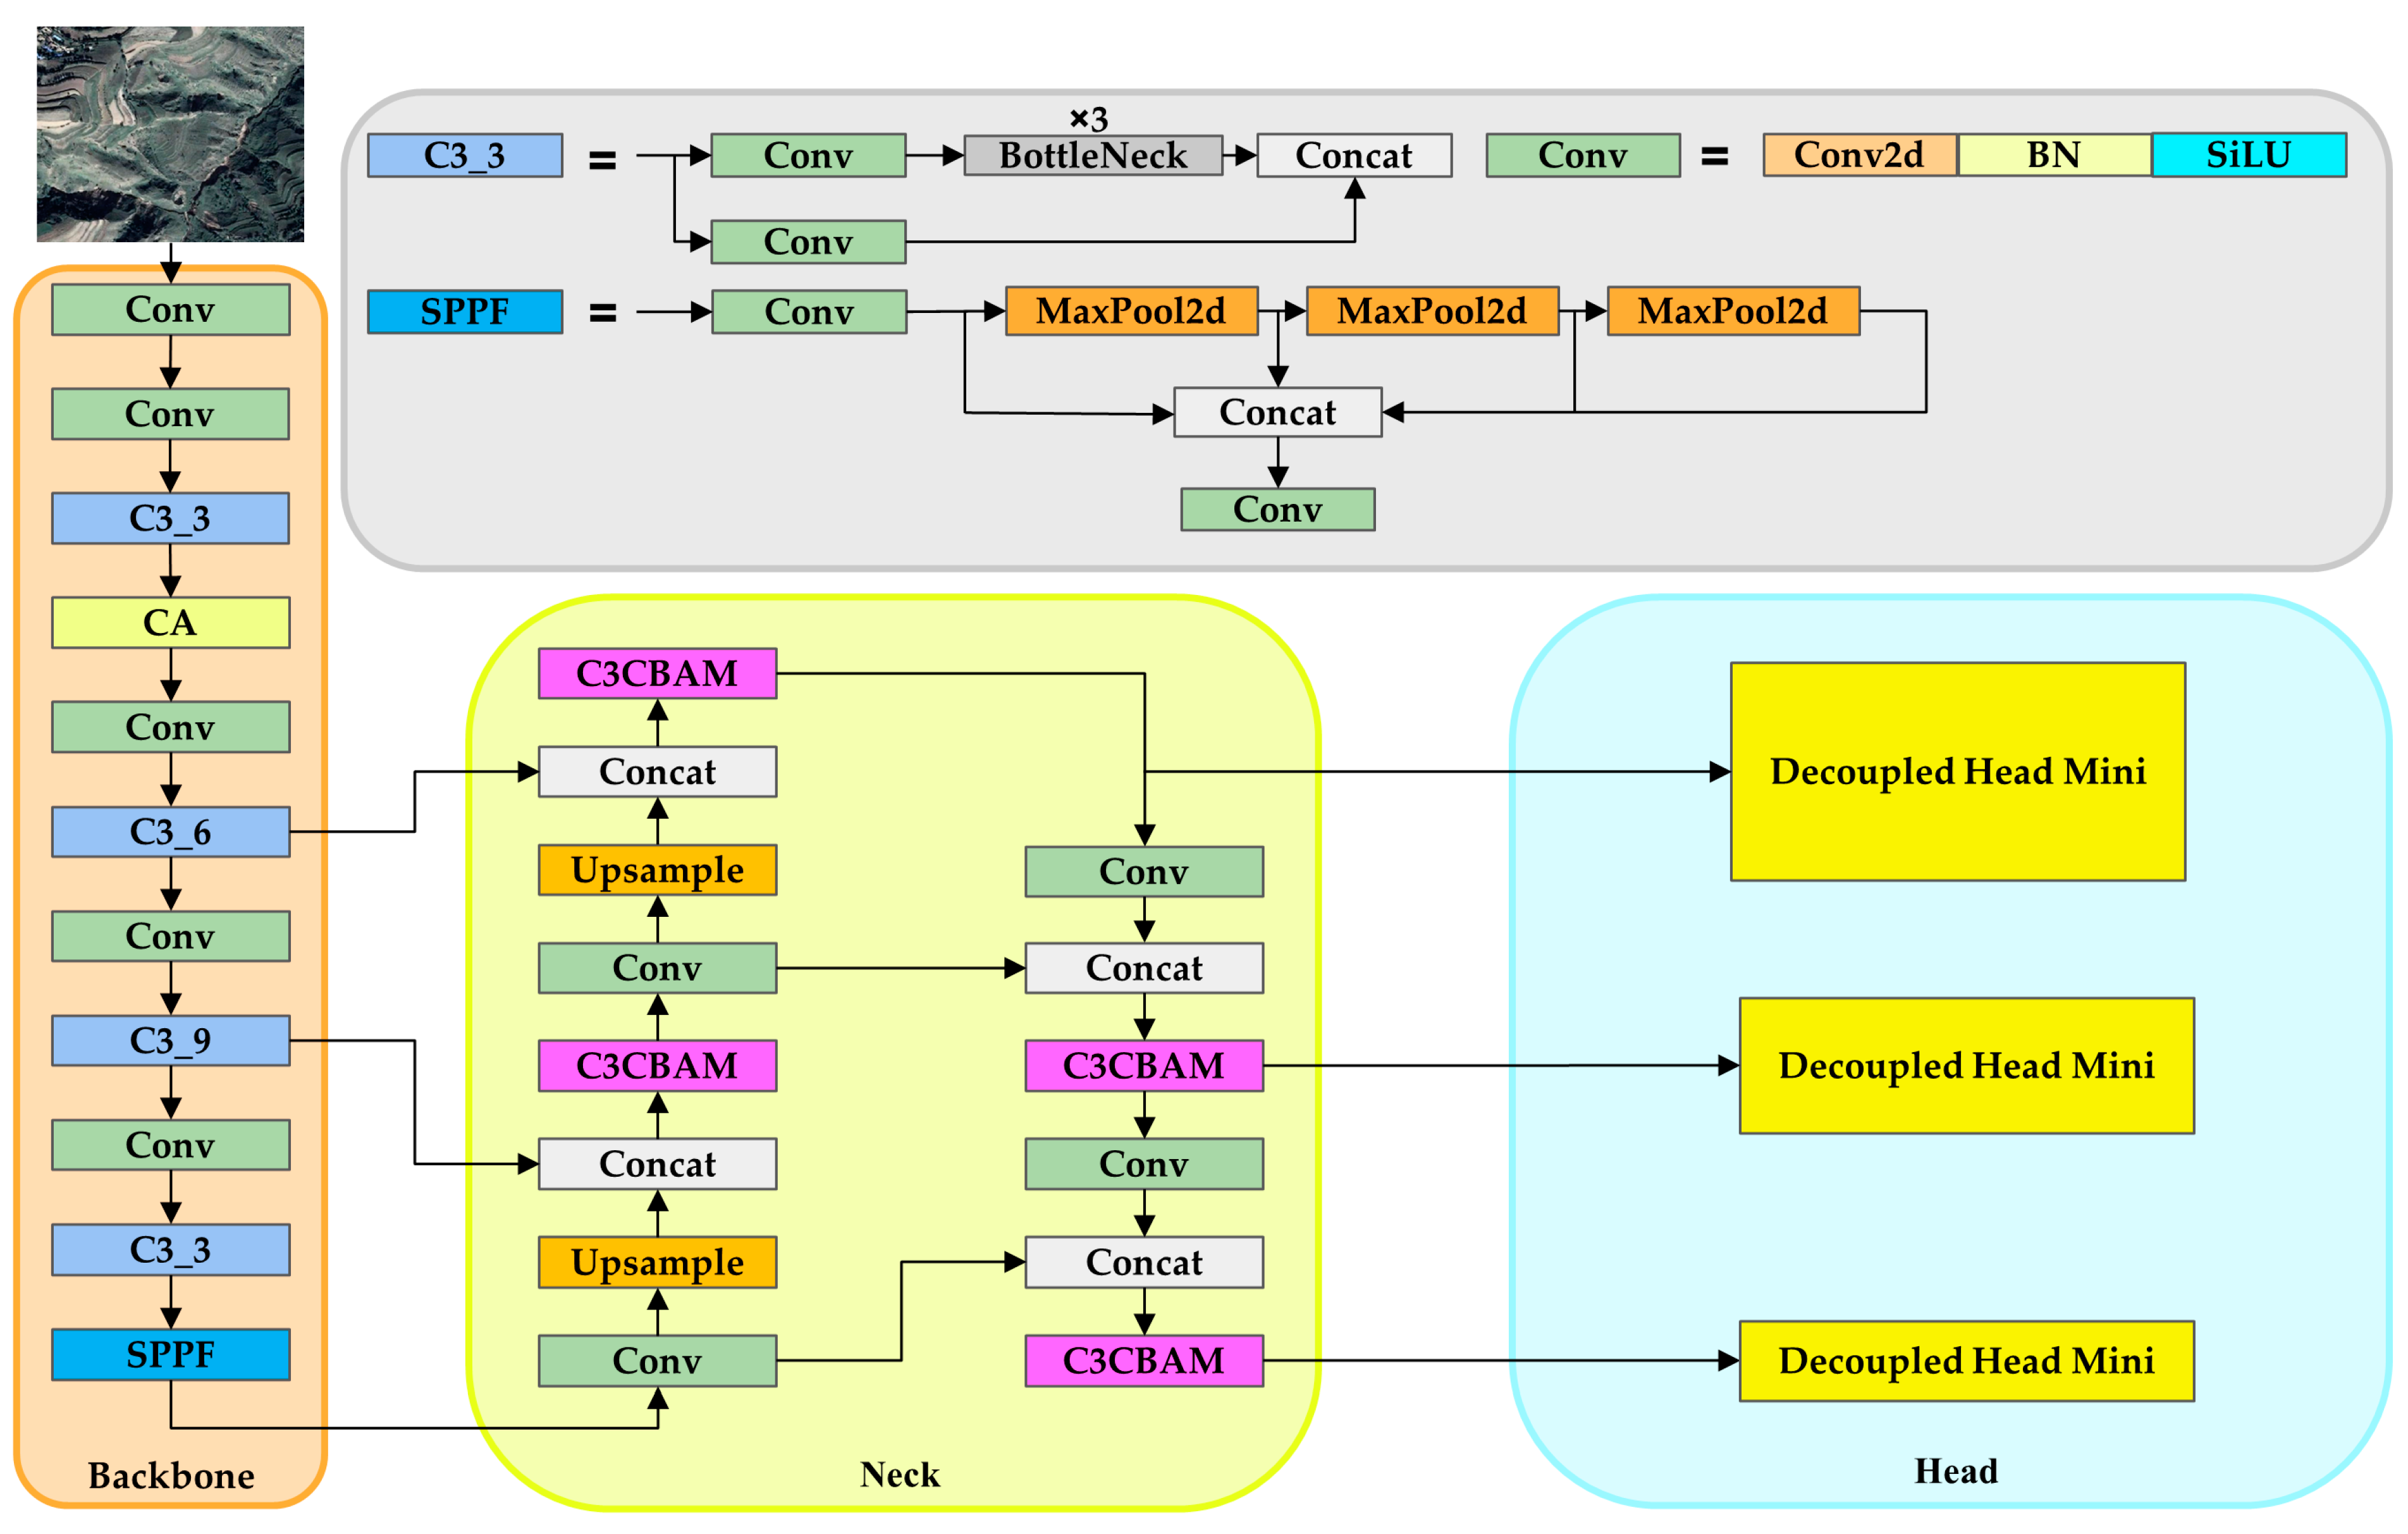
The study site is located in the northwestern part of China, in Lanzhou City and Linxia Hui Autonomous Prefecture of Gansu Province. The area is a part of the Loess Plateau, as shown in Figure 1. The natural geological environment conditions are intricate, and the geo-ecological environment is exceptionally delicate. Statistics demonstrate that landslides in the Loess Plateau region account for up to one-third of the country’s total number of landslides, varying in size and frequency [19]. These disasters cause significant harm to nearby industries, communities, and infrastructure, often resulting in the devastation of farmland, factories, villages, and transportation systems. Landslides in the Loess Plateau pose a significant threat to the safety of residents and town development. Furthermore, the climate of the Loess Plateau is highly distinctive. The monsoonal circulation has a significant impact on the precipitation in the area, resulting in evident shifts between wet and dry seasons. In the high summer and early autumn, the southeast monsoon occurs, and warm, humid marine air masses approach, precipitating the onset of the rainy season. Rainfall is concentrated from 50% to 70% in July, August, and September, with heavier downpours observed in July and August and more consistent precipitation observed in September. In the winter and spring, dry and cold polar air masses dominate, resulting in mainly sunny weather with little output of rain or snow, causing a period of drought with sparse precipitation. However, temperatures are extremely low and susceptible to frequent freezes and thaws. The topography of the region is predominantly characterized by yellow landforms, which can be classified into three primary types: loess, beam, and mount. The formation and development of the loess landforms are mainly affected by neotectonics activity, as well as external dynamic traces caused by water-based geological processes. The accumulation of loess and erosion are interconnected, influenced by both internal and external dynamics, resulting in the formation of the current gully-straddled loess plateau landscape. This geomorphic evolution fosters the development of geological hazards, dictates their regional distribution, and provides a spatial foundation for their occurrence.
The optical remote sensing images utilized in this study were gathered from Google Earth. All images had a resolution of 2000 × 2000, and a total of 1916 images were downloaded. Specifically, the remote sensing landslide images were predominantly collected in three major areas where landslides have occurred, denoted as a, b, and c in Figure 1. In this study, we identified and mapped landslide locations using visual interpretation. Arcmap 10.2 was used by the experts to identify and interpret landslides visually. The landslide objects were then manually labeled using the Labelimg tool to obtain object detection labels. To ensure quality control of the landslide labeling, the resulting landslide interpretations were cross-validated by three landslide experts.
The images were processed and randomly cropped to increase the number of landslide images. This led to the expansion of the dataset to a remote sensing image dataset consisting of 11,010 images at a resolution of 640 × 640 pixels, which can be found at https://doi.org/10.5281/zenodo.10053430 (30 October 2023). The integrity of the data was confirmed during the cropping process. Subsequently, the dataset was divided into a training set, a validation set, and a testing set in the ratios of 80%, 10%, and 10%, respectively, as shown in Figure 2.

2.2. YOLO Model

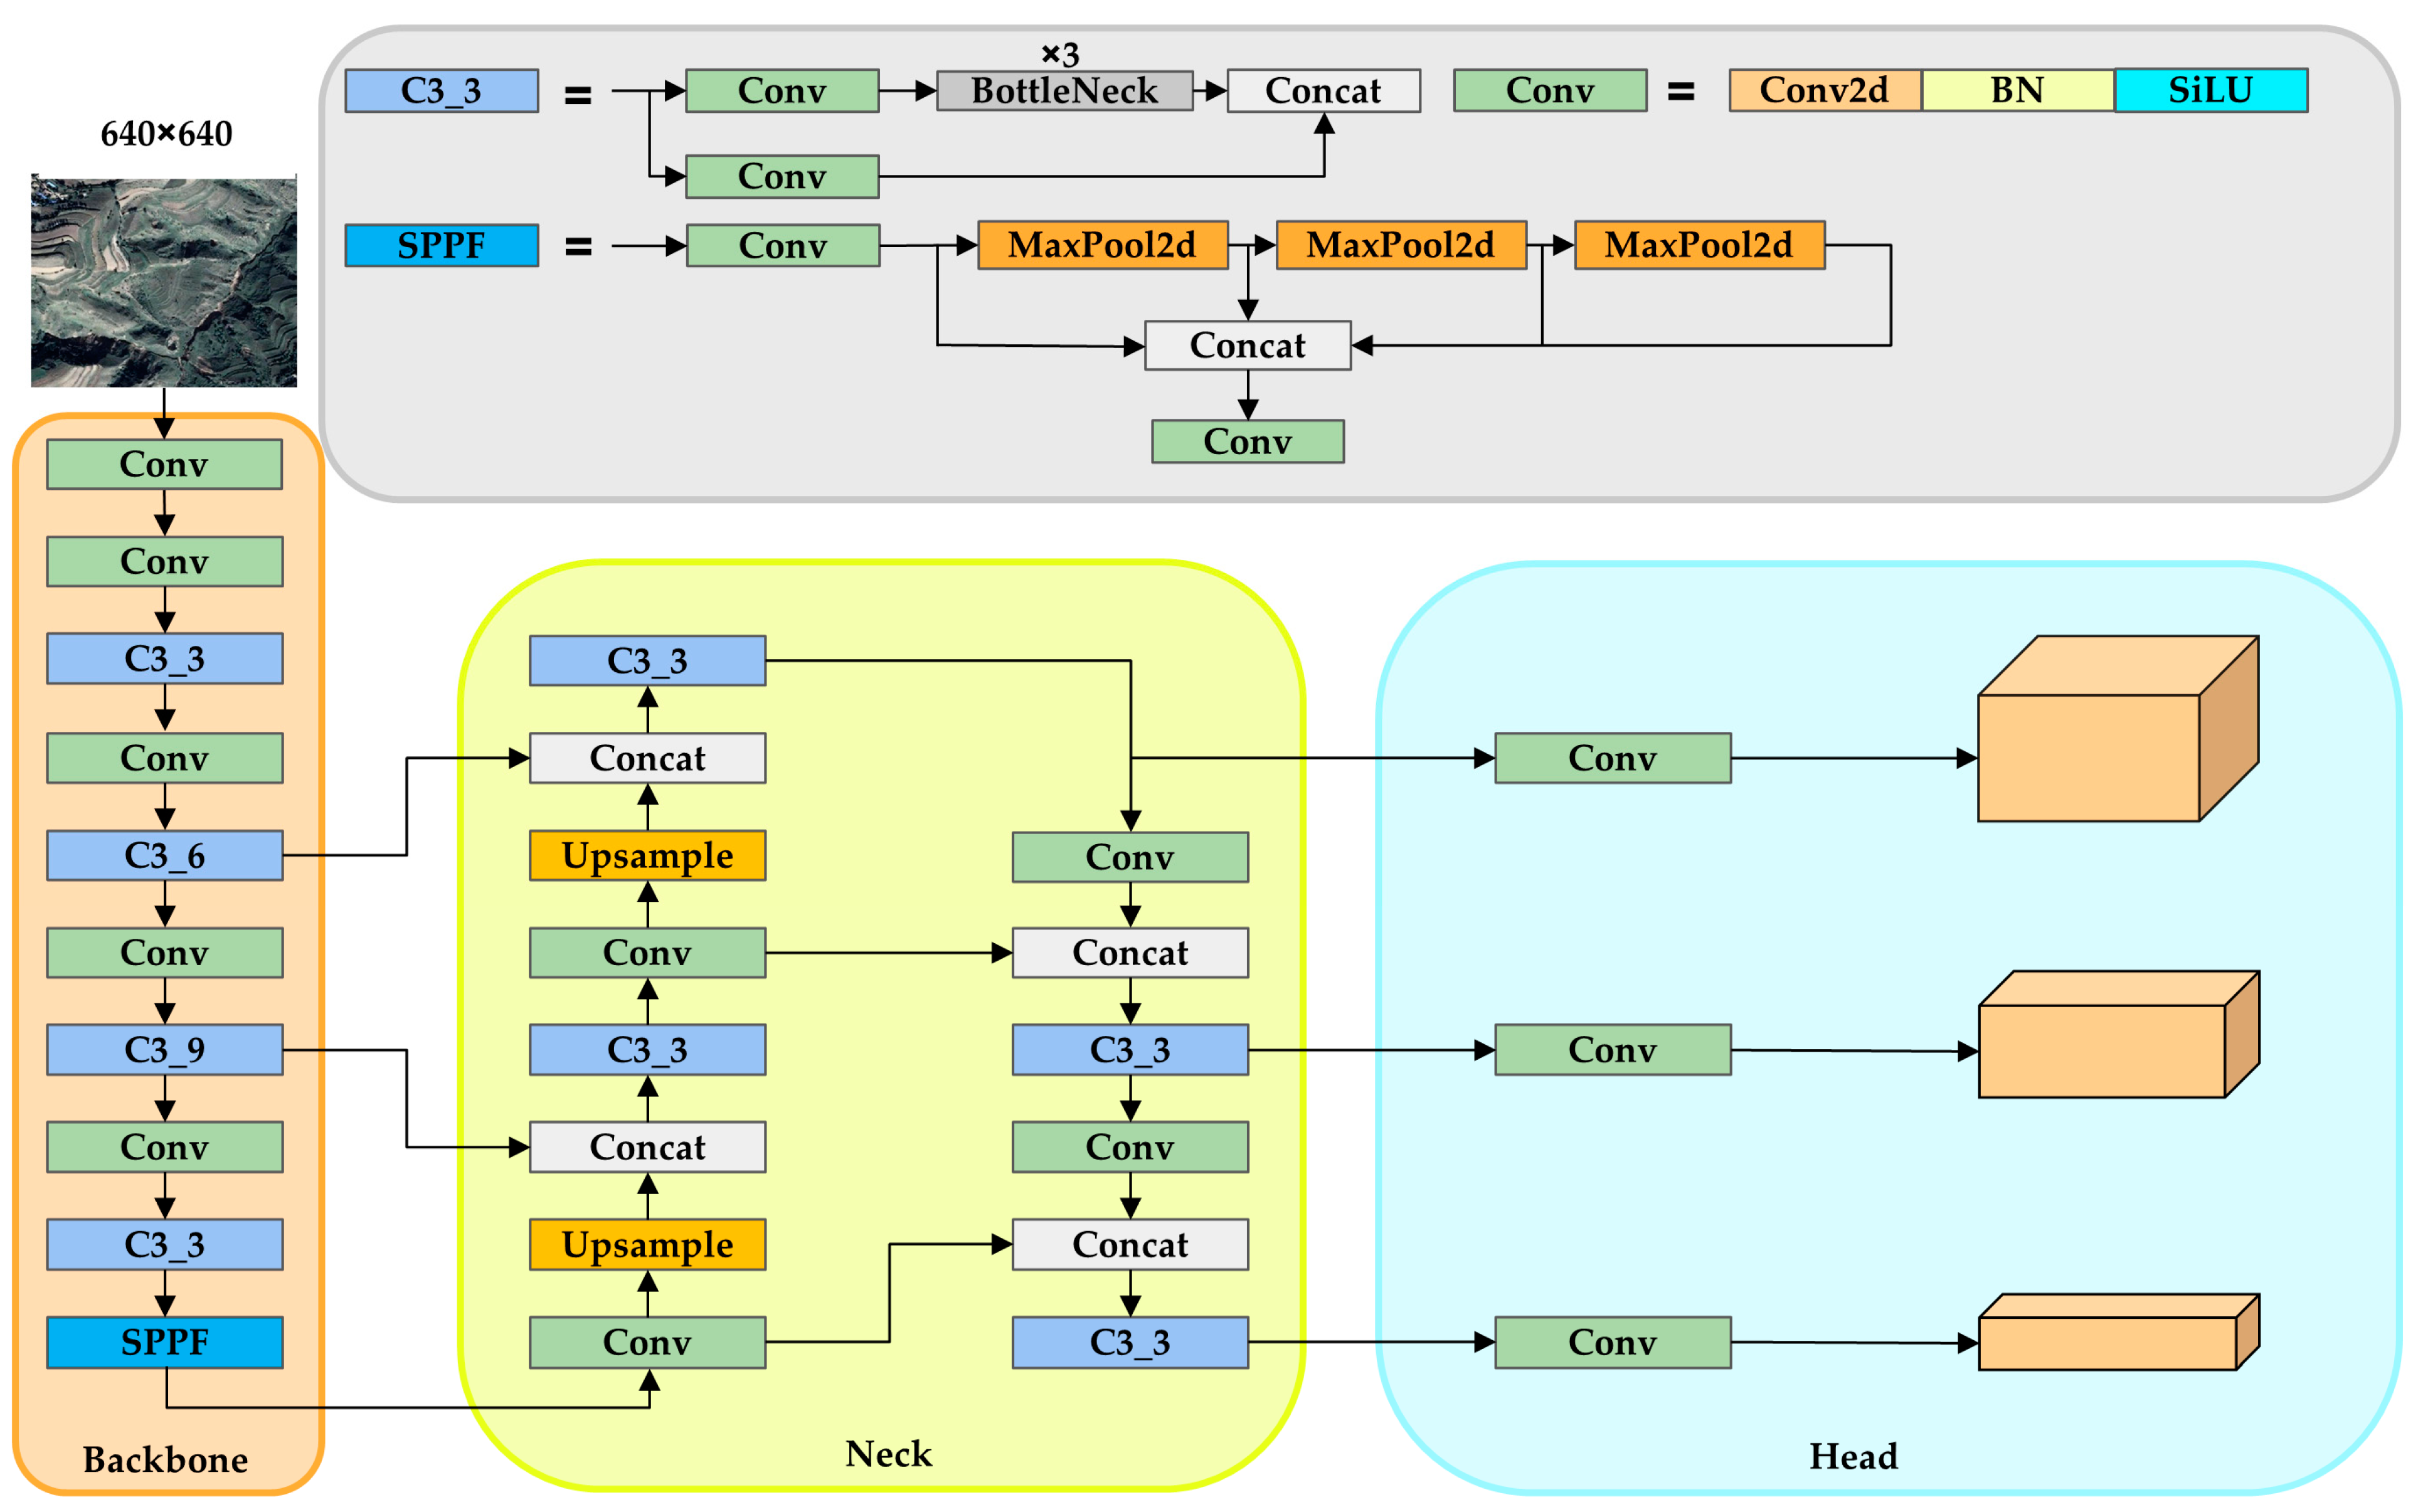
Traditional YOLO Architecture

This study utilizes YOLOv5, a single-stage detection framework proposed by Ultralytics LLC in 2020. The model comprises four units: input, backbone, neck, and output. The framework draws on the advantages of earlier YOLO versions and other detection algorithms. YOLOv5 integrates the Focus layer into the input while using DarkNet53 in the backbone to extract main image features. A feature fusion framework that includes a feature pyramid structure (FPN) and a bottom–up path aggregation network has been inserted into the neck network to augment cross-layer fusion in multi-scale features. Finally, the extracted feature maps undergo multi-scale object detection using the YOLO Head. The complete YOLOv5 structure is shown in Figure 3.
Input: The mosaic module increased the amount of data by utilizing four images for random scaling, cropping, and stitching. This greatly enhanced the background information of the images and increased the batch size. The fusion of images enriches the background information and reduces the computational burden. Additionally, the adaptive image scaling module uniformly resizes input images to 640 × 640 pixels. During network training, the network generates predicted boxes using the initial anchor boxes, compares them with ground truth boxes to determine the difference, and subsequently updates the network parameters iteratively through backward propagation.
Backbone: The CSPDaknet53 was selected as the backbone network for YOLOv5. The backbone network comprises the Focus layer, the CSPNet framework, and the Spatial Pyramid Pooling (SPPF) module. Technical terms are explained when first used. During operation, the focusing layer periodically draws pixel points from the high-resolution image and reconstructs them into a low-resolution image. The adjacent positions of the image are stacked to improve the receptive field of each point and reduce the loss of original information. The CSPNet framework constitutes the main network and elevates the characteristics of varying dimensional feature maps via residual connectivity mechanisms. The SPPF module conducts maximal pooling across four dimensions, measuring 1 × 1, 5 × 5, 9 × 9, and 13 × 13, respectively, heightening the network’s capability to differentiate feature data from images [20].
Neck: The YOLOv5 feature fusion structure is derived from YOLOv4’s Path Aggregation Feature Pyramid Network (PAFPN), which effectively fuses high-level semantic and low-level representational information. This enhances the network’s localization ability for object detection by providing greater translation equivariance and rich translation invariance for model classification. The integration of detailed and semantic features across various scales is efficiently enhanced, resulting in remarkable progress in detecting small objectives and addressing the multi-scale challenge in object detection missions. As such, numerous enhanced feature fusion designs have been integrated into the FPN foundation.
Output: The text already adheres to the principles or lacks context. Therefore, the improved version is the following: the output uses non-maximal suppression (NMS) with CIoU loss function, where NMS improves the performance of the network model in detecting overlapping objects, while CIoU consolidates the good detection performance of YOLOv5 [21].

2.3. Model Adjustment for Landslide Objectives

To enhance the network model’s feature fusion and information extraction capabilities, this paper integrates Coordinate Attention (CA) into the standard YOLOv5 backbone network. To improve the model’s ability to perceive location information, this paper merges the multi-convolutional stacking module from the neck component of the YOLOv5 with the CBAM attention mechanism. To enhance the network model’s landslide classification and location extraction capabilities, this study replaces the traditional YOLO Head with the lightweight Decoupled Head Mini. To minimize the discrepancy between the predicted box and the ground truth box, the SIoU loss function is implemented in this research paper. Finally, this paper combines the above improvement points to obtain a landslide detection method with an accuracy exceeding that of other models, as shown in Figure 4.

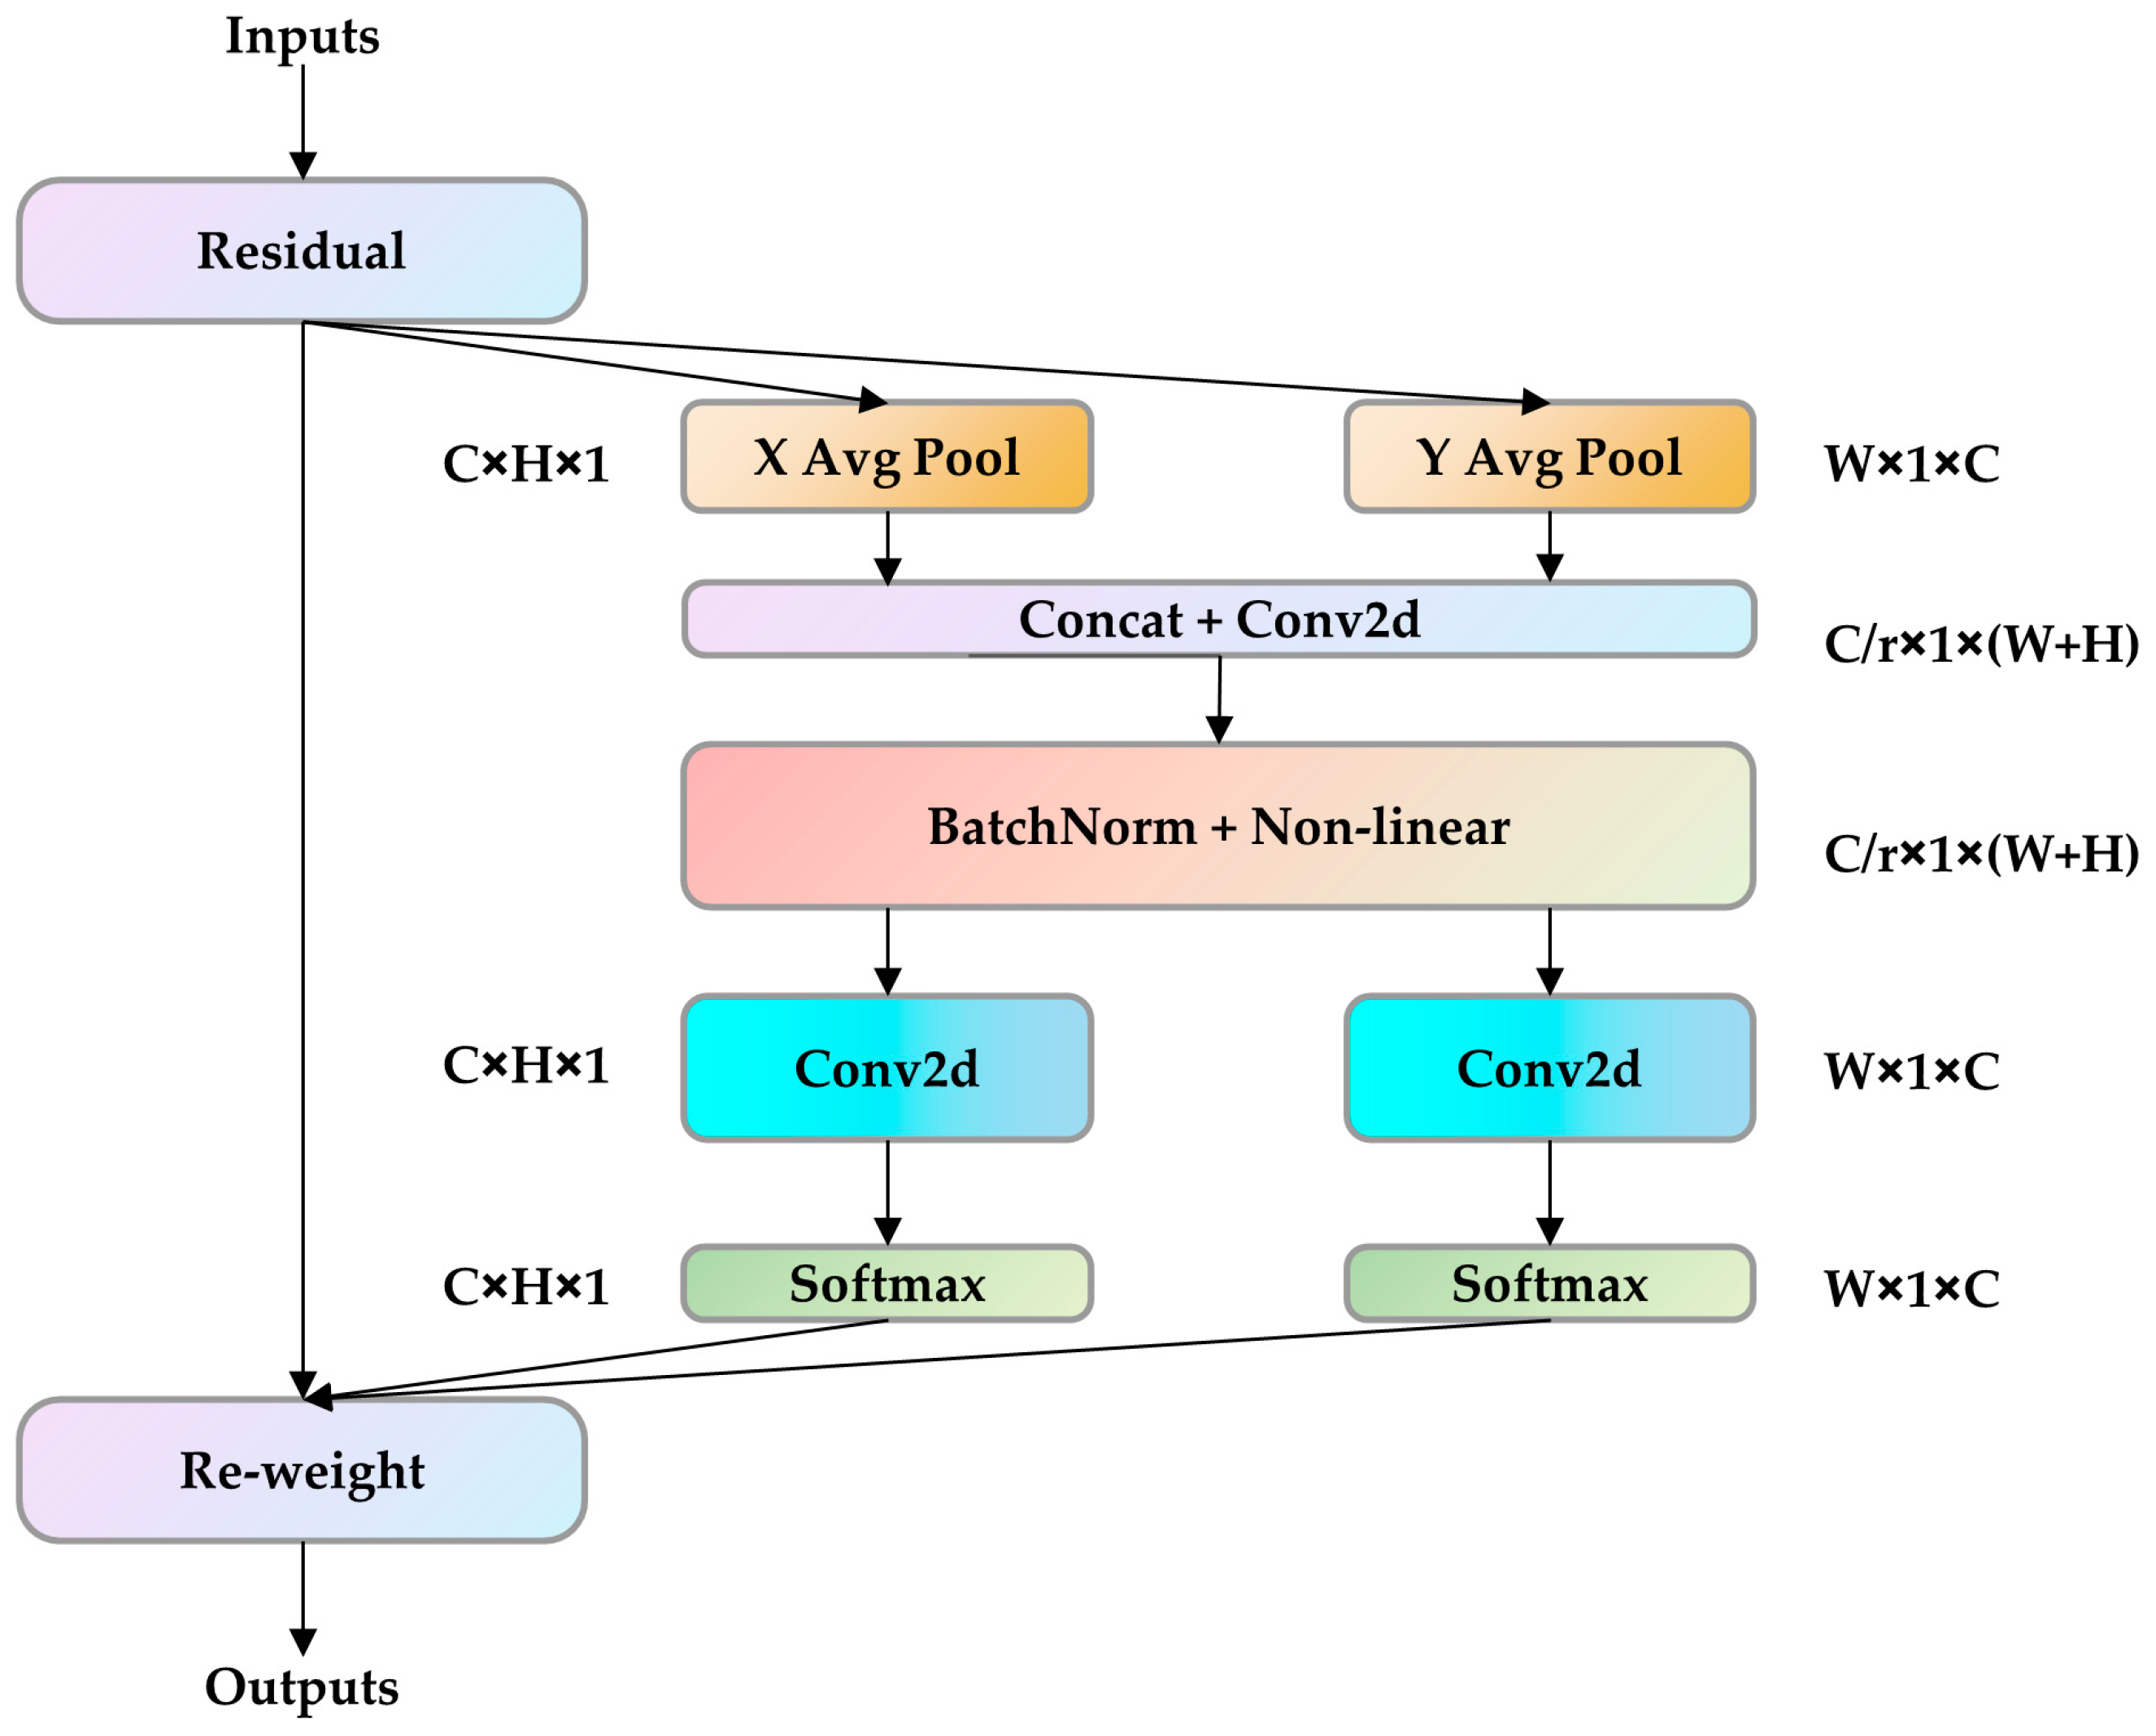
2.3.1. Introducing Coordinate Attention

In this paper, it is found that the backbone network has insufficient feature extraction when facing remote sensing landslide images; for example, detailed information such as edges of landslide images are lost in extraction. Therefore, the Coordinate Attention module is embedded after the first C3 module of the YOLOv5 backbone so that the network model takes into account not only channel information but also direction-related location information. Moreover, it is flexible and lightweight enough to improve the accuracy of object detection, especially for small objects, without increasing the number of model parameters excessively. The Coordinate Attention module is designed to improve the representation of the learned features of the mobile network, which can transform the output into a tensor of the same size for each intermediate feature tensor in the network [22]. The Coordinate Attention is constructed as shown in Figure 5.
First, to avoid compressing all spatial information into channels, global average pooling is not used here, and the decomposition of global average pooling is used to obtain remote spatial interactions with more precise location information, as shown in the following Equations (1) and (2). This causes the input feature maps of size C × H × W to be pooled in the X and Y directions to generate feature maps of size C × H × 1 and C × 1 × W , respectively.
z c h ( h ) = 1 W 0 i < W x c ( h , i )
z c w ( w ) = 1 H 0 j < H x c ( j , w )
Next, the generated feature maps are transformed, and then the concat operation is performed, as shown in Equation (3).
f = δ ( F 1 ( [ z h , z w ] ) )
After the concat operation of z h and z w , the dimensionality reduction and activation operations are performed to generate the feature map, as shown in Equation (4).
f R C r × ( H + W ) × 1
Finally, along the spatial dimension, the split operation is performed, and then the 1 × 1 convolution is used to perform the dimension raising operation, respectively, and the final attention vector is obtained by combining the sigmoid activation function, as shown in Equations (5) and (6).
g h R C × H × 1
g w R C × 1 × W
The final output is shown in Equations (7)–(9).
g h = σ F h f h
g w = σ F w f w
y c ( i , j ) = x c ( i , j ) × g c h ( i ) × g c w ( j )
As shown in Figure 6, the feature maps of both layers, before and after implementing the Coordinate Attention module, are presented. The introduction of the Coordinate Attention module not only prevents excessive model volume but also fully captures feature information from remotely sensed landslides. It accurately highlights areas of interest and establishes relationships between channels. This module’s main significance is highlighted in this paper.

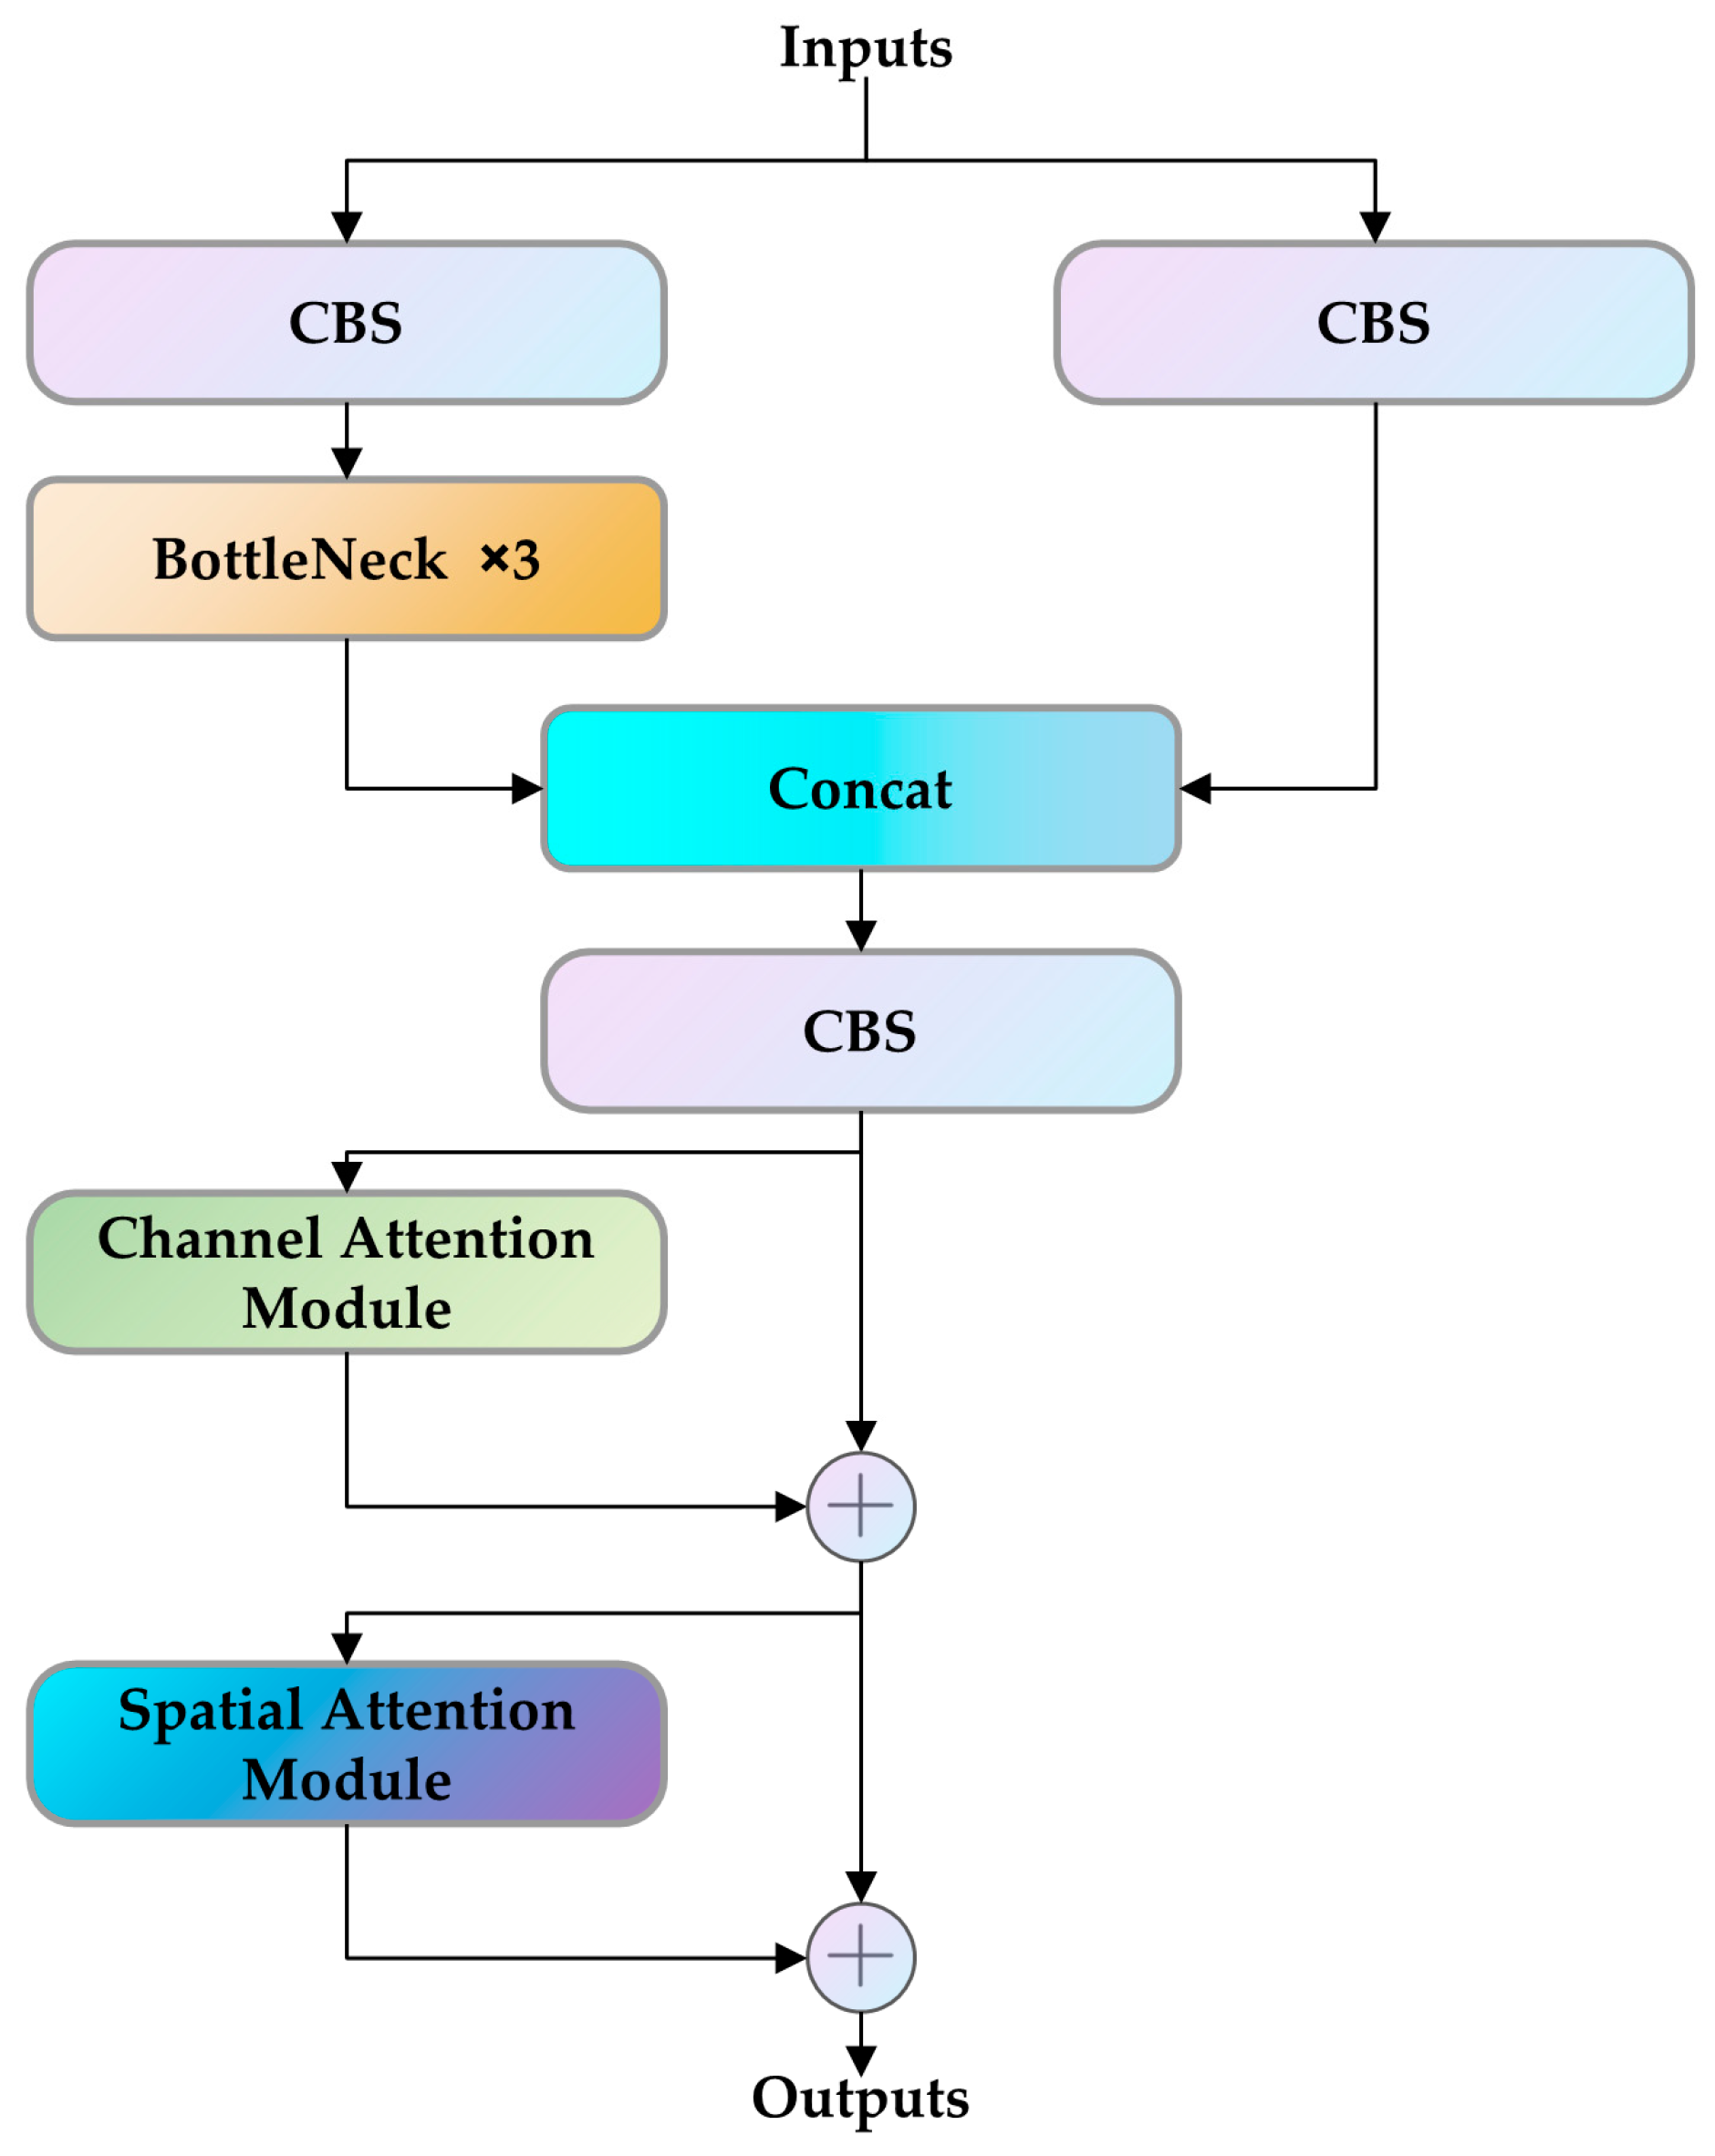
2.3.2. C3 Module Combined with CBAM

Throughout the experiments, it was discovered that the model occasionally overlooks the detection of landslides at various scales and other circumstances. To enhance the model’s robustness and enable it to more accurately identify landslides at different scales, we should focus on the model’s contextual information and improve its ability to contextualize information. We are considering implementing the Convolutional Block Attention Module (CBAM) and combining it with the C3 module. Technical abbreviation introductions will be explained upon initial use. The CBAM is designed to weigh and scale the features in the network, thereby enhancing the network’s representational power and accuracy [23]. As shown in Figure 7, the CBAM comprises two components: channel attention and spatial attention. Channel attention weighs the feature channels and adaptively adjusts the importance of each one to improve the network’s ability to perceive specific features. Conversely, spatial attention weighs the spatial dimension of the feature map to improve the network’s ability to perceive spatial locations by adaptively adjusting the importance of each spatial location. By implementing CBAM, the network can enhance its ability to learn input data features, enabling improved differentiation between distinct objects and contexts.
The neck section of YOLOv5 commonly consists of convolutional layer stacks, termed C3 modules, which extract and fuse features from various layers. Integrating the CBAM module with the C3 module boosts the model’s performance by aiding the network in capturing features of various scales and improving feature representation through channel attention and spatial attention mechanisms, as shown in Figure 8. Furthermore, the inclusion of the CBAM module improves the model’s ability to mitigate common visual interferences found in landslide images, such as background noise and illumination variations, thereby rendering the model more resilient and adaptable for practical usage in discovering loess landslide objectives.
The impact of incorporating a CBAM module versus not incorporating one for multi-scale landslide images is shown in Figure 9. These results suggest that CBAM can improve the ability to collect contextual data and facilitate accurate recognition of multi-scale landslide objectives.

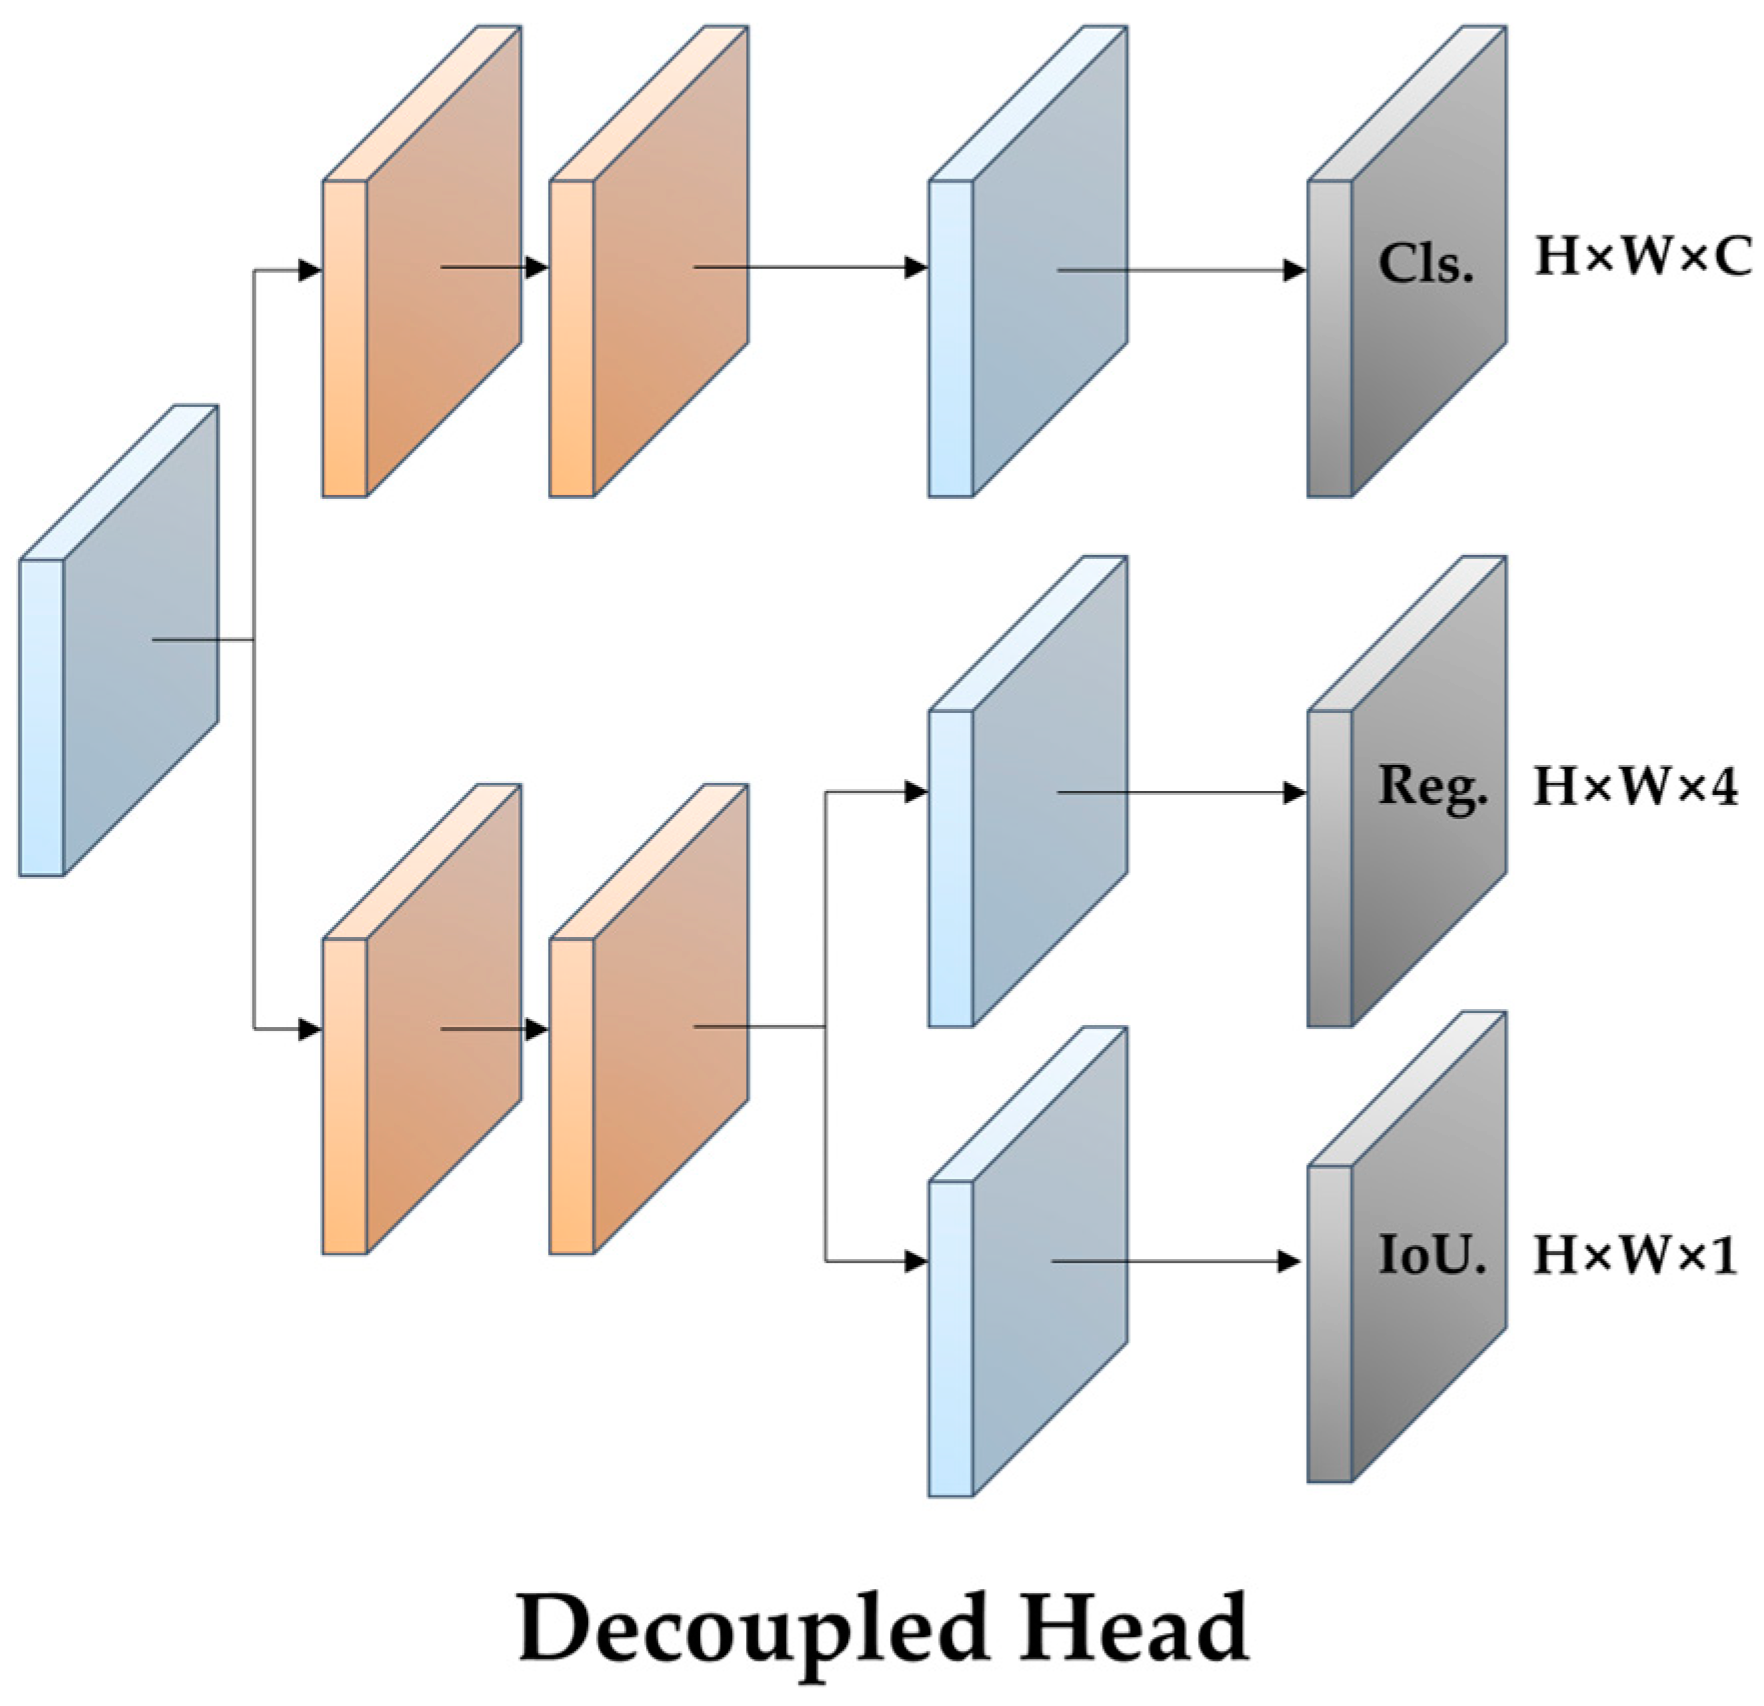
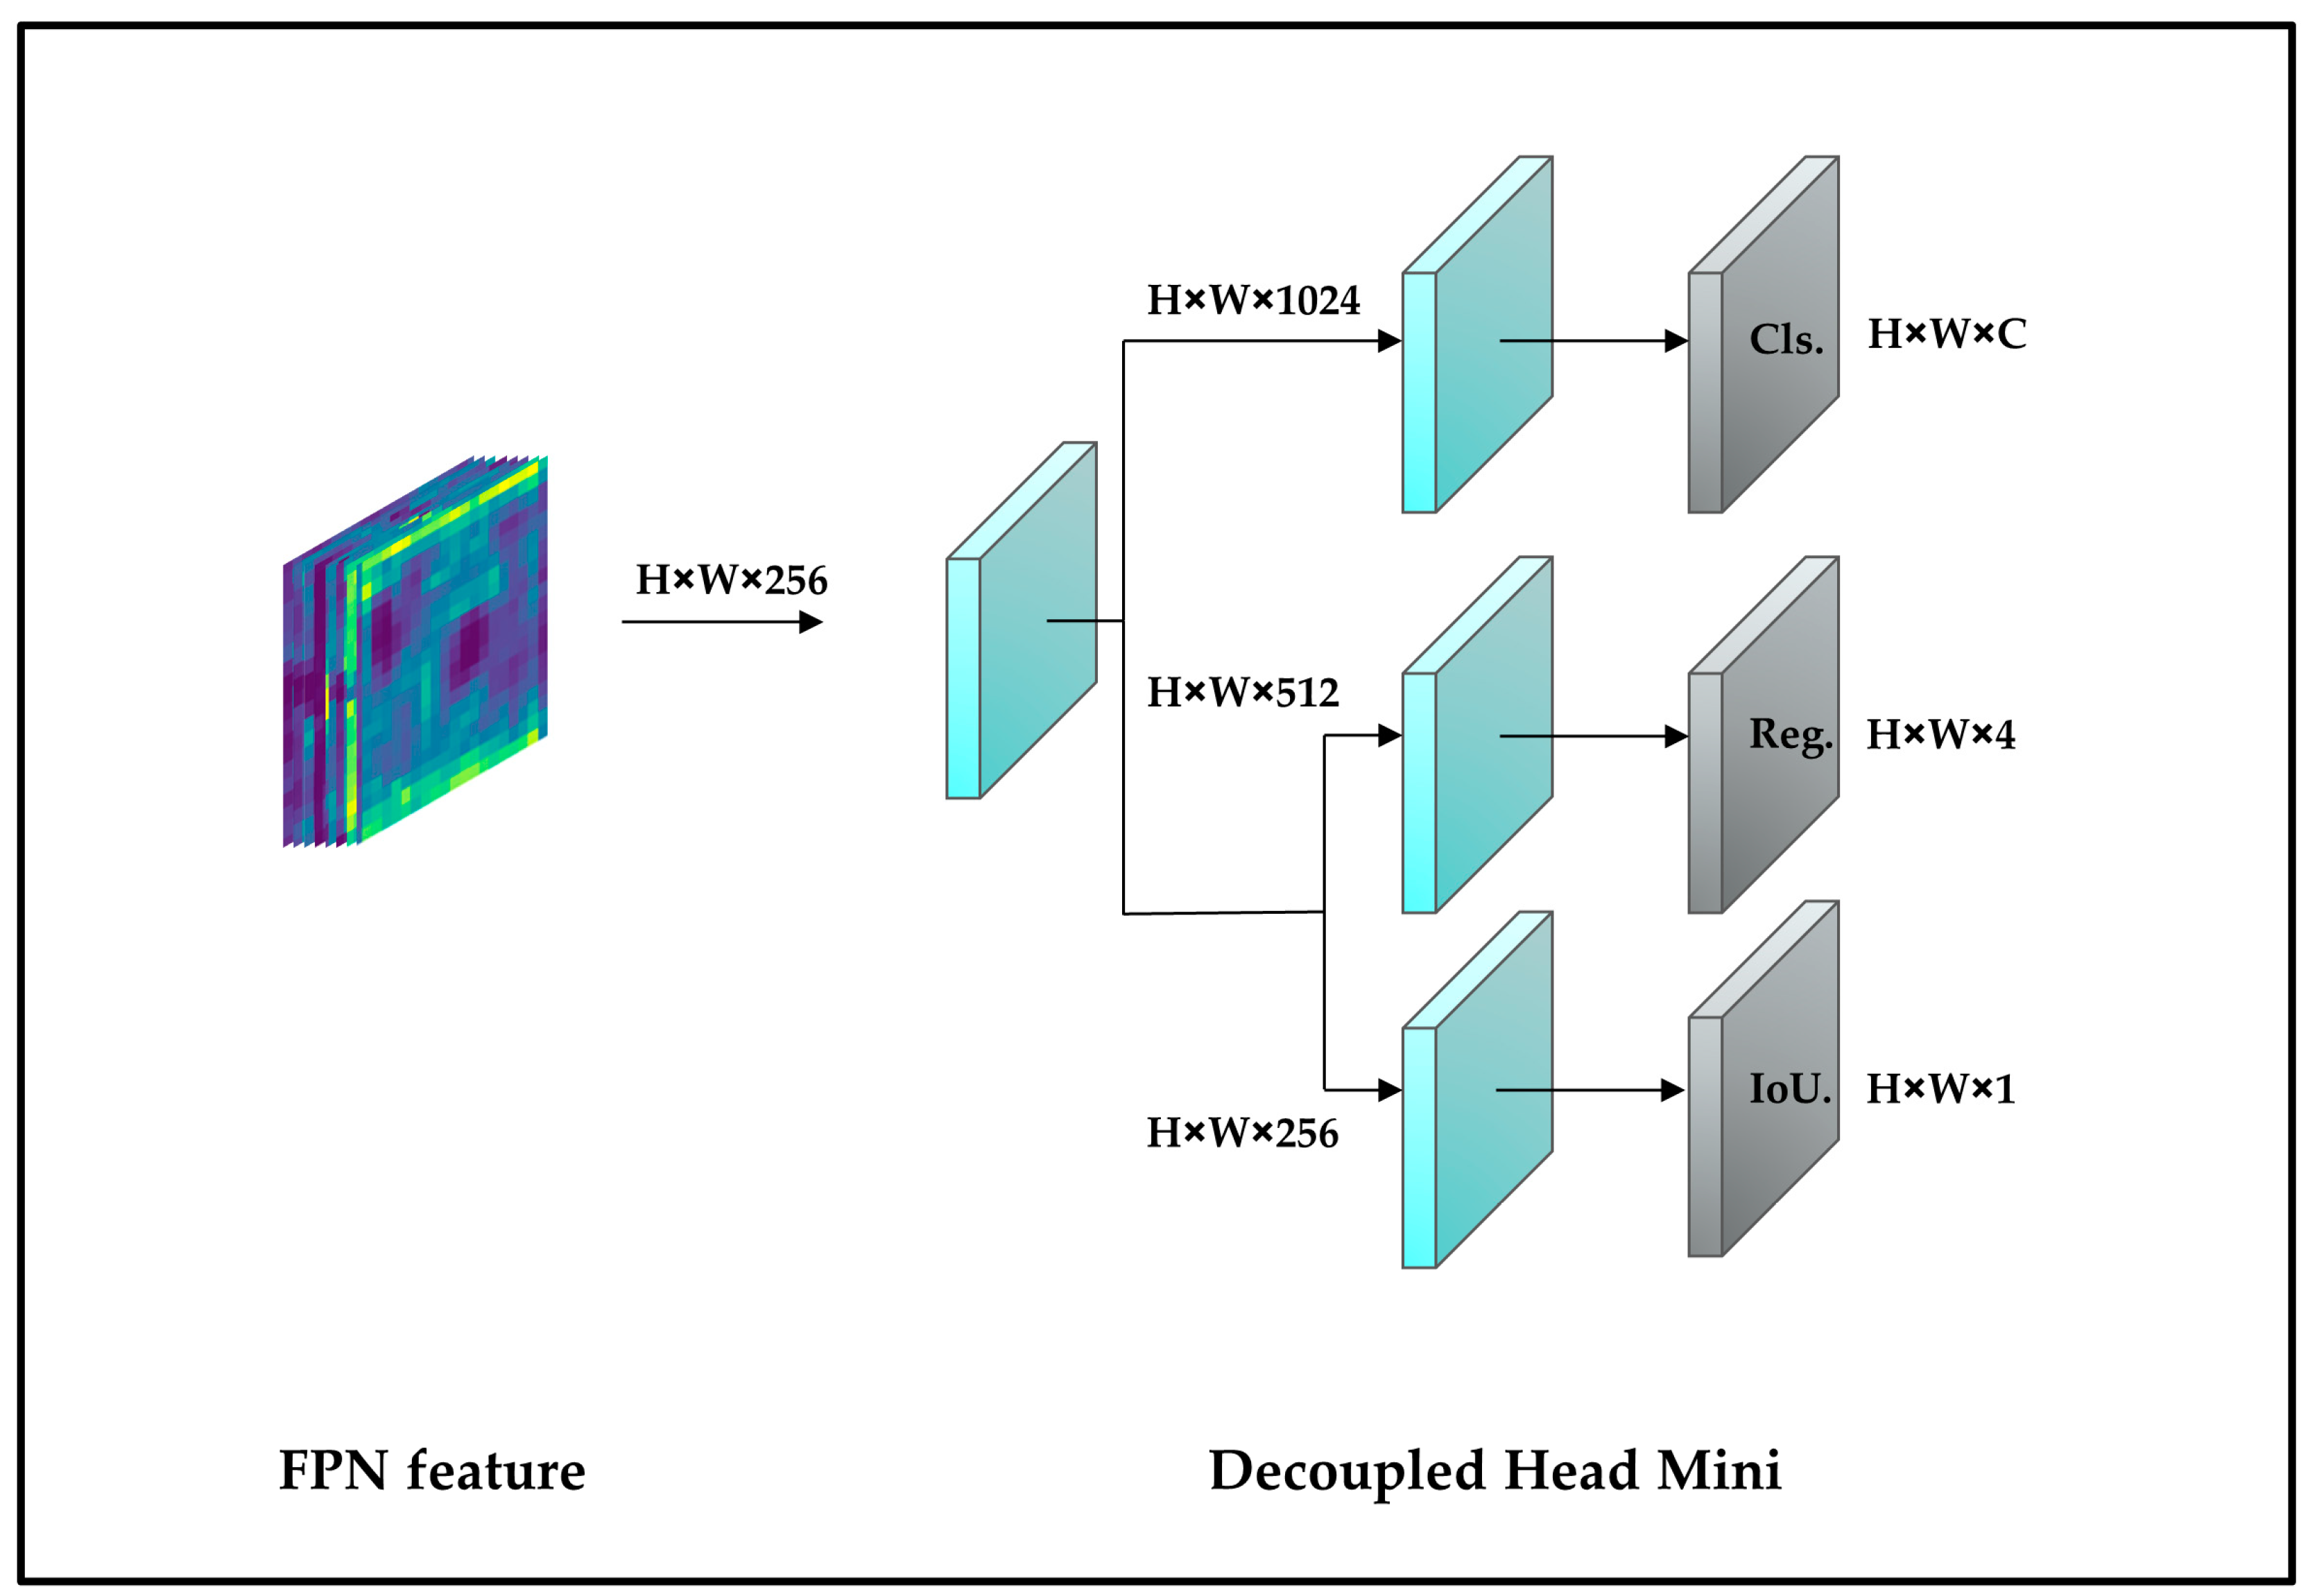
2.3.3. Replacement of Head

The detection model should output the classification and boundary location of landslide objects separately. The classification is primarily based on the object’s texture content, while the location is based on its edge information. Therefore, to enhance the efficiency of the two aforementioned aspects, the Decoupled Head approach is utilized, which separates the output classification and location into two different heads. This technique effectively augments detection accuracy and expedites convergence [24]. The structure of Decoupled Head is shown in Figure 10.
The Decoupled Head input is initially reduced to 256 channels using 1 × 1 convolution. It is then split into two branches, with each branch further reduced to 128 channels through 3 × 3 convolution. One branch is devoted to the classification task, which focuses more on identifying the category to which extracted features belong. The other branch serves the regression task and pays more attention to location data. Therefore, regression concentrates more on the coordinates of the GT Box and the adjustment of the bounding box parameters. The addition of the IoU branch to the regression task is accompanied by the decoupling of the regression task, which is separated into position and confidence-related tasks. This decoupling of the detection head effectively minimizes the prediction bias resulting from task differences, thereby enhancing the model’s detection accuracy.
In this study, we introduce the Decoupled Head Mini. The model incorporates convolution layers with a focus on information compression of the feature map without excessive convolution operations. This decreases the number of channels and, to some degree, the number of parameters needed for the network structure. It also lessens the overall computation of the network, thus furnishing necessary prerequisites for improving the detection speed and accuracy of our landslide detection model. This enables us to achieve a lightweight and precise detection of loess landslide objectives. The structure of the Decoupled Head Mini is shown in Figure 11.

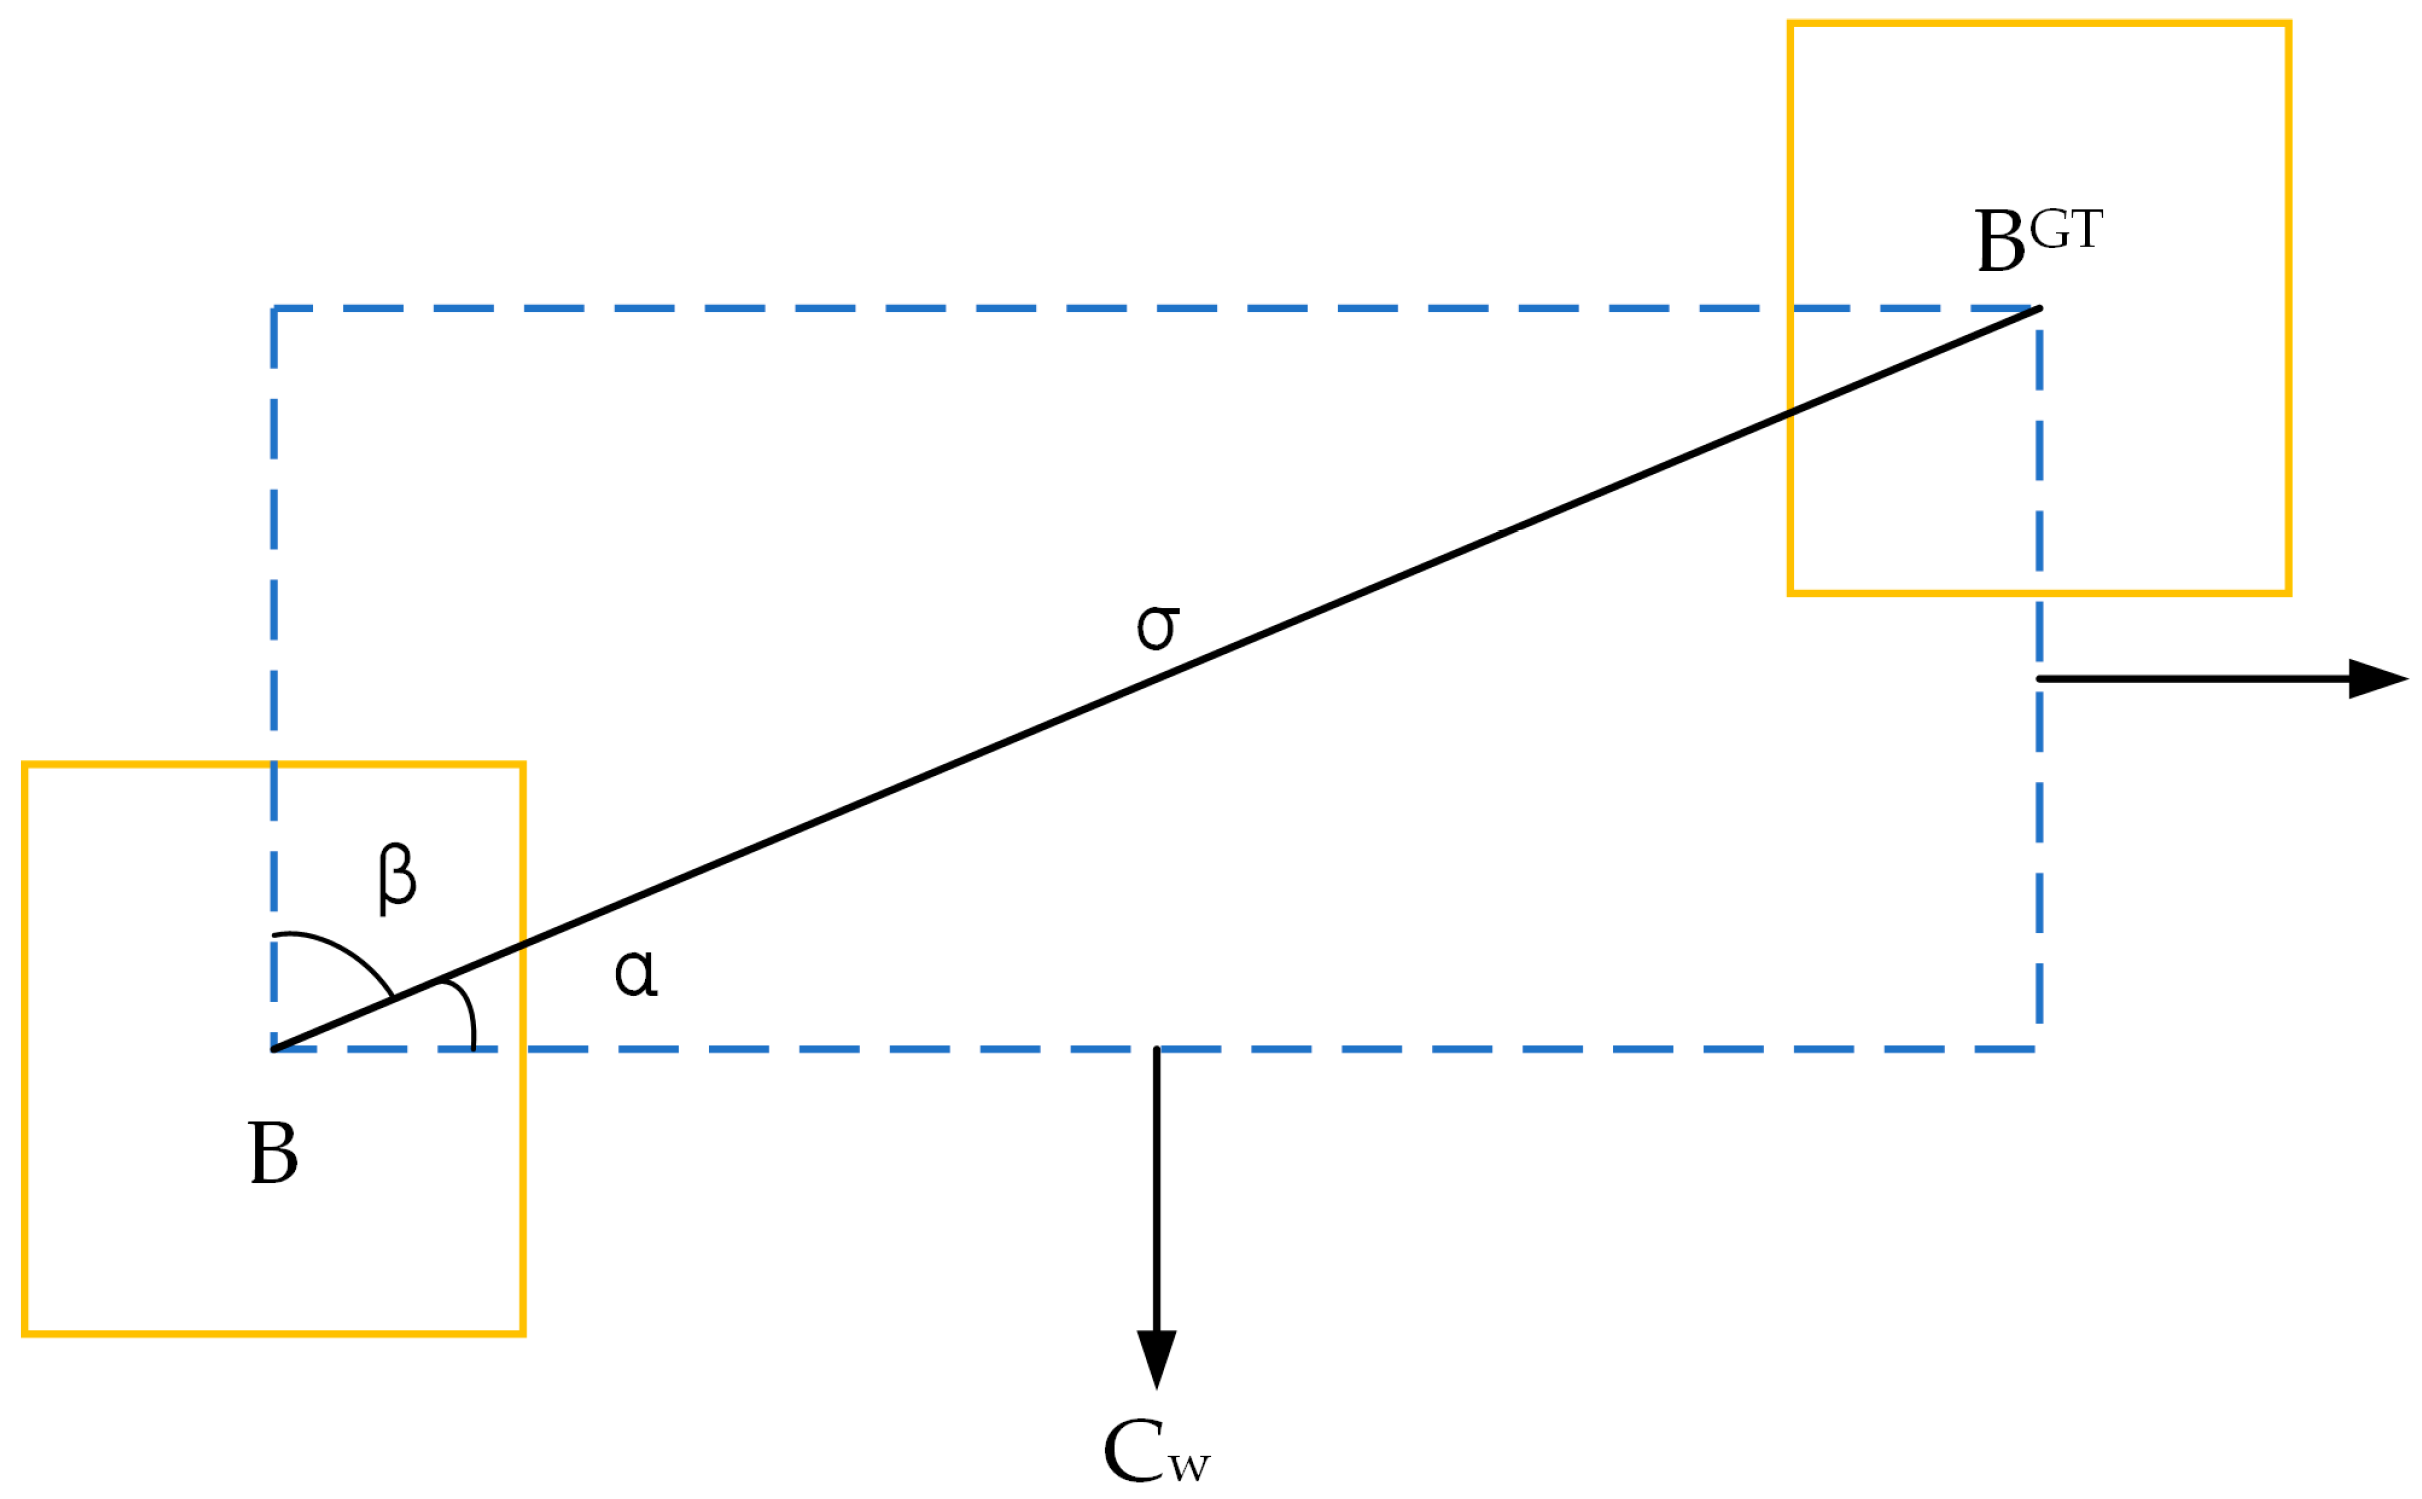
2.3.4. Loss Function

Due to the multi-directional nature of remote sensing images of loess landslides, specifically, the challenges posed by overhead shooting and the uncertainty of the landslide’s direction, our detection model must address the imaging complexity resulting from both angle and direction factors. In this study, we substitute the CIoU function with the SIoU function to mitigate bias between the prediction and ground truth boxes, ultimately enhancing detection performance [25]. GIoU, DIoU, and CIoU do not consider the direction between the ground truth box and the prediction box during detection, resulting in slower convergence [26,27,28]. SIoU is a loss function that builds on the CIoU and GIoU functions to enhance object detection results in remote sensing images. By incorporating the vector angle between the prediction box and the ground truth box, it provides direction for regression and adjusts the penalty function. SIoU is a loss function that builds on the CIoU and GIoU functions to enhance object detection results in remote sensing images. The objective of SIoU is to achieve better performance and accuracy in object detection.
It works by calculating the value of the angular loss between the ground truth box and the predicted box, defined as shown in Equation (10).
Λ = 1 2 × sin 2 ( arcsin ( c h σ ) π 4 ) = cos ( 2 × ( arcsin ( c h σ ) π 4 ) )
where c h is the height difference between the center point of the ground truth box and the prediction box, σ is the distance between the center point of the ground truth box and the prediction box, and, in fact, arcsin   ( c h σ ) is equal to the angle α, defined as shown in Equations (11)–(13).
c h σ = sin ( α )
σ = ( b c x g t b c x ) 2 + ( b c y g t b c y ) 2
c h = m a x ( b c y g t , b c y ) m i n ( b c y g t , b c y )
where ( b c x g t , b c y g t ) is the ground truth box center coordinates, and ( b c x , b c y ) is the predicted box center coordinates. The above process is shown in Figure 12.
Based on the variety of shapes and sizes of objects in remote sensing images, this project aims to enhance algorithm performance in detecting small-scale landslides in aerial remote sensing images while minimizing the discrepancy between predicted and actual bounding boxes outputted by the object detection model. The detection capability of the overall framework is improved in this paper by implementing a more accurate SIoU loss function that considers the orientation factor, replacing the original CIoU loss function. The improved object detection module produces the detection effect, as shown in Figure 13.

3. Experimental Settings

3.1. Experimental Environment

This paper’s hardware platform is founded on an Intel i9-13900K CPU and an Nvidia RTX4090 GPU with 24 GB RAM. The CUDA version is 11.2, and the Pytorch version is 1.9.0, with Anaconda 4.10.3 and Python 3.9.7 being the primary supporting software. The software platform, which executes a deep neural network model, is centered on Pytorch 1.12.1—an open-source deep learning framework that leverages the Python programming language. The software can manage tensor data and includes fundamental operation units (e.g., convolution, pooling, and full connectivity) to aid users in personalizing complex neural network architectures. It enables users to have access to both automatic tensor derivation and optimization algorithms for most model training purposes.

3.2. Training Detail

In this study, 11,010 remote sensing image datasets having a resolution of 640 × 640 pixels were randomly allocated into a training set, validation set, and a test set with ratios of 80%, 10%, and 10%, respectively. The dataset display illustration is shown in Figure 14.
The model’s primary parameters in this paper are established pre-training, and each training epoch consists of 100 iterations. During training, the optimizer employed is Stochastic Gradient Descent (SGD), with a batch size of 8, an initial learning rate of 0.01, and a weight decay coefficient of 0.0005. Following each iteration, the dataset’s order is automatically re-shuffled and re-input to decrease overfitting.

3.3. Evaluation Indicator

In this paper, we use four composite metrics—precision, recall, average accuracy, and mean average accuracy—to evaluate the performance of our landslide detection model in the dataset. These metrics are calculated as shown in Equations (14)–(17).
P r e c i s i o n = T P T P + F P
Precision indicates the model’s aptitude to differentiate negative samples, with higher precision signifying greater capability to distinguish such samples.
R e c a l l = T P T P + F N
Recall measures the model’s ability to differentiate positive samples. Higher recall signifies a stronger ability of the model to identify positive samples.
A P = 0 1 p ( r ) d r
m A P = 1 c i = 1 c A P i
The average precision ( A P ) is the average of the highest precision values under various recall conditions, typically calculated separately for each category. The mean average precision ( m A P ) is determined by averaging the A P values across all categories, serving as a standard metric for evaluating multi-category object detection performance. In this study, average accuracy is computed at an IoU threshold of 0.5. Unless otherwise specified, all m A P values mentioned in this thesis refer to mAP50.
T P is the true positive, F P is the false positive, F N is the false negative, c is the total number of categories detected by the object, and P i j can be interpreted as the number of objects predicted to be category j objects in category i . F P S is the number of frames per second (how many images) that can be processed (detected) by the object network, which is simply understood as the refresh rate of the image, and the higher the F P S means that the object model detects faster.

4. Comparison of Experimental Results and Models

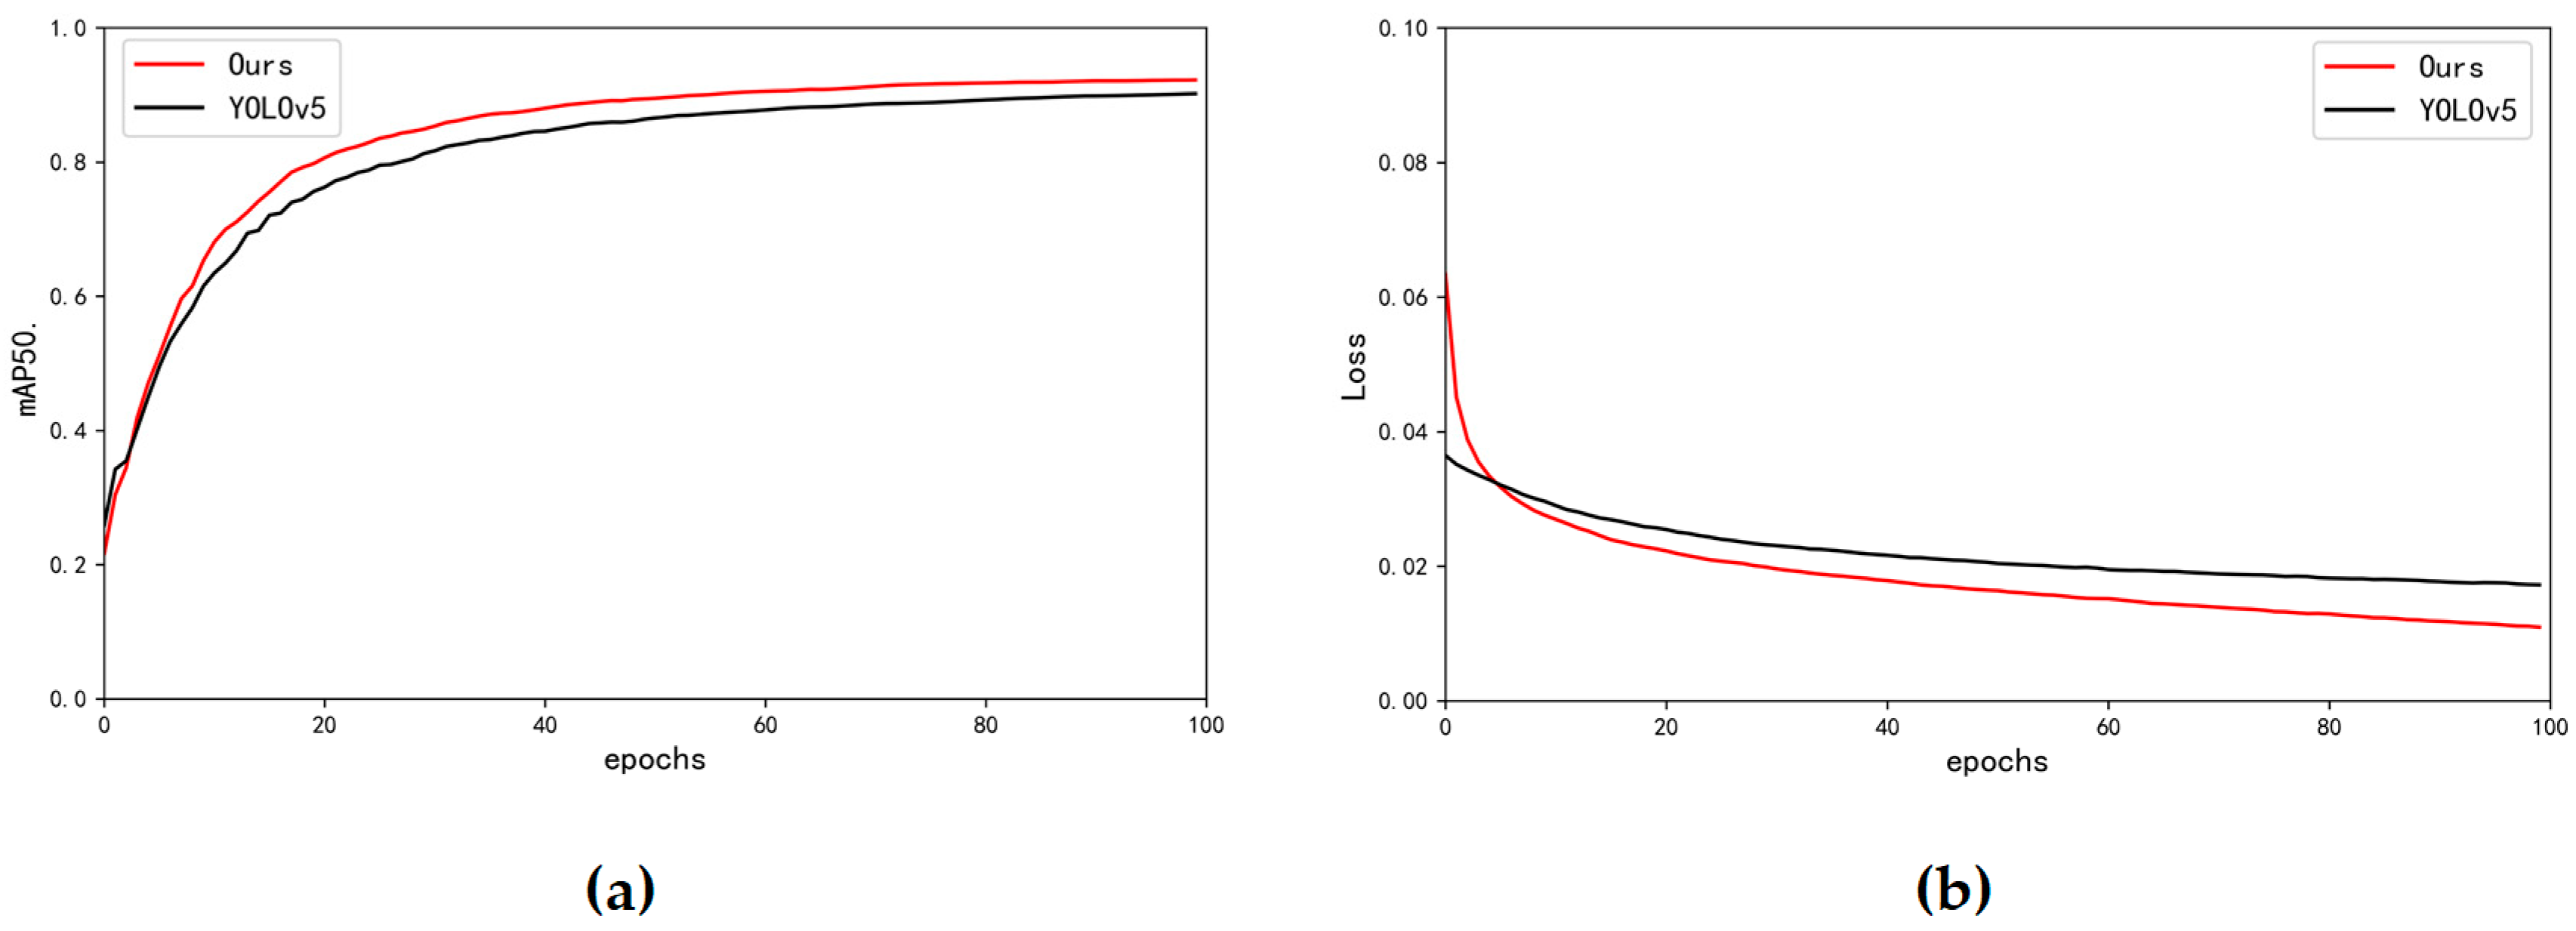
4.1. Model Comparison

To evaluate the efficacy of our landslide detection model, this study compares it with four existing advanced and classical object detection models: YOLOX, Fast R-CNN, and SSD, and the results are shown in Table 1.
Our landslide detection model extracts remote sensing landslide image features directly from the network, focusing on landslide objects and avoiding background noise information. The model’s ability to obtain landslide object feature information at different scales is enhanced by the addition of CA, C3CBAM, Decoupled Head Mini, and SIoU, which improves the model’s robustness in detecting different remote sensing landslides. Our model for detecting landslides achieved the highest detection performance when compared to each advanced detector. The m A P achieved was 92.28%, which is 6.2% higher than YOLOX, 14.36% higher than Fast R-CNN, and 9.9% higher than SSD. Compared to other models, our model achieves a detection speed of 81.2% FPS, which is superior. These results suggest that our landslide detection model is more appropriate for the automatic detection of landslides using remote sensing images than other models.
In this paper, we present the change curves of m A P and loss on the validation set for both the baseline models YOLOv5 and our landslide detection model, as illustrated in Figure 15. Through 100 epochs of training, the amplitudes of the model’s m A P and loss consistently decrease and stabilize, signifying successful training. Notably, the m A P of the validation dataset during training of our landslide detection model remains stable at 92.28%, surpassing that of YOLOv5. Our results show that our landslide detection model outperforms YOLOv5 in detecting landslides on the remote sensing dataset.
The improved network model is utilized to detect intricate landslide images sensed remotely, with the detection effect being observed. We conduct experiments on various types of landslide objects, including tiny and large ones, as well as multi-scale remote sensing images of landslides, as shown in Figure 16, Figure 17 and Figure 18. The enhanced model demonstrates superiority in extracting feature information from intricate landslide objects and produces better detection results across small, large, and multi-scale landslide datasets.

4.2. Ablation Experiment

The current study’s network model incorporates various improvement modules, and thus, this paper examines the efficacy of each module through an ablation experiment that involves Coordinate Attention, Decoupled Head Mini, C3CBAM, and SIoU loss function. The results are shown in Table 2.
The results in Table 2 show that when the baseline model adds Coordinate Attention, the network model’s ability to extract feature information of the landslide objects was enhanced, and the network model’s m A P is increased by 2.22%; when C3 in the neck is replaced with C3CBAM, the network model’s ability to improve the recognition of landslide object and background is enhanced, and the m A P is increased by 1.36%; when YOLO Head is replaced again with Decoupled Head Mini, the network model improved its ability to focus on location and classification information comprehensively, and m A P increased by 0.24%; when CIoU was replaced with SIoU, its network model increased its focus on the vector angle between the prediction box and the ground truth box, and m A P increased by 0.19%. The final m A P of the improved network model was 92.28%. The experiments demonstrate the practical effects of each improvement point in this paper, all of which help to improve the performance of the model.

5. Discussion

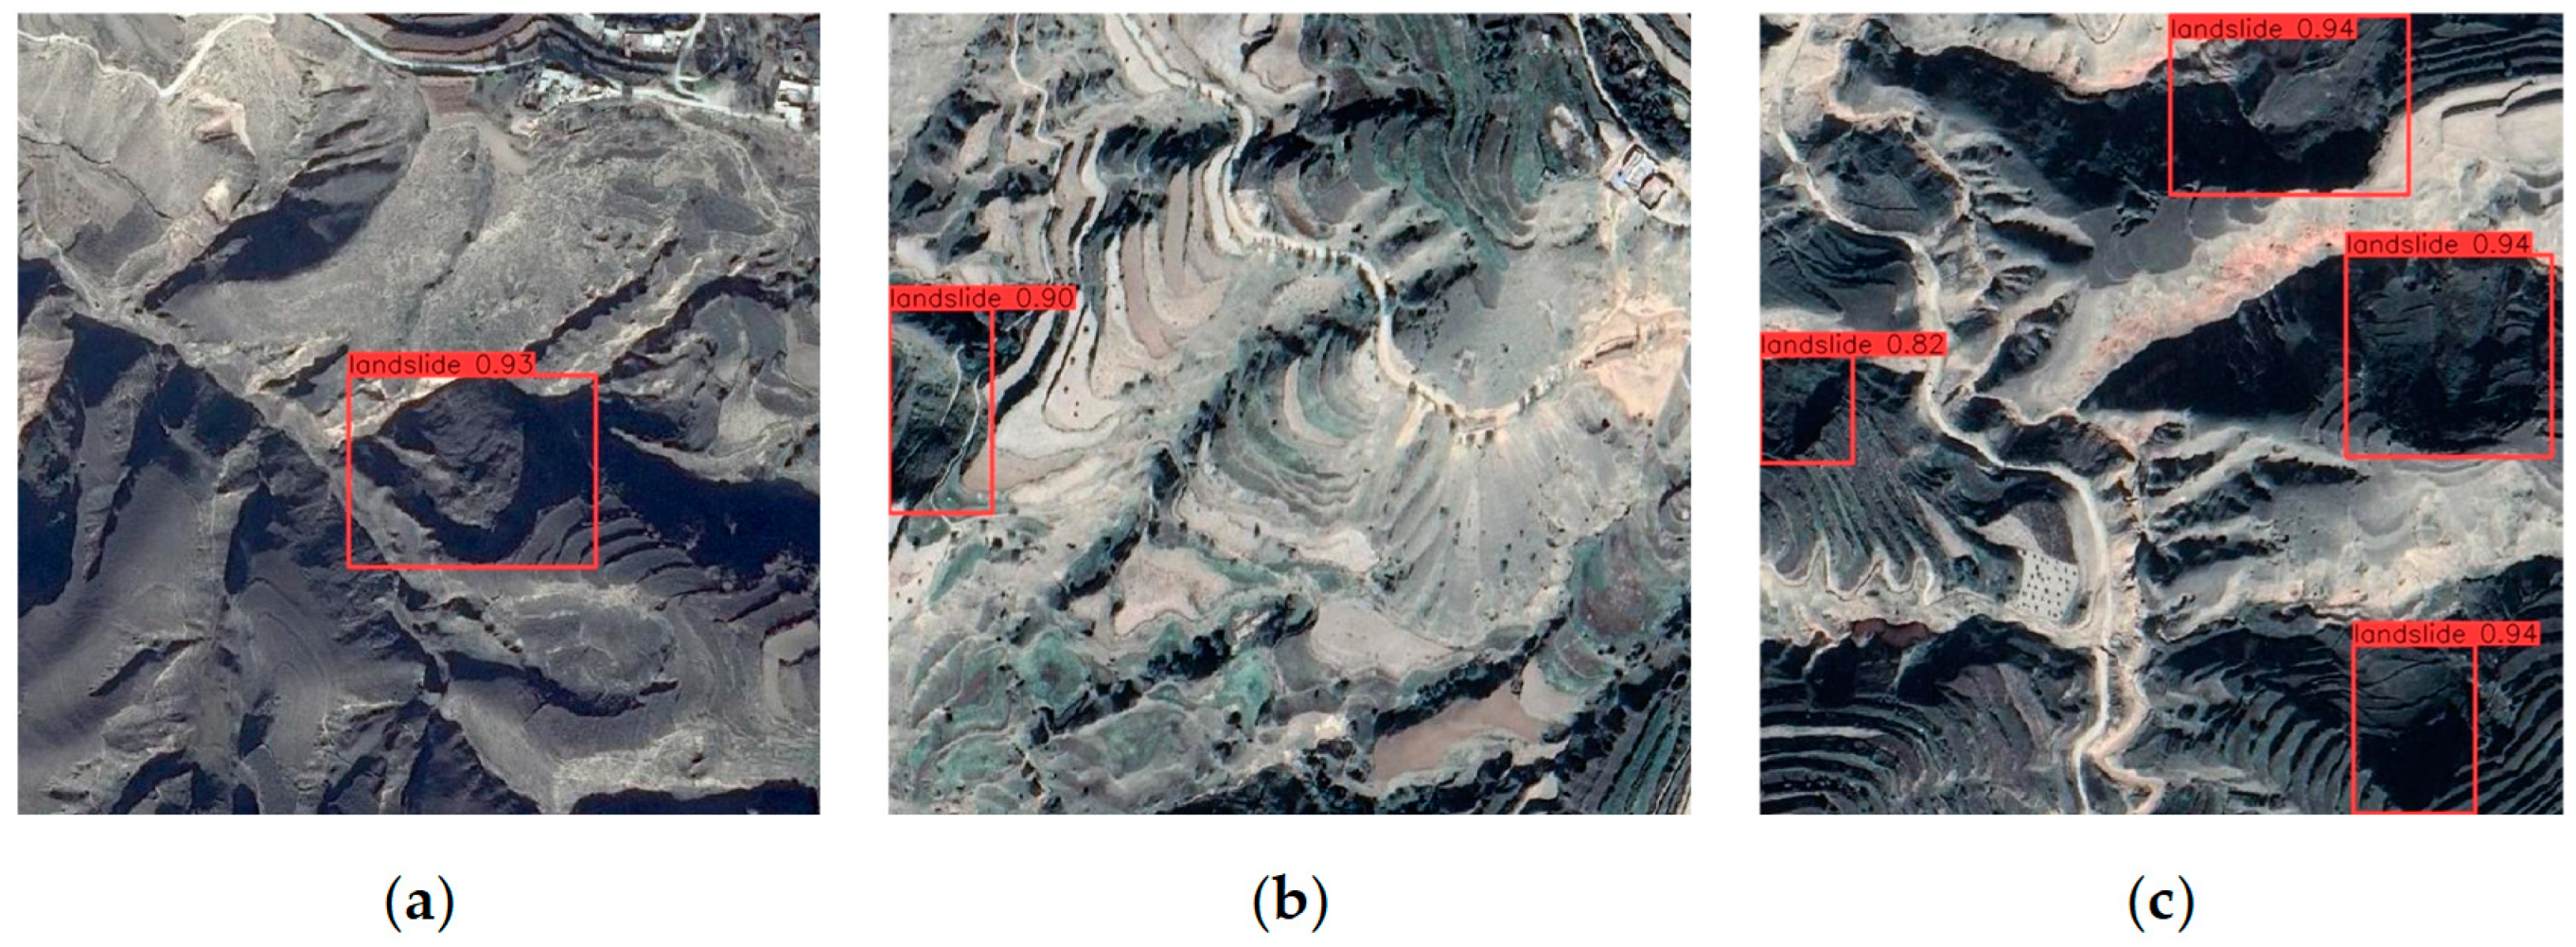
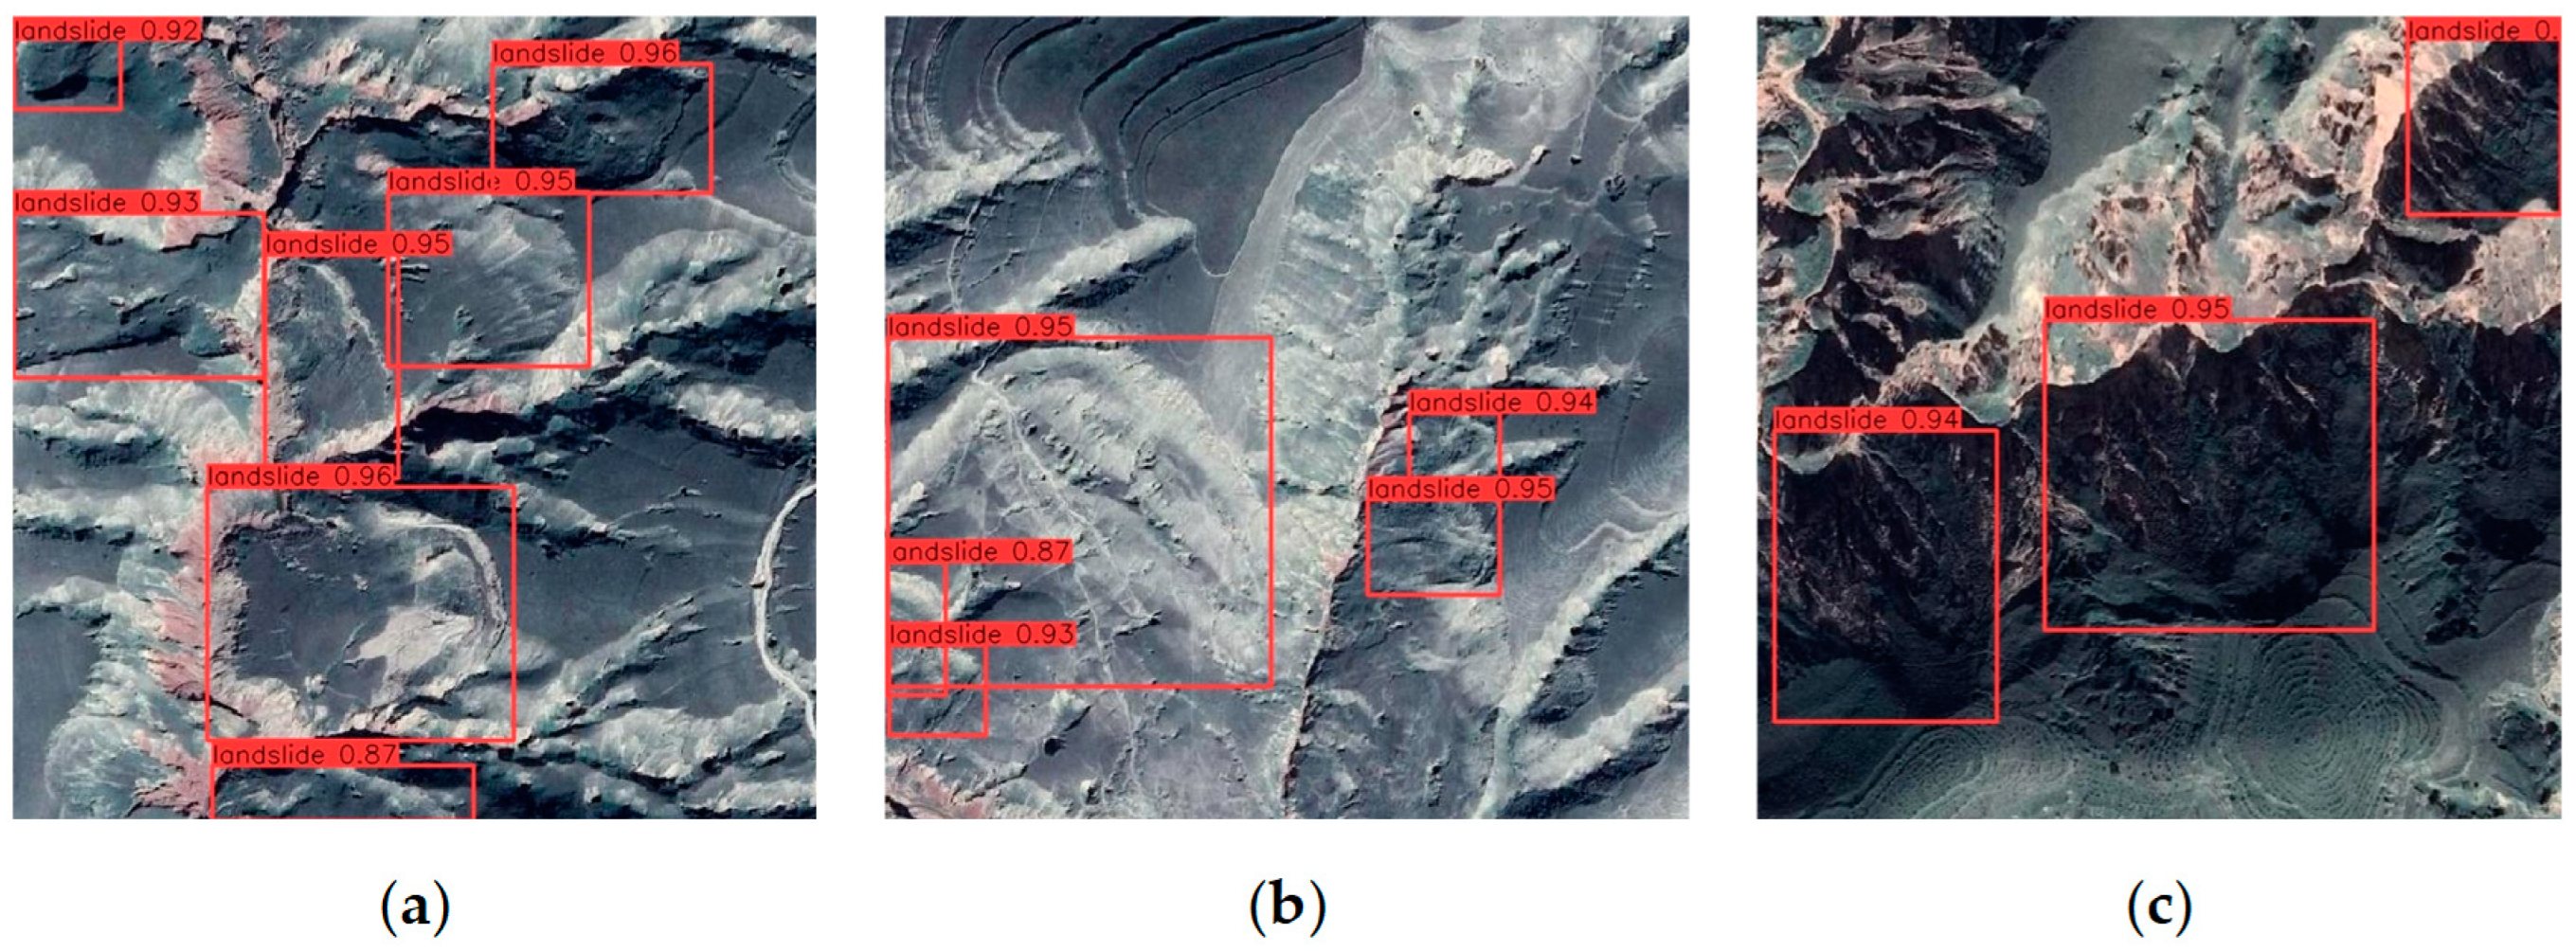
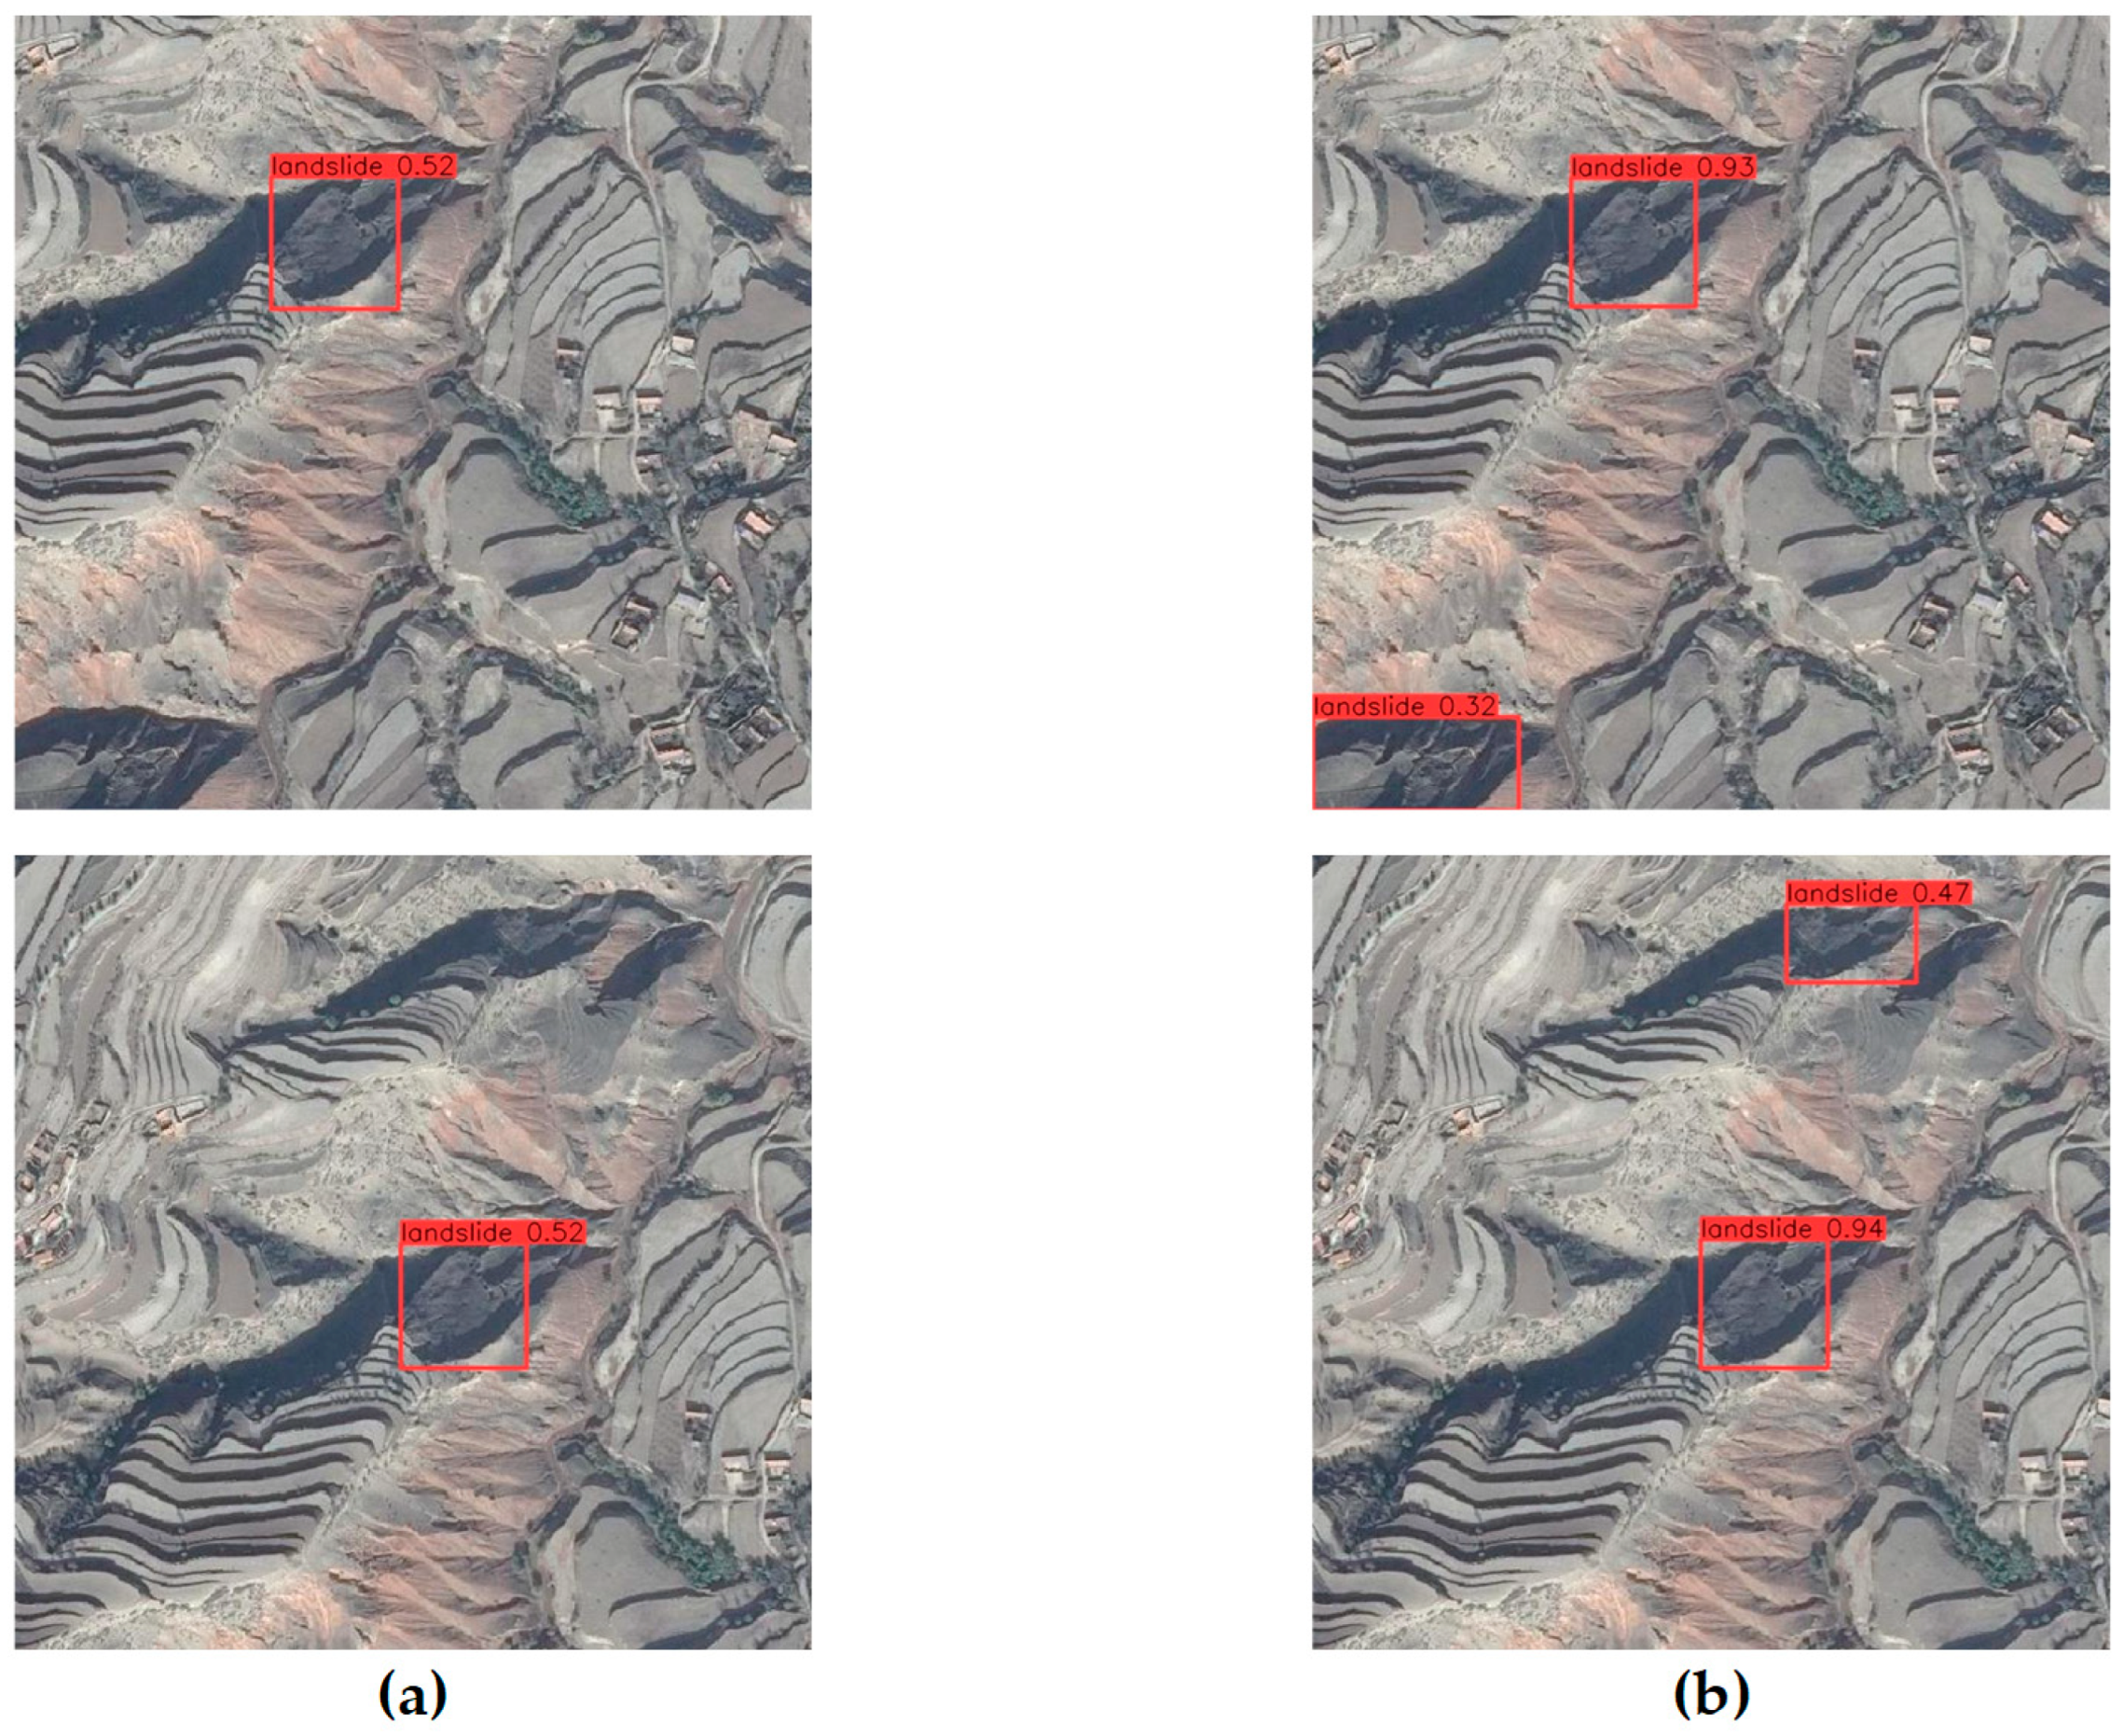
5.1. Landslide Detection Accuracy of Different Models

This study compares our loess landslide detection model with three object detection models: YOLOX and SSD, which are single-stage algorithms, and Fast R-CNN, which is a two-stage algorithm. Our model outperforms the others in all metrics, with 4.87% higher precision than YOLOX, 8.39% higher recall than SSD, 6.2% higher mAP than YOLOX, and 5% higher FPS than SSD. The improvements made in this study are closely linked to the enhanced detection capabilities of the model. By integrating CA into the backbone network, accurate location information and remote sensing spatial interaction information can be obtained from landslide images. Remote sensing images are often affected by complex background noise, but we propose using the CBAM module to filter out this noise and focus on the landslide object. Additionally, the use of a lightweight Decoupled Head can enhance the model’s ability to detect landslide objects without significantly increasing its complexity. Furthermore, we have introduced the SIoU loss function, which considers the vector angle between the ground truth frames and the predicted frames, to further improve the model’s accuracy.
The ablation experiment partially explains the effectiveness of the improvements made to the model implementation in this study. Firstly, the experiments confirmed that adding moderately different attentional mechanism modules to the trunk and neck of the model did not decrease the model’s accuracy. The model’s mAP increased by 2.22% with the addition of the CA module and by another 1.36% with the addition of the CBAM module to the neck. The location of the attention mechanism module was adjusted multiple times to enhance the model’s ability to extract landslide features by increasing its focus on landslide objects in landslide detection. However, the model’s accuracy still requires improvement. We recommend including the lightweight Decoupled Head, which improves the mAP by 0.24% despite a slight increase in model complexity. Finally, it was found that landslide objects come in various shapes and sizes. The introduction of the SIoU loss function improved the model’s mAP by 0.19%. The experiments demonstrate that these improvements enhance the model’s ability to detect landslides, resulting in a final mAP of 92.28%. The mAP is crucial in landslide detection as it determines the model’s detection accuracy, while the FPS determines the actual detection speed. The model can offer a more efficient response in real-world scenarios where faster detection speeds are necessary.

5.2. Limitations and Future Research

This study proposes a high-precision detection model for loess landslide detection in complex environments. The contribution of various improvements to achieve high-precision landslide detection is discussed and compared with other models. However, there are still some shortcomings and areas for improvement. The relatively small number of publicly available landslide datasets makes it difficult to compare our constructed dataset with previous ones. Although our manually labeled dataset has been checked and validated by experts, this still produces unavoidable bias. Furthermore, our landslide dataset only has two categories, landslide and non-landslide, which limits the ability to tailor specific responses to different types of landslides. Multi-category landslide detection would allow for targeted local monitoring and management of landslide hazards.

6. Conclusions

In conclusion, our study presents a lightweight network model for landslide recognition in disaster protection, built upon the YOLOv5 framework, Coordinate Attention, C3CBAM, SIoU loss function of YOLOv6, and Decoupled Head Mini. The proposed model effectively identifies multi-scale and small-object landslide features, achieving a notable mean average precision (mAP) of 92.28%, showcasing a significant improvement of 4.01% compared to YOLOv5. This research contributes to the ongoing trend in developing network models for landslide object detection, emphasizing the importance of lightweight models that balance accuracy and computational efficiency.
Adding Coordinate Attention enhances the robustness of the YOLO model, improving feature extraction from remote sensing landslide images and subsequently enhancing detection accuracy. The fusion of the neck’s C3 module with CBAM further augments the model’s capability to identify landslide-specific attributes and distinguish them from background noise. The incorporation of a lightweight feature enhancement module and a feature extraction model addresses the challenge of maintaining accuracy while reducing model volume, making the enhanced landslide detection model well-suited for monitoring and managing landslides. While the Decoupled Head enhances object detection model accuracy, it comes at the expense of increased computational power. Striking a balance between accuracy and computational effort is crucial, with adjustments such as a 1 × 1 dimensionality reduction operation being typical before decoupling. Recognizing the unique angles and directional features of remote sensing images of landslides, traditional object detection models may fall short. The introduction of SIoU, considering the vector angle between the ground truth box and the prediction box, proves beneficial in reducing deviation and improving the recognition performance of landslide images in object detection. Looking forward, future research in landslide detection could explore additional challenges and advancements, building upon the insights gained from this study. The developed model holds promise for applications in disaster management, remote sensing, and related domains, contributing to the ongoing efforts to enhance our understanding and mitigation of landslide risks.

Author Contributions

Conceptualization, Q.J.; methodology, Q.J. and Z.Y.; software, Q.J. and Z.Y.; validation, Q.J. and F.X.; resources, Q.J. and Y.W.; data curation, Q.J., F.X. and Z.Y.; writing—original draft preparation, Q.J. and F.X.; writing—review and editing, Q.J. and F.X.; visualization, Q.J. and Y.W.; supervision, Y.L.; project administration, Y.L.; funding acquisition, Y.L. All authors have read and agreed to the published version of the manuscript.

Funding

This research was funded by the Remote Sensing Identification and Monitoring Project of Geological Hazards in Sichuan Province (grant number 510201202076888); National Geological Disaster Identification Project of Ministry of Natural Resources (grant number 073320180876/2).

Institutional Review Board Statement

Not applicable.

Informed Consent Statement

Not applicable.

Data Availability Statement

The input dataset consists of 11,010 images and can be found at https://doi.org/10.5281/zenodo.10053430 (30 October 2023). All models are Python-based and publicly available, and the output is available at https://zenodo.org/records/10054497 (30 October 2023). The original code used in this study relies on the work of Ultralytics, available at https://github.com/ultralytics/yolov5 (12 October 2021). Some of the relevant files that need to be replaced exist and can be found at https://zenodo.org/records/10054593 (30 October 2023).

Acknowledgments

The authors are grateful for helpful comments from many researchers and colleagues.

Conflicts of Interest

No potential conflicts of interest were reported by the authors.

References

  1. Hölbling, D.; Füreder, P.; Antolini, F.; Cigna, F.; Casagli, N.; Lang, S. A Semi-Automated Object-Based Approach for Landslide Detection Validated by Persistent Scatterer Interferometry Measures and Landslide Inventories. Remote Sens. 2012, 4, 1310–1336. [Google Scholar] [CrossRef]
  2. Ansari, A.; Zaray, A.H.; Rao, K.S.; Jain, A.K.; Hashmat, P.A.; Ikram, M.K.; Wahidi, A.W. Reconnaissance surveys after June 2022 Khost earthquake in Afghanistan: Implication towards seismic vulnerability assessment for future design. Innov. Infrastruct. Solut. 2023, 8, 108. [Google Scholar] [CrossRef]
  3. Thoithi, W.; Blamey, R.C.; Reason, C.J.C. April 2022 Floods over East Coast South Africa: Interactions between a Mesoscale Convective System and a Coastal Meso-Low. Atmosphere 2023, 14, 78. [Google Scholar] [CrossRef]
  4. Hungr, O.; Leroueil, S.; Picarelli, L. The Varnes classification of landslide types, an update. Landslides 2014, 11, 167–194. [Google Scholar] [CrossRef]
  5. Sassa, K.; Fukuoka, H.; Wang, F.; Wang, G. Progress in Landslide Science; Springer Science & Business Media: Berlin/Heidelberg, Germany, 2007; Volume 7. [Google Scholar] [CrossRef]
  6. Li, Z.; Shi, W.; Lu, P.; Yan, L.; Wang, Q.; Miao, Z. Landslide mapping from aerial photographs using change detection-based Markov random field. Remote Sens. Environ. 2016, 187, 76–90. [Google Scholar] [CrossRef]
  7. Chen, W.; Li, X.; Wang, Y.; Chen, G.; Liu, S. Forested landslide detection using LiDAR data and the random forest algorithm: A case study of the Three Gorges, China. Remote Sens. Environ. 2014, 152, 291–301. [Google Scholar] [CrossRef]
  8. Gorsevski, P.V.; Brown, M.K.; Panter, K.; Onasch, C.M.; Simic, A.; Snyder, J. Landslide detection and susceptibility mapping using LiDAR and an artificial neural network approach: A case study in the Cuyahoga Valley National Park, Ohio. Landslides 2016, 13, 467–484. [Google Scholar] [CrossRef]
  9. Redmon, J.; Divvala, S.; Girshick, R.; Farhadi, A. You Only Look Once: Unified, Real-Time Object Detection. arXiv 2015, arXiv:1506.02640. preprint. [Google Scholar] [CrossRef]
  10. Liu, W.; Anguelov, D.; Erhan, D.; Szegedy, C.; Reed, S.; Fu, C.-Y.; Berg, A.C. SSD: Single Shot MultiBox Detector. arXiv 2015, arXiv:1512.02325. preprint. [Google Scholar] [CrossRef]
  11. Ren, S.; He, K.; Girshick, R.; Sun, J. Faster R-CNN: Towards Real-Time Object Detection with Region Proposal Networks. arXiv 2015, arXiv:2016.2577031. preprint. [Google Scholar] [CrossRef]
  12. Girshick, R. Fast R-CNN. arXiv 2015, arXiv:1504.08083. preprint. [Google Scholar] [CrossRef]
  13. Zhao, Q.; Liu, B.; Lyu, S.; Wang, C.; Zhang, H. TPH-YOLOv5++: Boosting Object Detection on Drone-Captured Scenarios with Cross-Layer Asymmetric Transformer. Remote Sens. 2023, 15, 1687. [Google Scholar] [CrossRef]
  14. Cheng, L.; Li, J.; Duan, P.; Wang, M. A small attentional YOLO model for landslide detection from satellite remote sensing images. Landslides 2021, 18, 2751–2765. [Google Scholar] [CrossRef]
  15. Niu, C.; Ma, K.; Shen, X.; Wang, X.; Xie, X.; Tan, L.; Xue, Y. Attention-Enhanced Region Proposal Networks for Multi-Scale Landslide and Mudslide Detection from Optical Remote Sensing Images. Land 2023, 12, 313. [Google Scholar] [CrossRef]
  16. Ju, Y.; Xu, Q.; Jin, S.; Li, W.; Su, Y.; Dong, X.; Guo, Q. Loess Landslide Detection Using Object Detection Algorithms in Northwest China. Remote Sens. 2022, 14, 1182. [Google Scholar] [CrossRef]
  17. Yu, Z.; Chang, R.; Chen, Z. Automatic Detection Method for Loess Landslides Based on GEE and an Improved YOLOX Algorithm. Remote Sens. 2022, 14, 4599. [Google Scholar] [CrossRef]
  18. Han, Z.; Fang, Z.; Li, Y.; Fu, B. A novel Dynahead-Yolo neural network for the detection of landslides with variable proportions using remote sensing images. Front. Earth Sci. 2023, 10, 1077153. [Google Scholar] [CrossRef]
  19. Zhuang, J.; Peng, J.; Wang, G.; Javed, I.; Wang, Y.; Li, W. Distribution and characteristics of landslide in Loess Plateau: A case study in Shaanxi province. Eng. Geol. 2018, 236, 89–96. [Google Scholar] [CrossRef]
  20. Wang, C.-Y.; Liao, H.-Y.M.; Yeh, I.-H.; Wu, Y.-H.; Chen, P.-Y.; Hsieh, J.-W. CSPNet: A New Backbone that can Enhance Learning Capability of CNN. arXiv 2019, arXiv:1911.11929. preprint. [Google Scholar] [CrossRef]
  21. Neubeck, A.; Gool, L.V. Efficient Non-Maximum Suppression. In Proceedings of the 18th International Conference on Pattern Recognition (ICPR’06), Hong Kong, China, 20–24 August 2006; pp. 850–855. [Google Scholar]
  22. Hou, Q.; Zhou, D.; Feng, J. Coordinate Attention for Efficient Mobile Network Design. arXiv 2021, arXiv:2103.02907. preprint. [Google Scholar] [CrossRef]
  23. Woo, S.; Park, J.; Lee, J.-Y.; Kweon, I.S. CBAM: Convolutional Block Attention Module. arXiv 2018, arXiv:1807.06521. preprint. [Google Scholar] [CrossRef]
  24. Ge, Z.; Liu, S.; Wang, F.; Li, Z.; Sun, J. YOLOX: Exceeding YOLO Series in 2021. arXiv 2021, arXiv:2107.08430. preprint. [Google Scholar] [CrossRef]
  25. Gevorgyan, Z. SIoU Loss: More Powerful Learning for Bounding Box Regression. arXiv 2022, arXiv:2205.12740. preprint. [Google Scholar]
  26. Rezatofighi, H.; Tsoi, N.; Gwak, J.; Sadeghian, A.; Reid, I.; Savarese, S. Generalized Intersection over Union: A Metric and A Loss for Bounding Box Regression. arXiv 2019, arXiv:1902.09630. preprint. [Google Scholar] [CrossRef]
  27. Yu, J.; Jiang, Y.; Wang, Z.; Cao, Z.; Huang, T. UnitBox: An Advanced Object Detection Network. arXiv 2016, arXiv:1608.01471. preprint. [Google Scholar] [CrossRef]
  28. Zheng, Z.; Wang, P.; Liu, W.; Li, J.; Ye, R.; Ren, D. Distance-IoU Loss: Faster and Better Learning for Bounding Box Regression. arXiv 2019, arXiv:34i07.6999. preprint. [Google Scholar] [CrossRef]
Figure 1. The study area is located in southern Gansu and eastern Qinghai, China. a, b, and c are the areas where the remote sensing of landslides was mainly acquired in this study.
Sustainability 16 01238 g001
Figure 2. The process of making a loess landslide dataset.
Sustainability 16 01238 g002
Figure 3. The structure of YOLOv5.
Sustainability 16 01238 g003
Figure 4. Improved model architecture for loess landslide detection.
Sustainability 16 01238 g004
Figure 5. The structure of Coordinate Attention.
Sustainability 16 01238 g005
Figure 6. The feature map of the two layers before and after the introduction of the Coordinate Attention module. (a) is the original remote sensing image; (b) is the feature map of the previous layer of the Coordinate Attention module; (c) is the feature map of the latter layer of the Coordinate Attention module.
Sustainability 16 01238 g006
Figure 7. Channel attention module and spatial attention module.
Sustainability 16 01238 g007
Figure 8. C3 combined with the structure of CBAM.
Sustainability 16 01238 g008
Figure 9. Comparison of detection effects before and after the introduction of the CBAM structure. (a) is the detection effect without applying CBAM, and; (b) is the detection effect after applying CBAM.
Sustainability 16 01238 g009
Figure 10. Structure of Decoupled Head.
Sustainability 16 01238 g010
Figure 11. Structure of the Decoupled Head Mini.
Sustainability 16 01238 g011
Figure 12. Calculation of the angle loss value.
Sustainability 16 01238 g012
Figure 13. Comparison of detection results using both CIoU and SIoU loss functions, where (a) is YOLOv5 detection effect, and (b) is our landslide detection model detection effect.
Sustainability 16 01238 g013
Figure 14. Partial dataset of landslides.
Sustainability 16 01238 g014
Figure 15. Variation curves of mAP and loss on the validation set during the training of YOLOv5 and our landslide detection model. (a) mAP curve; (b) loss curve.
Sustainability 16 01238 g015
Figure 16. Tiny landslide object detection effect. (ac) are the detection effect of different images respectively.
Sustainability 16 01238 g016
Figure 17. Large landslide object detection effect. (ac) are the detection effect of different images respectively.
Sustainability 16 01238 g017
Figure 18. Multiscale landslide object detection effect. (ac) are the detection effect of different images respectively.
Sustainability 16 01238 g018
Table 1. Precision, recall, mAP, and FPS indicators of different object detection models.
ModelPrecision (%)Recall (%)mAP (%)FPS
YOLOX91.5878.4086.0870.6
Fast R-CNN90.1561.1377.9228.23
SSD89.6179.2682.3876.2
Our landslide detection model96.4586.7992.2881.2
Table 2. The ablation study of the importance of each proposed component.
ModelCAC3CBAMDecoupled Head MiniSIoUmAP (%)
Baseline model(YOLOv5)----88.27
+CA---90.49
+CA+C3CBAM--91.85
+CA+C3CBAM+Decoupled Head Mini-92.09
Our landslide detection model92.28
√ means that the corresponding component is applied in the model.
Disclaimer/Publisher’s Note: The statements, opinions and data contained in all publications are solely those of the individual author(s) and contributor(s) and not of MDPI and/or the editor(s). MDPI and/or the editor(s) disclaim responsibility for any injury to people or property resulting from any ideas, methods, instructions or products referred to in the content.

