Abstract
This study utilizes multilevel ordinal logistic regression (M-OLR), an approach that accounts for spatial heterogeneity, to assess the dynamics of crash severity in Virginia, USA, over the years 2018 to 2023. This period was notably influenced by the COVID-19 pandemic and its associated stay-at-home orders, which significantly altered traffic behaviors and crash severity patterns. This study aims to evaluate the pandemic’s impact on crash severity and examine the consequent changes in driver behaviors. Despite a reduction in total crashes, a worrying increase in the proportion of severe injuries is observed, suggesting that less congested roads during the pandemic led to riskier driving behaviors, notably increased speed violations. This research also highlights heightened risks for vulnerable road users such as pedestrians, cyclists, and motorcyclists, with changes in transportation habits during the pandemic leading to more severe crashes involving these groups. Additionally, this study emphasizes the consistent influence of environmental and roadway features, like weather conditions and traffic signals, in determining crash outcomes. These findings offer vital insights for road safety policymakers and urban planners, indicating the necessity of adaptive road safety strategies in response to changing societal norms and behaviors. The research underscores the critical role of individual behaviors and mental states in traffic safety management and advocates for holistic approaches to ensure road safety in a rapidly evolving post-pandemic landscape.
1. Introduction
1.1. Background
Throughout history, global pandemics have emerged as pivotal events, compelling societies to navigate unprecedented challenges and re-evaluate established norms. The profound societal and health impacts of past pandemics, such as the Spanish flu of 1918, underscore the transformative power of such crises [1,2]. As the 21st century has progressed, the concept of ‘global connectivity’ has gained prominence, defined as the increased interlinking of countries and cultures through advancements in travel and communication [3]. This connectivity has undeniably brought the world closer. However, it has also enhanced the capability for diseases to spread rapidly and extensively [3,4]. This dual nature of global connectivity, serving as a catalyst for both unity and the potential for swift disease transmission, illustrates the complex dynamics of our modern interconnected world.
Transportation, a cornerstone of modern interconnected societies, has undergone significant evolution over the years [5]. The expansion of road networks coupled with increased vehicle ownership has not only facilitated enhanced mobility but also reshaped urban infrastructures, economies, and societal behaviors [5,6,7]. However, these advancements have also ushered in challenges. The rising frequency and severity of road traffic crashes have become major concerns [8,9,10]. Despite advancements in safety technologies and regulatory measures, these crashes remain a pressing issue, affecting health outcomes and having broader socio-economic implications [8,9,11,12,13]. The World Health Organization, among other institutions, has consistently highlighted road traffic crashes as a global health risk [12].
Against this backdrop, the world was confronted with the emergence of the COVID-19 pandemic in late 2019 [14]. Originating in Wuhan, China, this health concern rapidly escalated on a global scale. By March 2020, the World Health Organization officially declared it a pandemic [15]. As of 4 October 2023, global statistics reveal an alarming 771.2 million cases and a death toll nearing 6.96 million [16]. In response, nations around the world implemented strict containment strategies, such as lockdowns and travel bans, aiming to curb the virus’s spread. These containment measures had a profound and immediate effect on transportation systems worldwide.
Lockdowns led to a significant reduction in daily commutes, non-essential travel, and overall traffic volume [17]. Travel bans halted international and domestic flights, reducing air travel to unprecedented lows. The cessation of non-essential services and the shift to remote working models contributed to a drastic decline in vehicular movement on the roads. These changes, while essential for public health, resulted in a dramatic transformation of transportation dynamics, leading to reduced traffic congestion and altered traffic patterns. Initial data suggested potential improvements in road safety due to decreased vehicular movement [18]. However, subsequent findings revealed a more complex scenario, as these changes in transportation also brought about unforeseen challenges and safety concerns. This necessitates a deeper understanding of the pandemic’s multifaceted effects on transportation safety, highlighting how these dramatic shifts in movement patterns have reshaped road use and safety considerations.
1.2. Impacts of the COVID-19 Pandemic on Transportation Safety Dynamics
During the COVID-19 pandemic, transportation and road safety emerged as focal points of active research [18,19,20,21,22,23,24,25,26,27]. The profound implications of the pandemic on global health and socio-economic landscapes have been extensively recognized [28,29]. As nations contended with the immediate health repercussions, an array of secondary effects began to unfold across diverse societal sectors. Specifically, transportation and road safety drew substantial academic and policy attention, underscoring the multifaceted challenges introduced by this unprecedented global event.
Safety experts continuously strive to understand the impact of various changes on established systems, which could be due to economic fluctuations [7,30], amendments in traffic safety laws [31], or modifications in service measures [32]. For instance, Behnood and Mannering conducted a study to evaluate the effects of the global economic recession on the severity of pedestrian injuries [30]. This exploration is part of a broader effort to assess how significant changes in societal and economic conditions can influence safety parameters [7].
Several early studies attempted to evaluate the immediate repercussions of the pandemic on road safety [18,25,26]. Vingilis et al. postulated that, given the decline in vehicular activity during lockdowns, there would be an evident reduction in crashes, injuries, and deaths [26]. This initial hypothesis was rooted in the simple premise that fewer vehicles on the roads would naturally lead to fewer crashes [18,26,33]. Concurrently, the National Highway Traffic Safety Administration (NHTSA) conducted a nationwide study in 2020 to assess the traffic safety environment during the pandemic’s early months [18]. Their findings, based on data from emergency medical services and hospital trauma centers, affirmed the prediction of reduced vehicular movement, substantiated by a sharp decline in vehicle miles traveled (VMT) [18].
However, the reduction in traffic and crashes did not paint the entire picture. Both Vingilis et al. and the NHTSA pointed to an increase in certain risk-associated behaviors on the roads, such as speeding, drug and alcohol consumption, and reduced seat belt use [18,26]. Qureshi et al., in their study focused on Missouri, U.S., found that while traffic crashes resulting in minor or no injuries significantly declined during the lockdown, there was not a corresponding reduction in crashes leading to severe or fatal injuries [25]. This counterintuitive trend, observed even in other regions such as Connecticut [22] and Maharashtra, India [20], highlighted a concerning aspect: the severity of crashes appeared to be on the rise.
Building on these observations, Islam et al. investigated road safety trends throughout 2020 on a Florida freeway [24]. While their findings mirrored the NHTSA’s observation of reduced traffic volume, they also noted an increase in the severity of crashes when compared to previous years. Additionally, while drug-related crashes saw a staggering rise, alcohol-related crashes showed a decline.
Other researchers sought to delve deeper into the underlying factors influencing these trends [19,21]. Dong et al. (2022) conducted a multigroup structural equation modeling (SEM) that highlighted an increase in both aggressive and inattentive driving behaviors during the pandemic, pointing to factors like speeding, alcohol consumption, and distractions as significant contributors to the heightened crash severity [21]. These findings align with those presented by Adanu et al. (2022), further corroborating the observed patterns of riskier driving behaviors during the pandemic period [19]. Surveys of drivers in the U.S. and Canada yielded mixed insights, with a notable proportion of respondents admitting to riskier driving behaviors during the pandemic, while others claimed to have experienced no change in their habits [34].
Despite the depth and breadth of these investigations, a comprehensive synthesis of the multi-dimensional impacts of the pandemic on road safety is still evolving. Most studies have predominantly focused on the early stages of the pandemic, which, while insightful, might not encapsulate the pandemic’s evolving impact. The dynamic interplay between societal behaviors, policy interventions, and global events demands further exploration. Therein lies the need for longitudinal studies that provide a broader perspective on the pandemic’s influence on road safety over time.
1.3. Research Objectives and Contributions
The existing body of literature on road safety during the COVID-19 pandemic, while informative, contains significant gaps. Many studies are confined to the early stages of the pandemic, often missing the crucial subsequent shifts in road safety dynamics. A comprehensive approach that encompasses periods before, during, and after the pandemic’s stay-at-home orders is vital. This broader perspective will not only provide insights into the immediate effects of the pandemic but also deepen our understanding of its long-term implications for transportation safety. Therefore, conducting a thorough study that addresses these research gaps is essential.
In this context, road safety has emerged as a pivotal area of inquiry in the aftermath of the COVID-19 pandemic. Despite numerous studies having explored the immediate impacts of pandemic-induced disruptions, a substantial gap remains in comprehending how road safety dynamics evolved throughout different stages of the pandemic. This study aims to fill this gap by providing an exhaustive examination of the shifts in crash severity across these varying phases.
Research Objectives:
- Temporal Analysis and Impact Assessment: Investigate the factors influencing crash severity across three distinct phases: pre-pandemic, during the stay-at-home order as a response to the pandemic, and post-pandemic. Quantify the marginal impact of these factors to discern changing dynamics and priorities in road safety.
- Behavioral Assessment: Examine the driving behaviors during these phases to understand the effects of external disruptions, such as the pandemic and associated stay-at-home orders, on driving tendencies and, subsequently, crash severity.
- Policy Implications: Derive actionable insights that can inform and shape future road safety measures, especially in the context of global disruptions. This includes evaluating the resilience and efficacy of existing safety measures during such unprecedented events.
The research contributions of this effort can be summarized as follows:
- In-depth Temporal Insights: By undertaking a comprehensive analysis across distinct phases of the pandemic, this research furnishes stakeholders with a nuanced understanding of the evolving road safety challenges. It not only maps the shifting dynamics but also pinpoints specific factors that have seen increased prominence or attenuation during these periods.
- Behavioral Revelations: Through a dedicated assessment of driving behaviors, this study reveals the intricate interplay between external events (like a pandemic and associated restrictions) and individual driving habits. Such revelations can help in crafting interventions that resonate more effectively with the driving public, thereby promoting safer road behaviors.
- Strategic Recommendations: The findings from this research are poised to have significant policy implications. The insights provided can guide decision-makers in tailoring road safety strategies that are both effective in standard scenarios and resilient to global disruptions. By evaluating the robustness of current measures, this research also paves the way for more adaptive and responsive safety protocols.
In essence, this research endeavors to enrich the understanding of road safety dynamics amidst global disruptions like the COVID-19 pandemic. It aspires to not only shed light on the multifaceted impacts but also to proffer insights that can influence and enhance future road safety measures, ensuring adaptability and efficacy in dynamic contexts.
1.4. Structure of the Paper
The remainder of the paper will be structured as follows: it begins with the “Methodology” section, which offers a detailed outline of the comprehensive research framework used in this study. This section includes a thorough description of the dataset and elaborates on the multilevel ordinal logistic regression (M-OLR) method employed for analysis.
Following the “Methodology” section, the “Results” and “Discussion” sections are dedicated to presenting the findings of the study. These sections delve into the impact of various factors affecting road safety, with particular emphasis on the influence of the COVID-19 pandemic. They provide an in-depth discussion of how these factors contributed to changes in crash severity and driver behaviors during the study period.
Subsequently, the “Operational and Management Implications” section discusses the practical implications of this study’s findings. It focuses on how these insights can be utilized to inform and enhance traffic safety management and policy making, especially in the context of evolving road safety challenges in the post-pandemic era.
This paper then concludes with the “Conclusions” section, summarizing the key insights and contributions of the research. This section highlights the significant shifts in crash severity and driver behaviors observed during the study period, underscoring this study’s contributions to the field of road safety research.
Finally, this paper acknowledges its limitations and suggests future research directions in the “Study Limitations and Future Directions” section. This part emphasizes the need for a broader geographical scope in future studies and suggests exploring further into the trends and patterns of road safety, particularly in the wake of the COVID-19 pandemic. This structured approach ensures a comprehensive and logical flow of information, guiding the reader through the various aspects of the study.
2. Methodology
2.1. Data Description
The crash dataset used for this research was sourced from the Virginia Department of Transportation (VDOT), encompassing crash occurrences within the State of Virginia, USA. This study primarily aims to discern the impact of the stay-at-home orders on crash severity. It is noteworthy that the Governor of Virginia promulgated a “Stay at Home” executive order on 30 March 2020, which remained in effect until 10 June 2020 [35]. In light of this, the crash datasets were divided into distinct periods for analysis. One dataset corresponded to the duration from 30 March 2020 to 10 June 2020. Two subsequent datasets represented the analogous period in the pre-COVID-19 years of 2018 and 2019. Lastly, three datasets represented the post-COVID-19 lockdown phases in 2021, 2022, and 2023.
In this dataset, crash severity was defined using the KABCO scale. This scale can be broken down into five distinct levels: fatal, incapacitating, non-incapacitating, potential injuries, and property damage without injury. This classification was determined based on the most severe injury sustained by any individual involved in the crash. Crash outcomes were further grouped into three categories: severe injury (covering fatal and incapacitating injuries), minor injury (including non-incapacitating and potential injuries), and PDO. The distribution of crash severity across different years is detailed in Table 1, providing a clear breakdown of crash severity trends from 2018 to 2023.
Table 1.
Distribution of crash severity categories across different years in Virginia, USA.
This comprehensive dataset encompasses data from 23 distinct planning districts within Virginia. Several variables have been evaluated, with their descriptive statistics elucidated in Table 2. These variables encompass aspects like crash characteristics (type of crash, hit and run), driver behavior and risk factors (alcohol consumption, seat belt usage, distractions, drowsiness, drug use, and speed violation), driver demographic characteristics (senior and young drivers), vulnerable road users (involvement of motorcyclists, bicyclists, and pedestrians in crashes), roadway characteristics (presence of traffic signals, roadway alignment, mainline, presence of a work zone, urban vs. rural setting, and posted speed), temporal characteristics (weekday vs. weekend occurrences), weather conditions, and external factors (involvement of animals).
Table 2.
Descriptive statistics of variables included in the crash severity models.
Crash Trends and the Impact of COVID-19
The analysis of crash data from 2018 to 2023 illustrates significant fluctuations in the total number of crashes, as shown in Figure 1, with a marked impact observed following the onset of the COVID-19 pandemic. Prior to the pandemic, the total number of crashes remained relatively stable, with 25,264 in 2018 and 25,401 in 2019. However, in 2020, coinciding with the widespread implementation of stay-at-home orders and reduced travel activities, there was a notable decrease in total crashes, dropping to 15,205. This reduction reflects the immediate impact of stay-at-home orders on road traffic volumes. Although there was a gradual recovery in the subsequent years, the total number of crashes did not return to the pre-pandemic levels, indicating lasting changes in travel behavior and road use.
Figure 1.
Trends of total crashes and severe crash rates by year.
Alongside the total crash numbers, the rate of severe injuries within these crashes underwent a notable change post-pandemic. While severe injuries accounted for approximately 5.5% of crashes in 2018 and 2019, this figure rose sharply to 6.88% in 2020. Following 2020, the rate of severe injuries remained elevated compared to pre-pandemic levels, with 6.60% in 2021, 6.07% in 2022, and 5.92% in 2023. These figures suggest the lasting impact of the pandemic on road safety, with a higher rate of severe injuries persisting even as overall crash numbers began to recover.
2.2. Crash Severity Modeling
2.2.1. Ordinal Logistic Regression
Crash severity data are inherently ordinal. Typically, these data can be categorized into levels such as “no injury”, “minor injury”, and “severe injury”. Ordinal logistic regression (OLR) was chosen for this study due to its suitability for modeling ordinal outcome variables [9,24]. The basic idea behind OLR is to model the cumulative probabilities of observing an outcome up to and including a particular category. The model estimates the odds that an outcome falls into a particular category or below, compared to all higher categories.
The general form of the ordinal logistic regression model can be represented as:
In the model specification, represents the cumulative probability of the response falling into category or any category bellow it. The term serves as the threshold specific to category . The predictor variables in the model are denoted as , and their corresponding coefficients are represented by .
2.2.2. Multilevel Ordinal Logistic Regression
Hierarchical or multilevel data are characterized by observations at a lower level being nested within one or more higher levels. This structure is commonplace in various fields. For instance, medical research may nest patients within hospitals, political studies might nest voters within districts, and education often nests students within schools. In many traffic safety studies, crash data are clustered or grouped by nature. For instance, crashes might occur within specific intersections, along specific road segments, or within certain jurisdictions [9,36]. This hierarchical structure can introduce dependencies among the observations within the same group, violating the assumption of observations’ independence in traditional regression models [9,36]
To account for this clustered structure, a multilevel ordinal logistic regression (M-OLR) with a random intercept was employed [9]. This approach extends traditional ordinal logistic regression by adding random effects to capture the variability between clusters, providing more accurate results [9].
The general form of the MOLR with a random intercept can be represented as:
In the multilevel model context, denotes the outcome for the observation within the cluster. The term signifies the cumulative probability that this outcome falls into category or a lower category for the observation in the cluster. The model incorporates as the threshold for category , while is introduced as the random intercept corresponding to the cluster. The predictor variables in the model, specific to each observation and cluster, are denoted as , while their respective coefficients are denoted as .
2.3. Average Marginal Effects
Average marginal effects (AMEs) provide an intuitive way to understand the change in the probability of an outcome due to a unit change in a predictor variable, averaged over all observations. Unlike specific marginal effects which might be calculated at specific values of the predictors, AMEs provide an average effect that is more generalizable to the entire dataset.
For any given predictor variable, the marginal effect for an individual observation is calculated as:
In the described formula, represents a specific predictor of interest, while signifies all other predictors, set to their observed values for the observation. The terms and correspond to the starting and ending values of the predictor for the observation. Notably, for binary predictor variables, the conventional approach is to designate the observed value as the starting value and its opposite as the ending value.
After computing the marginal effect for every observation in the dataset, the average marginal effect is derived by averaging these individual effects:
The advantage of the AME lies in its interpretability. The AME offers insights similar to the coefficient in a linear regression model, allowing researchers to explain the effect of a predictor “on average” across the entire sample, providing a more holistic understanding of the predictor’s influence.
2.4. Temporal Transferability Test
This study focused on understanding the changing dynamics of factors affecting crash severity, influenced by the COVID-19 pandemic, using data from 2018 to 2023. Given this temporal scope, it was crucial to test whether the model’s parameters remained relevant and consistent throughout, especially considering the unprecedented disruptions during this period [19,36]. Additionally, it was essential to determine whether distinct models were required for different timeframes or if a singular, holistic model using the entire dataset sufficed.
To make this determination, a likelihood ratio test was utilized. The test’s formulation is presented as:
In this equation, denotes the log-likelihood at the model’s convergence using the complete dataset from 2018 to 2023. Conversely, each represents the log-likelihood at convergence for specific segmented time intervals, such as pre-pandemic, during the pandemic, and post-pandemic phases. In the formulation, stands for the total number of distinct data subsets considered.
The resultant statistic follows a chi-squared distribution. The degrees of freedom are computed according to the difference between the total parameters from all segmented models and the number of parameters from the comprehensive model.
A crucial aspect of these tests was the consistent usage of the same variables across all models, ensuring uniformity in the assessment [19,36]. The value obtained from the statistic guided the decision on whether to adopt separate models for distinct time periods or employ a comprehensive model spanning the entire study duration.
3. Results
3.1. Model Comparison
In this study, crash severity levels were analyzed using two distinct models: the ordinal logistic regression (OLR) model and the multilevel ordinal logistic regression (M-OLR) model. This approach was chosen in response to the recognized influence of spatial heterogeneity on injury severity in traffic crashes [9]. The M-OLR model, in particular, was implemented to effectively account for cluster-specific effects that are inherent in such data.
The comparative analysis of these models, as shown in Table 3, reveals distinct insights. The likelihood ratio statistics for the OLR and M-OLR models are 19,236.52 and 19,217.14, respectively, indicating that both models are statistically significant at a 99% confidence interval. This suggests that each model has merit in explaining the variations in crash severity.
Table 3.
Model comparison statistics.
However, a more detailed examination favors the M-OLR model. The likelihood ratio test comparing the OLR and M-OLR models shows a significant difference, with a value of 1681.46 (df = 1) and a p-value of <0.001. This indicates a statistically superior fit of the M-OLR model over the OLR model. Further supporting this conclusion is the comparison of the Akaike information criterion (AIC) and the Bayesian information criterion (BIC). The M-OLR model demonstrates a lower AIC (200,066.8) and BIC (200,332.4) compared to the OLR model’s AIC (201,746.3) and BIC (202,002).
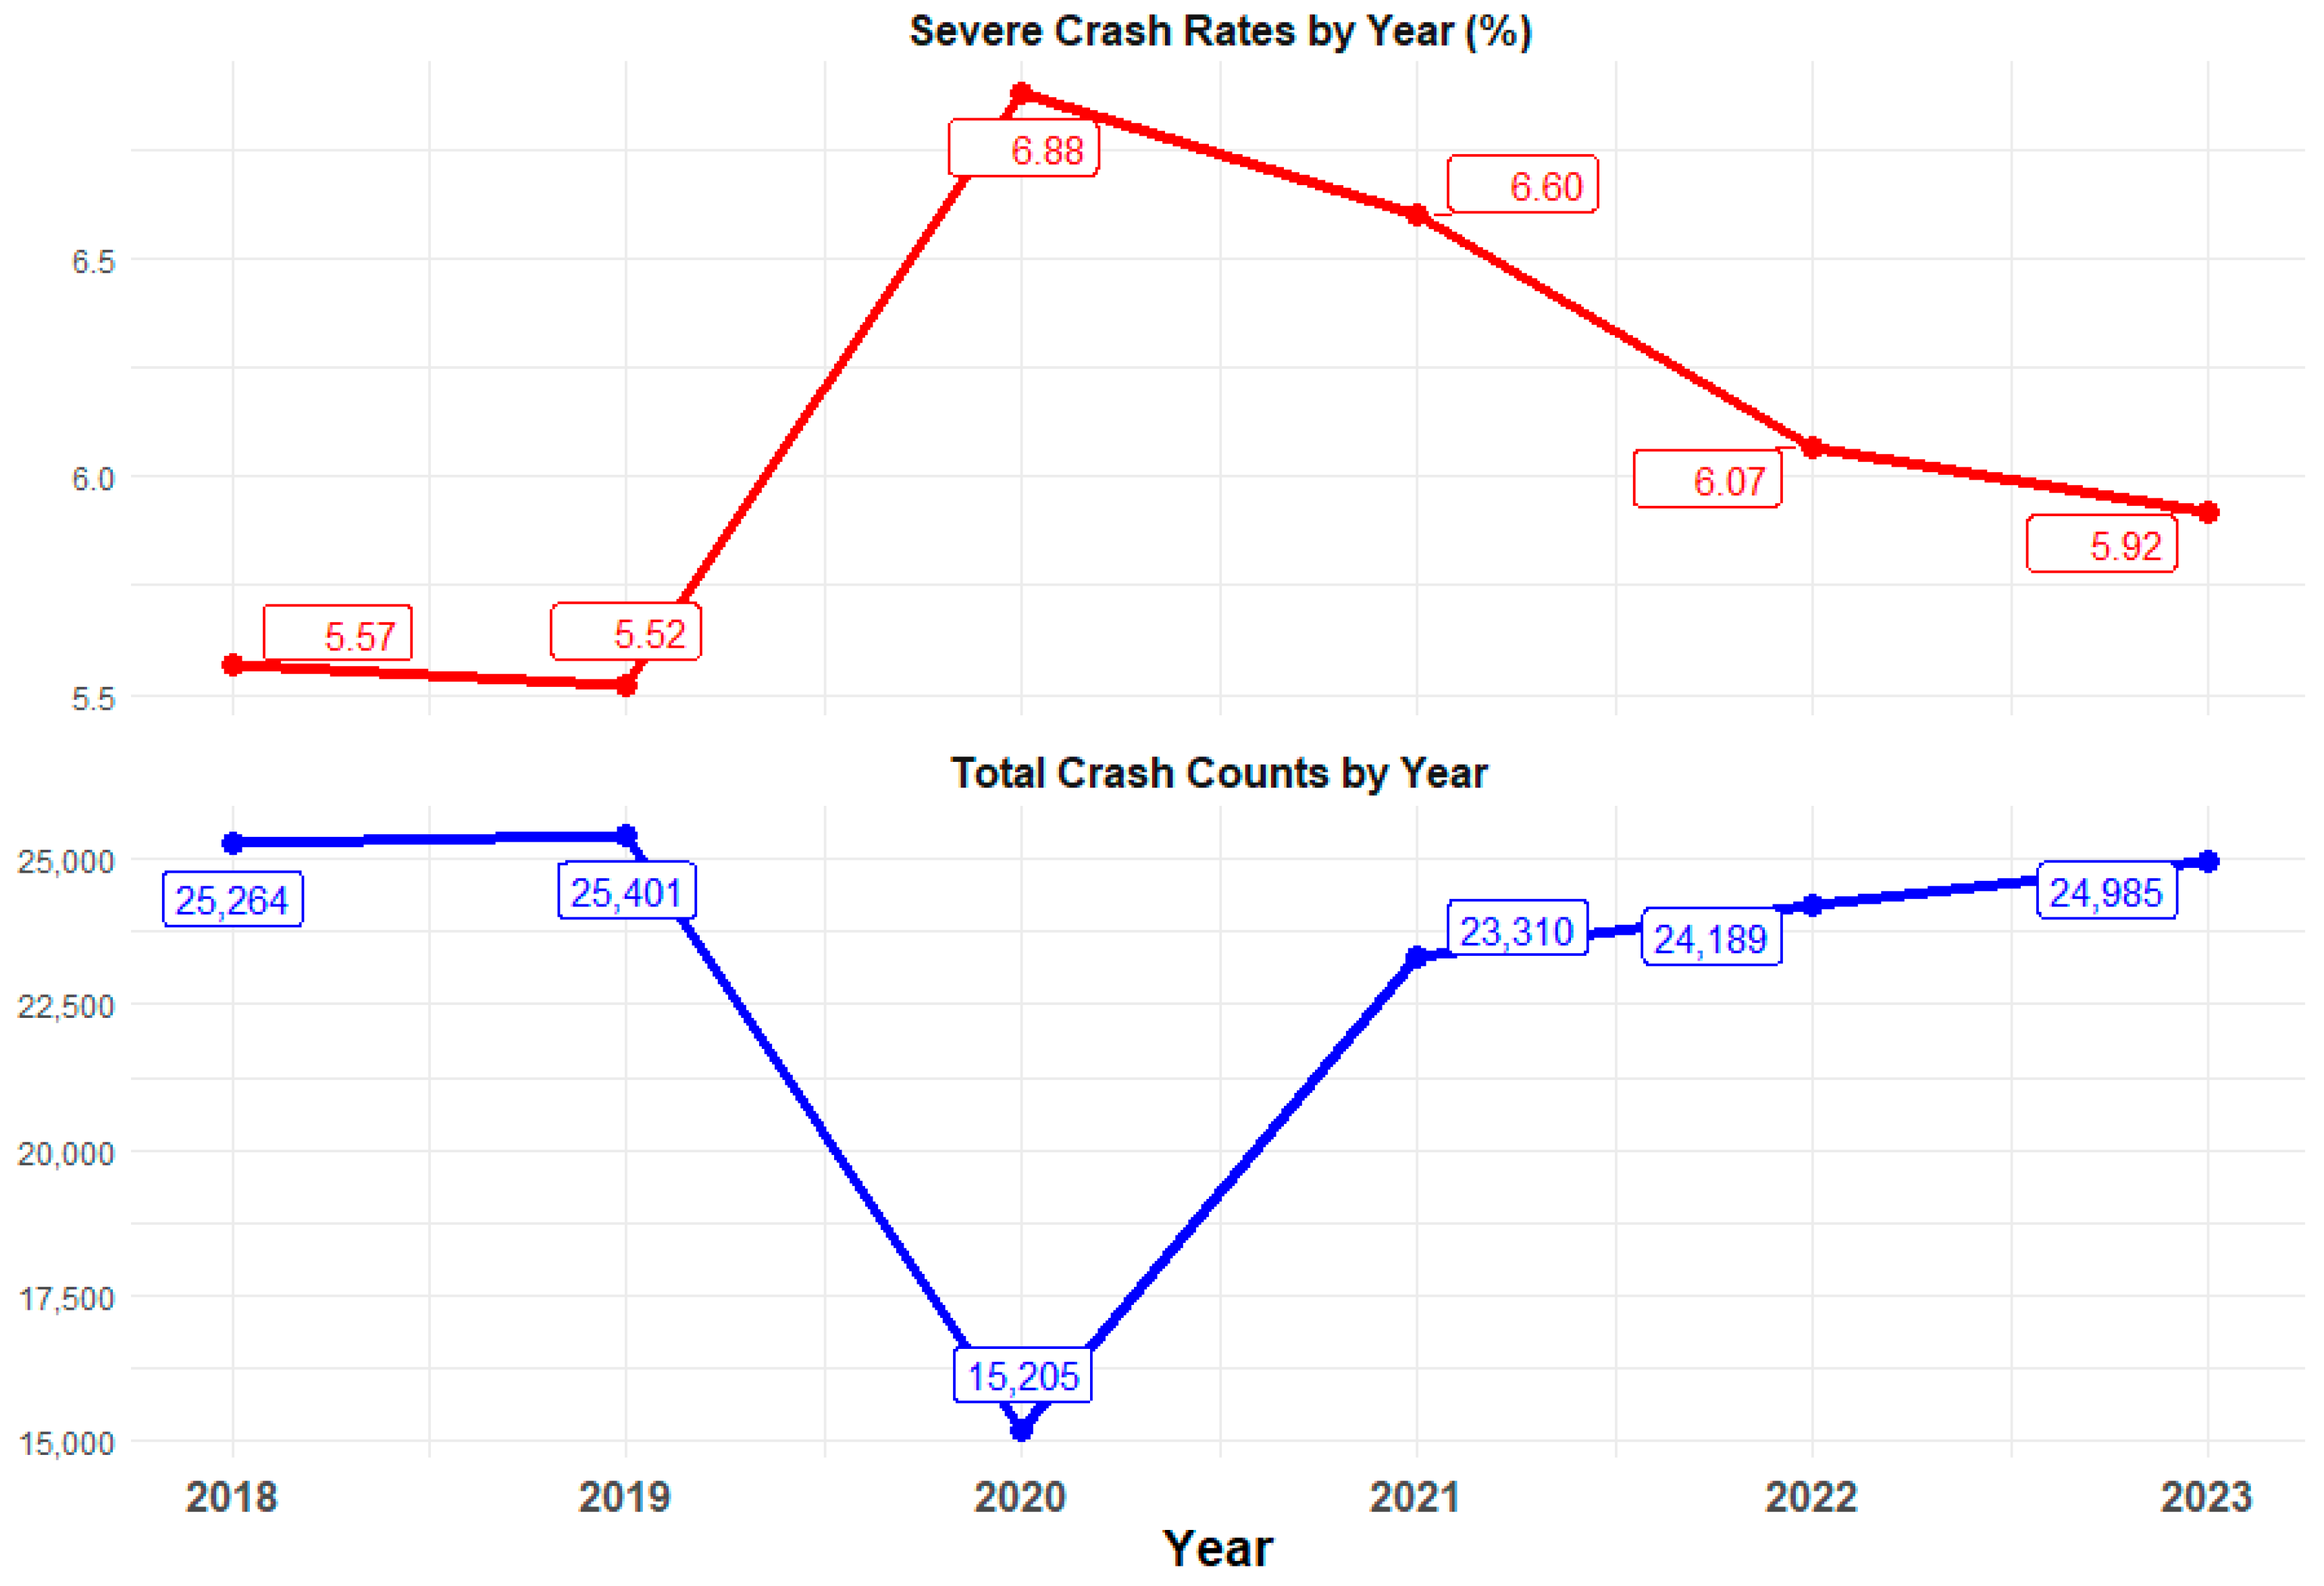
These metrics highlight the efficiency of the multilevel ordinal logistic regression (M-OLR) model in handling hierarchical crash data and variability. This capability is crucial for the study, aligning with the objective to understand the evolving nature of crash severity during the COVID-19 pandemic. During this period, there were diverse changes in driving behavior and road use, necessitating a model capable of capturing spatial heterogeneity. The M-OLR model, with its superior statistical fit and lower information criteria values, is established as the most robust choice for analysis. It adeptly captures nuanced shifts in crash severity patterns during the pandemic, rendering it the most appropriate and insightful tool for meeting the specific objectives of this research.
3.2. Temporal Transferability Results
In examining the impact of the COVID-19 pandemic on crash severity, the study conducted a temporal transferability test to evaluate whether the model’s parameters remained consistent throughout this period. The objective was to ascertain whether separate models were warranted for different phases of the pandemic or if one comprehensive model could suffice for the entire duration.
The results of the likelihood ratio test were significant. The test yielded a chi-squared statistic of 310.84 with 135 degrees of freedom and a p-value less than 0.001. This significant outcome indicates that the factors influencing crash severity did indeed vary over the different phases of the study period.
These findings suggest that a single model would not be suitable for accurately capturing the nuances of crash severity throughout the entire period. Instead, adopting separate models is necessary to account for the varied impacts of the pandemic. This approach acknowledges the temporal variability and ensures a more precise understanding and modeling of crash severity during a period marked by significant disruptions and changes.
3.3. Modeling Results
This section presents the detailed outcomes of the comprehensive modeling analysis, the results of which are systematically organized across Table 4, Table 5, Table 6, Table 7, Table 8 and Table 9. These tables encapsulate a wide array of parameters, categorically grouped to enhance clarity and facilitate a nuanced understanding of the diverse factors influencing crash severity. The parameters are divided into several key groups: driver demographic characteristics, roadway characteristics, crash characteristics, temporal characteristics, vulnerable road users, driver behavior and risk factors, weather conditions, and external factors. Each of these groups capture specific elements that play a critical role in determining the severity of road crashes. The ensuing subsections delve into the effects of these groups, providing an in-depth discussion of how each category contributes to the overall dynamics of crash severity.
Table 4.
Results of the severity model and average marginal effects for the year 2018 (a blank table cell denotes that the variable was not statistically significant for that year).
Table 5.
Results of the severity model and average marginal effects for the year 2019 (a blank table cell denotes that the variable was not statistically significant for that year).
Table 6.
Results of the severity model and average marginal effects for the year 2020 (a blank table cell denotes that the variable was not statistically significant for that year).
Table 7.
Results of the severity model and average marginal effects for the year 2021 (a blank table cell denotes that the variable was not statistically significant for that year).
Table 8.
Results of the severity model and average marginal effects for the year 2022 (a blank table cell denotes that the variable was not statistically significant for that year).
Table 9.
Results of the severity model and average marginal effects for the year 2023 (a blank table cell denotes that the variable was not statistically significant for that year).
3.3.1. Driver Behavior and Risk Factors
Examining the role of driver behavior and risk factors in crash severity across the years 2018 to 2023 yields significant insights, particularly with regard to alcohol use, seatbelt usage, distracted driving, drowsiness, drug use, and speed violations.
Regarding alcohol involvement, it consistently increased the likelihood of both minor and severe injuries. For instance, in 2018, the marginal effect for minor injuries was 0.0627, and for severe injuries, it was 0.0217. This trend persisted across the years, peaking in 2021 with the marginal effects of minor and severe injuries being 0.0761 and 0.0334, respectively. This pattern, alongside a consistent decrease in PDO outcomes, suggests that crashes involving alcohol are more prone to result in injuries.
Transitioning to the issue of seatbelt non-usage, the data reveal a significant elevation in injury risk. In 2018, the impact was pronounced with marginal effects of 0.2365 for minor injuries and 0.223 for severe injuries, a trend that remained stable over the years. This highlights the vital role of seatbelt usage in crash severity mitigation.
When it comes to distracted driving, its impact was less consistent across the years, with significant results only in 2020. This year saw an increase in the probability of minor (0.0107) and severe injuries (0.0044), shedding light on the risks associated with distraction while driving. This result is consistent with other studies [19,23,37], which also highlight the increasing concern around distracted driving during stay-at-home order.
Concerning drowsy driving, its influence on crash severity was significant in select years. In 2018, drowsy driving was associated with increased likelihoods of minor (0.0552) and severe injuries (0.019), indicating a notable risk. However, this effect was not consistently significant in all years. For example, in 2019, the marginal effects were lower, with 0.026 for minor injuries and 0.0086 for severe injuries, and in 2022, the effects were 0.0233 for minor injuries and 0.0087 for severe injuries. These fluctuations suggest a varied impact of drowsiness across different years, underlining the importance of considering temporal variations in risk factor analysis.
Drug use consistently resulted in higher injury risks, with an upward trend in both minor and severe injury likelihood. The marginal effect for severe injuries notably increased from 0.0282 in 2018 to 0.0473 in 2022, indicating a growing severity in drug-related crashes.
Lastly, the issue of speed violations consistently correlated with a higher likelihood of both minor and severe injuries. In 2018, the marginal effects for minor injuries were 0.0143 and for severe injuries 0.0045, with a notable increase in subsequent years, peaking in 2022 for minor injuries (0.0343) and severe injuries (0.0126).
3.3.2. Driver Demographic Characteristics
The analysis of driver demographic characteristics, specifically focusing on senior and young drivers, provides valuable insights into their impact on crash severity.
For senior drivers involved in crashes, there is a noticeable tendency toward increased injury severity. This is evidenced by the marginal effects indicating a growing likelihood of both minor and severe injuries. In 2018, the marginal effect for minor injuries was 0.0276, gradually rising to 0.038 in 2022. Similarly, the likelihood of severe injuries showed an upward trend, moving from 0.0089 in 2018 to 0.0142 in 2022. These results suggest that crashes involving senior drivers are more likely to result in injuries rather than being confined to property damage only. Concurrently, the negative effect on PDO outcomes, with marginal effects ranging from −0.0365 in 2018 to −0.0521 in 2022, further supports this observation.
In contrast, the impact of young drivers on crash outcomes varied over the years. In 2018 and 2022, there were no statistically significant effects noted in their involvement in crashes. However, in the other years, young drivers showed a propensity for being involved in PDO crashes, as evidenced by positive marginal effects, such as 0.022 in 2019. This contrasts with the negative marginal effects observed for minor and severe injuries in these years—for example, −0.0168 for minor injuries and −0.0052 for severe injuries in 2019. This pattern indicates that accidents involving young drivers are less likely to lead to injuries and more prone to result in property damage.
3.3.3. Vulnerable Road Users
The results concerning vulnerable road users, encompassing motorcyclists, bicyclists, and pedestrians, provide valuable insights into the dynamics of crash severity, particularly when these groups are involved in crashes. These results were statistically significant in all the examined years, indicating a consistent impact of these road user categories on crash outcomes. However, a significant shift in crash patterns is observed, particularly when comparing the pre- and post-COVID-19 pandemic periods.
Analyzing motorcycle-related crashes revealed a notable escalation in crash severity, especially in the post-COVID-19 era (2020–2023). During the pre-COVID-19 years (2018–2019), there was an increased likelihood of minor and severe injuries, with marginal effects ranging from 0.1985 to 0.2066 for minor injuries and from 0.2986 to 0.3084 for severe injuries. Concurrently, the probability of crashes resulting in property damage only (PDO) was lower, as indicated by negative marginal effects between −0.5052 and −0.5069.
However, the post-COVID-19 period showed intensified severity in motorcycle-related crashes. The likelihood of PDO crashes decreased further, as evidenced by the marginal effects from −0.5186 to −0.5369. Simultaneously, there was a significant increase in the likelihood of severe injuries, with marginal effects ranging from 0.3271 to 0.3729. The probability of minor injuries showed a slight decrease, with marginal effects moving from 0.164 to 0.1943. This shift in crash severity pattern post-COVID-19 underscores the need for targeted interventions in motorcycle safety.
For bicycle-related crashes, the pre-COVID-19 years of 2018 and 2019 showed an increased likelihood of resulting in severe and minor injuries, with marginal effects for severe injuries between 0.2645 and 0.2752 and for minor injuries between 0.2064 and 0.2077. During this period, the likelihood of PDO outcomes was lower, as indicated by negative marginal effects approximately between −0.4708 and −0.4829.
The post-COVID-19 years, from 2020 to 2023, saw a pronounced shift towards more severe outcomes in bicycle-related crashes. The probability of severe injuries significantly increased, with marginal effects escalating from 0.2527 to 0.3532. The likelihood of minor injuries slightly decreased, ranging from 0.1738 to 0.1958, while the trend for PDO incidents remained negative and became more pronounced, indicating a further reduction in the likelihood of crashes resulting only in property damage, with marginal effects from −0.4484 to −0.527.
Pedestrian-related crashes in the pre-COVID-19 years of 2018 and 2019 exhibited a high likelihood of both minor and severe injuries. The marginal effects for minor injuries ranged from 0.1527 to 0.1588, and for severe injuries, they ranged from 0.3839 to 0.3883. These crashes also showed a strong negative trend for PDO outcomes, with marginal effects from −0.541 to −0.5427.
This trend of increased injury severity in pedestrian-related crashes became more pronounced post-COVID-19, from 2020 to 2023. During this period, the likelihood of severe injuries surged dramatically, with marginal effects escalating from 0.377 to a peak of 0.4677. Simultaneously, there was a decrease in the likelihood of minor injuries, although it remained significant, with marginal effects varying from 0.1017 to 0.167. The trend for PDO outcomes persisted in its negative direction, indicating a consistently low probability of pedestrian-related crashes resulting in property damage only, with marginal effects ranging from −0.5439 to −0.5705. These findings regarding pedestrian-related crashes are critical in addressing the research objective, which focuses on understanding the evolving nature of crash severity and the specific impact on vulnerable road users during the COVID-19 pandemic.
3.3.4. Crash Characteristics
In terms of crash types, head-on collisions consistently showed a significant impact on crash severity, with a pronounced increase in the likelihood of both minor and severe injuries across all years. This trend underscores the particularly dangerous nature of head-on collisions. Sideswipe crashes also demonstrated a notable effect, predominantly increasing the likelihood of property-damage-only (PDO) outcomes. Interestingly, the impact of other crash types, such as rear-end and fixed-object collisions, varied across the years, indicating changing patterns in crash dynamics over time.
The “Hit and Run” category further illuminated the complexities of crash severity. Crashes involving a hit and run consistently resulted in higher likelihoods of PDO outcomes while simultaneously decreasing the probabilities of minor and severe injuries. This pattern was observed across all years, suggesting the persistent influence of hit and run incidents on the nature and consequences of crashes.
3.3.5. Roadway Characteristics
The investigation into roadway characteristics and their impact on traffic crashes reveals intricate dynamics in how various elements affect crash severity. Each component, from traffic signals to road alignments, mainline roads, work zones, urban or rural settings, and speed limits, plays a distinct role in shaping traffic safety outcomes.
Over the six-year span, traffic signals consistently demonstrated a significant impact on crash outcomes. Specifically, they showed a tendency to reduce the probability of property-damage-only (PDO) crashes, as evidenced by negative marginal effects in each year (e.g., −0.0486 in 2018, decreasing further to −0.0647 in 2021). Concurrently, there was an observed increase in the risk of minor and severe injuries. The marginal effects for minor injuries ranged from 0.0367 in 2018 to a peak of 0.0462 in 2021, and for severe injuries, the marginal effects ranged from 0.0119 in 2018 to 0.0186 in 2021.
This pattern suggests that while traffic signals effectively organize traffic flow and prevent certain types of crashes, they may also create scenarios where crashes, when they do occur, are more likely to result in injuries. This is particularly evident in the increased marginal effects for injuries over the years [8,9].
The influence of roadway alignment fluctuated in its significance, with straight alignments in some years (like 2019, 2021, and 2022) associated with a higher chance of PDO incidents but a lower risk of injuries compared to curved roads.
Mainline roads were consistently linked with fewer PDO incidents but a higher probability of injuries. This pattern is likely due to the nature of mainline roads, which typically involve higher speeds and more traffic, leading to more serious outcomes in crashes.
The presence of work zones, particularly in 2021 and 2022, significantly influenced traffic crashes. Work zones appeared to mitigate the severity of crashes. Their presence was associated with fewer injuries, suggesting that the caution induced by work zones, despite complicating traffic flow, might reduce the severity of crashes that do occur.
Urban versus rural area distinctions were significant in 2018, 2019, and 2023. Urban areas tended to have more PDO incidents but fewer injuries than rural areas.
Lastly, roads with posted speeds of 50 mph or more were notably significant in 2020, 2021, and 2022. These roads had fewer PDO incidents but a higher incidence of injuries, which aligns with the understanding that higher speeds increase crash severity [9].
3.3.6. Temporal Characteristics
The analysis of temporal characteristics in traffic crashes, specifically examining the impact of weekends versus weekdays, presents an intriguing pattern over the years 2018 to 2023. In 2018, 2019, and 2021, the data indicate that the occurrence of crashes on weekends had no statistically significant difference in terms of property damage only (PDO), minor injuries, or severe injuries when compared to weekdays. This lack of significance suggests a uniform risk profile for traffic crashes irrespective of the days of the week during these years.
However, a significant shift was observed in 2020, 2022, and 2023. In 2020, 2022, and 2023, weekends were associated with a decreased likelihood of PDO crashes but an increased likelihood of both minor and severe injuries. This pattern suggests a change in driving behaviors or traffic patterns during weekends, potentially influenced by broader societal or policy shifts. This observation aligns with findings from other studies, as indicated in [37], where similar results were noted.
3.3.7. Weather Conditions
The analysis of the impact of weather conditions on crash severity revealed a consistent pattern, particularly concerning the role of clear weather. Clear weather conditions were associated with an increase in the likelihood of both minor and severe injuries across all years. This trend remained stable over the six-year period, underscoring a persistent underestimation of risks during clear weather [8,9].
In 2018, clear weather increased the probability of minor injuries by 1.4% and severe injuries by 0.43%. This pattern continued consistently, with 2023 witnessing an even higher increase in minor injuries by 2.54% and severe injuries by 0.86% under similar conditions. These results highlight the importance of maintaining cautious driving behavior and an awareness of potential risks, even in favorable weather conditions.
3.3.8. External Factors
The analysis of the impact of animal involvement in traffic crashes presents a clear and consistent pattern across the years. Animal involvement in traffic crashes has a significant impact on the nature and severity of these crashes.
Throughout the six-year period, the presence of animals in traffic crashes consistently increased the probability of property-damage-only (PDO) crashes while simultaneously decreasing the likelihood of both minor and severe injuries. This pattern suggests that while animal involvement often leads to traffic disruptions or crashes, these crashes are less likely to result in human injury compared to other types of crashes.
4. Discussion
The COVID-19 pandemic has markedly reshaped road safety dynamics and crash severity, challenging established correlations between traffic patterns and road crashes. Traditionally, a rise in vehicle miles traveled (VMT) correlates with increased road crashes [19]. Yet, during the pandemic, marked by decreased mobility and stay-at-home orders, a more intricate set of factors influencing crash rates and severities emerged, extending beyond traditional traffic metrics.
Before the pandemic, crash severity indicators largely adhered to patterns influenced by familiar factors like road conditions, driver behavior, and environmental factors. The onset of COVID-19, however, brought about significant deviations in these trends, indicative of a link between the pandemic and changes in driving behaviors.
Despite a global reduction in travel, many regions saw an unexpected increase in traffic fatality rates during the pandemic [19,21,23,24,25,37,38,39]. This paradoxical outcome highlights the significant role of driver-specific factors in crash severity, particularly when standard road and environmental conditions remained constant. The period saw a relaxation in traffic law enforcement, and studies suggest an increased propensity for risky behaviors significantly impacting road safety during these times [19,23,24,26,37,38,40].
Notably, there was a rise in risky driving behaviors, likely spurred by reduced traffic volumes, higher speeds, and a false sense of security on less congested roads. The data show an increase in alcohol- and drug-related crashes and speed violations in the pandemic year, reflecting increased risk-taking among drivers.
Concurrently, the pandemic saw a rise in alcohol consumption, possibly a response to heightened stress, anxiety, and depression [19,23,41]. This increase in alcohol use, coupled with relaxed traffic regulation enforcement, likely led to more dangerous driving practices, including aggressive behaviors, as our study’s findings suggest.
A particularly significant shift was noted among vulnerable road users like pedestrians, cyclists, and motorcyclists. While these groups have always faced certain risks, the post-2020 period saw a marked increase in crash severity involving them. This change is possibly due to a pandemic-induced shift in transportation modes, with more individuals opting for walking, biking, and motorcycles, leading to increased severity in related crashes [19,23,38,39,42,43,44,45,46,47].
The pandemic era thus underscored the importance of a comprehensive understanding of crash causation factors, accentuating the influence of individual behaviors and psychological states on road safety. It highlighted the need for adaptable traffic safety strategies and policies capable of effectively addressing such unprecedented global changes, ensuring road safety amidst evolving traffic patterns and societal norms.
5. Operational and Management Implications
The results of this study offer crucial insights that have direct implications for operational and management strategies in traffic safety. Recognizing the key factors that contribute to crash severity can act as an essential resource for traffic safety managers, urban planners, and policymakers. This knowledge is especially significant in managing road safety during unprecedented events such as the COVID-19 pandemic, helping to inform and guide strategies aimed at mitigating risks and enhancing overall traffic safety.
A key finding is the increased risk of severe injuries among motorcyclists, cyclists, and pedestrians. This necessitates the implementation of enhanced safety measures, such as improved infrastructure, including dedicated bike lanes and pedestrian pathways, better lighting for increased visibility, and enhanced crosswalks. Additionally, awareness campaigns to educate drivers about the presence and rights of these vulnerable road users are essential.
Risky driver behaviors, especially during clear weather conditions, have been shown to increase crash severity. Addressing this issue requires targeted enforcement and education strategies, such as stricter enforcement of speed limits, DUI checks, and awareness campaigns highlighting the risks of complacent driving during favorable weather conditions.
The varying significance of weekends in crash severity across different years suggests the need for a dynamic approach to traffic management. Law enforcement and traffic management agencies might need to increase patrols or modify traffic control measures during weekends, particularly in areas with higher weekend traffic or social activities.
The study of roadway characteristics indicates that features like traffic signals, road alignments, and mainline roads consistently affect crash outcomes. Enhancing these features through advanced traffic signal systems, improved signage and road markings, and better road maintenance can significantly contribute to safety.
Interestingly, work zones appeared to mitigate the severity of crashes. Operational strategies should focus on maintaining this trend by ensuring clear signage, proper barrier placement, and safe routing of traffic through or around work zones.
The distinction between urban and rural crash dynamics necessitates tailored safety strategies. Urban areas might require more focus on managing high-density traffic and protecting pedestrians and cyclists, while rural areas may benefit from improved road maintenance and measures to address high-speed driving.
Given the increased severity of crashes on roads with higher speed limits, it is crucial to enforce and possibly re-evaluate speed limits, especially in areas with a history of severe crashes. This measure should be complemented by continuous monitoring and analysis of crash data, which will guide policy and operational decisions, ensuring that strategies remain relevant and effective in addressing evolving road safety challenges. This integrated approach is essential for developing responsive and proactive road safety measures.
Finally, ongoing public education campaigns are essential to keep road users informed about safety measures, changes in traffic patterns, and the importance of responsible driving behavior. Through these comprehensive strategies, traffic management authorities, policymakers, and road safety advocates can significantly contribute to reducing crash severity and enhancing overall road safety.
6. Conclusions
This study, conducted in Virginia, USA, from 2018 to 2023, utilized multilevel ordinal logistic regression (M-OLR) to investigate the nuances of crash severity and road safety. A key aspect of this approach was accounting for spatial heterogeneity across different regions, ensuring a comprehensive understanding of crash severity dynamics during the unique conditions of the COVID-19 pandemic. This study aimed to explore how the pandemic, particularly the imposition of stay-at-home orders, led to significant changes in traffic behaviors and crash severity patterns.
A key finding of this research is the notable shift in crash severity during the pandemic. Despite the overall reduction in the number of traffic crashes, there was a concerning increase in the proportion of severe injuries. This trend was primarily attributed to changes in driver behaviors, heightened by the relaxation of police enforcement during the pandemic. Riskier driving practices, such as increased speed violations on less congested roads, were more prevalent. These behaviors evidently contributed to the increased severity of crashes.
Moreover, this study underscored significant changes in the risks faced by vulnerable road users, including pedestrians, cyclists, and motorcyclists. The pandemic-induced shift in transportation modes, with more individuals adopting walking, cycling, and motorcycle use, correlated with an increase in crash severity for these groups. This necessitates a focus on developing safety measures specifically for these road users, particularly as traditional travel patterns are disrupted.
Furthermore, the analysis has demonstrated that environmental and roadway characteristics, such as weather conditions and traffic signals, maintained a consistent influence on crash severity across the years.
In conclusion, as societies transition towards post-pandemic norms, the insights gained from this research are vital for informing future road safety policies and strategies. Policymakers, urban planners, and road safety experts are urged to integrate these learnings into their efforts to enhance road safety. The experience of the pandemic period offers a unique perspective that can guide the development of more effective measures to ensure safer roads for all users in the face of evolving challenges.
7. Study Limitations and Future Directions
This study, while offering substantial insights, has its limitations that require acknowledgment, alongside suggestions for future research directions.
The first limitation lies in the study’s regional focus. While the findings provide an in-depth understanding of crash dynamics in Virginia, USA, extrapolating these results to other regions with differing road conditions, traffic behaviors, and cultural driving norms requires caution. Future studies should consider broadening their geographical scope to validate these findings across diverse locales. Expanding research to include varied infrastructural and cultural settings would not only test the generalizability of the current findings but also cater to a global audience, thus enriching the study’s applicability and relevance.
Additionally, the study period coincided with rapid technological changes and significant shifts in policies, especially due to the COVID-19 pandemic. This evolving landscape offers fertile ground for further research. Future studies could explore how emerging remote work trends are reshaping traffic patterns. Understanding these shifts is crucial for adapting road safety strategies to the changing societal and technological landscapes, ensuring that they remain effective and relevant.
Another critical aspect highlighted by this study is the increased risk to vulnerable road users, such as cyclists and pedestrians. While the study provides a macroscopic view of the risks involved, there is a need for more focused research on specific safety measures and urban planning strategies to enhance their safety.
In conclusion, this study lays the groundwork for a comprehensive understanding of crash severity dynamics but also opens avenues for further exploration. Future research addressing these limitations and exploring suggested areas can significantly contribute to ongoing efforts to enhance road safety and mitigate crash severity.
Author Contributions
Conceptualization, M.A. and H.A.R.; methodology, M.A.; software, M.A.; analysis and interpretation of the results, M.A.; data curation, M.A.; writing—original draft preparation, M.A.; writing—review and editing, H.A.R.; visualization, M.A.; supervision, H.A.R. All authors have read and agreed to the published version of the manuscript.
Funding
This research received no external funding.
Institutional Review Board Statement
Not applicable.
Informed Consent Statement
Not applicable.
Data Availability Statement
The data used in this study are publicly available at: https://www.virginiaroads.org/maps/1a96a2f31b4f4d77991471b6cabb38ba/about (accessed on 20 August 2023).
Conflicts of Interest
The authors declare no conflicts of interest.
References
- Muley, D.; Shahin, M.; Dias, C.; Abdullah, M. Role of Transport during Outbreak of Infectious Diseases: Evidence from the Past. Sustainability 2020, 12, 7367. [Google Scholar] [CrossRef]
- Park, M.-B. The Effect of Advances in Transportation on the Spread of the Coronavirus Disease: The Last Is Africa and Endemic. J. Public Health Res. 2021, 10, 2058. [Google Scholar] [CrossRef]
- Xu, B.; Tian, H.; Sabel, C.E.; Xu, B. Impacts of Road Traffic Network and Socioeconomic Factors on the Diffusion of 2009 Pandemic Influenza A (H1N1) in Mainland China. Int. J. Environ. Res. Public Health 2019, 16, 1223. [Google Scholar] [CrossRef] [PubMed]
- Alhajyaseen, W.K.M.; Almukdad, A.; Hussain, Q.; Almallah, M.; Al Malki, M.A.; Singaravelu, J.; Zammataro, S. Road Safety Status during COVID-19 Pandemic: Exploring Public and Road Safety Expert’s Opinions. Int. J. Inj. Control Saf. Promot. 2022, 29, 135–151. [Google Scholar] [CrossRef]
- Knowles, R.D.; Ferbrache, F.; Nikitas, A. Transport’s Historical, Contemporary and Future Role in Shaping Urban Development: Re-Evaluating Transit Oriented Development. Cities 2020, 99, 102607. [Google Scholar] [CrossRef]
- Knowles, R.D. Transport Shaping Space: Differential Collapse in Time–Space. J. Transp. Geogr. 2006, 14, 407–425. [Google Scholar] [CrossRef]
- Wu, W.; Jiang, S.; Liu, R.; Jin, W.; Ma, C. Economic Development, Demographic Characteristics, Road Network and Traffic Accidents in Zhongshan, China: Gradient Boosting Decision Tree Model. Transp. A Transp. Sci. 2020, 16, 359–387. [Google Scholar] [CrossRef]
- Alrumaidhi, M.; Farag, M.M.G.; Rakha, H.A. Comparative Analysis of Parametric and Non-Parametric Data-Driven Models to Predict Road Crash Severity among Elderly Drivers Using Synthetic Resampling Techniques. Sustainability 2023, 15, 9878. [Google Scholar] [CrossRef]
- Alrumaidhi, M.; Rakha, H.A. Factors Affecting Crash Severity among Elderly Drivers: A Multilevel Ordinal Logistic Regression Approach. Sustainability 2022, 14, 11543. [Google Scholar] [CrossRef]
- AlRukaibi, F.; AlKheder, S.; Sayed, T.; Alburait, A. Injury Severity Influence Factors and Collision Prediction—A Case Study on Kuwait Highways. J. Transp. Health 2021, 20, 101025. [Google Scholar] [CrossRef]
- Road Crashes Have More Impact on Poverty than You Probably Thought. Available online: https://blogs.worldbank.org/transport/road-crashes-have-more-impact-poverty-you-probably-thought (accessed on 3 March 2023).
- World Health Organization. Global Status Report on Road Safety 2018; World Health Organization: Geneva, Switzerland, 2018; ISBN 978-92-4-156568-4. [Google Scholar]
- Kabli, A.; Bhowmik, T.; Eluru, N. Exploring the Temporal Variability of the Factors Affecting Driver Injury Severity by Body Region Employing a Hybrid Econometric Approach. Anal. Methods Accid. Res. 2023, 37, 100246. [Google Scholar] [CrossRef]
- Anwari, N.; Ahmed, M.T.; Islam, M.R.; Hadiuzzaman, M.; Amin, S. Exploring the Travel Behavior Changes Caused by the COVID-19 Crisis: A Case Study for a Developing Country. Transp. Res. Interdiscip. Perspect. 2021, 9, 100334. [Google Scholar] [CrossRef]
- WHO Director-General’s Opening Remarks at the Media Briefing on COVID-19—11 March 2020. Available online: https://www.who.int/director-general/speeches/detail/who-director-general-s-opening-remarks-at-the-media-briefing-on-covid-19---11-march-2020 (accessed on 9 October 2023).
- WHO Coronavirus (COVID-19) Dashboard. Available online: https://covid19.who.int (accessed on 10 October 2023).
- Rahman, M.M.; Thill, J.-C. Associations between COVID-19 Pandemic, Lockdown Measures and Human Mobility: Longitudinal Evidence from 86 Countries. Int. J. Environ. Res. Public Health 2022, 19, 7317. [Google Scholar] [CrossRef] [PubMed]
- Wagner, E.; Atkins, R.G.; Berning, A.; Robbins, A.; Watson, C.; Anderle, J.; United States Department of Transportation; National Highway Traffic Safety Administration; Office of Behavioral Safety Research. Examination of the Traffic Safety Environment During the Second Quarter of 2020: Special Report. 2020. Available online: https://rosap.ntl.bts.gov/view/dot/50940 (accessed on 10 August 2023).
- Adanu, E.K.; Okafor, S.; Penmetsa, P.; Jones, S. Understanding the Factors Associated with the Temporal Variability in Crash Severity before, during, and after the COVID-19 Shelter-in-Place Order. Safety 2022, 8, 42. [Google Scholar] [CrossRef]
- Arun Pathak, A.; Chandrasekaran, S.; Annamalai, B. Analysis of Motor Vehicle Accidents: Comparison between Before and During the COVID-19 Lockdown in Maharashtra, India. Transp. Res. Rec. 2023, 2677, 503–516. [Google Scholar] [CrossRef] [PubMed]
- Dong, X.; Xie, K.; Yang, H. How Did COVID-19 Impact Driving Behaviors and Crash Severity? A Multigroup Structural Equation Modeling. Accid. Anal. Prev. 2022, 172, 106687. [Google Scholar] [CrossRef]
- Doucette, M.L.; Tucker, A.; Auguste, M.E.; Watkins, A.; Green, C.; Pereira, F.E.; Borrup, K.T.; Shapiro, D.; Lapidus, G. Initial Impact of COVID-19’s Stay-at-Home Order on Motor Vehicle Traffic and Crash Patterns in Connecticut: An Interrupted Time Series Analysis. Inj. Prev. 2021, 27, 3–9. [Google Scholar] [CrossRef]
- Gong, Y.; Lu, P.; Yang, X.T. Impact of COVID-19 on Traffic Safety from the “Lockdown” to the “New Normal”: A Case Study of Utah. Accid. Anal. Prev. 2023, 184, 106995. [Google Scholar] [CrossRef]
- Islam, M.R.; Abdel-Aty, M.; Islam, Z.; Zhang, S. Risk-Compensation Trends in Road Safety during COVID-19. Sustainability 2022, 14, 5057. [Google Scholar] [CrossRef]
- Qureshi, A.I.; Huang, W.; Khan, S.; Lobanova, I.; Siddiq, F.; Gomez, C.R.; Suri, M.F.K. Mandated Societal Lockdown and Road Traffic Accidents. Accid. Anal. Prev. 2020, 146, 105747. [Google Scholar] [CrossRef]
- Vingilis, E.; Beirness, D.; Boase, P.; Byrne, P.; Johnson, J.; Jonah, B.; Mann, R.E.; Rapoport, M.J.; Seeley, J.; Wickens, C.M.; et al. Coronavirus Disease 2019: What Could Be the Effects on Road Safety? Accid. Anal. Prev. 2020, 144, 105687. [Google Scholar] [CrossRef] [PubMed]
- AlKheder, S.; Al-Mukhaizeem, M.; Al-Saleh, H.; Bahman, E.; Al-Ghanim, S. Evaluating the Impact of COVID-19 on Traffic Congestion and Safety Skills Using Structural Equation Modeling (SEM) and Auto-Regressive Integrated Moving Average (ARIMA). Int. J. Inj. Control Saf. Promot. 2023, 30, 593–611. [Google Scholar] [CrossRef] [PubMed]
- Kim, K. Impacts of COVID-19 on Transportation: Summary and Synthesis of Interdisciplinary Research. Transp. Res. Interdiscip. Perspect. 2021, 9, 100305. [Google Scholar] [CrossRef] [PubMed]
- Lenzen, M.; Li, M.; Malik, A.; Pomponi, F.; Sun, Y.-Y.; Wiedmann, T.; Faturay, F.; Fry, J.; Gallego, B.; Geschke, A.; et al. Global Socio-Economic Losses and Environmental Gains from the Coronavirus Pandemic. PLoS ONE 2020, 15, e0235654. [Google Scholar] [CrossRef] [PubMed]
- Behnood, A.; Mannering, F.L. An Empirical Assessment of the Effects of Economic Recessions on Pedestrian-Injury Crashes Using Mixed and Latent-Class Models. Anal. Methods Accid. Res. 2016, 12, 1–17. [Google Scholar] [CrossRef]
- Lee, J.; Abdel-Aty, A.; Park, J. Investigation of Associations between Marijuana Law Changes and Marijuana-Involved Fatal Traffic Crashes: A State-Level Analysis. J. Transp. Health 2018, 10, 194–202. [Google Scholar] [CrossRef]
- Park, J.; Abdel-Aty, M.; Lee, J.; Lee, C. Developing Crash Modification Functions to Assess Safety Effects of Adding Bike Lanes for Urban Arterials with Different Roadway and Socio-Economic Characteristics. Accid. Anal. Prev. 2015, 74, 179–191. [Google Scholar] [CrossRef] [PubMed]
- Antoniou, C.; Yannis, G.; Papadimitriou, E.; Lassarre, S. Relating Traffic Fatalities to GDP in Europe on the Long Term. Accid. Anal. Prev. 2016, 92, 89–96. [Google Scholar] [CrossRef]
- Vanlaar, W.G.M.; Woods-Fry, H.; Barrett, H.; Lyon, C.; Brown, S.; Wicklund, C.; Robertson, R.D. The Impact of COVID-19 on Road Safety in Canada and the United States. Accid. Anal. Prev. 2021, 160, 106324. [Google Scholar] [CrossRef]
- Governor Northam Issues Statewide Stay at Home Order. Northwest VA Medical Reserve Corps 2020. Available online: https://www.vaemergency.gov/updates/governor-northam-issues-statewide-stay-at-home-order (accessed on 12 August 2023).
- Islam, S.M.; Washington, S.; Kim, J.; Haque, M.M. A Hierarchical Multinomial Logit Model to Examine the Effects of Signal Strategies on Right-Turn Crash Risks by Crash Movement Configuration. Accid. Anal. Prev. 2023, 184, 106993. [Google Scholar] [CrossRef]
- Adanu, E.K.; Brown, D.; Jones, S.; Parrish, A. How Did the COVID-19 Pandemic Affect Road Crashes and Crash Outcomes in Alabama? Accid. Anal. Prev. 2021, 163, 106428. [Google Scholar] [CrossRef]
- Patwary, A.L.; Khattak, A.J. Crash Harm before and during the COVID-19 Pandemic: Evidence for Spatial Heterogeneity in Tennessee. Accid. Anal. Prev. 2023, 183, 106988. [Google Scholar] [CrossRef]
- Ebrahim Shaik, M.; Ahmed, S. An Overview of the Impact of COVID-19 on Road Traffic Safety and Travel Behavior. Transp. Eng. 2022, 9, 100119. [Google Scholar] [CrossRef]
- Katrakazas, C.; Michelaraki, E.; Sekadakis, M.; Yannis, G. A Descriptive Analysis of the Effect of the COVID-19 Pandemic on Driving Behavior and Road Safety. Transp. Res. Interdiscip. Perspect. 2020, 7, 100186. [Google Scholar] [CrossRef]
- Ahmed, M.Z.; Ahmed, O.; Aibao, Z.; Hanbin, S.; Siyu, L.; Ahmad, A. Epidemic of COVID-19 in China and Associated Psychological Problems. Asian J. Psychiatry 2020, 51, 102092. [Google Scholar] [CrossRef]
- Zhang, J.; Hayashi, Y.; Frank, L.D. COVID-19 and Transport: Findings from a World-Wide Expert Survey. Transp. Policy 2021, 103, 68–85. [Google Scholar] [CrossRef] [PubMed]
- Soltani, A.; Azmoodeh, M.; Qadikolaei, M.R. Post COVID-19 Transformation in the Frequency and Location of Traffic Crashes Involving Older Adults. Transp. Res. Rec. 2023, 03611981231163866. [Google Scholar] [CrossRef]
- Li, J.; Zhao, Z. Impact of COVID-19 Travel-Restriction Policies on Road Traffic Accident Patterns with Emphasis on Cyclists: A Case Study of New York City. Accid. Anal. Prev. 2022, 167, 106586. [Google Scholar] [CrossRef] [PubMed]
- Alnawmasi, N.; Ali, Y.; Yasmin, S. Exploring Temporal Instability Effects on Bicyclist Injury Severities Determinants for Intersection and Non-Intersection-Related Crashes. Accid. Anal. Prev. 2024, 194, 107339. [Google Scholar] [CrossRef] [PubMed]
- Alnawmasi, N.; Mannering, F. An Analysis of Day and Night Bicyclist Injury Severities in Vehicle/Bicycle Crashes: A Comparison of Unconstrained and Partially Constrained Temporal Modeling Approaches. Anal. Methods Accid. Res. 2023, 40, 100301. [Google Scholar] [CrossRef]
- Barbour, N.; Mannering, F. Intended Cycling Frequency and the Role of Happiness and Environmental Friendliness after COVID-19. Sci. Rep. 2023, 13, 636. [Google Scholar] [CrossRef] [PubMed]
Disclaimer/Publisher’s Note: The statements, opinions and data contained in all publications are solely those of the individual author(s) and contributor(s) and not of MDPI and/or the editor(s). MDPI and/or the editor(s) disclaim responsibility for any injury to people or property resulting from any ideas, methods, instructions or products referred to in the content. |
© 2024 by the authors. Licensee MDPI, Basel, Switzerland. This article is an open access article distributed under the terms and conditions of the Creative Commons Attribution (CC BY) license (https://creativecommons.org/licenses/by/4.0/).