Article

The Spatiotemporal Analysis of Land Take Exemplified by Poland

by
Bielecka Elzbieta
Faculty of Civil Engineering and Geodesy, Military University of Technology, 2 gen. S. Kaliskiego St., 00-908 Warsaw, Poland
Sustainability 2024, 16(3), 1059; https://doi.org/10.3390/su16031059
Submission received: 28 November 2023 / Revised: 22 January 2024 / Accepted: 23 January 2024 / Published: 26 January 2024
(This article belongs to the Special Issue Sustainable Development of Land Cover Change and Landscape Ecology)

Abstract

:
The research was motivated by the growing interest of scientists and practitioners in land consumption. It was assumed that the multifaceted and space–time analysis of the dynamics of land use change reveals agricultural and forest land conversion into artificial areas, and thus highlight the regions of high human pressure. To fulfill the research objective, the proprietary coefficient of admissible (maximal) land take (aLT) was used. This study, based on open, publicly available spatial and statistical data, presents agricultural and forest land losses in four periods (2005, 2010, 2015, 2020) in Polish provinces. The analysis reveals both the value and the trend of land take and indicates Mazowieckie and Małopolska as the provinces of the highest land take pace since 2005. In contrast, provinces such as Zachodnio-Pomorskie and Opolskie, located in the northwest and southwest of Poland, are characterized by small and decreasing losses of agricultural and forest land, prompting them to be classified as lower outliers. The paper concludes, in part, that admissible (maximal) land take (aLT) is a useful tool for monitoring land conversion and planning spatial development of any region in the world.

1. Introduction

Urban development at the expense of agricultural land and forests has been a serious problem for scientists, politicians and governments for many years due to the serious consequences for the environment [1,2,3]. Research on the conversion of undeveloped land into artificial areas (e.g., built-up areas, industrial areas, transport infrastructure), called land occupation or land take, is of great importance in promoting the conservation of land resources and sustainable regional development [3,4].
The spatial and temporal evolution of land use change is an exceptionally complex process, revealed in the functional differences and structural complexity of different types of land use. Socioeconomic progress has an impact on land use, and vice versa, land use transformation affects socioeconomic growth. Only a profound consideration of the spatiotemporal variation of land use can make land take in a harmless direction. Finally, the use of the land and its response to human activities has gradually become a motivating factor for many scientists. Lambin et al. [5] note that deforestation and the decrease in extensively farmed agricultural land are extremely invasive and their aggregate, global impact on the functioning of the Earth system is enormous, yet not fully studied and estimated.
A similar opinion was shared by Foley et al. [6], who noted that conversion of natural landscapes into artificial land for human use has transformed much of the Earth’s land surface. Such changes have meant that in several years, people have faced the challenge of managing the trade-offs between the immediate human needs and the maintenance of the environment’s ability to provide goods and services in the long term; in other words, striving for sustainable development. Sustainable development, understood as ‘development that meets the needs of the present without compromising the ability of future generations to meet their own needs’, was first coined in the Brundtland Report, the report released by the United Nations Environment and Development Commission in 1987 [7]. Sustainable development can only be achieved through many initiatives and joint efforts of countries and international organizations. The most important worldwide initiatives include the programs of the United Nations, in particular the one established in 1992 at the Rio Earth Summit Agenda 21: Think Globally, Act Locally; and the plan for sustainable development adopted in 2015, Transforming our world: The 2030 Agenda for Sustainable Development (2030 Agenda). Sustainable land use is directly related to the 2030 Agenda’s Sustainable Development Goals (SDGs), as it ultimately aims to ensure adequate food quality for all, access to clean water and air, and many other goods inherent in the protection of agricultural land, forests and water.
In Europe, one of the flagship assumption of sustainable development is ‘Resource Efficiency and The Roadmap to a Resource Efficient Europe’ set up in 2011 (COM(2011) 571) [8]. The ‘Resource Efficient Europe’s’ milestones concern to minimize agriculture and forest land exclusion from production and limit their further conversion into urbanized areas, and finally achieve no net land take by 2050. The rules of sustainable development also suggest that infertile land can be converted into artificial surfaces, while being compensated with high quality land. The European Commission [9] notes, the demand for developed land continues yet to rise, as it is expected more built-up area per capita to satisfy inhabitants expectations and finally get better eco-nomic revenues. From the mid-20th century onwards, area covered by cities in the EU raised by 78%, while the population grown by just 33% [10]. The high upsurge of built-up area is observed globally [11,12], at country [13], regional and local level [14,15].
Several approaches have been proposed by the scientific community to analyze land take and land consumption. Conducted studies are based on a plethora of quantitative indicators related to the Earth’s surface, either explicitly or implicitly [3], and use Earth observation or statistical data [16]. The loss of agricultural land and deforestation are investigated in relation to sustainable agriculture [17,18], climate change [19], landscape change [20], biodiversity deterioration [10,21], the degradation of ecosystem services [10,22], human health and human well-being [23]. Academics have also revealed that environmentally friendly land use change in rural and forest areas is inextricably linked to the multifunctionality paradigm [24,25,26,27], which provides opportunities for agriculture and forestry to produce goods and services as public goods and uses local natural resources to establish producer–consumer relationships at the local level. To counteract unsustainable land management, particularly the high rate of land takeover, planners and decision makers are paying increasing attention to land conservation and restoration. The protection of agricultural land and forests is of great importance in many countries and is also the focus of Agenda 2030 (in particular SDG 15 ‘Life on Land’, dedicated to the protection, restoration and sustainable use of terrestrial ecosystems) and the European Green Deal set of regulations [28].
Poland has the third largest agricultural area in the EU (14.6 million ha in 2021). Until 1990, all of the agricultural land resources were used for agricultural production, but since 1990, it has changed significantly as a result of dynamic economic, social and political changes. Furthermore, Poland’s accession to the European Union in 2004 also has favored taking over agricultural land for other purposes than agriculture and forestry, in line with the multifunctional model of rural areas. Agricultural land conversion rates in Poland are among the highest in Europe [29]. The successive decline in the area of agricultural land has been observed for at least three decades and is related to their non-agricultural use, namely urbanization and transport. This disturbing process in recent years also largely covers fertile soils, despite the legal protection of agricultural and forest land, and makes a serious threat to the productivity of Polish agriculture [30].
Hence, the cognitive goal of this study is to identify and analyze the agricultural and forest land conversion into artificial area in Poland based on statistical data of the 2005, 2010, 2015 and 2020 reference years. Particular attention is paid to the spatial diversity and variability characterizing land use changes, and the diverse conditioning that has shaped them. The geographical range covers the territory of Poland, assuming the provinces (voivodship) as the minimal analytical unit. The ‘Studies of the Conditions and Directions of Spatial Development’ (thereinafter referred ‘Study’) were used to calculate the coefficient of admissible (maximal) land take. The spatiotemporal analysis of land take is presented and further discussed in relation to land conversion directions, soil fertility and legal regulations in the field of agriculture and forestry protection. An important additional task of our study was to cross-check existing databases with respect to changes in the use of agricultural and forest land for the expansion of built-up areas and transport infrastructure. The results of this analysis are described in detail in the discussion.
The originality of the approach concerns both the scope of research covering multi-temporal analyses for the entire country and the applied indicator of the maximal potential loss of agricultural and forest land, along with a synthetic, cartographic presentation of its value. Furthermore, the methodology of multi-temporal and multifaceted land take analysis based on aLT coefficient contributes to sustainable development by drawing attention to the shortcomings of spatial planning in Poland, in particular the possibility of amending the provisions of the spatial plans and Studies by other laws, including special laws regulating important public purpose investments.
The author’s original coefficient for the permissible conversion of agricultural and forest land to other uses acts as location quotient. It is unique, and could be used for any country in the world. Furthermore, the location quotient approach can be a useful planning tool for the assessment of regional environmental and socioeconomic impacts.

2. Materials and Methods

2.1. Study Area and Data Acquisition

The study covers Poland, a country in central-eastern Europe, with an area of 312,696 km2 and a population of just over 38 million. The country is divided into 16 administrative provinces called voivodships (see Figure 1). The dominant type of land use is agriculture, followed by forests, the area of which in 2021 were 59.5% and 30.6%, respectively. Built-up and urbanized areas cover 5.9%. Since 1990, a steady decrease in the acreage of agricultural land has been observed, with the greatest decline occurring in the years 2000–2005, i.e., in the period before and during Poland’s accession to the European Union. Only 29% of Polish soils is fertile and of highly productivity, the rest are rather poor. Furthermore, agriculture employs 8.2% of the workforce but contributes 3.8% to the gross domestic product (GDP), reflecting relatively low productivity [31].
This study relies on the statistical data from the 2000, 2005, 2015 and 2020 reference years, in particular on datasets from the Local Data Bank of the Central Statistical Office (GUS), concerning land use (namely agriculture land and forest), agricultural area and forest designated for non-agricultural and non-forest purposes in the Study for other purposes (see Table 1). The regions’ boundaries came from the National Boundaries Register via geoportal.gov.pl (https://www.geoportal.gov.pl/, accessed on 20 October 2023).

2.2. Research Problems and Main Methodological Assumptions

The main research issue concerns temporal and spatial diversity and variability of land take, in particular examining the size and trends at the national and provincial level. To tackle the issue, the admissible land take (aLT) coefficient was introduced. The second important topic discussed is the intention to change the use of agricultural and forest land to other, mainly artificial, land use. Finally, we debate whether the land take was influenced by legal regulations related to the protection of agricultural and forest land, or those ensuring the economic development of provinces and the country.
The admissible (maximal) land take in a given year t, denoted as aLTt, is defined as ratio of the sum of the admissible agriculture and forest area losses rate to the rate of total admissible agricultural and forest area losses in a given spatial unit (SU) according to Equation (1). The aLTt coefficient is calculated for the reference year or period, and ex-pressed in percent.
a L T t = A a t A t e x t + F a t F t e x t /   A t e x t + F t e x t S u e x t × 100 % ,
where Aa—the area of agricultural land designated in the Study for other purposes; Fa—forest designated in the Study for other purposes; Atex—total area (expanse) of agriculture land; Ftex—total area (expanse) of forest; SUex—spatial unit area, t—given year of the analysis.
alT interpretation is similar to the location quotient [33,34] in that it shows the ratio of allowable area losses in the province to land losses at the country level. To describe the variability of the aLTt values (i.e., the increase in the occupation of agricultural and forestry land for construction and an urban zone), statistical measures of position and dispersion were used, i.e., mean, median, standard deviation, range, and relative standard deviation (RSD), also expressed as coefficient of variation (CV). Meanwhile, Global Moran’s I statistics evaluate the autocorrelation between aLT values in regions. It is an inferential statistic with the null hypothesis of complete spatial randomness, which says that the attribute being investigated (hence, aLT values) is randomly distributed among the features (regions) in the whole study area. A detailed description of Global Moran’s I is given in ESRI ArcGIS Help or in Moran [35]. Then, provinces were grouped into four categories according to the mean aLT2005–2020 and standard deviation (see Table 2) and classified according to the conversion trend (up, down, up and down, down and up). Values of the agricultural and forest land loss coefficient are shown in choropleth maps using the same class intervals.
The analysis of the exclusion of agricultural and forest land from production was compared with data on investment expenditure, urban population, total population, urbanization rate, GDP per capita, expenditure on research and development (R&D), value of projects finances by the European Union, completed dwellings, density of public roads, number of municipalities, coverage by spatial plans (in %) and administrative decision on building location, using Pearson correlation.
For statistical data analysis, MS Excel and Statistica 13.3 were used, while cartographic presentations of aLT values are based on ArcGIS Pro 10.3.

3. Results

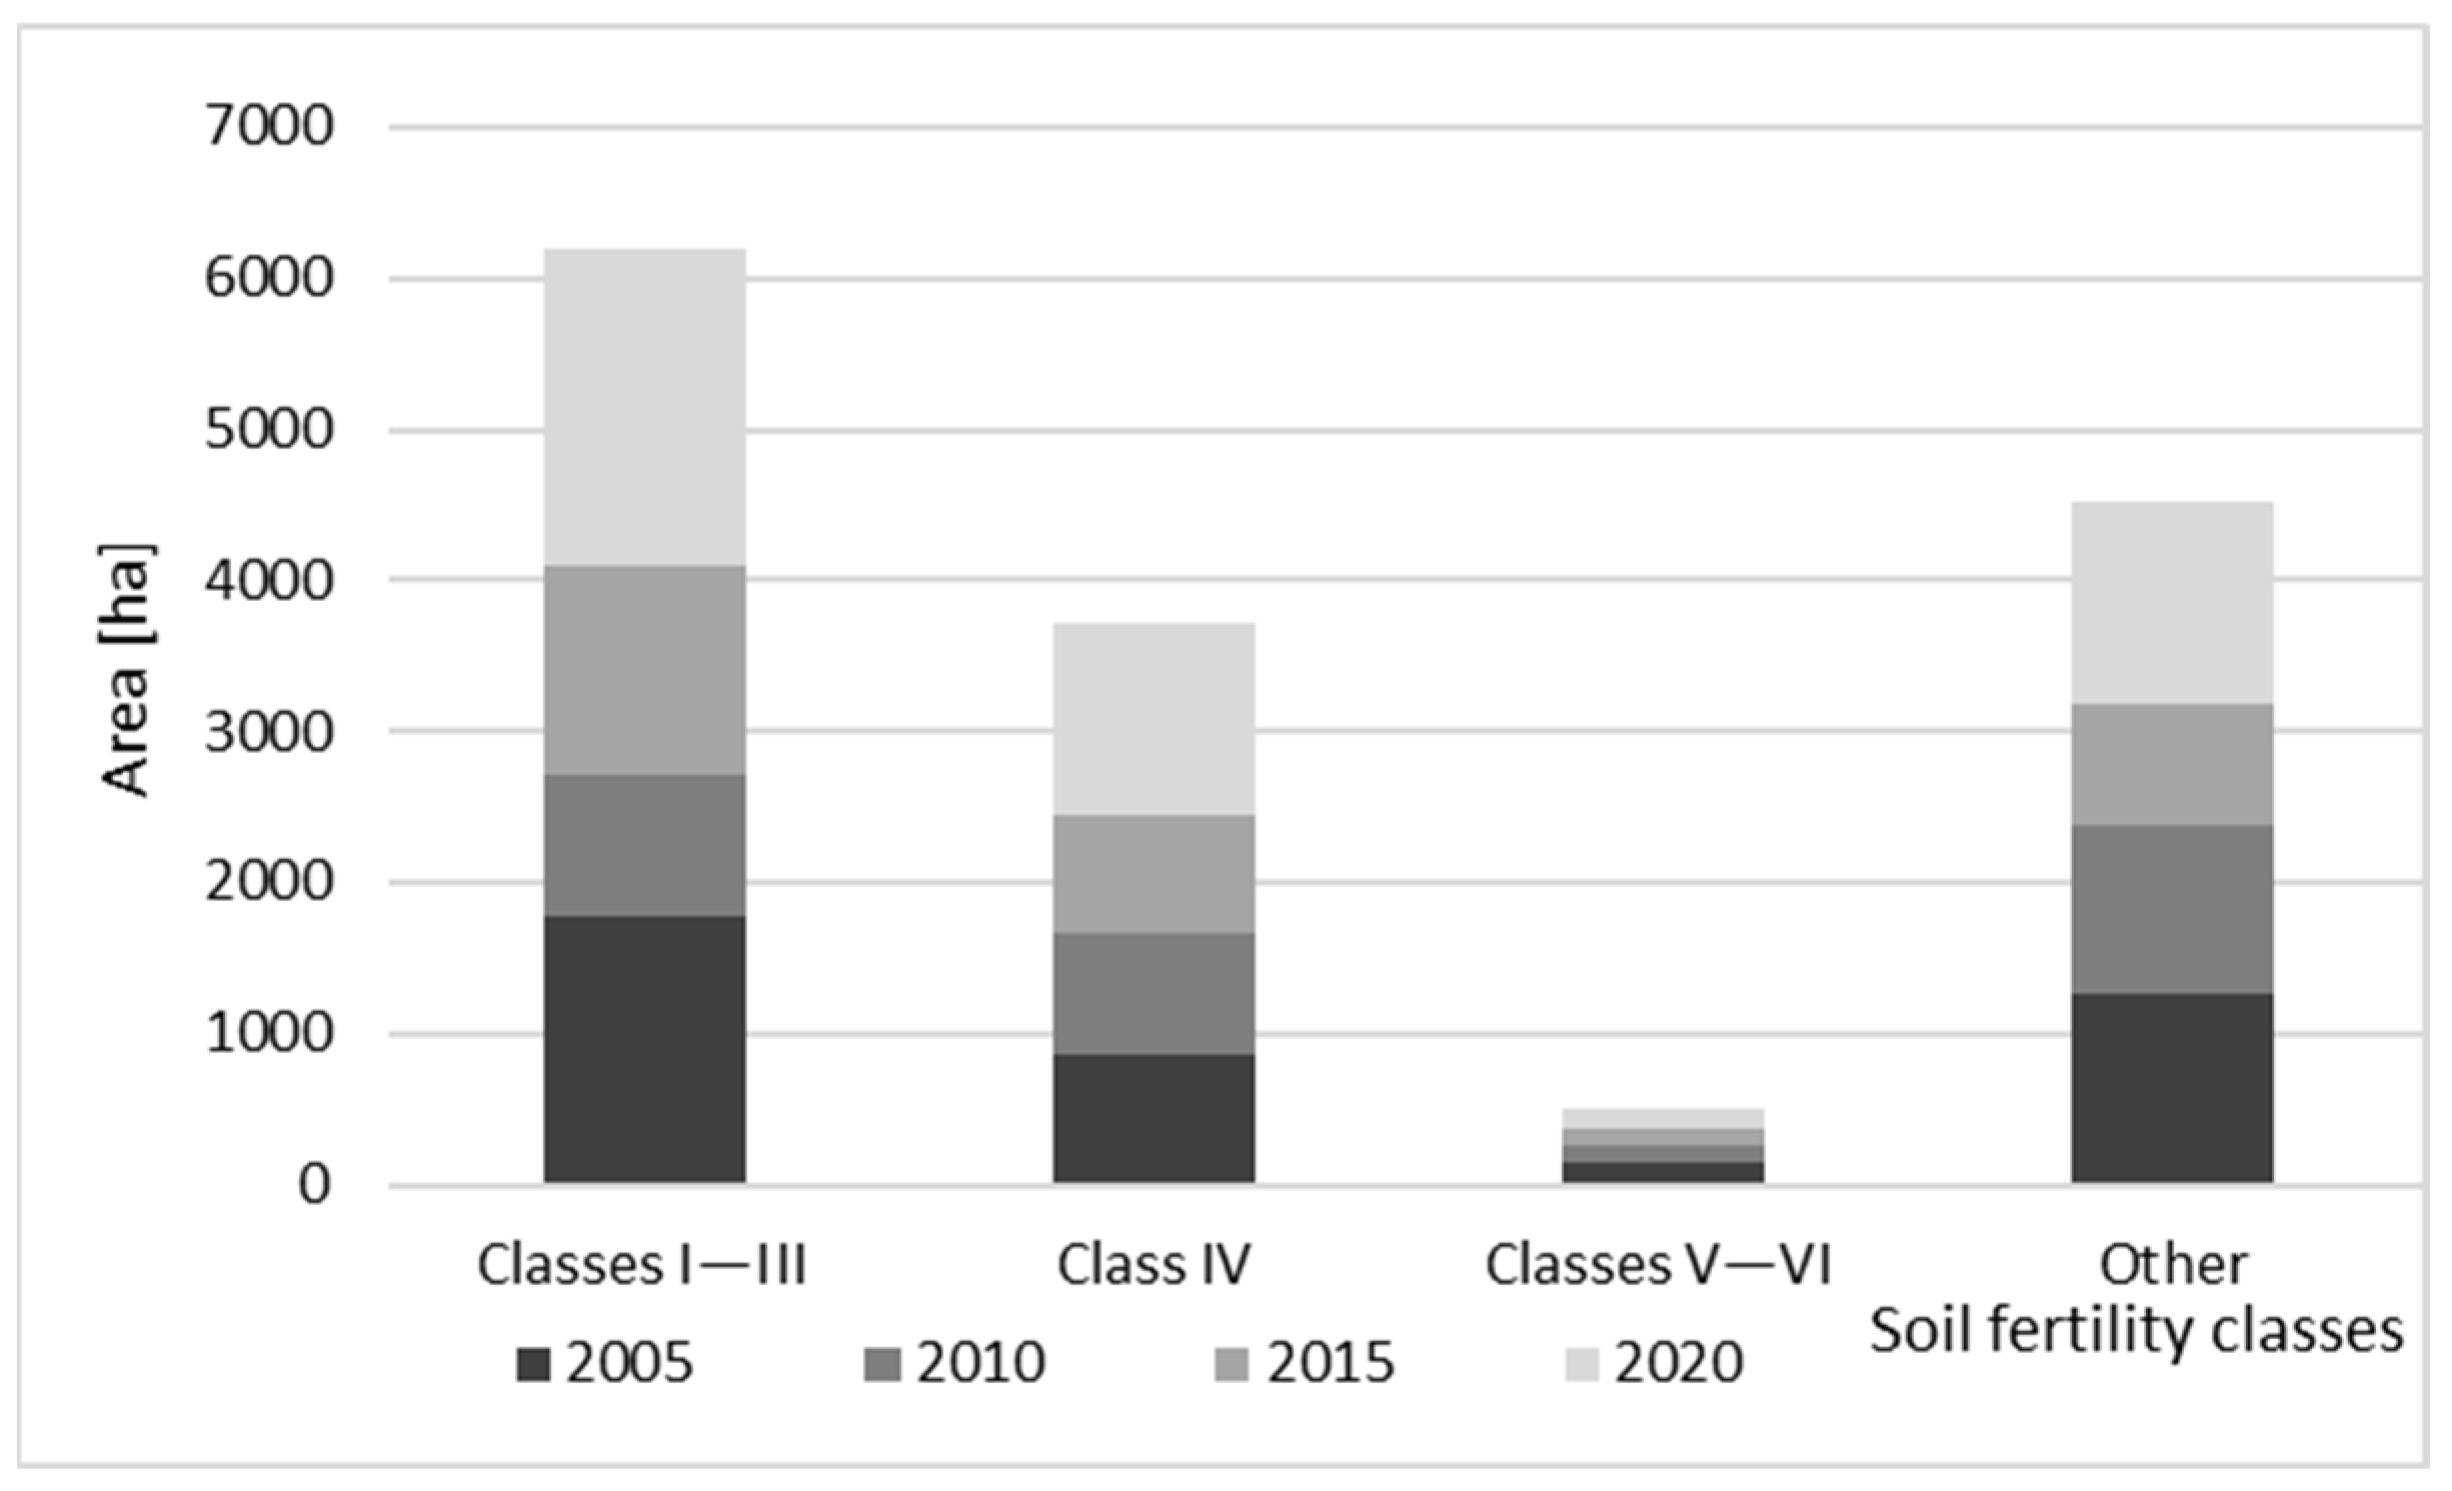
3.1. Overwiew of Land Protection Law and Land Take in Poland

The protection of agricultural and forest land dates back to the second decade of the 20th century. The first act comprehensively addressed agricultural and forest land protection, and recultivation was enacted on October 26, 1971 [36], and although it was preceded by several legal regulations (e.g., the Act of on the State Forestry of 1949, amended in 1960; the Spatial Planning Act of 1961), it laid the foundations for the effective protection of forest and agricultural land for decades. Its beneficiary is the Act of 3 February 1995, on the Protection of Agricultural and Forest Land [37], which is in force to this day. The Act of 1995 adapted most of the protection arrangements included in the Act of 1971, thus ensuring suitable and comprehensive preservation of agricultural and forest land. Unfortunately, its subsequent amendments in the years 1997, 2002, 2009 and 2013 led to the minimization of certain restrictions, or even their removal, due to national policy aiming to accelerate the economic development of the country. The aforementioned changes included, inter alia, lowering or abolishing mandatory fees for excluding agricultural and forest land from production (1997, 2002) and enabling the location of residential buildings and other important public investments on fertile agricultural land (2009, 2014). The uncontrolled conversion of forests and agricultural land into built-up areas is largely prevented by the Spatial Planning Act adopted in 2003 [38], as it requires local authorities to indicate in Studies and local spatial management plans the agricultural and forest areas that can be used for urban development. Pursuant to the provision of Art. 4 of the 2003 Act, the conversion of undeveloped areas into built-up areas should be determined by a decision of the competent authority.
Agricultural land in 2005 covered an area of 19.15 million ha, i.e., 61.2% of the total country area. In the years 2010 and 2015, agricultural area decreased slowly, by 217,237 ha and 248,165 ha, constituting 59.8% and 59.9% of the Poland territory, correspondingly. In 2020, the area covered by agricultural land increased by 58,686 ha compared to 2015 (by 0.01%). Nine out of sixteen provinces have a higher share of agricultural land than the national average (59.6%), with Łódzkie having the highest value of 70.4%.
Analysis of the conversion of agricultural land (Table 1) in the subsequent periods indicated an upsurge in land consumption in 2015 by 10.5% as compared to 2005, and then a reduction to 308,075 ha, i.e., 85.5% of arable land, in 2005. Contrary to agricultural land, forest area gradually, albeit slowly, increased, which is related to the afforestation policy adopted by the Polish Parliament in 1995 and the implementation of the Act of 8 June 2001 on the Allocation of Agricultural Land for Afforestation. In the analyzed years, the percentage share of forests increased from 29.1% in 2005 to 30.2% in 2020. The most forested province is Lubuskie, located in the western part of Poland, with a forest cover of 50.9%, i.e., 1.7 times the national average. The least, however, is Łódzkie, situated in central Poland, with a forest share of 21.6%.
The area excluded from agricultural and forestry production—2750 ha—was mainly transformed into residential area; and industrial areas—934 ha, 144 ha—were converted into transportation areas (Figure 2).
The permissible conversion of agricultural and forestry land to other uses varies strongly between the years analyzed, taking the lowest average value of the aLT coefficient in the year 2020 and the highest in 2015, equal to 2.27 and 2.80 correspondingly (see Figure 3). The largest variation in aLT values between provinces occurred in 2015, as indicated by the range (6.60), relative standard deviation (RSD = 14.72%) and coefficient of variation (CV = 118.57%). In contrast, the lowest variation was observed in 2005, shortly after Poland’s accession to the EU, with values of 3.76, 10.23% and 41.28%, respectively. The aLT values in 2020 are characterized by moderate descriptive statistical parameters, i.e., range is 4.29, RSD 13.37% and CV 86.94%.
Figure 4a,b show the conversion of agricultural land for housing development in Bemowo, a peripheral district of Warsaw. It should also be mentioned that this area is characterized by fertile soils mainly used for vegetable production for the Warsaw market, while Figure 4c,d portray forest land loss to transport infrastructure.
The large area of high-quality soils (classes I–III) excluded from production covers more than 6000 ha (see Figure 5), indicated the low effectiveness of the provisions of the 1995 Act on the protection of agricultural land and forest [37]. The restrictions introduced by the 1995 Act, including fees, were insufficient to inhibit land take, especially since the act was amended in 1997, and the fees for agricultural and forest land conversion for housing and other public investments, serving the needs of the local community, were abolished. Furthermore, the set of public purposes was significantly enlarged in 2010, which resulted in an increase in taking high-quality land for non-agricultural purposes. These regulations have remained in force to this day.
aLT values in 2005 are mainly concentrated around the mean, while in 2015, they were widely dispersed, as indicated by variance, standard deviation and the coefficient of variation (CV). The latter takes the values of 40.9, 45.2, 58.9 and 53.9 for the years 2005, 2010, 2015 and 2020, respectively. Furthermore, a negative kurtosis value (−1.49) designates a relatively low concentration of the index value in 2010, while a kurtosis value close to zero in 2005 (0.22) denotes a statistical distribution of aLT values close to the normal distribution.
Land consumption is inextricably linked to total population, with a Pearson’s r coefficient (significant at p < 0.05000) of 0.67; urban population (0.52); area of newly completed housing (0.65); urbanization rate; R&D expenditure (0.64); and EU Structural and Cohesion Funds 2014–2020 (0.64). There is also a positive linear correlation between aLT and road density (0.56) and GDP per capita (0.47). Land consumption measured by aLT and soil fertility show a negative but insignificant linear relationship (−0.27).

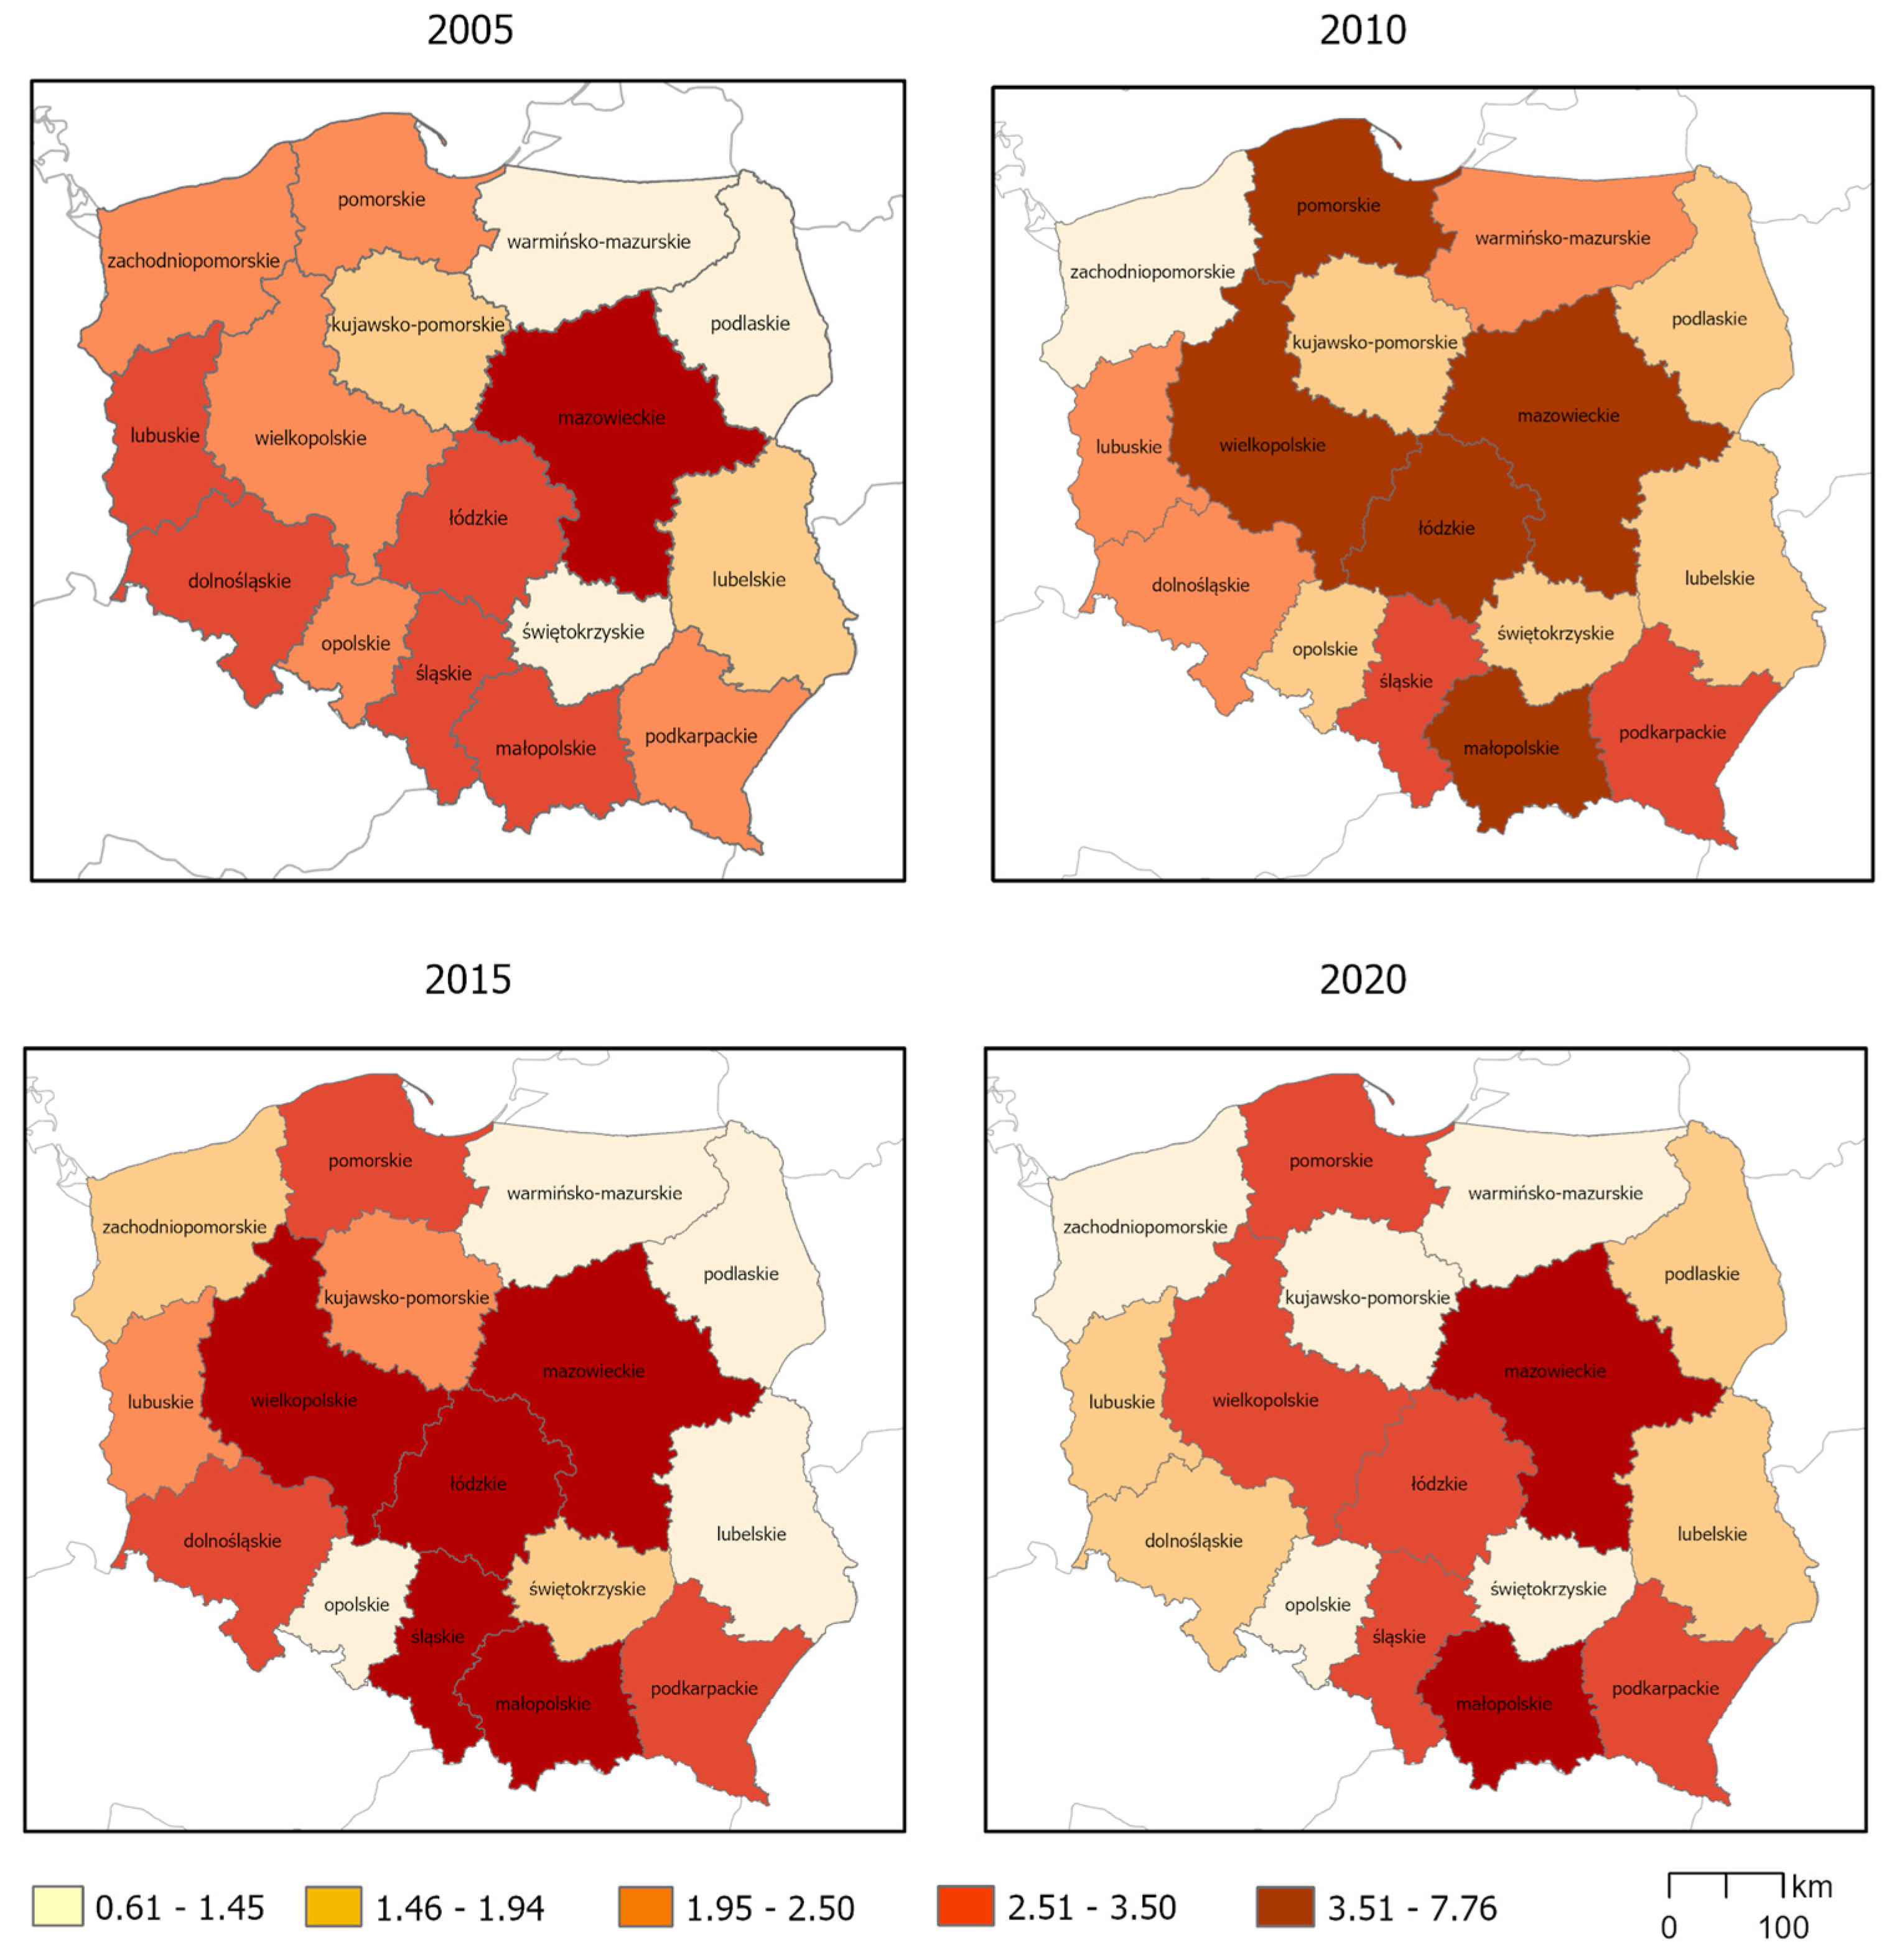
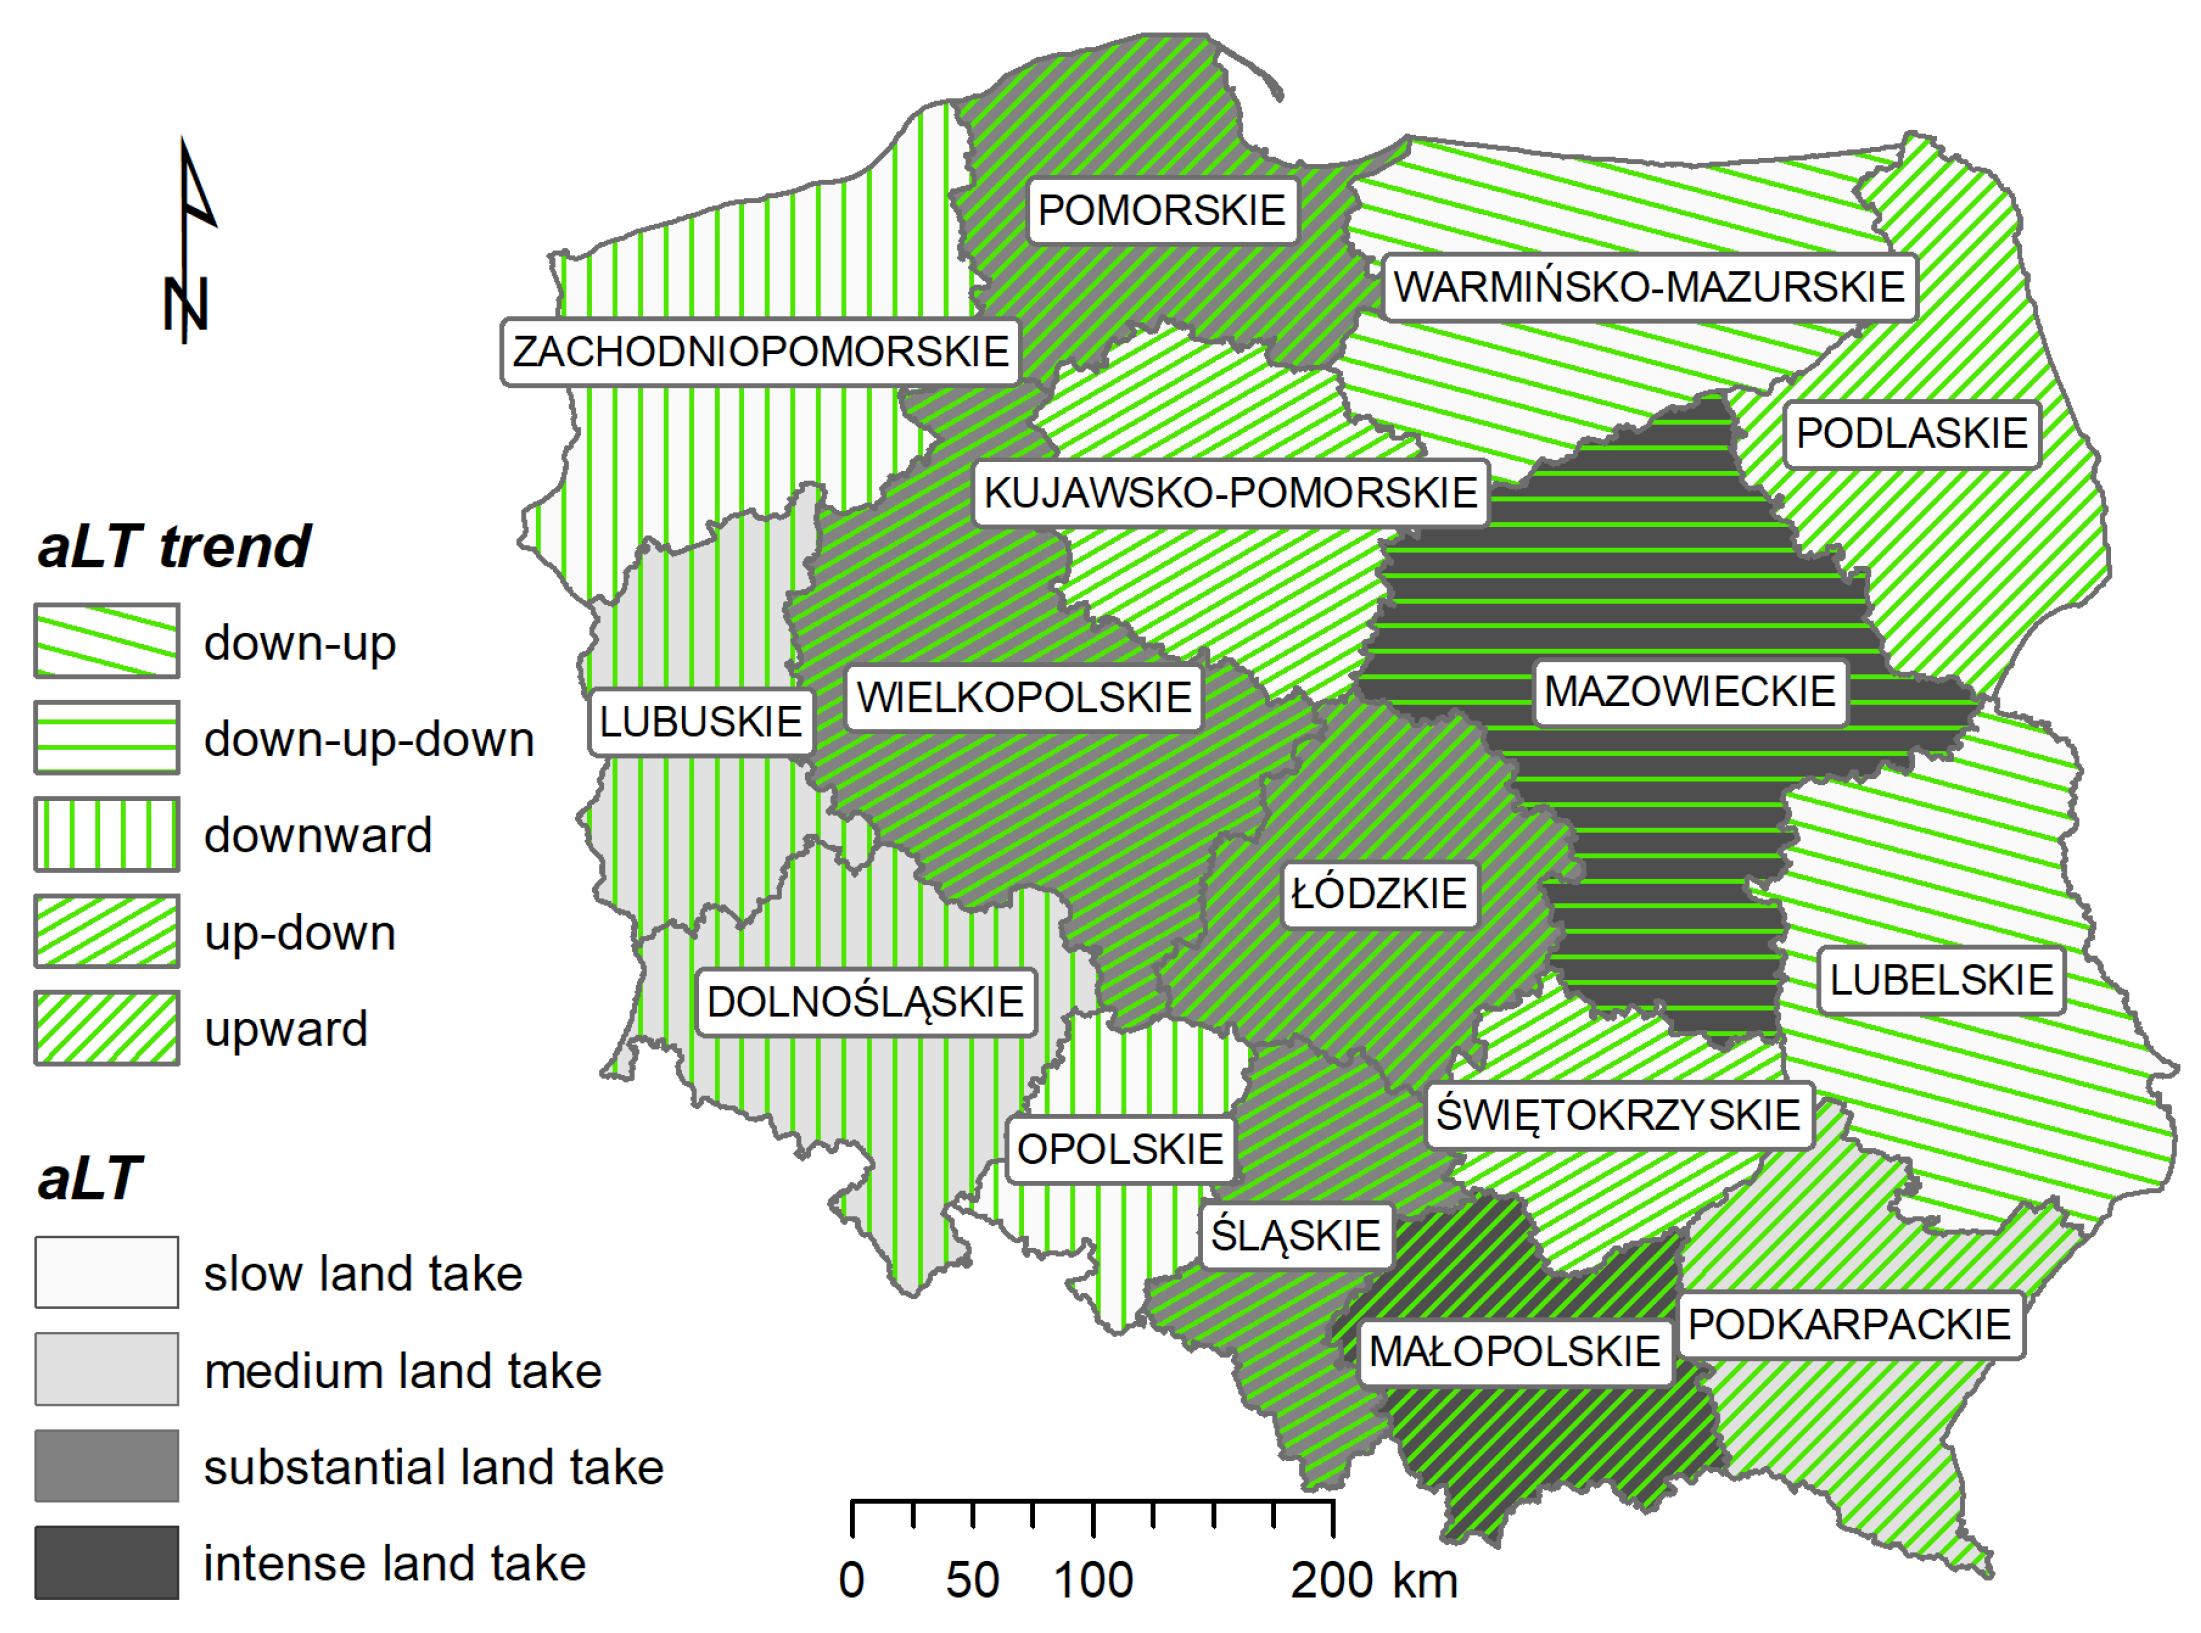
3.2. Land Take Analysis—Variability and Diverity at the Province Level

Mazowieckie and Wielkopolskie are the two provinces with the largest area of agricultural land earmarked for housing and transport network development in each of the years analyzed, constituting an average of 18.6% and 13.1% of the total area of land intended for ‘de-agriculture’. In Wielkopolskie, furthermore, large-scale exclusions of agricultural land from production were associated with opencast lignite mining. The lowest percentage of intended exclusions of agricultural land from production took place in Opolskie and Świętokrzyskie (approximately 2.0%). Mazowieckie also entitled the highest proportion of forests to be taken out of production, mainly for transport infrastructure, residential and industrial service development. Planned deforestation ranged from a low of 20.6% in 2010 to a high of 29% in 2020 of total deforestation. The lowest potential deforestation, oscillating between 2.1% and 2.4%, was recorded in the Świętokrzyskie, Kujawsko-Pomorskie and Podlaskie provinces. The disparity in the area of agricultural and forest land taken out of production in the provinces and subsequent years clearly influenced the statistical and geographical discrepancy in the aLT coefficient values listed in Table 3. And although the spatial distribution of the aLT coefficient shows randomness, as measured by the Global Moran I index, indicating that no neighbouring provinces have similar aLT values (neither low nor high), and groups of provinces are clearly visible when the coefficient values are aggregated in the choropleth maps (Figure 6).
The demand for new land for infrastructure and development varies across provinces and analyzed periods (Figure 6). Only Mazowieckie always has the highest aLT value (see Table 3). In 2005, relatively high values, between 2.5 and 3.5, were also recorded in five provinces located in the western and southern parts of the country. These are Dolnośląs-kie, Lubuskie, Łódzkie, Małopolskie and Śląskie. Five and ten years later, the demand for new land allocated for development and infrastructure is changing quite substantially. One-third of the provinces have achieved high coefficient values, over 3.5. In both periods, the highest values were recorded, in Mazowieckie, Wielkoposkie, Łódzkie, and Małopolskie. Moreover, the highest value of agricultural and forest land losses, amounting to over 7.7%, was recorded in 2015 in Małopolskie (see Table 3). In the year 2015, a significant reduction in the exclusion of agricultural and forest land from production in Zachodnio-Pomorskie was observed, ongoing until 2020. In contrast, the percentage of the de-agriculture and deforested land in the eastern, economically underdeveloped regions of Podlaskie and Lubelskie increased, from 0.51 in 2005 to 1.85 in 2020.
Figure 7 pointed out Małopolskie and Mazowieckie as the provinces where agricultural and forest loss is the highest, amounting to 5.24 and 4.20 correspondingly. Mazowieckie is a capital province, located in the center of the country, with a high degree of urbanization. In addition to the constantly expanding capital and other large cities, several key communication routes run through the region, which have been intensively modernized since the EU accession. Małopolskie province, with its capital in Kraków (almost one million inhabitants), plays the role of an important metropolitan area; hence, its economic development is linked to the expansion of the road network as well as residential, service, and industrial development. As one of the five provinces, Małopolskie is characterized by a growing aLT trend during the analyzed period; the other four are Podkarpacie, Pomorskie, Podlaskie. Łódzkie. The text continues here (Figure 2 and Table 2). The downward trend of the aLT coefficient is recorded in four provinces, i.e., Zachodnio-Pomorskie, Lubuskie, Dolnośląskie and Opolskie, located along the country’s western border. Furthermore, Zachodnio-Pomorskie and Opolskie are characterized by slow land take, while Lubuskie and Dolnośląskie are characterized by medium loss of agricultural and forest land.
The average values of permissible land take in the provinces in the years 2005–2020 (highlighted in dark grey in Figure 7) are observed in the four provinces arranged in a meridional direction, i.e., in the regions crossed by the A1 motorway (built between 2005 and 2022).

4. Discussion

Land take for many decades has been an extremely important research issue worldwide. Over the last century, European agriculture has been the scene of several important socioeconomic and environmental developments and crises. Therefore, an understanding of the historical drivers of agricultural change helps to identify potential for steering future pathways of agricultural development [2]. So far, long-term drivers have been studied, e.g., in random local case studies or in systematic literature reviews [3,5,6].
In Poland, which has been struggling with profound economic and political changes since the 1990s, the land exclusion from agricultural and forestry production is a topic that continues to attract scientists, public authorities, and planners. The publications concern legal and procedural aspects of land conversion [39] as well as the amount of land take and their multiple effects [30]. Noszczyk [40] emphasizes that after 1990 and the socio-political changes in Poland, rational land management and sustainable development have become an important issue for socioeconomic development. The constantly changing acreage of land use requires monitoring, which remains an important topic for local authorities and planners. Authors contest the effectiveness of legal acts protecting agricultural land and forests, in particular the Act on spatial planning and development [38] and the Act on the protection of agricultural and forest land [37], and note that both on a local and national scale, when deciding to exclude agricultural and forest land from production, the economic factor prevails over the environmental one. Śleszyński et al. [41] noted that uncontrolled urbanization, contrary to the provisions of local spatial plans and Studies, promotes spatial chaos and unsustainable land management. Prus [42] and Kurowska et al. [43] state that forests are more rigorously protected than agricultural land, yet their protection dates to the 1920s. Furthermore, they state [43] that many of the key amendments to the above-mentioned Acts [38,39], concerning conversion limits and fee increases, strengthen the protection of agriculture and forests. Nevertheless, according to Mackiewicz and Motek [44] and Świdziński [45], fees for land conversion, which, intentionally, according to the legislator’s assumptions, should constitute an obstacle in the uncontrolled conversion of agricultural and forest land, supply the local budgets with additional amounts, which, unfortunately, could be not conducive to land protection. Among the reasons for the loss of agricultural land, the authors also mention the liberalization of legislation, e.g., [40,44,45]. The amendment to the Act on the Protection of Agricultural and Forest Land of 2008 (1995) added a provision stating that restrictions on the use of land for non-agricultural purposes do not apply to agricultural land located within the administrative boundaries of cities, which significantly increased the conversion of agricultural land to urbanized areas [46]. On the other hand, as noted by Bański and Kamińska [27], the pursuit of many European environmental programmes ensured the reforestation of a large amount of low-quality agricultural land, as production became unprofitable. The main drivers have been the introduction of new technologies, developments in agricultural markets that have led farmers to increase farm size and optimize technology, and agricultural policies, but also cultural aspects such as cooperation and intergenerational arrangements. However, there is considerable heterogeneity in the specific influence of individual drivers across study sites, suggesting that generic assumptions about the dynamics and impacts of European drivers of agricultural change have limited explanatory power at the local scale [10]. Some results [10,11,12,16,26,27,40,45] suggest that site-specific factors and their historical development need to be considered when addressing the future of European agriculture in a scientific or policy context.
Extremely important, though exceptionally mentioned in the literature on the field, is semantic plasticity, leading in many cases to inconsistency and incomparability of research results. Among analyzed papers, Kwartalnik-Pruc [39] drew attention to the problem of an excessively general definition of land use types, which hinders the application of legal provisions in practice, and suggested the need to clarify the land use nomenclature. However, this problem does not only concern land use classification in Poland, as it was discussed in relation to many datasets and indicators based on land use/land cover information, both geographical and statistical. Marquard et al. [47], as well as Bielecka and Jenerowicz [48], emphasized that “a clearer conceptualization” of land take and related key terms could simplify an understanding of the problem and facilitate monitoring and communication within and between countries.
The average decline in the takeover of agricultural and forest land from 2.15% to 1.64 confirms that the economic growth assumed by the Polish government, mainly related to the modernization of road infrastructure and the expansion of residential, industrial and commercial areas, has been achieved, and Poland is slowly approaching goals set by COM (2011) 571 and Agenda2030. Similar conclusions were set up by other studies concerning Poland. Regional diversity in land take was noted, inter alia, by Kurowska et al. [43], Prus [14], Calka at al. [13]. Bielecka at al. [49] and Śleszyński [50]. One of the key factors for economic development and land take for artificial area is EU funding, as evidenced by a strong positive linear relationship, and the findings of research conducted by Leśniewska-Napierała et al. [51] and Nadolny [52]. Furthermore, aLT values in provinces are influenced by the provision of the key strategic document that addresses spatial planning and management in Poland, namely National Spatial Development Concept 2030 (NSDC 2030) [53]. The NSDC determines the extent to which the concept contributes to the regions’ development, supporting important public investment development. Śleszyński [50] estimated that the number of municipalities that could apply for the exclusion of agricultural land from agricultural production due to the entry into force of the proposed amended Law on Planning and Spatial Development vary from 321 to 1343 (i.e., 14.8–61.7% of non-urban municipalities). Eventually, Śleszyński [50] concluded that the scale of expected land exclusion could be very large, occurring in up to one in two non-urban municipalities. This points to the need for the careful formulation of regulations to promote rational and efficient land use and spatial organization.
As most investments take place in the vicinity of large cities and a dense settlement network, the aLT values are high in regions such as Mazowieckie, Małopolskie, Łódzkie and Wielkopolskie and relatively low on the so-called eastern wall, i.e., Podlaskie and Lubelskie. The development of the latter two regions in 2006–2018, following Bielecka et al. [49], can be described as close to sustainable, according to the LUE indicator of the 2039 Agenda SDG 11 target 11.3.1. Krool et al. [51] found that Austria and Argentina only achieved SDGs, while most Asian countries managed to overcome major changes to achieve these goals. Furthermore, the authors [51] investigated that the correlation between gross domestic product (GDP) per capita and SDGs varies from 0.33 to 0.73, depending on the specific goal.
Based on an in-depth study of the influence of EU subsidies on land use change in Poland, Leśniewska-Napierała et al. [52] found that the diagnosed effects are generally negative. That is, the less urbanized and developed the areas, the greater the changes in land cover. Nevertheless, the most inaccessible part of Poland in terms of transport, the Zachodnio-Pomorskie province, is characterized by a positive relationship between land cover changes and the absorption of EU funds. It can be concluded that in most peripheral and relatively less developed regions, any intensification of urbanization processes, economic development and any external support in the form of EU funds can significantly stimulate land cover changes. Nadolny [53] shows that the key factors determining the diversification of the distribution and concentration of the development potential of the provinces in Poland have taken different directions. Most regions, especially those with a medium and high level of economic development, are characterized by a dynamic growth of 5% to 6% per year, simultaneously reducing the distance to the most developed province Mazowieckie. The author of [53] concluded that by 2020, these trends would remain unchanged, but regions with a moderately low level of development would experience the fastest growth. The results of Nadolny [53] are consistent with the land consumption measured by aLT. It is worth mentioning that the National Spatial Development Plan 2030 [54], the most important document regarding the spatial order of Poland [53], assumes, inter alia, sustainable development of regions while maintaining the high quality of the natural environment and landscape values of Poland. Since human settlements are generally surrounded by fertile cropland, build-up expansion took place predominantly at the expense of arable land [55].
Our research, like most studies, has some limitations. The most important of these relates data, namely data scarcity. Moreover, data are only publicly available for provinces. The relatively small number of provinces (16) did not allow for the use of inferential statistics to estimate the impact of factors on the amount of land take.
Foley et al. [6] warned that halting unprecedented land take to move towards sustainable development requires decision making and policy action on many geographic scales and in many ecological dimensions. Land take at local sites hypothetically causes ecological degradation not only on a local scale, but also on a regional and global. Society faces the challenge of developing strategies that reduce the negative environmental impacts of land take while maintaining the social and economic benefits. However, as found by Wolff at al. [56], land consumption, especially considering conflict with growing food production demands, are largely unexplored.
Agriculture remains a key driver or subject of broad socioeconomic and environmental megatrends and challenges. In the face of climate change, environmental degradation and an ageing population, among other challenges, most European regions are under increasing pressure to transform their agricultural practices [57]. Our research therefore contributes to scientific advancement in this field.

5. Conclusions

There is a growing need for accountability for sustainable development at every level, from global to local, and society is increasingly concerned about the unnecessary negative environmental impacts of agricultural land and forests conversion into urban areas. The holistic nature of the sustainable development idea implies that dominant land use types such as agricultural, forest and built-up areas should be of utmost concern of national and local policy. Hence, the economic development of the country should consider the protection of valuable resources such as agricultural land and forests. Nevertheless, the constant demand for built-up area evokes losses of agriculture farmland and forest, which is highlighted by topical studies from local throughout national to global.
This study provides an overview of the transformation of agricultural and forest land into urbanized areas in Poland, a Central European country with a centrally planned, socialist economy up until 1990. This has resulted in, among other things, a poor-quality transport infrastructure and a severe housing shortage. After joining the EU (in 2004), thanks to the Structural and Cohesion Funds, the period of expansion of the road network and the development of housing began. Unfortunately, all projects related to the development of urbanized areas took place on de-agricultural or deforested land.
In Poland, land take ranges from 1% to over 7% depending on the year and geographical region. The regional diversity and variability of land take through the years, expressed in aLT coefficient, allow one to assess if the intended conversion of agriculture and forest land into artificial area is in line with the requirement of sustainable and responsible development, and hence could be characterized as “fit for purpose” land management.
The analyses carried out can be extended by using the Location Quotient (LQ) for the land take analysis, with multipliers depending on the drivers analyzed. An LQ is a simple measure of the spatial concentration of land take based on land consumption, calculated as the ratio of the local land take share of the total local land take share to this share in a larger area.

Funding

This research was funded by the Military University of Technology, Faculty of Civil Engineering and Geodesy, grant number 531-4000-22-816.

Institutional Review Board Statement

Not applicable.

Informed Consent Statement

Not applicable.

Data Availability Statement

Raw statistical data were derived from Local Data Bank maintained by the Central Statistical Office (GUS) at the https://bdl.stat.gov.pl/bdl/start (access on 20 October 2023). Other data are available on demand.

Acknowledgments

I would like to thank Karolina Kłos, a graduate of the Military University of Technology, Faculty of Civil Engineering and Geodesy, who helped me collect statistical data.

Conflicts of Interest

The author declares no conflicts of interest.

References

  1. Gerten, C.; Fina, S.; Rusche, K. The Sprawling Planet: Simplifying the Measurement of Global Urbanization Trends. Front. Environ. Sci. 2019, 7, 140. [Google Scholar] [CrossRef]
  2. van Vliet, J.; Eitelberg, D.A.; Verburg, P.H. A global analysis of land take in cropland areas and production displacement from urbanization. Glob. Environ. Chang. 2017, 43, 107–115. [Google Scholar] [CrossRef]
  3. Bielecka, E. GIS Spatial Analysis Modeling for Land Use Change. A Bibliometric Analysis of the Intellectual Base and Trends. Geosciences 2020, 10, 421. [Google Scholar] [CrossRef]
  4. European Environment Agency (EEA). Land Take in Europe. Indicator Assessment. Available online: https://www.eea.europa.eu/data-and-maps/indicators/land-take-3/assessment (accessed on 28 May 2022).
  5. Lambin, E.F.; Turner, B.L., II; Geist, H.; Agbola, S.; Angelsen, A.; Bruce, J.W.; Coomes, O.; Dirzo, R.; Fischer, G.; Folke, C.; et al. Our emerging understanding of the causes of land-use and -cover change. Glob. Environ. Chang. 2001, 11, 261–269. [Google Scholar] [CrossRef]
  6. Foley, J.A.; DeFries, R.; Asner, G.P.; Barford, C.; Bonan, G.; Carpenter, S.R.; Chapin, F.S.; Coe, M.T.; Daily, G.C.; Gibbs, H.K.; et al. Global consequences of land use. Science 2005, 309, 570–574. [Google Scholar] [CrossRef] [PubMed]
  7. UN Secretary-General, World Commission on Environment and Development & Brundtland Commission. Our Common Future, Brundtland Report. In Proceedings of the Report of the World Commission on Environment and Development to the Commission of the European Communities, the EC and EFTA Countries, Brussels, Belgium, 5 May 1987; World Commission on Environment and Development: Brussels, Belgium, 1987. Available online: https://sustainabledevelopment.un.org/content/documents/5987our-common-future.pdf (accessed on 30 May 2022).
  8. European Commission (EC). Communication from the Commission to the European Parliament, the Council, the European Economic and Social Committee and the Committee of the Regions Roadmap to a Resource Efficient Europe. COM/2011/0571. Available online: http://eur-lex.europa.eu/legal-content/EN/TXT/?uri=CELEX:52011DC0571 (accessed on 30 May 2022).
  9. European Commission (EC). Science for Environment Policy. In Future Brief: No Net Land Take by 2050? European Commission: Brussels, Belgium, 2016; p. 4. Available online: https://ec.europa.eu/environment/integration/research/newsalert/pdf/no_net_land_take_by_2050_FB14_en.pdf (accessed on 30 May 2022).
  10. European Environment Agency (EEA). Urban Sprawl in Europe: The Ignored Challenge; Report No 10/2006; Office for Official Publications of the European Communities: Luxembourg, 2006; Available online: http://www.eea.europa.eu/publications/eea_report_2006_10 (accessed on 25 November 2023).
  11. Schiavina, M.; Melchiorri, M.; Corbane, C.; Freire, S.; Batista e Silva, F. Built-up areas are expanding faster than population growth: Regional patterns and trajectories in Europe. J. Land Use Sci. 2022, 17, 591–608. [Google Scholar] [CrossRef]
  12. Seto, K.C.; Sánchez-Rodríguez, R.; Fragkias, M. The New Geography of Contemporary Urbanization and the Environment. Ann. Rev. Environ. Resour. 2010, 35, 167–194. [Google Scholar] [CrossRef]
  13. Calka, B.; Orych, A.; Bielecka, E.; Mozuriunaite, S. The Ratio of the Land Consumption Rate to the Population Growth Rate: A Framework for the Achievement of the Spatiotemporal Pattern in Poland and Lithuania. Remote Sens. 2022, 14, 1074. [Google Scholar] [CrossRef]
  14. Bielecka, E.; Jenerowicz, A.; Pokonieczny, K.; Borkowska, S. Land Cover Changes and Flows in the Polish Baltic Coastal Zone: A Qualitative and Quantitative Approach. Remote Sens. 2020, 12, 2088. [Google Scholar] [CrossRef]
  15. Wiatkowska, B.; Słodczyk, J.; Stokowska, A. Spatial-Temporal Land Use and Land Cover Changes in Urban Areas Using Remote Sensing Images and GIS Analysis: The Case Study of Opole, Poland. Geosciences 2021, 11, 312. [Google Scholar] [CrossRef]
  16. Noszczyk, T.; Rutkowska, A.; Hernik, J. Exploring the land use changes in Eastern Poland: Statistics-based modelling. Hum. Ecol. Risk Assess. Int. J. 2020, 26, 255–282. [Google Scholar] [CrossRef]
  17. Kurowska, K.; Marks-Bielska, R.; Bielski, S.; Aleknavičius, A.; Kowalczyk, C. Geographic Information Systems and the Sustainable Development of Rural Areas. Land 2021, 10, 6. [Google Scholar] [CrossRef]
  18. Bołtryk, P. Conversion of agricultural land into non-agricultural land in Poland. Ekon. Sr.-Econ. Environ. 2020, 72, 40–57. [Google Scholar] [CrossRef]
  19. Murray, A.T.; Church, R.L.; Pludow, B.A.; Stine, P. Advancing contiguous environmental land allocation analysis, planning and modelling. Journal of Land Use. Science 2022, 17, 572–590. [Google Scholar] [CrossRef]
  20. Decoville, A.; Schneider, M. Can the 2050 zero land take objective of the EU be reliably monitored? A comparative study. J. Land Use Sci. 2015, 11, 331–349. [Google Scholar] [CrossRef]
  21. Kaliszewski, A.; Jabłoński, M. Is It Possible for Poland to Achieve the Policy Goal of 33% Forest Cover by Mid-Century? Sustainability 2022, 14, 6541. [Google Scholar] [CrossRef]
  22. Ragnarsdóttir, K.V.; Banwart, S.A. (Eds.) Soil: The Life Supporting Skin of Earth: A Book on Soil for Secondary School Students; University of Sheffield: Sheffield, UK; University of Iceland: Reykjavík, Iceland, 2015; Available online: http://esdac.jrc.ec.europa.eu/projects/SoilTrec/Documents/SoilTrEC_SoilSchoolBook_FINAL.pdf (accessed on 1 June 2022).
  23. Haines-Young, R.; Potschin, M. The links between biodiversity, ecosystem services and human well-being. In Ecosystem Ecology: A New Synthesis; BES Ecological Reviews Series, Raffaelli, D., Frid, C., Eds.; Cambridge University Press: Cambridge, UK, 2010. [Google Scholar]
  24. Wiśniewski, L.Ł.; Rudnicki, R.; Chodkowska-Miszczuk, J. What non-natural factors are behind the underuse of EU CAP funds in areas with valuable habitats? Land Use Policy 2021, 108, 105574. [Google Scholar] [CrossRef]
  25. Węcławowicz, G.; Bański, J.; Degórski, M.; Komornicki, T.; Korcelli, P.; Śleszyński, P. Spatial Organization of Poland at the Beginning of the 21st Century; Monografie, 6; IGiZP Polish Academy of Sciences: Warszawa, Poland, 2006. [Google Scholar]
  26. Jhariya, M.K.; Banerjee, A.; Meena, R.S.; Yadav, D.K. Agriculture, Forestry and Environmental Sustainability: A Way Forward, In Sustainable Agriculture, Forest and Environmental Management; Jhariya, M., Banerjee, A., Meena, R., Yadav, D., Eds.; Springer Nature: Singapore, 2019; pp. 1–29. [Google Scholar] [CrossRef]
  27. Bański, J.; Kamińska, W. Trends for agricultural land-use in the CEECs following the collapse of the Eastern Bloc. Land Use Policy 2021, 112, 105794. [Google Scholar] [CrossRef]
  28. Frédéric, S. EU Commission Unveils ‘European Green Deal’: The Key Points. Available online: http://www.euractiv.com (accessed on 4 June 2022).
  29. Ustaoglu, E.B.; Williams, B. Determinants of urban expansion and agricultural land conversion in 25 EU countries. Environ. Manag. 2017, 60, 717–746. [Google Scholar] [CrossRef]
  30. Roszkowska-Mądra, B. Analiza zmian użytkowania gruntów rolnych w Polsce po 1990 roku. In Instytucjonalne i Strukturalne aspekty Rozwoju Rolnictwa i Obszarów Wiejskich. Księga Poświęcona Pamięci dr Hab. Adama Sadowskiego Profesora Uniwersytetu w Białymstoku; Przygodzka, R., Gruszewska, E., Eds.; Wydawnictwo Uniwersytetu w Białymstoku: Białystok, Poland, 2020; pp. 183–199. [Google Scholar]
  31. GUS. Statistical Yearbook of the Republic of Poland; Główny Urząd Statystyczny, Zakład Wydawnictw Statystycznych: Warsaw, Poland, 2021. [Google Scholar]
  32. GUS—Bank Danych Lokalnych. Available online: https://bdl.stat.gov.pl/bdl/start# (accessed on 20 October 2023).
  33. Czyż, T. Metoda wskaźnikowa w geografii społeczno-ekonomicznej. Rozw. Reg. Polityka Reg. 2016, 34, 9–19. [Google Scholar]
  34. Werner, P.A.; Kaleyeva, V.; Porczek, M. Urban Sprawl in Poland (2016–2021): Drivers, Wildcards, and Spatial Externalities. Remote Sens. 2022, 14, 2804. [Google Scholar] [CrossRef]
  35. Moran, P. Notes on continuous stochastic phenomena. Biometrika 1950, 37, 17–23. [Google Scholar] [CrossRef]
  36. Act on 26 October of 1971 on Agricultural, Forest Land Protection and recultivation. J. Laws 1971, 27, 249.
  37. Act of 3 February 1995 on the Protection of Agricultural Land and Forest. J. Laws 2017. 1161 as amended.
  38. Act of 27 March 2003 on Spatial Planning and Management. J. Laws 2003, 80, 717.
  39. Kwartalnik-Pruc, A. Exclusion of Land from Agricultural and Forestry Production. Practical Problems of the Procedure. Geomat. Environ. Eng. 2011, 5, 69–77. [Google Scholar]
  40. Noszczyk, T. Land Use Change Monitoring as a Task of Local Government Administration in Poland. J. Ecol. Eng. 2018, 19, 170–176. [Google Scholar] [CrossRef] [PubMed]
  41. Śleszyński, P.; Kowalewski, A.; Markowski, T.; Legutko-Kobus, P.; Nowak, M. The Contemporary Economic Costs of Spatial Chaos: Evidence from Poland. Land 2020, 9, 214. [Google Scholar] [CrossRef]
  42. Prus, B. Trends of Agricultural and Forest Land Use Changes in Poland. Acta Sci. Pol. Geod. Descr. Terrarum 2012, 11, 27–40. [Google Scholar]
  43. Kurowska, K.; Kryszk, H.; Marks-Bielska, R.; Mika, M.; Leń, P. Conversion of agricultural and forest land to other purposes in the context of land protection: Evidence from Polish experience. Land Use Policy 2020, 95, 104614. [Google Scholar] [CrossRef]
  44. Mackiewicz, B.; Motek, P. Wyłączenia gruntów rolnych z produkcji rolnej a dochody gmin z podatku od nieruchomości. Rozw. Reg. Polityka Reg. 2014, 28, 69–77. [Google Scholar] [CrossRef]
  45. Świdyński, J. Use and Protection of Agricultural Land in Poland, Russia and Ukraine. Zesz. Nauk. Szkoły Głównej Gospod. Wiej. W Warszawie. Probl. Rol. Swiat. 2016, 16, 344–350. [Google Scholar]
  46. Bąk, M.; Abramowicz, D. Zmiany kierunków użytkowania gruntów ze szczególnym uwzględnieniem użytków rolnych w miastach powiatu poznańskiego w latach 2010 i 2020. Rozw. Reg. Polityka Reg. 2021, 57, 129–145. [Google Scholar] [CrossRef]
  47. Marquard, E.; Bartke, S.; Gifreu i Font, J.; Humer, A.; Jonkman, A.; Jürgenson, E.; Marot, N.; Poelmans, L.; Repe, B.; Rybski, R.; et al. Land Consumption and Land Take: Enhancing Conceptual Clarity for Evaluating Spatial Governance in the EU Context. Sustainability 2020, 12, 8269. [Google Scholar] [CrossRef]
  48. Bielecka, E.; Jenerowicz, A. Intellectual Structure of CORINE Land Cover Research Applications in Web of Science: A Europe-Wide Review. Remote Sens. 2019, 11, 2017. [Google Scholar] [CrossRef]
  49. Bielecka, E.; Calka, B.; Dukaczewski, D. Towards inclusive and sustainable urbanization. Case study of land use efficiency in Poland. In Proceedings of the 8th International Conference on Cartography and GIS, Nessebar, Bulgaria, 14–19 June 2021; Bandrova, T., Konecny, M., Marinova, S., Eds.; Bulgarian Cartographic Association: Sofia, Bulgaria, 2021; Volume 2, pp. 17–24. [Google Scholar]
  50. Śleszyński, P. Oszacowanie wyłączeń gruntów rolnych z produkcji rolnej w Polsce. Stud. BAS 2023, 1, 21–45. Available online: https://studiabas.sejm.gov.pl (accessed on 4 November 2022). [CrossRef]
  51. Schmidt-Traub, G.; Kroll, C.; Teksoz, K.; Durand-Delacre, D.; Sachs, J.D. National baselines for the Sustainable Development Goals assessed in the SDG Index and Dashboards. Nat. Geosci. 2017, 10, 547–555. [Google Scholar] [CrossRef]
  52. Leśniewska-Napierała, K.; Nalej, M.; Napierała, T. The Impact of EU Grants Absorption on Land Cover Changes—The Case of Poland. Remote Sens. 2019, 11, 2359. [Google Scholar] [CrossRef]
  53. Nadolny, M. Pomiar poziomu koncentracji potencjału rozwojowego regionów w Polsce: Wartość i dynamika w latach 2010-2017 oraz prognoza do roku 2020. Biul. KPZK PAN 2019, 273, 44–58. [Google Scholar]
  54. KPZK2030. Uchwała Nr 239 Rady Ministrów z Dnia 13 Grudnia 2011 r. w Sprawie Przyjęcia Koncepcji Przestrzennego Zagospodarowania Kraju 2030. MONITOR POLSKI 2012, item. 252. Available online: https://isap.sejm.gov.pl/isap.nsf/DocDetails.xsp?id=WMP20120000252 (accessed on 10 November 2023).
  55. Kłos, K. Analiza Przekształcenia Gruntów Rolnych i Leśnych na Inne Cele w Kontekście Ochrony Gruntów z Uwzględnieniem Aspektów Przestrzennych i Prawnych. Master’s Thesis, Militari University of Technology, Warszaw, Poland, 6 July 2022. [Google Scholar]
  56. Wolff, S.; Schrammeijer, E.A.; Schulp, C.J.E.; Verburg, P.H. Meeting global land restoration and protection targets: What would the world look like in 2050? Glob. Environ. Chang. 2018, 52, 259–272. [Google Scholar] [CrossRef]
  57. Debonne, N.; Bürgi, M.; Diogo, V.; Helfenstein, J.; Herzog, F.; Levers, C.; Mohr, F.; Swart, R.; Verburg, P. The geography of megatrends affecting European agriculture. Glob. Environ. Chang. 2022, 75, 102551. [Google Scholar] [CrossRef]
Figure 1. Study area location.
Sustainability 16 01059 g001
Figure 2. Agricultural and forest land excluded from agricultural and forestry production according to the exclusion purposes.
Sustainability 16 01059 g002
Figure 3. Boxplot of selected aLT descriptive statistics at the country level.
Sustainability 16 01059 g003
Figure 4. Land take: Warsaw, capital city, Mazowieckie province: (a) 2005, (b) 2020; Garwolin city bypass, Mazowieckie province: (c) 2005, (d) 2020 (source: https://www.geoportal.gov.pl/, access on 20 October 2023).
Sustainability 16 01059 g004aSustainability 16 01059 g004b
Figure 5. Agricultural land taken out of production by soil fertility classes.
Sustainability 16 01059 g005
Figure 6. Choropleth maps of the aLT indicator values in provinces.
Sustainability 16 01059 g006
Figure 7. Groups of provinces according to harmonic mean value of aLT2005–2020.
Sustainability 16 01059 g007
Table 1. Conversion of agricultural land and forest according to the Studies (source: Local Data Bank [32]).
Agricultural Land Intended for Other Purposes in ha (%)Forest Intended for Other Purposes in ha (%)
Province/Year2005 2010201520202005201020152020
Poland360,360 (1.89)395,504 (2.09)402,576 (2.15)308,075 (1.64)23,370 (0.26)30,170 (0.33)37,041 (0.39)37,173 (0.39)
Dolnośląskie34,073 (2.83)29,883 (2.50)24,656 (2.08)12,766 (1.08)467 (0.08)1043 (0.17)452 (0.07)1524 (0.25)
Kujawsko-Pomorskie14,130 (1.19)18,725 (1.59)14,098 (1.21)13,229 (1.13)617 (0.15)932 (0.22)1140 (0.27)250 (0.06)
Lubelskie 26,853 (1.50)17,582 (0.99)22,283 (1.27)26,658 (1.51)1038 (0.18)1244 (0.22)903 (0.15)1336 (0.23)
Lubuskie13,849 (2.41)10,512(1.84)10,823 (1.92)7741 (1.36)555 (0.08)1557 (0.22)602 (0.08)322 (0.05)
Łódzkie 27,129 (2.07)32,477 (2.50)23,862 (1.86)26,834 (2.09)1533 (0.40)3659 (0.94)5412 (1.38)3541 (0.90)
Małopolskie24,946 (2.66)36,939 (3.94)52,624 (5.70)32,186 (3.51)1638 (0.37)861 (0.20)5570 (1.26)5319 (1.21)
Mazowieckie79,524 (3.22)66,746 (2.73)73,330 (3.07)53,616 (2.22)6280 (0.79)6214 (0.77)10,269 (1.24)10,797 (1.29)
Opolskie9715 (1.60)6865 (1.14)9035 (1.50)4177 (0.70)859 (0.33)232 (0.09)598 (0.23)524 (0.20)
Podkarpackie20,093 (2.06)19,836 (2.06)19,049 (2.03)21,073 (2.19)811 (0.12)2980 (0.44)3055 (0.45)3955 (0.57)
Podlaskie5831 (0.47)9765 (0,80)16,642 (1.37)15,335 (1.26)487 (0.08)442 (0.07)767 (0.12)963 (0.15)
Pomorskie13,507 (1.44)25,863 (2.78)26,585 (2.89)25,248 (2.75)2039 (0.30)1863 (0.27)1682 (0.25)1247 (0.18)
Ślaskie16,924 (2.59)16,637 (2.58)12,867 (2.05)9747 (1.56)953 (0.24)2981 (0.75)1358 (0.34)2698 (0.67)
Świętokrzyskie6880 (0.91)10,813 (1.43)8436 (1.12)6522 (0.86)758 (0.23)668 (0.20)807 (0.24)413 (0.12)
Warmińsko-Mazurskie 10,335 (0.77)13,816 (1.04)22,791 (1.74)16,038 (1.22)3471 (0.46)658 (0.09)443 (0.06)141 (0.02)
Wielkopolskie37,313 (1.91)62,775 (3.22)56,566 (2.92)36,838 (1.39)1043 (0.13)4204 (0.54)2378 (0.30)2914 (0.37)
Zachodniopomorskie19,258 (1.69)16,270 (1.44)8929 (0.80)10,067 (0.89)821 (0.10)632 (0.08)1605 (0.19)1229 (0.15)
Table 2. Province grouping rule.
aLT20052020 RangeaLT20052020 ValueDescription
aLT2005–2020     x ¯ − 0.5 × STD0 < aLT2005–2020 ≤ 1.93slow land take
x ¯     0.5   ×   STD   <   aLT2005–2020     x ¯ + 0.25 × STD1.94 < aLT2005–2020 ≤ 2.80medium land take
x ¯   +   0.25   ×   STD   <   aLT2005–2020     x ¯ + 0.75 × STD2.81 < aLT2005–2020 ≤ 3.39substantial land take
aLT2006–2020   >   x ¯ + 0.75 × STDaLT2006–2020 > 3.40intense land take
Table 3. Values of the admissible land take in reference years.
Province Name/
Reference Year
aLT2005
2005
aLT2010
2010
aLT2015
2015
aLT2020
2020
Dolnośląskie3.212.952.391.47
Kujawsko-Pomorskie1.492.021.661.34
Lubelskie1.791.291.531.85
Lubuskie2.782.252.191.54
Łódzkie2.663.723.523.25
Małopolskie3.344.577.765.27
Mazowieckie4.373.834.773.85
Opolskie2.111.341.900.98
Podkarpackie2.362.732.732.98
Podlaskie0.610.951.631.54
Pomorskie1.983.483.583.36
Śląskie3.313.922.852.68
Świętokrzyskie1.221.761.471.05
Warmińsko-Mazurskie1.441.312.101.43
Wielkopolskie2.234.113.532.51
Zachodniopomorskie2.101.771.161.21
Country average 2.322.632.802.27
Based on the Study.
Disclaimer/Publisher’s Note: The statements, opinions and data contained in all publications are solely those of the individual author(s) and contributor(s) and not of MDPI and/or the editor(s). MDPI and/or the editor(s) disclaim responsibility for any injury to people or property resulting from any ideas, methods, instructions or products referred to in the content.

