1. Introduction
Rapid population growth and an accelerating shift from rural to urban environments have made urbanization a global phenomenon. By 2018, 55% of the world’s population resided in cities, and it is projected that 68% will live in urban areas by 2050 [
1,
2,
3]. In developing countries, the urban population is expected to double by 2050 [
1]. Sri Lanka has been undergoing rapid urbanization in recent decades, with the urban population expected to increase to 60% by 2030, up from 14% in 2010 [
1].
Urbanization is a major driver of land use changes, often resulting in the conversion of non-urban areas to urban uses [
4,
5]. While urbanization is generally associated with economic development, unchecked and unplanned urban expansion can disrupt natural and social systems, making it a potentially destructive process. To accommodate urban growth, infrastructure such as roads, bridges, and residential buildings are developed, leading to significant changes in land use patterns. These changes in Land Use Land Cover (LULC) are crucial issues in urban areas [
6,
7], affecting the microclimate and ecology. Recent studies have shown that LULC variations contribute to changes in urban temperature, leading to the formation of urban heat islands (UHIs) [
4,
6].
UHI is a significant environmental concern with adverse effects on both the natural environment and human health. UHI refers to the phenomenon where urban areas experience higher temperatures compared to their rural surroundings. UHIs can be categorized into two types: (i) atmospheric UHI, which is based on air temperature measurements, and (ii) surface UHI (SUHI), which is derived from land surface temperature (LST) [
6,
8]. LST is a crucial factor in controlling the surface energy balance and influences various physical, chemical, and biological processes on Earth’s surface. While both surface and atmospheric UHIs are important, they are driven by LST and air temperature, respectively [
6]. Surface UHI can be generally observed both day and night, but are typically more pronounced during the day when solar radiation is at its peak [
7]. High LST values are commonly found within urban heat islands, particularly in urban hot spots [
9].
The extensive growth of built-up areas (BAs) and reduced vegetation cover (VC) have significantly raised LST and intensified UHI. Variations in urban LULC further exacerbate UHI, with temperature increases ranging from 2 °C to 8 °C in urban areas [
10]. Consequently, green urban planning has become a critical approach and effective strategy for mitigating the adverse effects of UHI. Together, Geographical Information Systems (GIS) and remote sensing (RS) offer comprehensive tools to understand and solve complex spatiotemporal geographical issues by providing detailed spatial analysis and continuous monitoring capabilities.
Given the recent proliferation of UHI in urban areas globally, there has been a noticeable increase in systematic investigations using modern RS data and techniques, integrated with GIS, to address and analyze these spatial phenomena. RS data and techniques are crucial and reliable for examining LST and its impacts on UHI [
8]. The changes in LULC often exacerbate UHI in urban and suburbs. Technological advancements have enabled the acquisition of both thermal and optical data from the sensor platforms, enhancing research on temperature conditions and urban LULC [
6]. Satellite imagery at various temporal scales allows for the assessment of UHI magnitude in urban areas. As a moderate-resolution satellite, Landsat is effective for analyzing LST in urban areas [
9,
10].
Recent scholarly studies have extensively examined the impact of LULC dynamics on UHI using remote-sensing techniques in various countries. For example, an analysis of LST in Narayanganj City, Bangladesh, revealed a significant correlation between LST and the NDBI [
11]. According to studies in Wuhan City, the expansion of built-up areas resulted in a 6.05 °C increase in LST from 2007 to 2020 [
11,
12]. A study in Yerevan, Armenia, using Landsat TM/ETM+/OLI-TIRS images, also highlighted that declines in LULC contributed to greater UHI impacts [
13]. Similarly, a study in Kolkata showed that LST increased rapidly in the urban core due to the expansion of built-up areas over vegetation [
9]. Additionally, a recent study employing Multifractal Detrended Fluctuation Analysis (MDFA) with space-borne sensor data in the Indian Himalayan foothills confirmed that urbanization has accelerated UHI [
9,
14].
Despite being an island nation with limited land resources, Sri Lanka experienced a 6.42% annual increase in urban area growth from 1995 to 2017, making it one of the least urbanized countries globally [
15,
16]. Various studies have investigated UHI phenomena in Sri Lanka, predominantly focusing on the Colombo [
16,
17,
18] and the Kandy City areas [
19]. Additionally, studies have examined UHIs and their effects on the ecology and socio-economic environment in peripheral urban areas such as Gampola [
20]. Given that smaller cities in Sri Lanka are also experiencing UHI effects, it is crucial to extend UHI studies to those urban areas across the country.
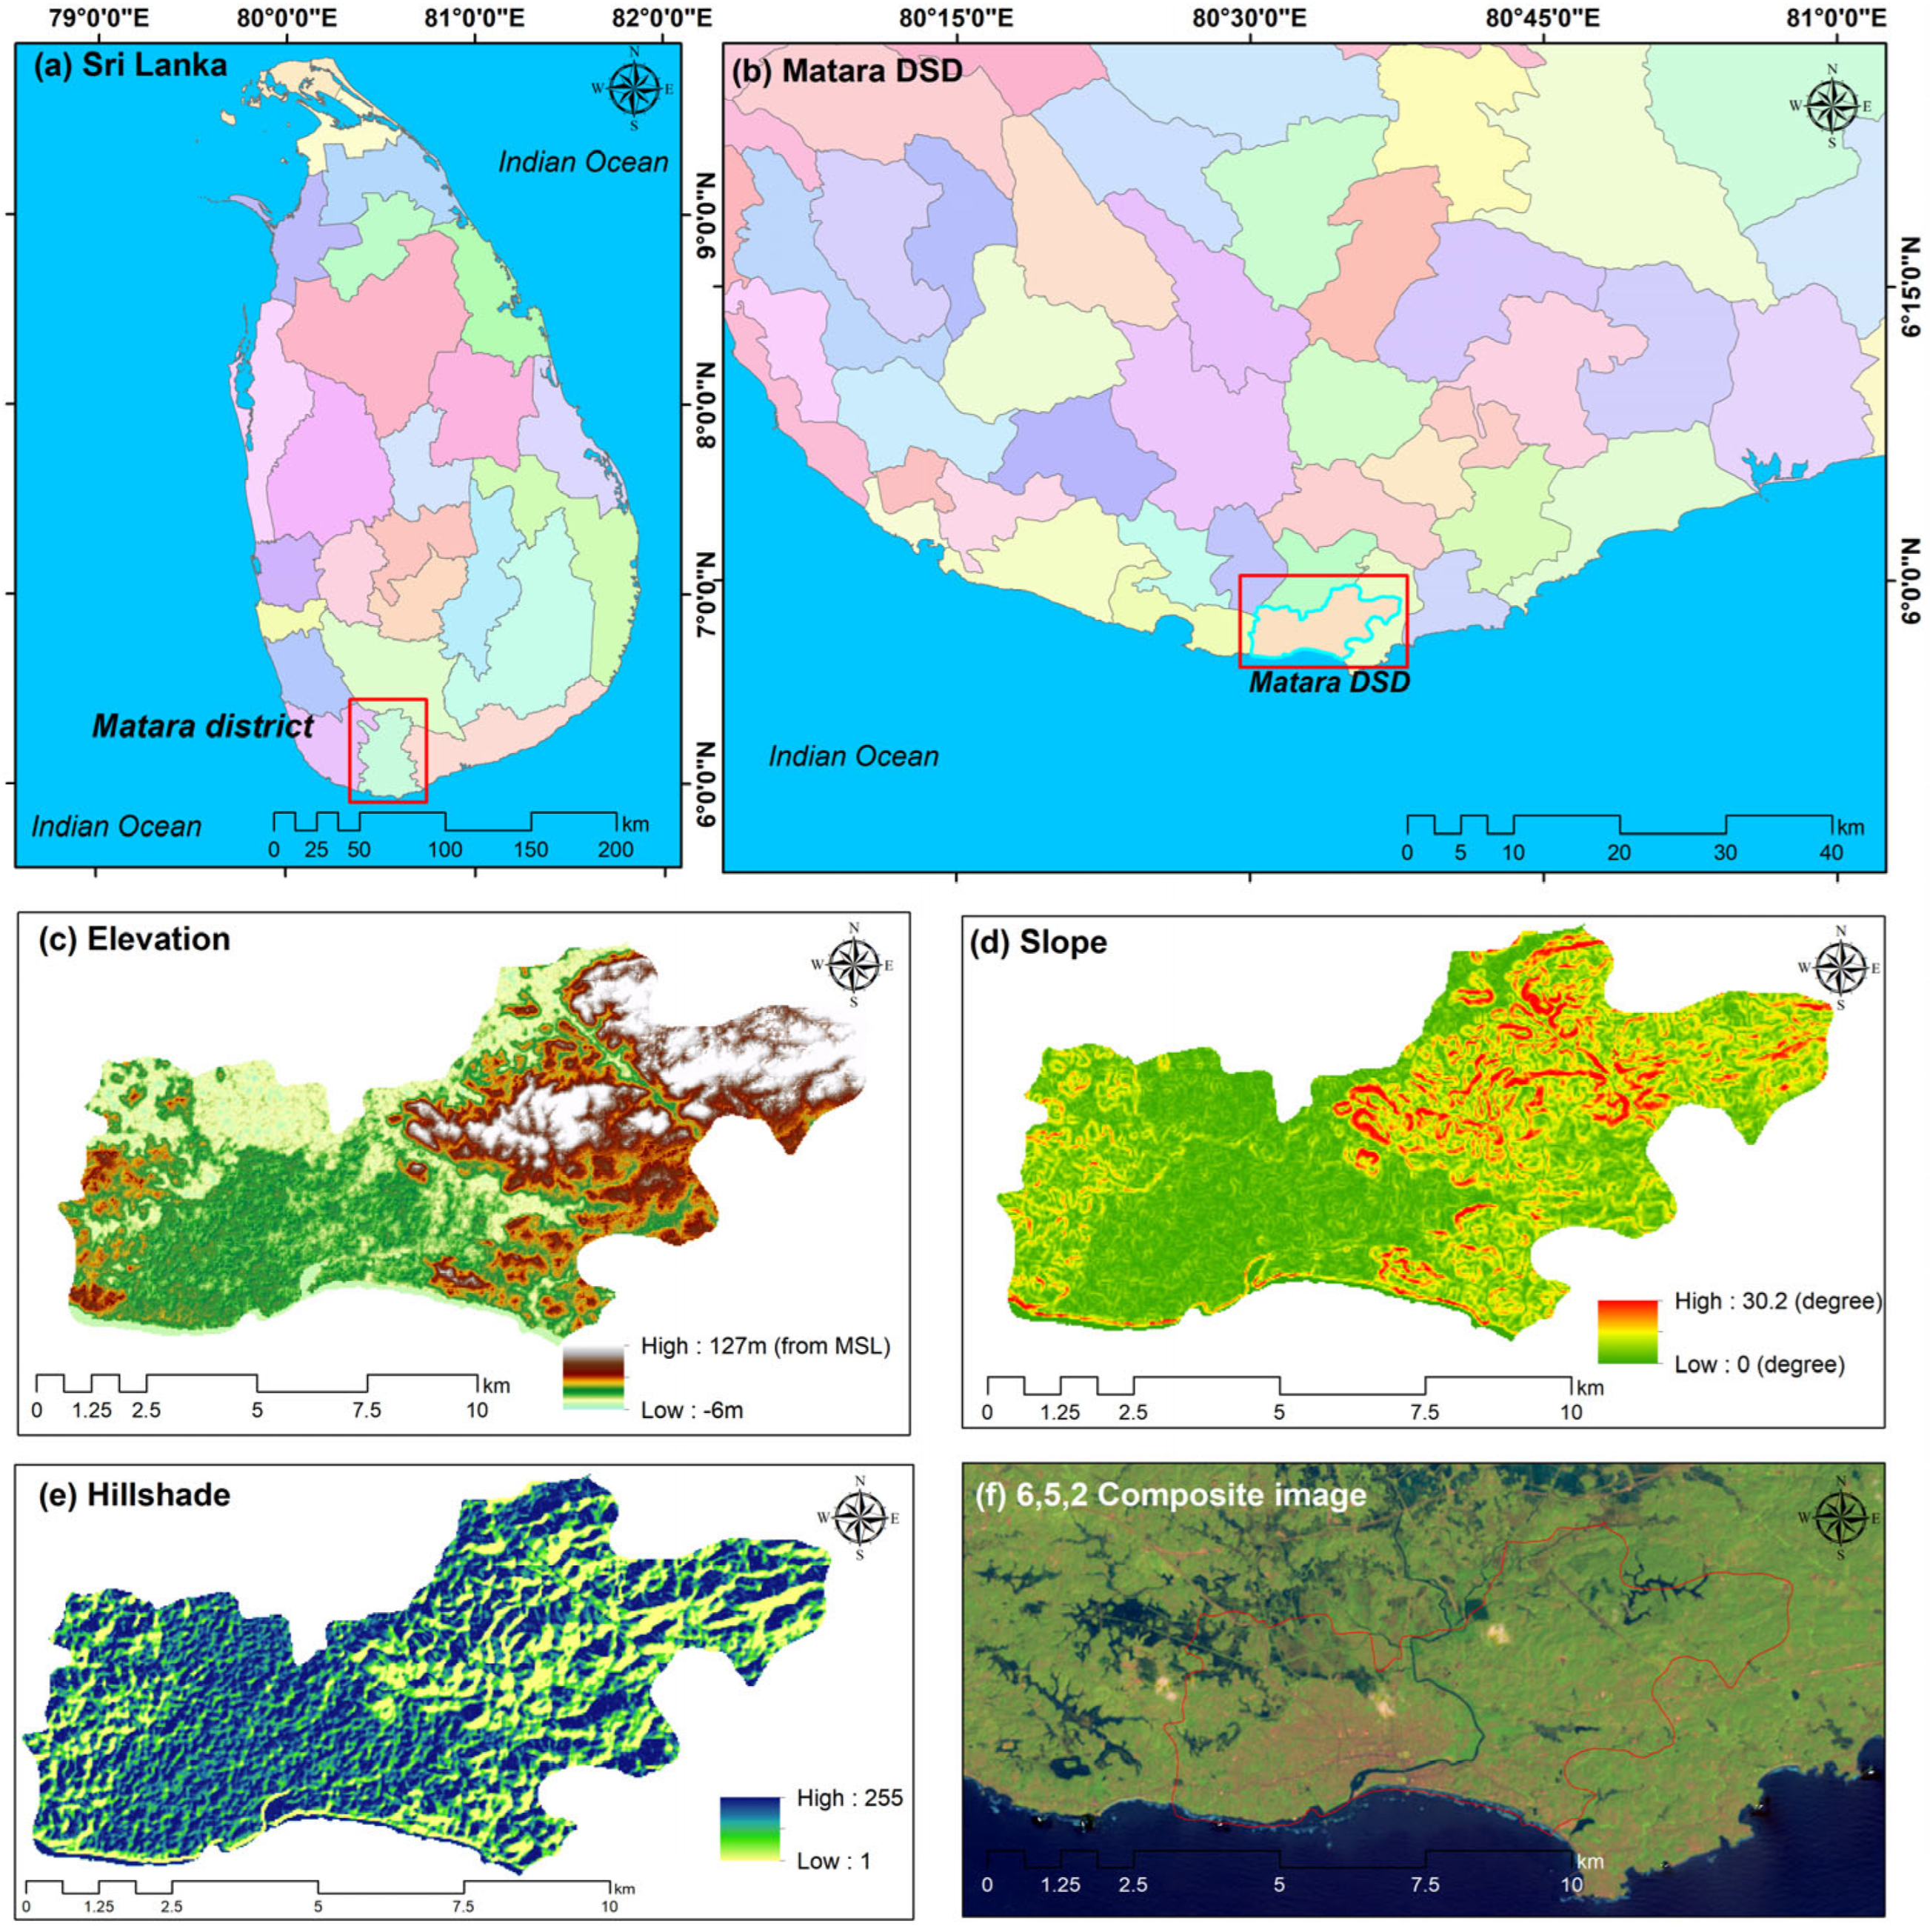
The Southern Province of Sri Lanka includes three administrative districts: Galle, Matara, and Hambantota. Covering 4946 km
2 hectares and with 2.5 million residents [
21,
22], this province has experienced notable changes in LULC due to increased urbanization and infrastructure development over recent decades. Urbanization and increasing population density have markedly altered the landscape in recent decades. The Matara Divisional Secretariat Division (DSD) was selected for this study due to its status as one of Sri Lanka’s municipalities and its strategic location connecting major cities like Galle and Hambantota. The area has seen substantial urban expansion driven by growing demand for residential, commercial, and recreational facilities, influenced by its popularity as a tourist destination.
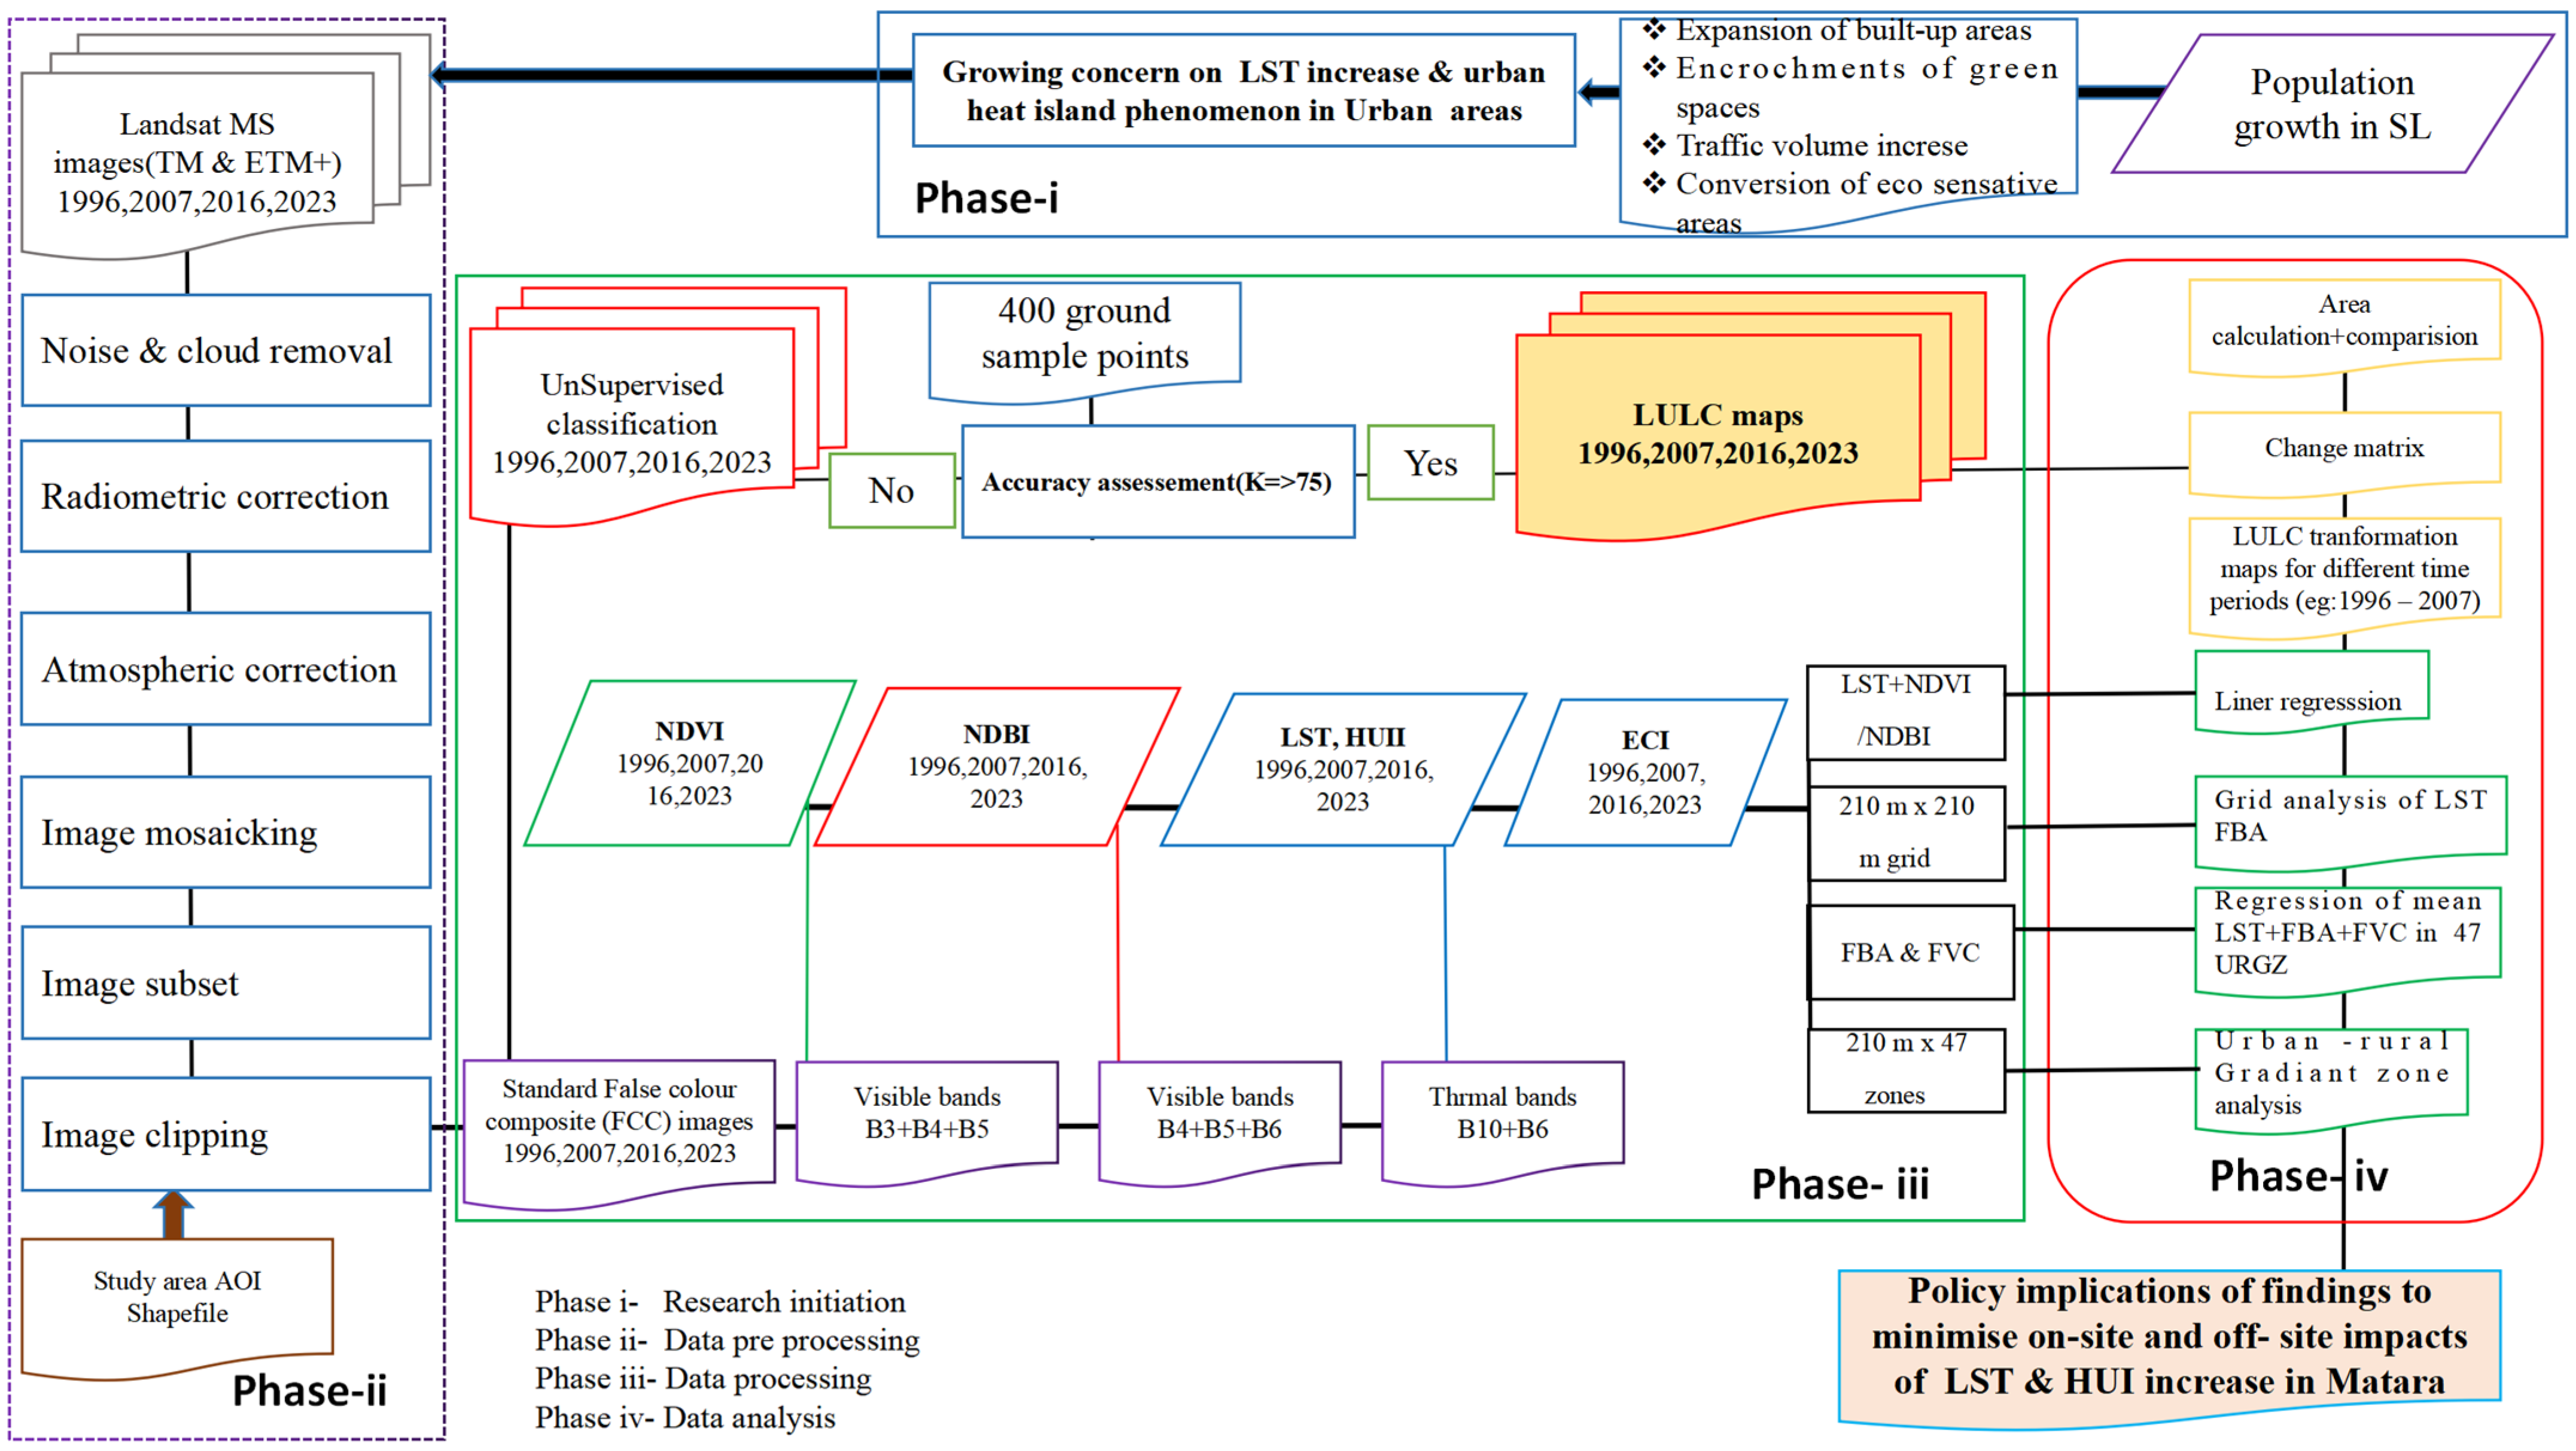
No previous research has focused on the relationship between LST, UHI, and urban expansion in Matara. Thus, our research aimed to address this gap by analyzing the relationship between landscape dynamics LST and UHI. We derived commonly used remote-sensing indices, including LST, UHI, Normalized Difference Vegetation Index (NDVI), Normalized Difference Built-up Index (NDBI), and Environmental Criticality Index (ECI) using Landsat 5, 8, and 9 images for the years 1996, 2007, 2016, and 2023. To gain a deeper understanding of the situation, we analyzed the relationship between mean LST, NDVI, NDBI, and ECI within Urban–Rural Gradient Zones (URGZs). Also, a grid-based analysis and linear regression were performed among the Fraction of Built-up Area (FBA) and the Fraction of Vegetation Cover (FVC). Further, in this study, we focused on the ECI in relation to the expansion of FBA and the decline of FVC within different URGZs. The findings are intended to support sustainable urban planning, mitigate the impacts of LULC changes, and enhance the ecosystem and human health in Matara City.
The implications of this research extend significantly into the realm of climate change adaptation and the achievement of various Sustainable Development Goals (SDGs). The findings underscore the urgent need for sustainable urban planning to mitigate the urban heat island effect, which directly impacts climate resilience (SDG 13: Climate Action). By demonstrating the adverse effects of urban expansion on vegetation cover and surface temperatures, the research highlights the importance of maintaining green spaces to promote ecosystem health (SDG 15: Life on Land). Additionally, integrating green infrastructure can enhance urban livability and well-being (SDG 11: Sustainable Cities and Communities), fostering healthier environments for residents. The correlation between built-up areas and rising temperatures also emphasizes the need for inclusive urban policies that address socioeconomic disparities, aligning with SDG 10: Reduced Inequalities. Ultimately, this research serves as a critical resource for policymakers, providing evidence-based strategies that support both environmental sustainability and human health, vital for navigating the complexities of urbanization in a changing climate.
The social impact of this study is significant, as it provides critical insights into how urbanization in Matara affects local climate conditions, particularly through the UHI effect. By highlighting the relationship between LULC changes and temperature variations, the findings can inform urban planning strategies aimed at improving public health and quality of life. Additionally, this study emphasizes the importance of preserving green spaces, which can foster community well-being and environmental sustainability. Ultimately, this research supports informed decision-making that benefits residents and enhances resilience to climate change impacts.
3. Results
3.1. LULC Changes
The combined accuracy rates for the four periods exceeded 80%, reflecting a reliable classification of LULC and a strong correlation between the reference and classified maps. The kappa coefficients were 0.89 in 1996, 0.96 in 2007, 0.96 in 2016, and 0.92 in 2023, as shown in
Table A1.
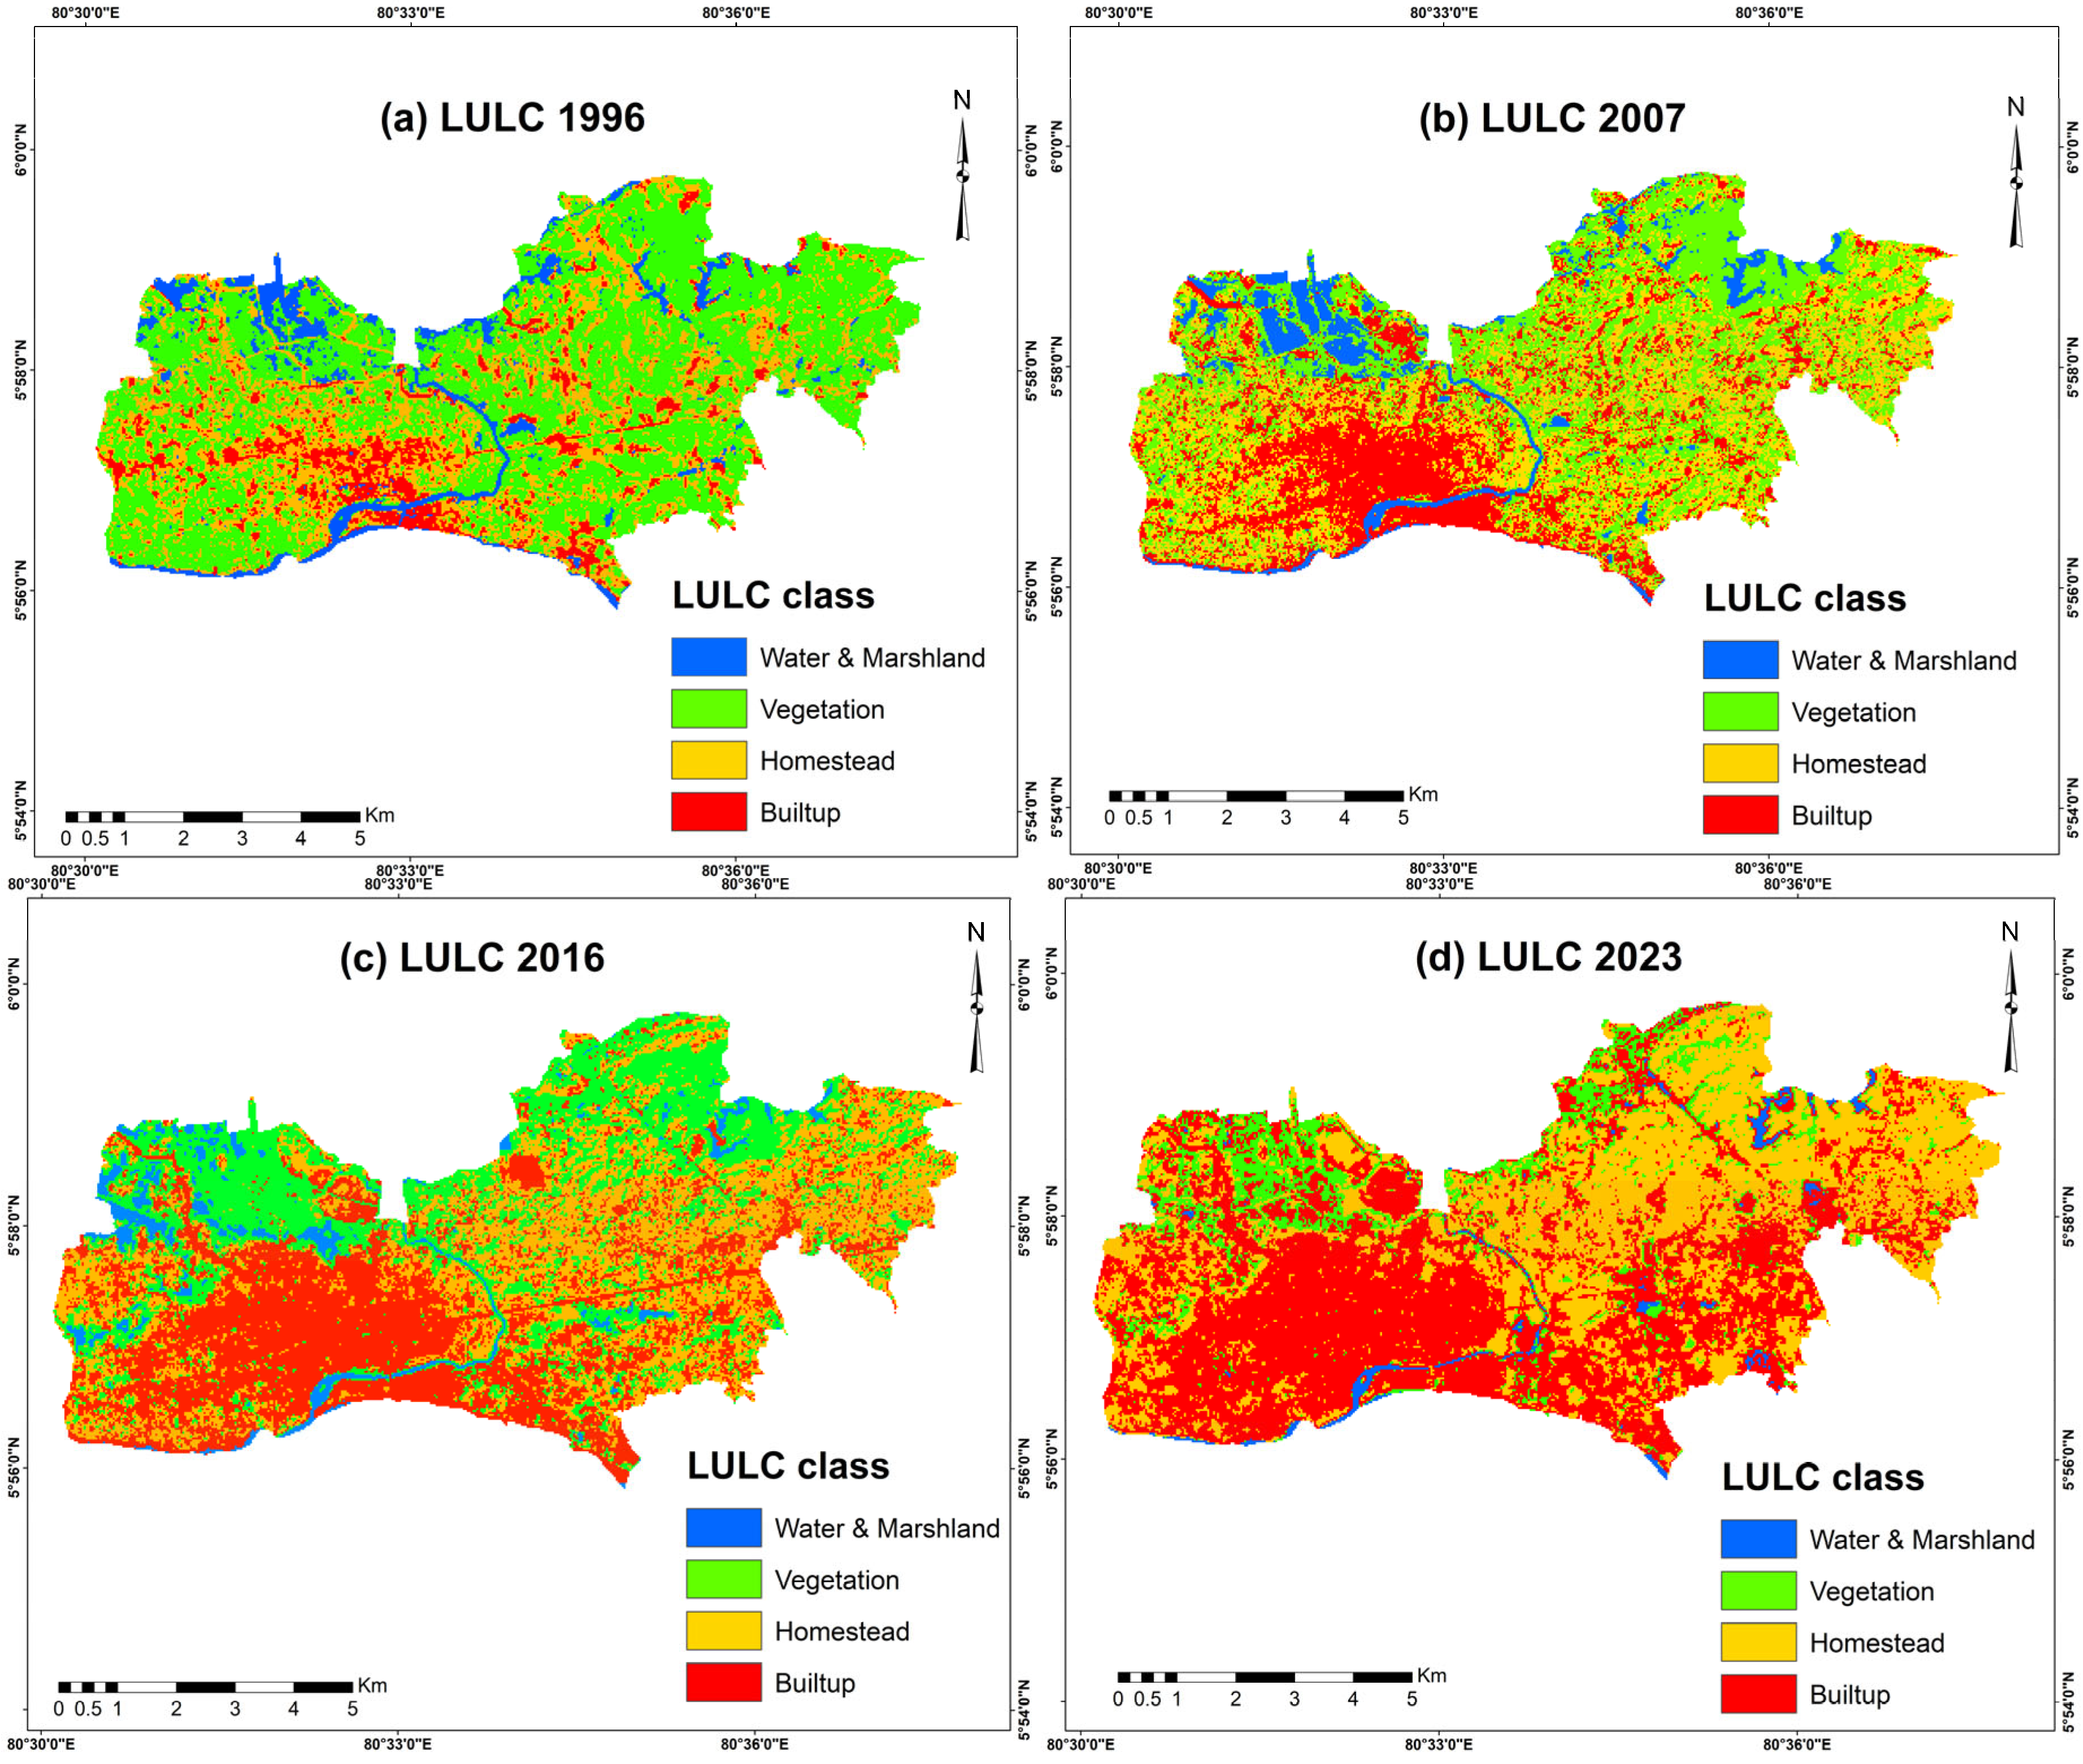
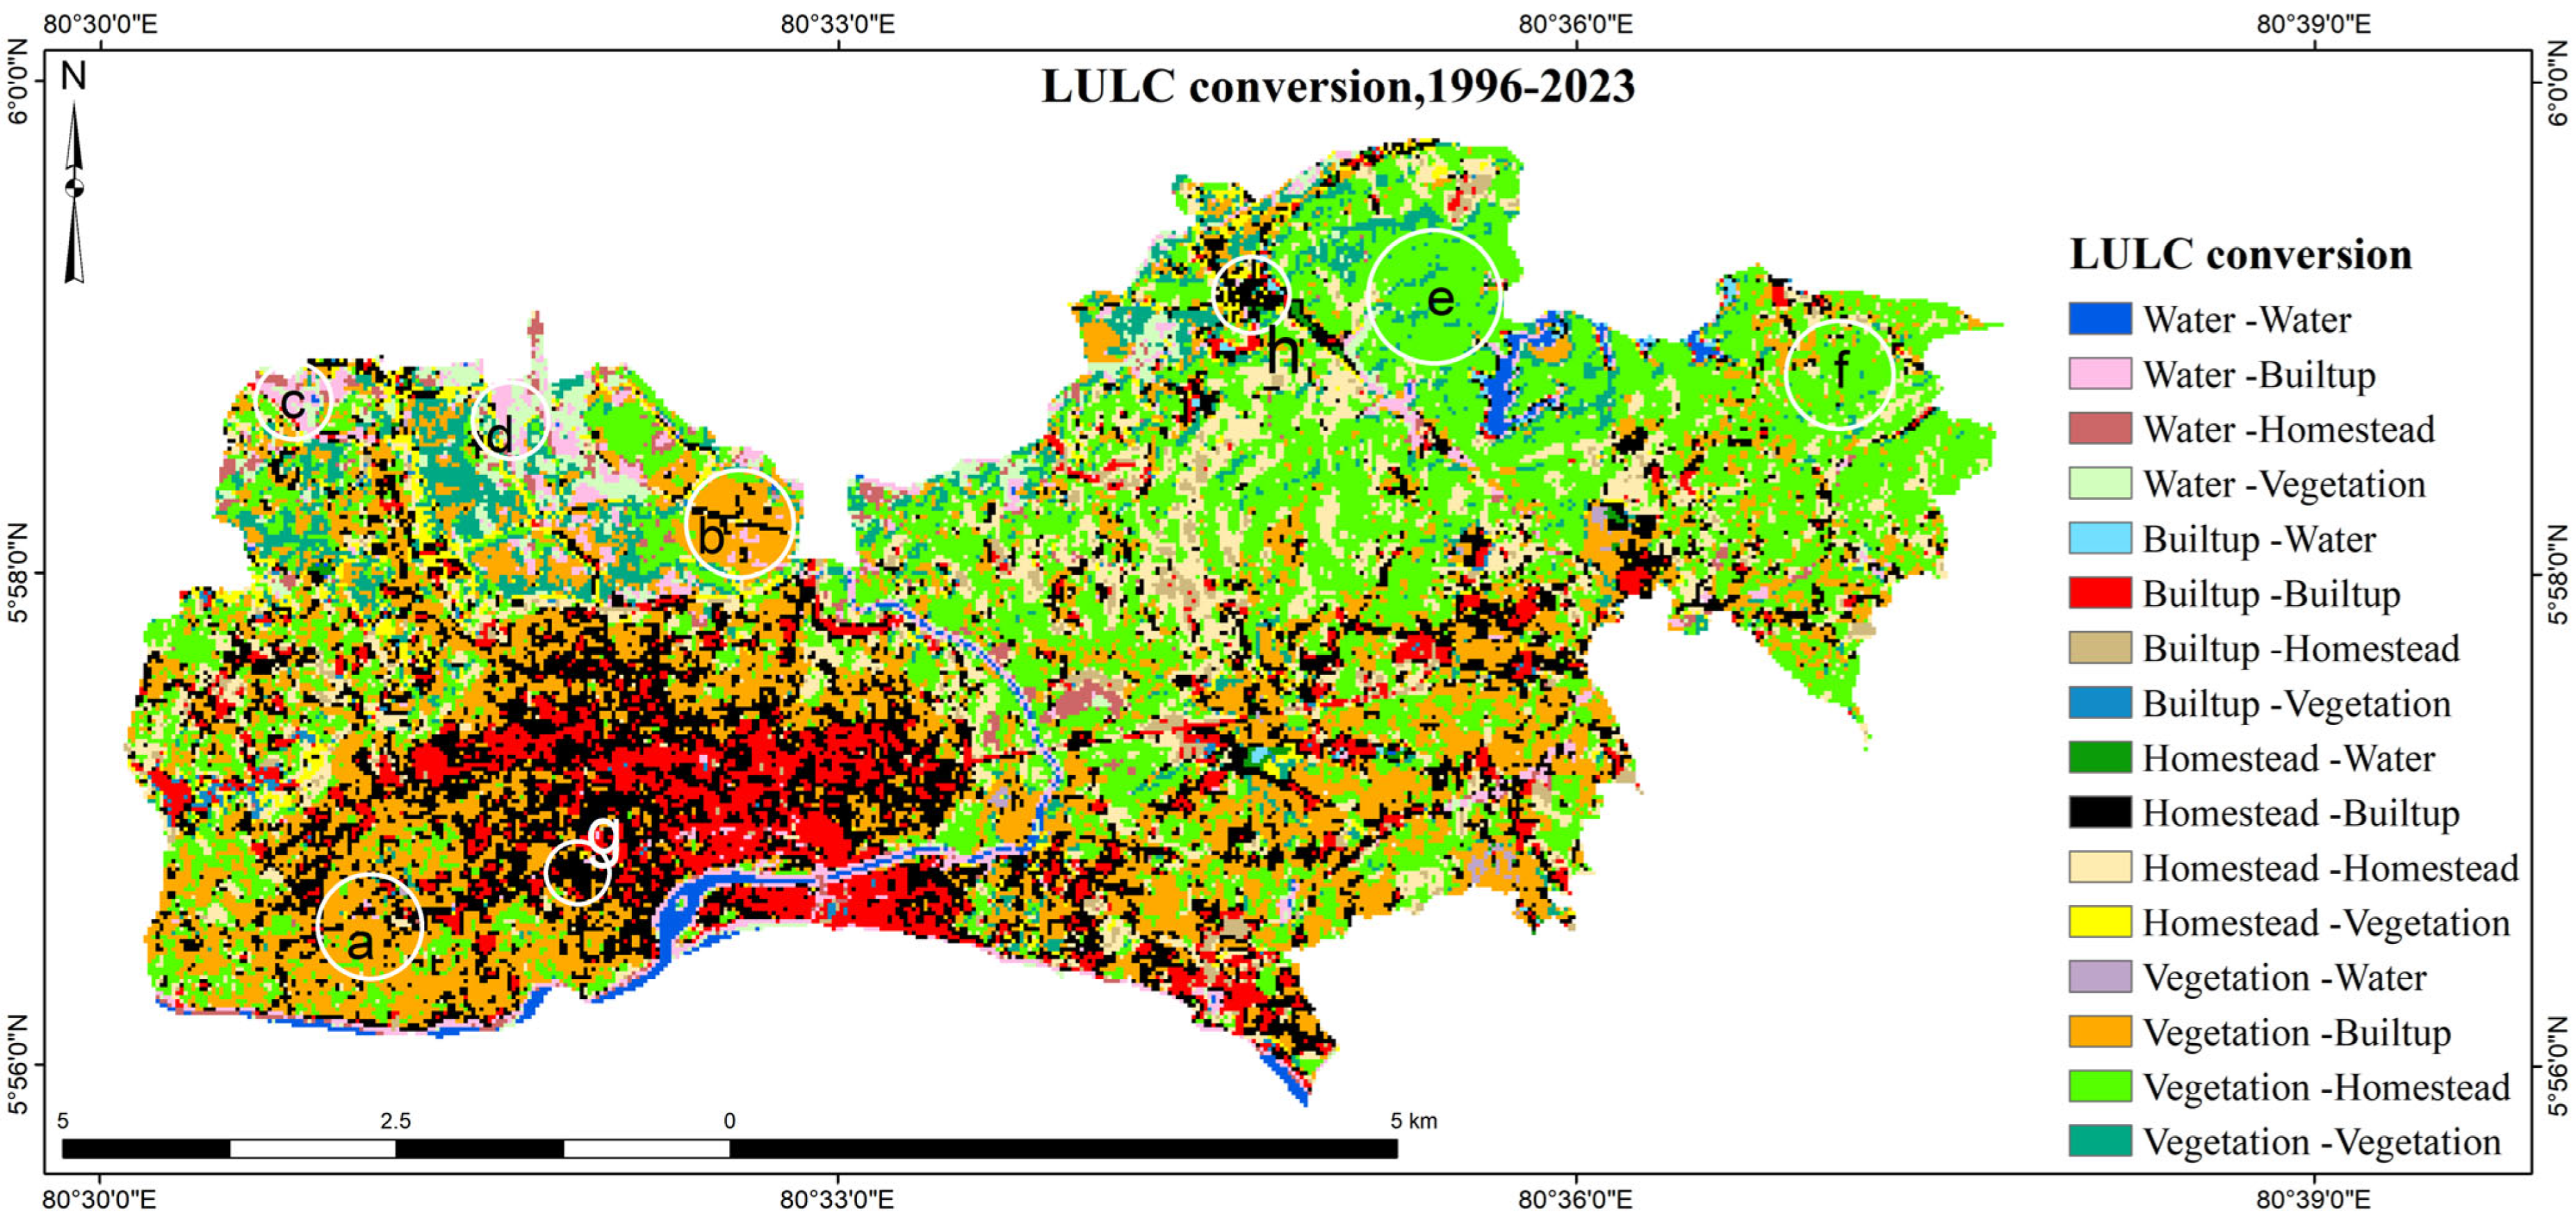
The classified land cover maps for Matara DSD for the years 1996, 2007, 2016, and 2023 are illustrated in
Figure 3, while the changes in LULC are detailed in
Table A2. The results indicate a gradual increase in built-up areas from 1996 to 2023.
Figure 3 highlights the rapid urban development pattern observed from 1996 to 2023, progressing outward from the city center. This spatial pattern of LULC is most prominent in the southwest area. Concurrently, vegetation cover has steadily decreased due to urban expansion, which has been driven by population growth.
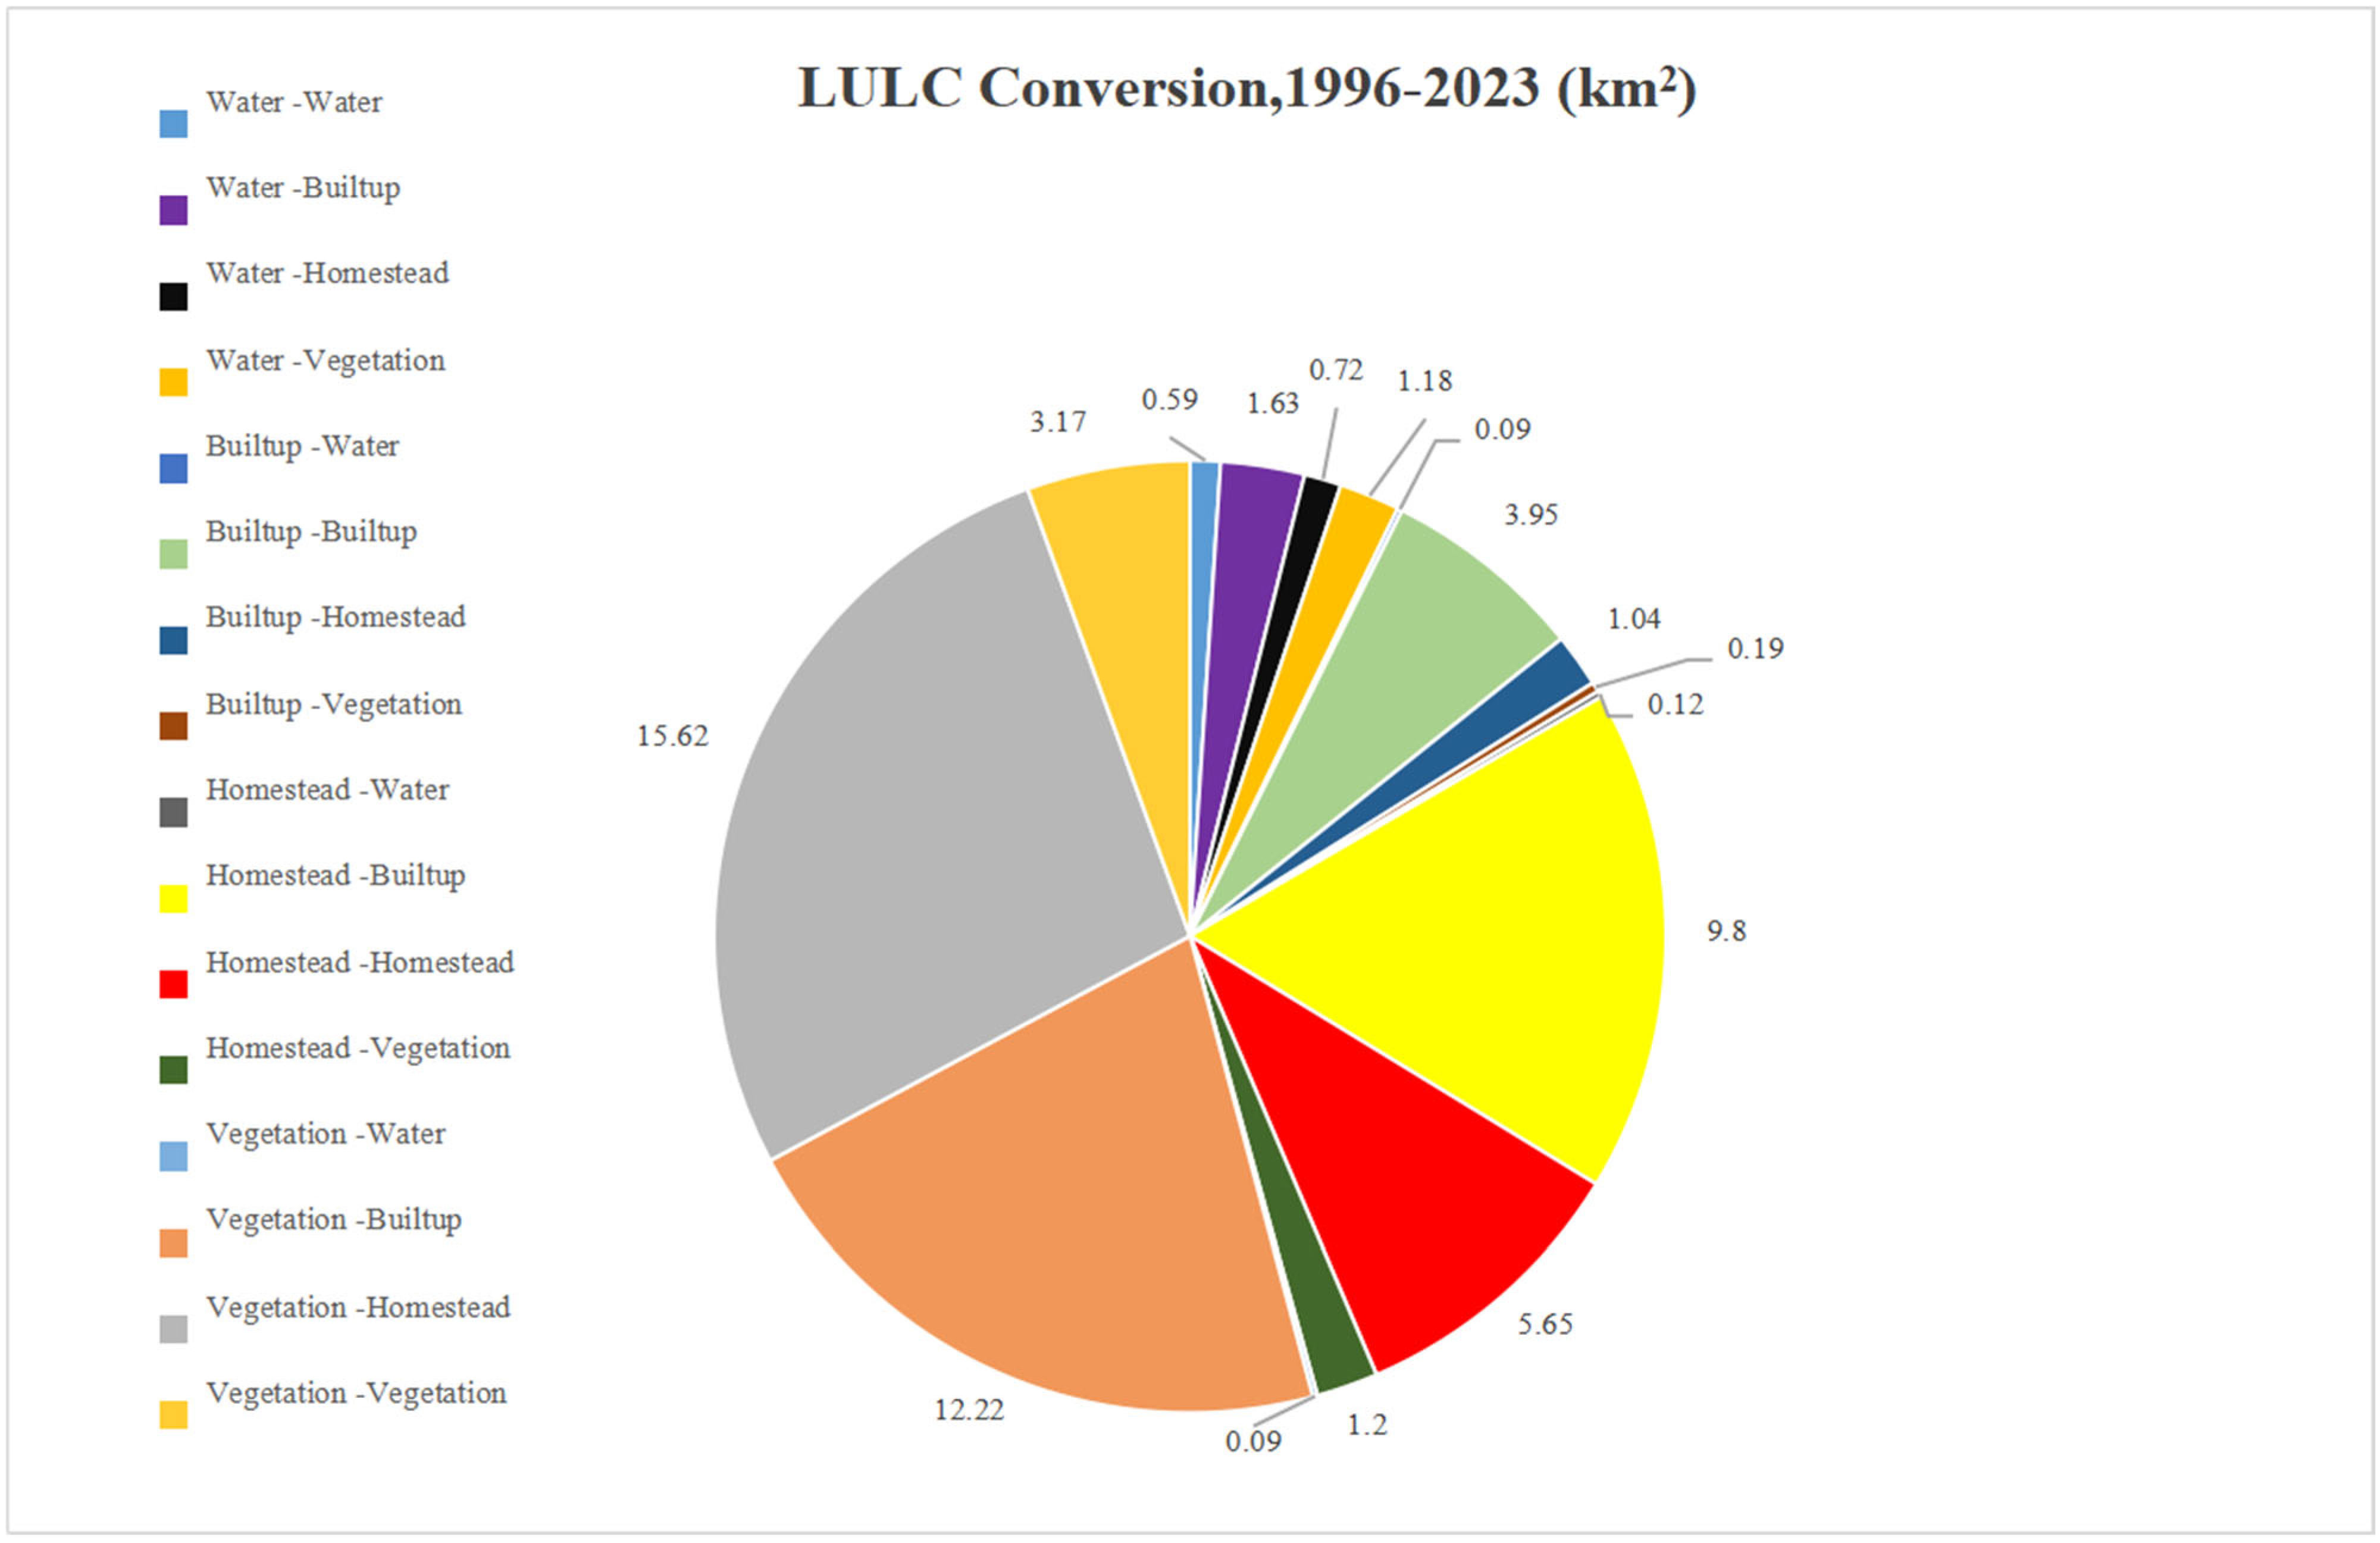
According to
Table A2, significant changes in LULC have been observed from 1996 to 2023. Built-up areas increased substantially, with a total rise of 12.21 km
2 (48.8%) over the period.
This growth was most pronounced between 1996 and 2016, when built-up areas expanded by 11.82 km2 (50.02%), although there was a slight decrease of 0.35 km2 (4.72%) from 2016 to 2023. This reflects a period of rapid urban expansion followed by a minor stabilization.
In contrast, water and marshland areas experienced a net increase of 0.27 km
2 (1.08%), despite an overall decline of 0.68 km
2 (2.87%) from 1996 to 2016. This category saw a significant recovery with a 0.95 km
2 (112.8%) increase between 2016 and 2023, indicating a partial reversal of earlier losses. Homestead areas saw a notable decrease of 2.55 km
2 (10.21%) from 1996 to 2023, with a considerable drop of 5.16 km
2 (40.47%) from 1996 to 2007. However, there was some recovery from 2007 to 2016 and a modest increase of 2.37 km
2 (32%) from 2016 to 2023, reflecting a fluctuating trend in homestead development. Vegetation cover faced a continuous decline, with a total loss of 9.94 km
2 (39.8%) over the period. The most significant reductions occurred from 2007 to 2016 (−5.04 km
2, −44.36%) and from 2016 to 2023 (−3.37 km
2, −50.4%), highlighting a persistent trend of vegetation cover loss driven by built-up area and homestead expansion (
Figure A1 and
Figure A2). Overall, the data illustrate a pattern of substantial built-up area growth, coupled with a consistent decrease in vegetation cover and a variable trend in water and marshland areas. The changes reflect ongoing urbanization pressures and their impact on the natural environment over nearly three decades.
3.2. Spatiotemporal Pattern of LST Changes
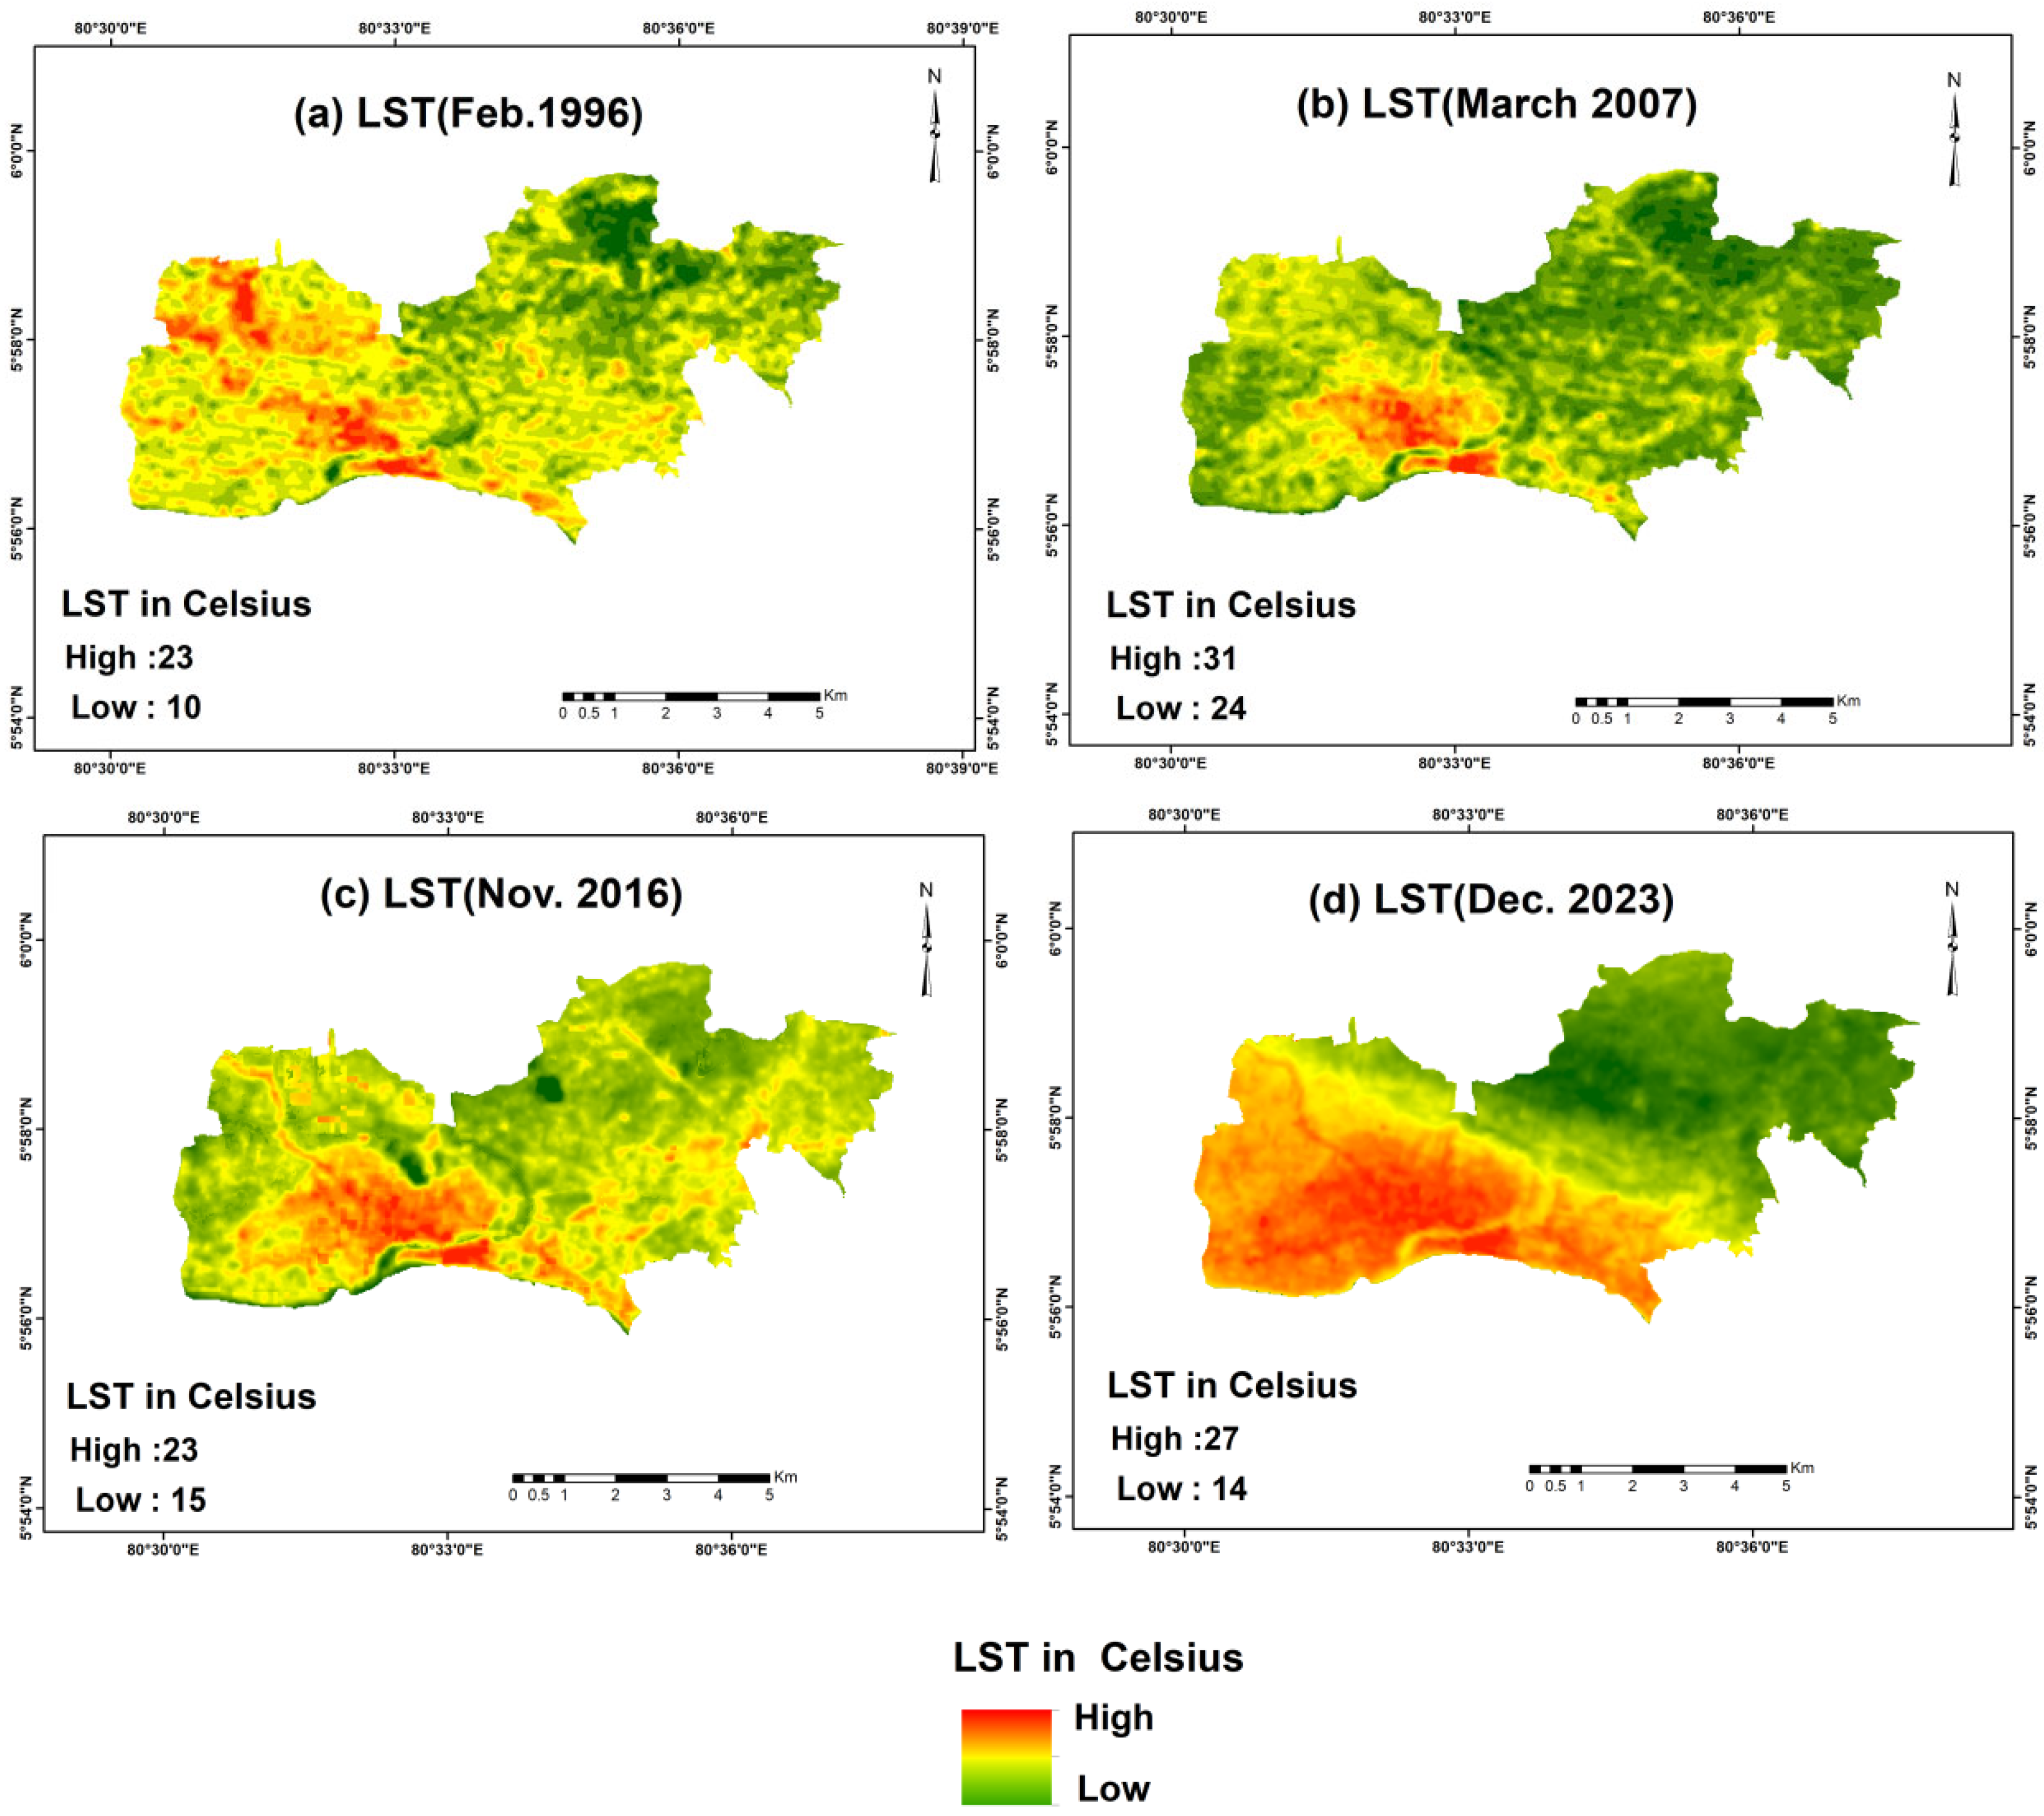
Figure 4 illustrates the distribution of LST in the Matara City area for the years 1996, 2007, 2016, and 2023. The distribution patterns for each year reveal how temperature ranges and variability have evolved over time.
Table A3 provides a summary of the descriptive statistics for the LST values across these years, highlighting key measures such as the minimum, maximum, mean, and standard deviation.
According to
Table A3, from 1996 to 2023, LST data for Matara show notable trends. Initially, in 1996, temperatures were relatively stable, with a narrow range and low variability. By 2007, temperatures rose with increased variability. In 2016, the minimum temperature dropped significantly, and the mean decreased, though variability slightly increased. By 2023, the minimum temperature fell further while the maximum increased, leading to a higher mean and a substantial rise in variability, indicating more extreme temperature fluctuations and suggesting greater climatic instability over the period.
In 2023, the LST in Matara was notably higher in the city core and its surrounding wards, particularly in the northern and eastern areas. This pattern reflects the influence of urban expansion, as evidenced by the development of road networks and growth nodes. The increase in surface temperatures in the core area correlates with urban growth and a reduction in vegetation cover, especially in the southern coastal region. Additionally, LST has risen in densely populated areas and surrounding urban patches, highlighting the impact of urbanization on temperature increases.
3.3. Behavior of Urban Heat Island Index
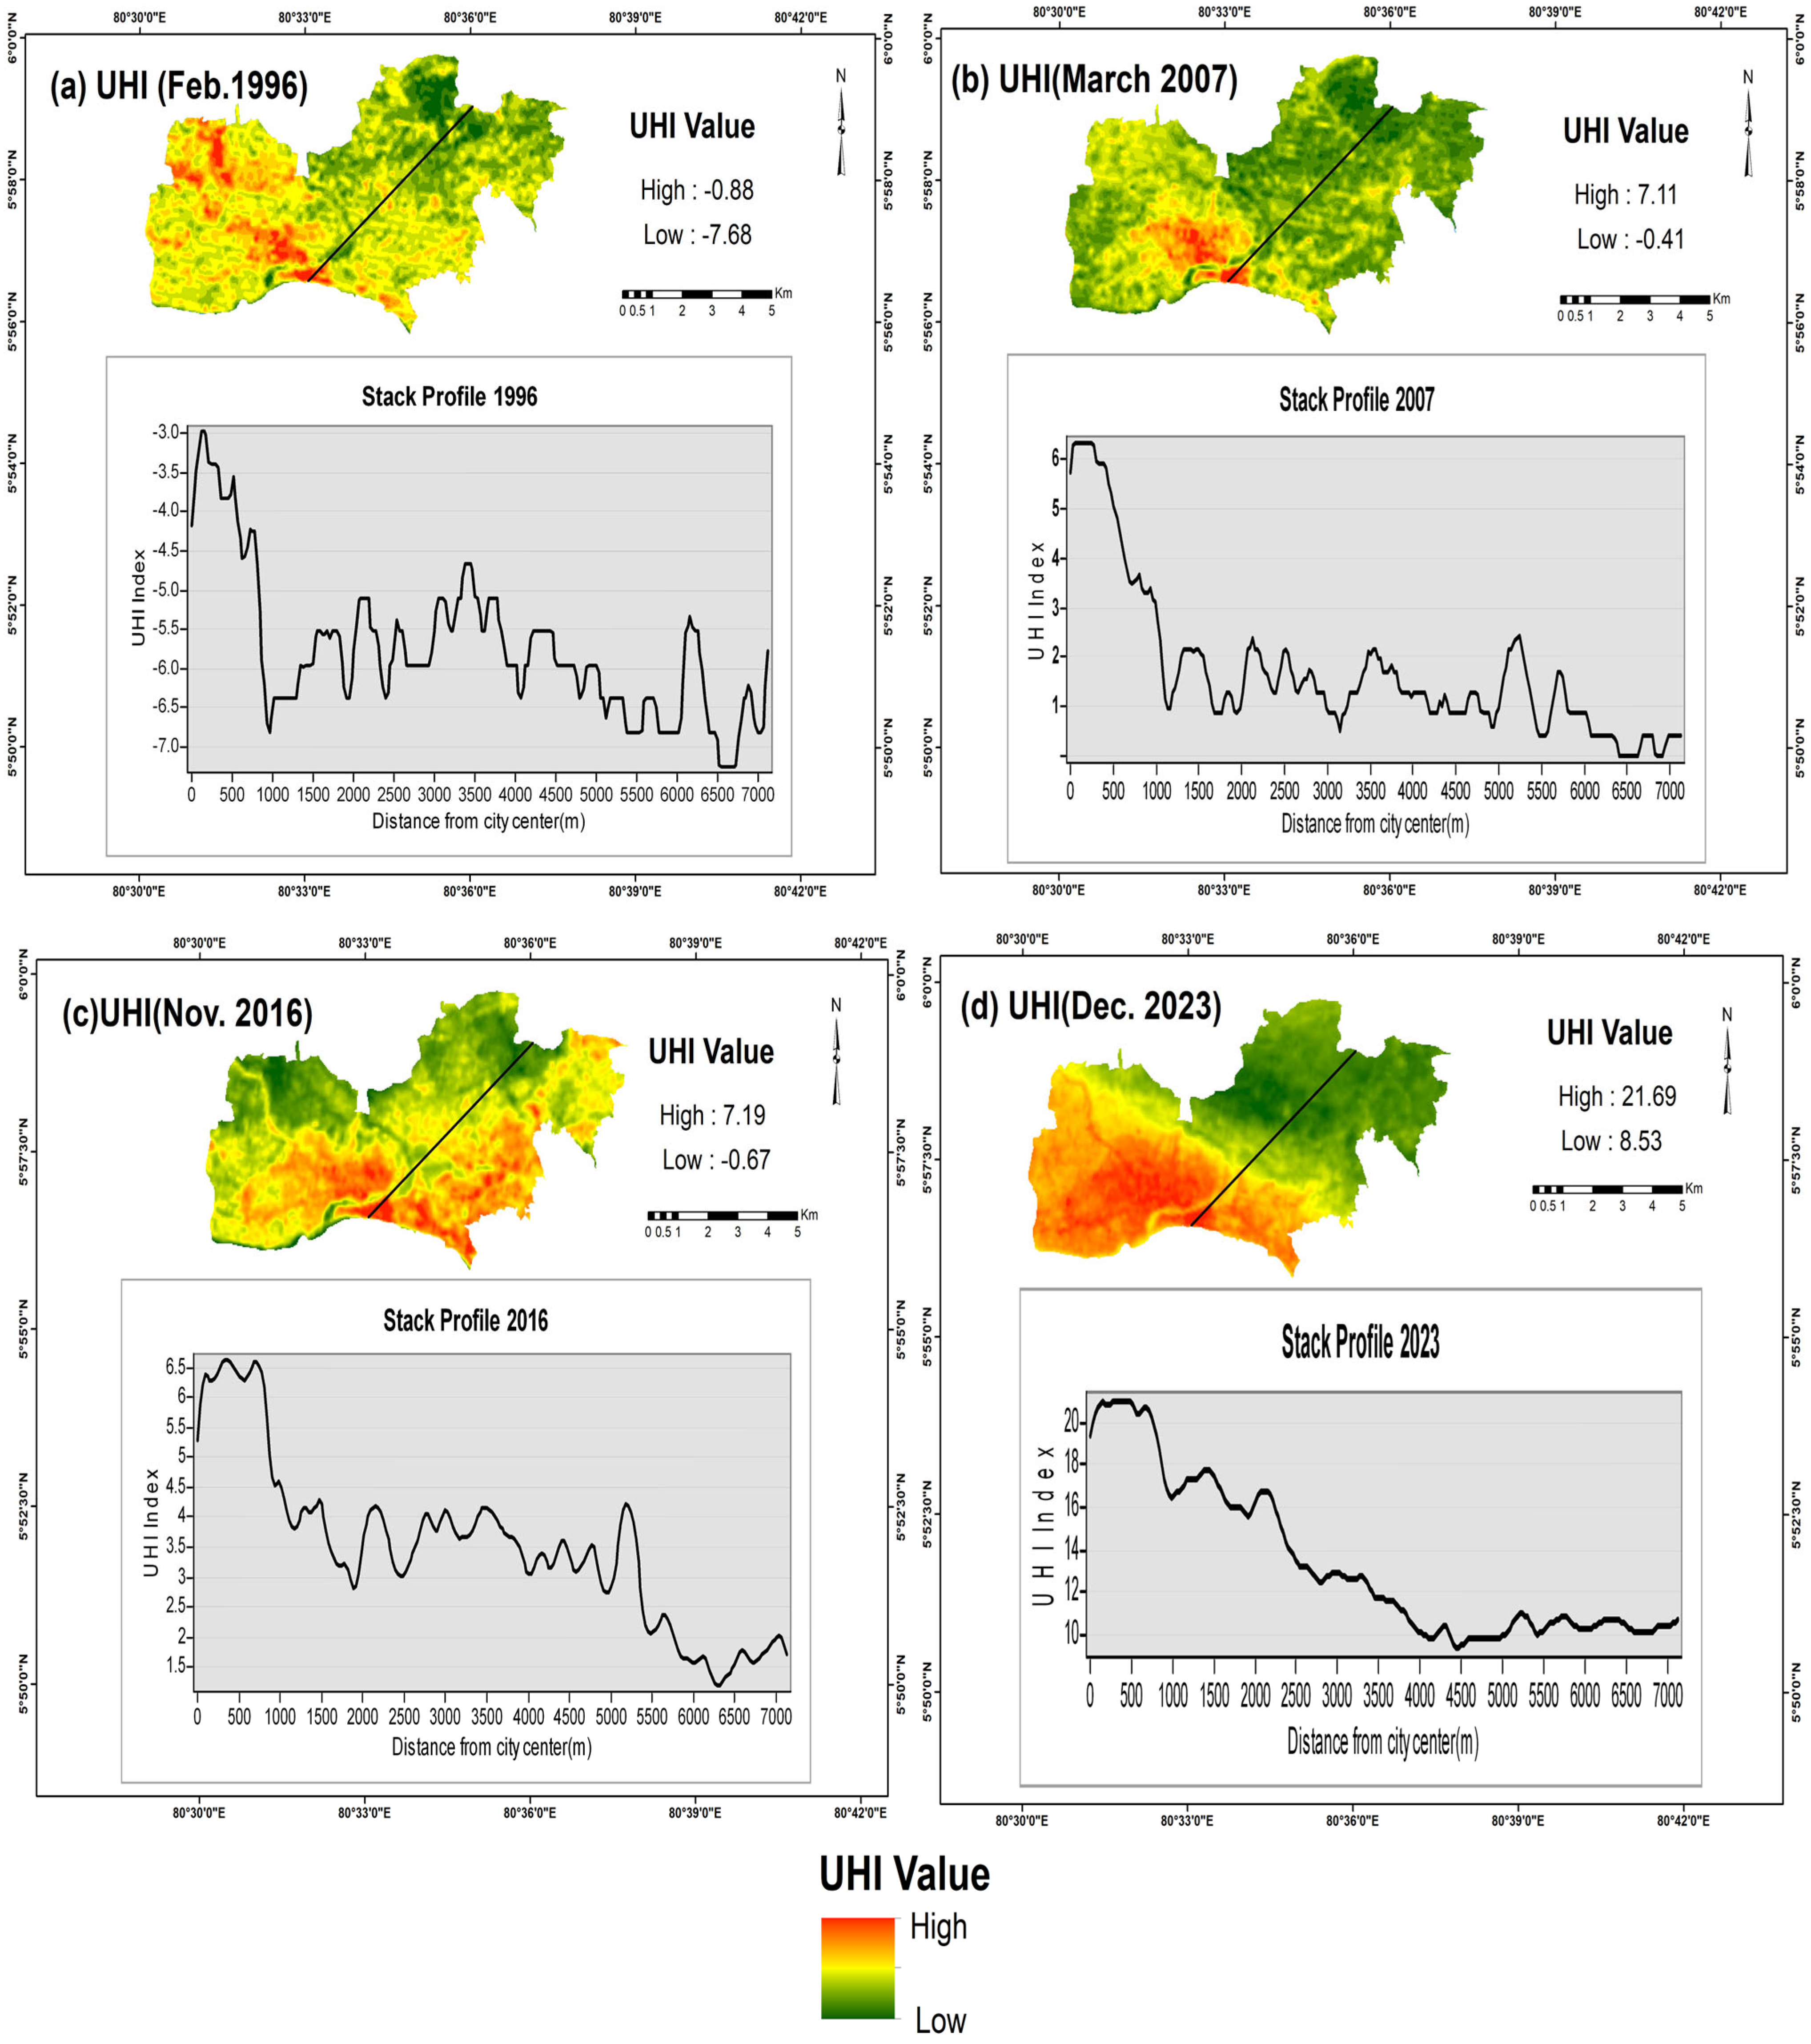
Figure 5 illustrates the variations in the UHI effect in the Matara City area for the years 1996, 2007, 2016, and 2023. The UHI stack profile depicts the changes in UHI values from the city center to the surrounding hinterland areas. The data for Matara City from 1996 to 2023 shows a significant upward trend in the UHI Index, reflecting an intensification of the urban heat island effect over the years.
In 1996, the UHI Index was relatively low, with a high UHI value of −0.8 and a low UHI value of −7.6, indicating that urban areas were cool. This suggests that, at that time, the impact of urban development on local temperatures was minimal. By 2007, the high UHI Index had risen dramatically to 7.11, and the low UHI Index had moved closer to zero at −0.41. This shift indicates an initial phase of significant warming in urban areas, likely due to increased construction, reduced green spaces, and greater energy consumption associated with urban growth.
The trend continued into 2016, with the high UHI Index slightly increasing to 7.19, while the low UHI Index improved marginally to −0.67. Though there was a slight rise in the high UHI Index, the marginal change in the low UHI Index suggests that rural areas were also warming, but urban areas were experiencing a more pronounced heat effect.
By 2023, the high UHI Index surged to an alarming 21.64, reflecting a substantial increase in the temperature difference between urban and rural areas. Concurrently, the low UHI Index had risen to 8.53, indicating that rural areas had also experienced warming, though the disparity between urban and rural temperatures had widened significantly. This dramatic rise in the high UHI Index points to a marked intensification of the urban heat island effect, driven by accelerated urbanization, expansion of impervious surfaces, and other factors that exacerbate heat retention in urban areas.
Overall, the data reveal a clear and troubling trend: urban wards in Matara City have become increasingly warmer compared to their rural surroundings over the past few decades. This growing UHI effect underscores the need for targeted urban planning and mitigation strategies to address the impacts of urban heat and enhance environmental sustainability.
3.4. Spatiotemporal Pattern of NDVI and NDBI
Figure A3 illustrates the spatial pattern of NDVI during four distinct periods, namely 1996, 2007, 2016, and 2023. In NDVI maps, healthy vegetation typically appears in shades of dark green, while sparse or stressed vegetation may appear in shades of light green. NDVI maps can reveal spatial patterns of vegetation distribution across the mapped area. Clusters of high NDVI values indicate areas with dense vegetation cover, while low NDVI values may highlight regions with limited vegetation. According to
Figure A3, in 1996, high vegetation cover was at the Matara City area, especially in the northeastern and western parts of the city. Then, with the rapid urban development in 2007, vegetation cover of the northwestern part of the city has been decreasing. Rich vegetation cover can be seen near the areas adjacent to beaches, marshlands, and water bodies. In 2016, moderate vegetation cover can be identified around the city center and when considering the year 2023, it could be observed low-density vegetation cover around the city area and moderately density vegetation in the northeastern and western part of the city.
Table A4 outlines the trends in the NDVI for Matara City from 1996 to 2023. Over this period, the NDVI values reveal a notable shift in vegetation characteristics. Analyzing these minimum values reveals a trend of decreasing vegetation in the least vegetated areas. Specifically, the minimum NDVI values have worsened from −0.155 in 1996 to −0.191 in 2023. This decline indicates that the areas with the lowest vegetation cover have become even less vegetated over time, suggesting a reduction in green spaces or degradation of vegetation in the most sparsely vegetated regions of the city. This trend could reflect urban expansion or environmental changes leading to reduced vegetation in these specific areas.
Figure A4 demonstrates the NDBI variations in the Matara City area in 1996, 2007, 2016, and 2023. Due to the presence of a densely built-up area with the road network, the highest distributed NDBI was reported around the city center along the coastal belt, central, and southern parts of the city area from 1996 to 2023, whereas the lowest NDBI was reported on the northeastern side of the city due to the presence of dense vegetation.
Table A5 provides an analysis of the NDBI for Matara City across the following selected years: 1996, 2007, 2016, and 2023. The data show a gradual increase in both the minimum and maximum NDBI values over this period. The minimum NDBI values have improved slightly from −0.312 in 1996 to −0.325 in 2023, and the maximum values have increased from 0.159 to 0.259, indicating a growth in built-up areas and possibly more extensive urbanization. The mean NDBI has remained stable at approximately −0.138, suggesting that the average intensity of built-up areas has not fluctuated significantly. However, the standard deviation has increased from 0.065 in 1996 to 0.080 in 2023, which points to growing variability in built-up areas throughout the city. This suggests that while the overall extent of built-up areas has increased, there is more variation in how these areas are distributed within Matara City.
3.5. Correlation Between LST, NDVI, and NDBI
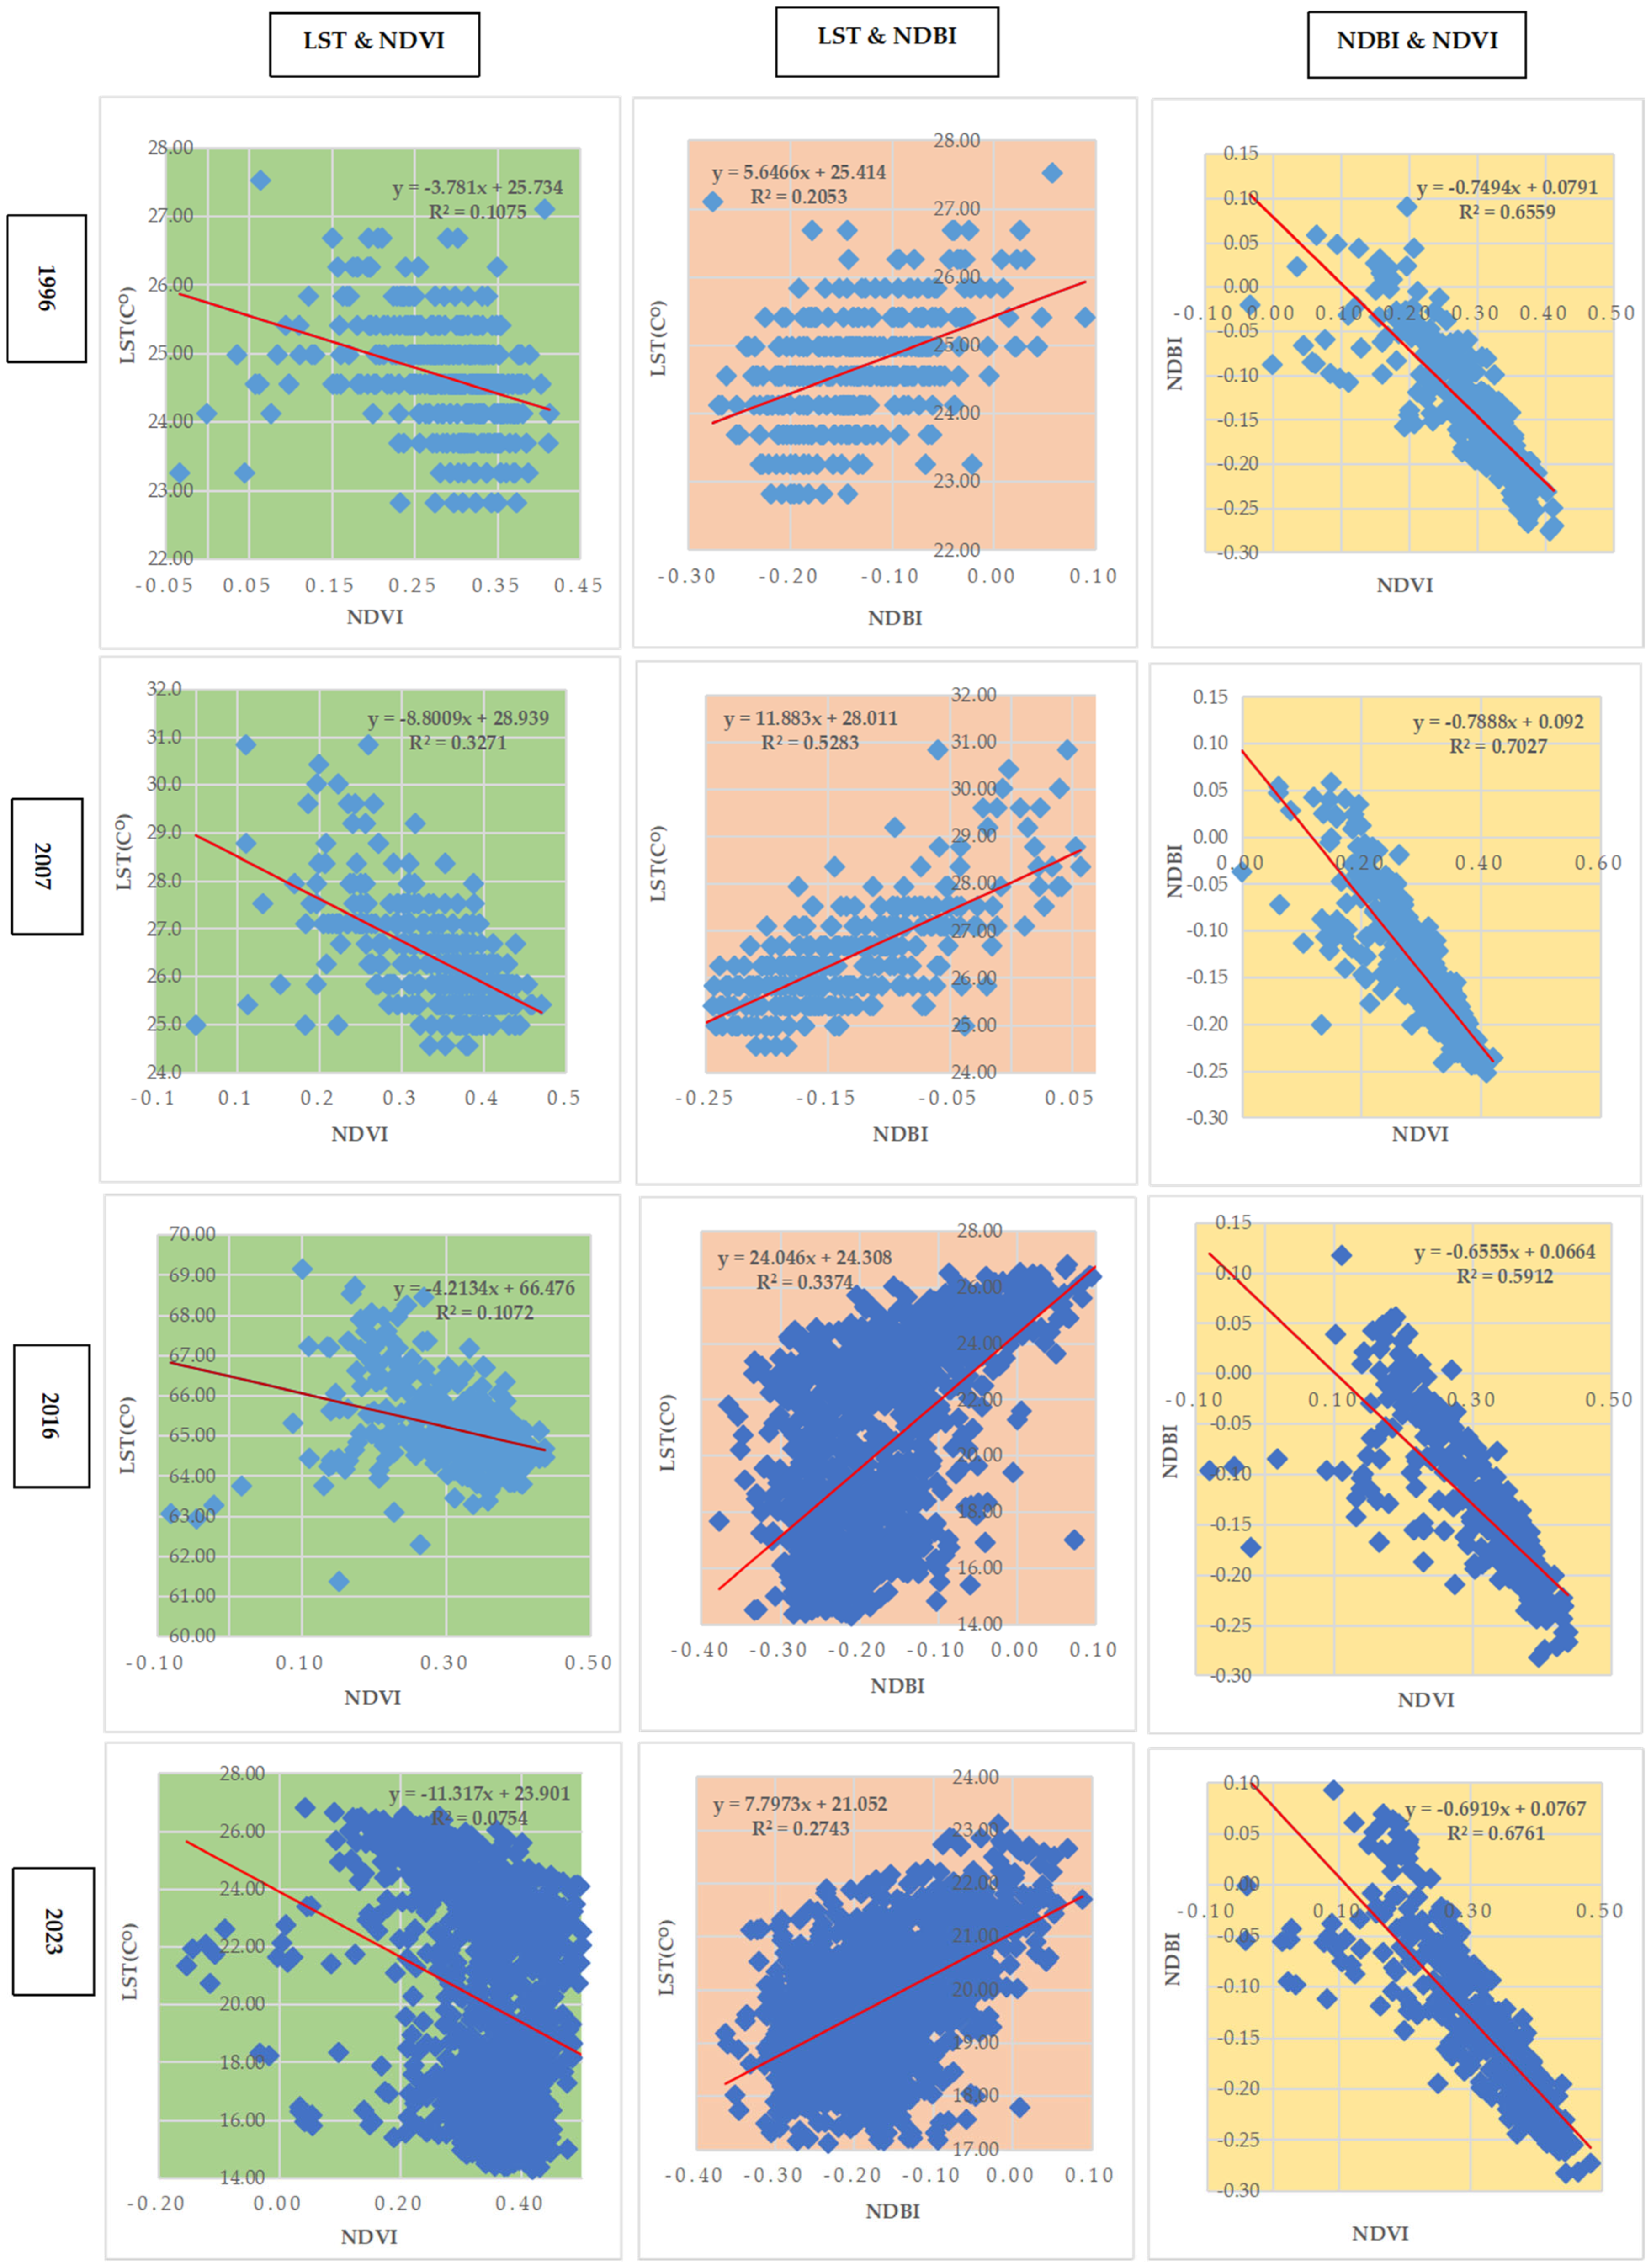
Figure 6 illustrates the correlations between different environmental variables in Matara from 1996 to 2023, specifically focusing on the relationships between the NDVI and LST, NDVI and the NDBI, and NDBI and LST. For NDVI and LST, the correlation values show considerable fluctuation over the years. In 1996, the correlation was quite low at 0.1075, indicating a weak relationship between vegetation health and land surface temperature. This relationship strengthened to 0.3271 in 2007, suggesting a moderate positive association where higher vegetation was somewhat linked with higher temperatures. However, by 2016, the correlation decreased slightly to 0.2743 and fell further to 0.0754 in 2023, reflecting a weakening and nearly negligible association between NDVI and LST over time.
In contrast, the correlation between NDVI and NDBI, which measures built-up areas, consistently remained high across the years, starting at 0.6559 in 1996 and reaching 0.7027 by 2007. But, it decreased a little by reaching 0.6721 in 2023. Although a high correlation indicates a strong and relatively stable negative relationship between vegetation and built-up areas, higher vegetation density is consistently associated with lower levels of built-up land throughout the observed period.
The correlation between NDBI and LST demonstrates significant variability as well. It started at 0.2053 in 1996, suggesting a weak relationship between built-up areas and land surface temperature.
By 2007, this correlation increased to 0.5283, indicating a moderate to strong positive relationship, where more built-up areas were associated with higher temperatures. The correlation decreased to 0.2943 in 2016 but then rose again to 0.3374 in 2023, reflecting a moderate association between built-up areas and temperature with some fluctuation over time.
Overall, while the relationship between NDVI and LST weakened over the years, indicating less influence of vegetation on temperature, the correlation between NDVI and NDBI remained strong, pointing to a consistent inverse relationship between vegetation and built-up areas. The connection between NDBI and LST showed moderate variability, suggesting a complex interplay between urbanization and temperature changes.
3.6. Landscape Dynamics Along Urban–Rural Gradient Zones
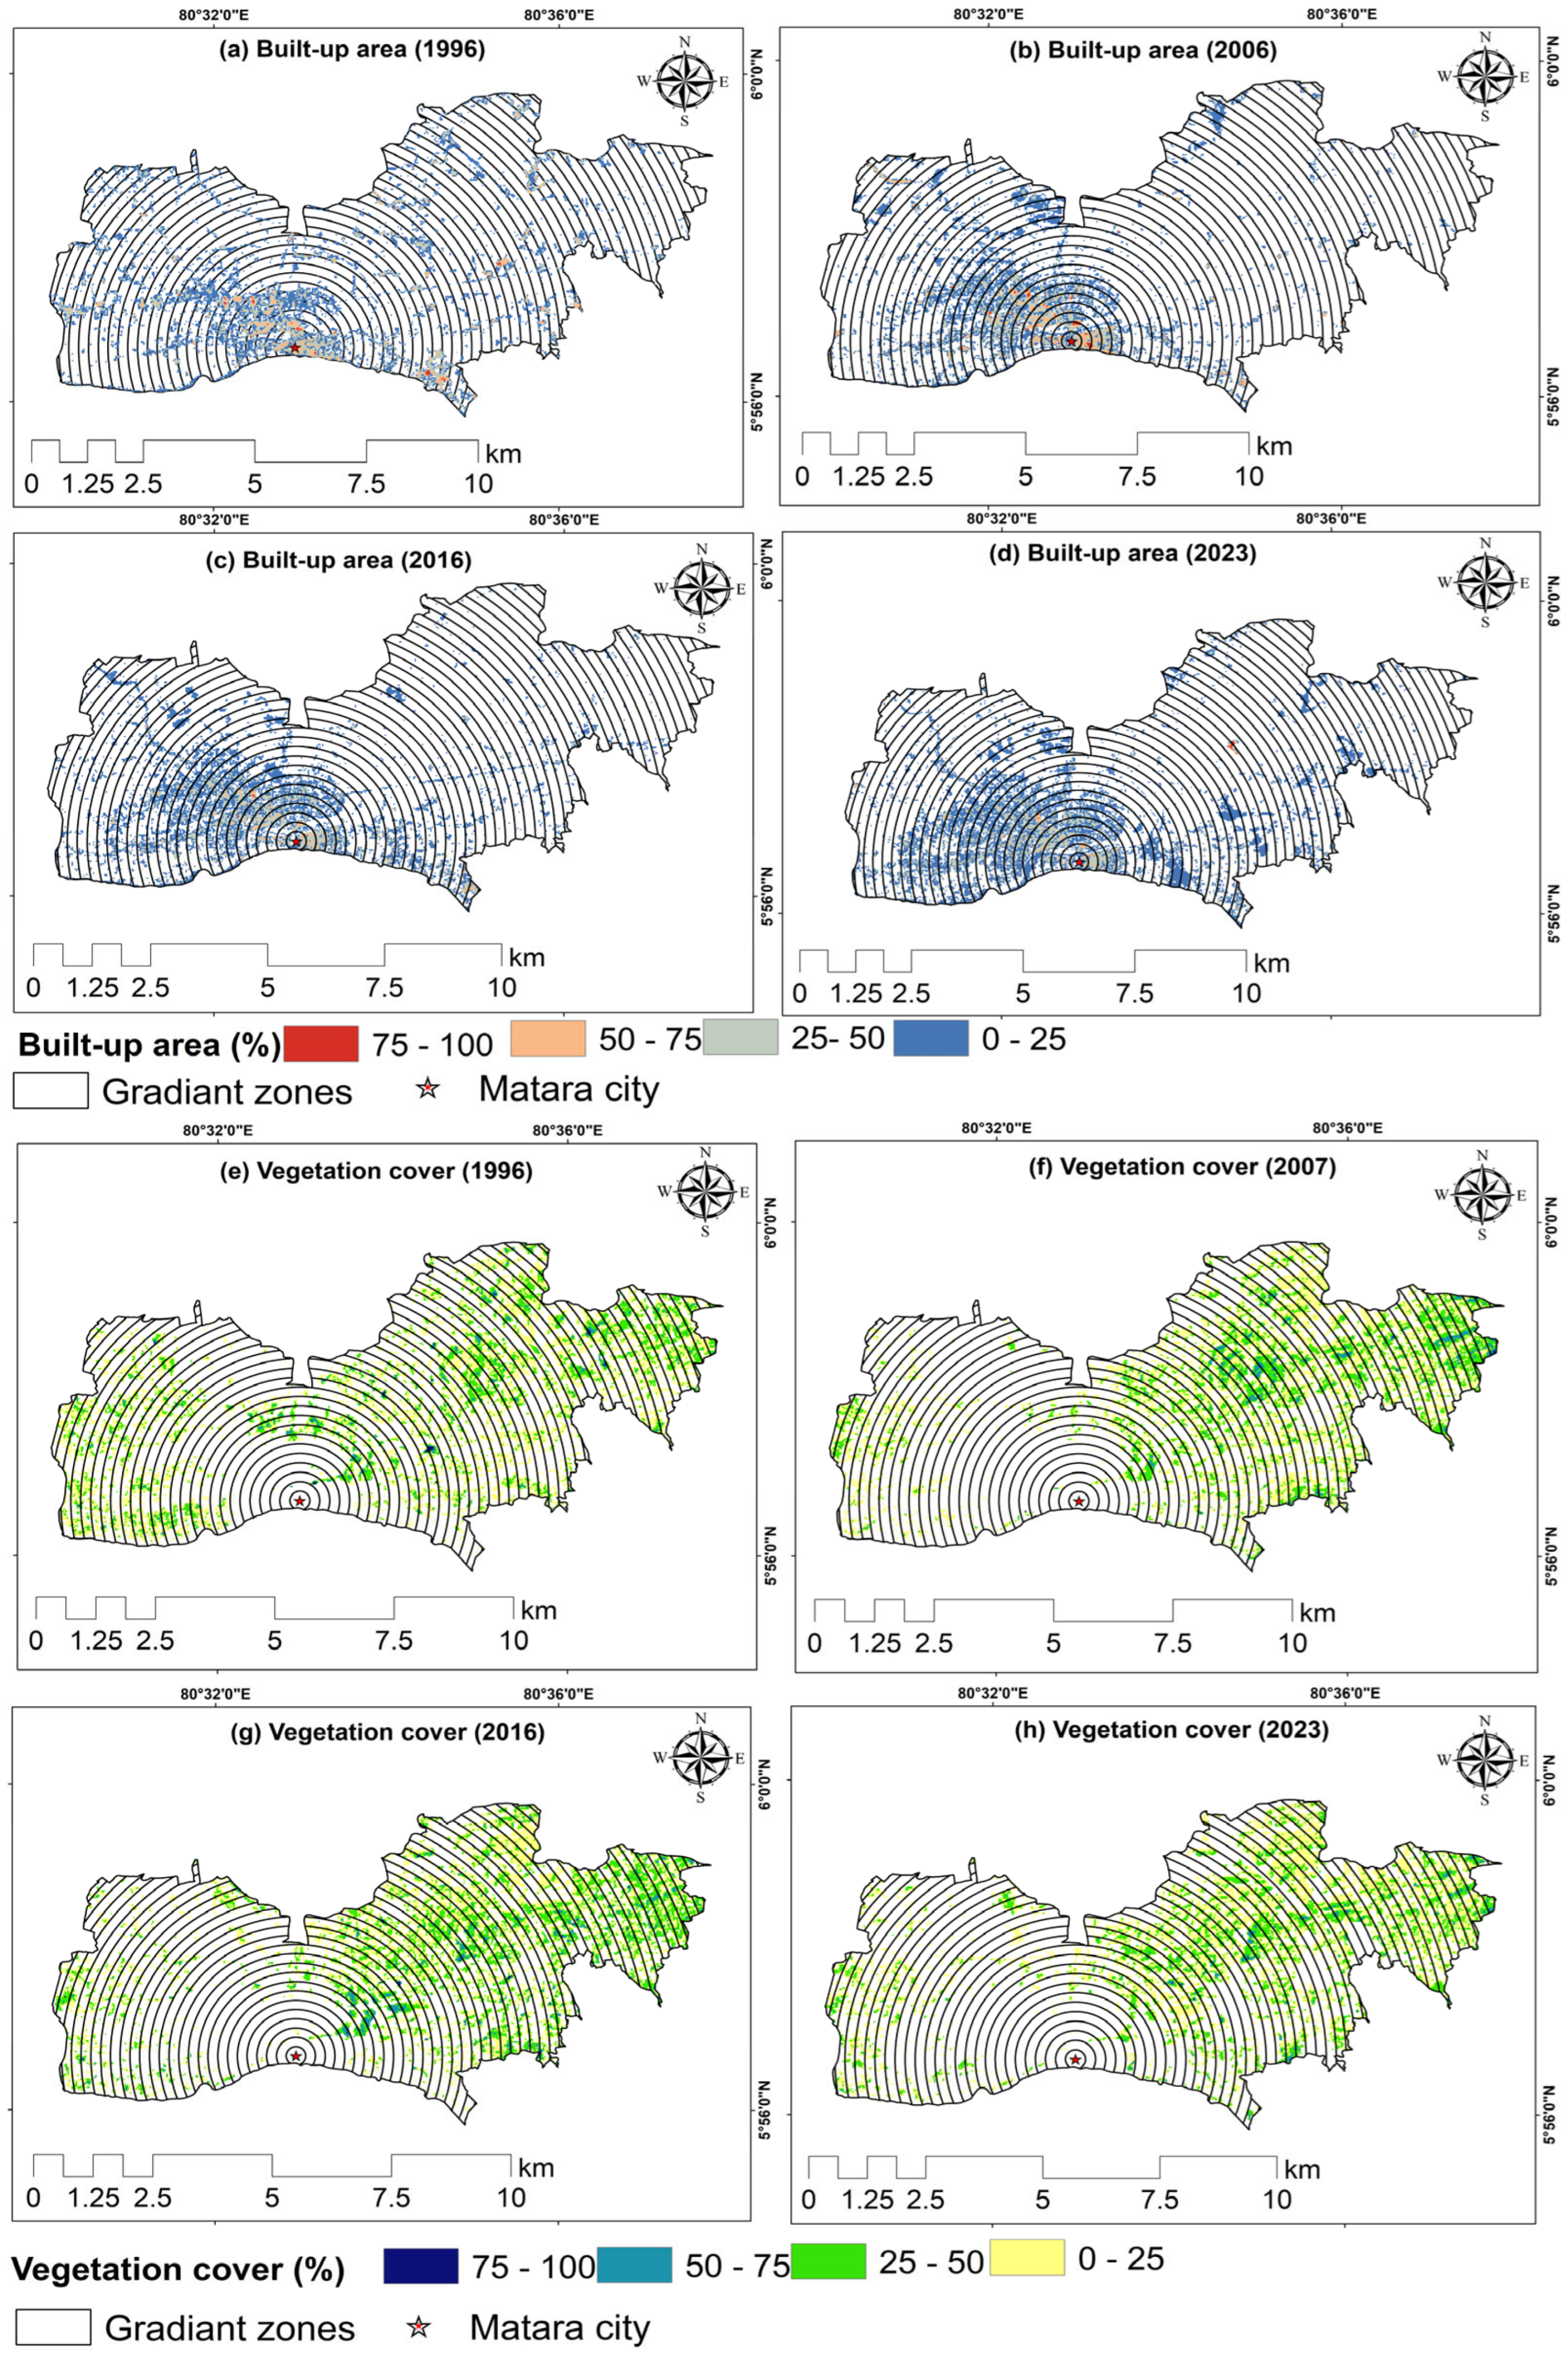
The derived 47 URGZ map, which illustrates the distribution of FBA and FVC within a 210 m radius from the city center in the Matara DSD area (
Figure 7), highlights a clear pattern: FBA decreases with increasing distance from the city core, while FVC rises as one moves away from the center. The highest mean LST values, ranging from 29 °C to 27 °C, were observed in URGZs 1 to 10, close to the city center. In contrast, the lowest mean LST values, between 24 °C and 23.7 °C, were recorded in URGZ 40 to 47, situated further from the urban core.
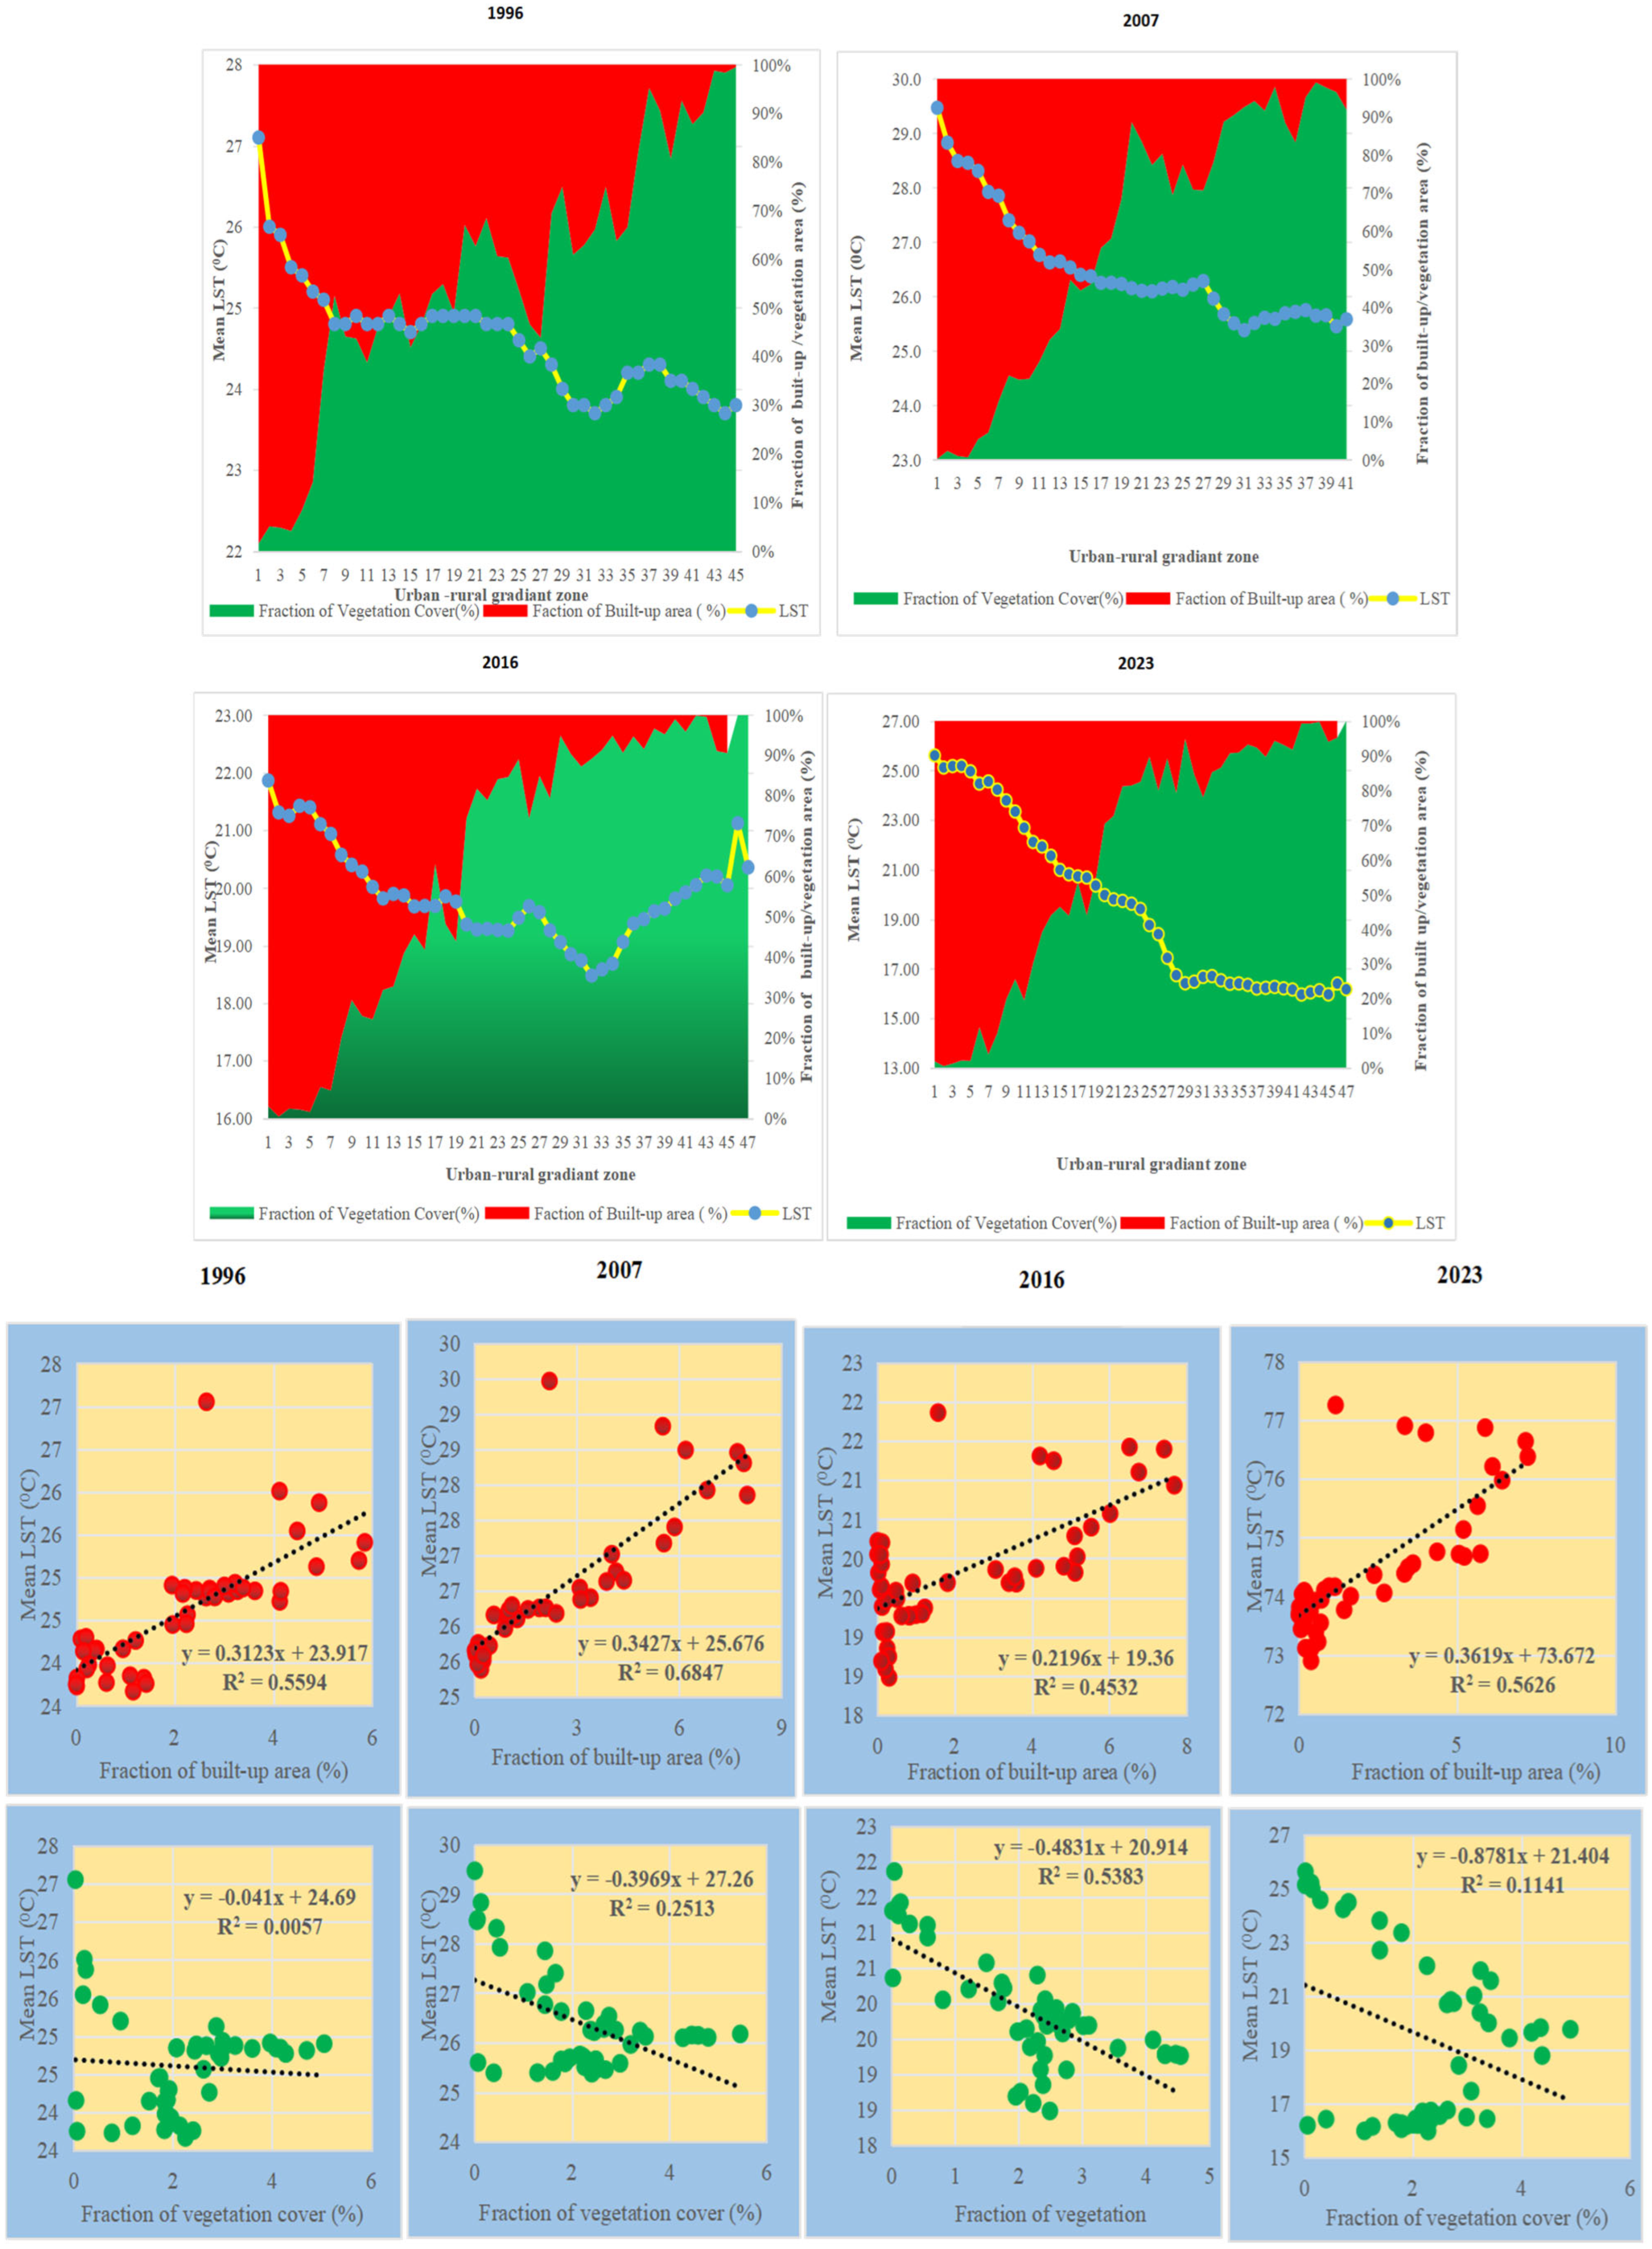
Figure 8 shows the spatial pattern of mean LST and the FBA and FVC along 47 URGZs. From 1996 to 2023 in the Matara DSD area, the data on FVC and FBA demonstrate evolving urban and vegetation patterns. In 1996, central zones were highly urbanized with very low FVC (0% to 0.2%) and high FBA (up to 5.9%). Vegetation cover increased to a peak of 5.0% in intermediate zones but decreased again in the outermost areas to 1.2% and lower. By 2007, FVC remained low, ranging from 0.0% to 5.5%, with the highest cover in less urbanized outer zones. FBA was notably high in the central areas (up to 8.0%) and decreased sharply towards the periphery. In 2016, FVC showed a slight decrease, from 0.0% to a maximum of 4.5%, with minimal cover in central zones (often around 0.0% to 0.3%) and higher values in less urbanized areas. FBA was high in the central zones (up to 7.7%) and lower in outer areas.
By 2023, FVC slightly increased to a range of 0.0% to 4.9%, with the highest values still in the less urbanized outer zones. Central zones continued to have very low FVC (below 1%), while FBA decreased overall, with the highest values in central zones (up to 7.2%) and minimal built-up areas in the periphery. This indicates a trend of reduced urbanization intensity in outer zones and a modest increase in vegetation cover over the years. The data from 1996 to 2023 for the Matara DSD area reveal a dynamic relationship between the FBA and FVC. The FBA values show an initial increase from 0.5594 in 1996 to 0.6847 in 2007, indicating growing urbanization. Concurrently, FVC rises from 0.0057 to 0.2513, reflecting a modest increase in vegetation despite urban expansion.
However, the trend shifted by 2016, with FBA decreasing to 0.4532 and FVC significantly rising to 0.5383, suggesting a period of reduced urban intensity and increased vegetation cover. The reason behind this may be attributed to climate change, as 2016 was possibly a cooler and rainy year compared to 2007. This cooler climate could have positively influenced vegetation condition and health, leading to an increase in the area of vegetation cover, which is reflected as an increased FVC in 2016 since FVC was extracted upon the NDVI. By 2023, FBA increases again to 0.5626 while FVC drops to 0.1141, showing a return to higher urbanization with a slight reduction in vegetation. This pattern suggests a generally inverse relationship between FBA and FVC, where higher urbanization typically corresponds with lower vegetation cover. The fluctuations in the data indicate that while this inverse relationship holds over time, there are periods where both FBA and FVC increase simultaneously or where the trend reverses, reflecting a complex interplay between urban development and vegetation dynamics.
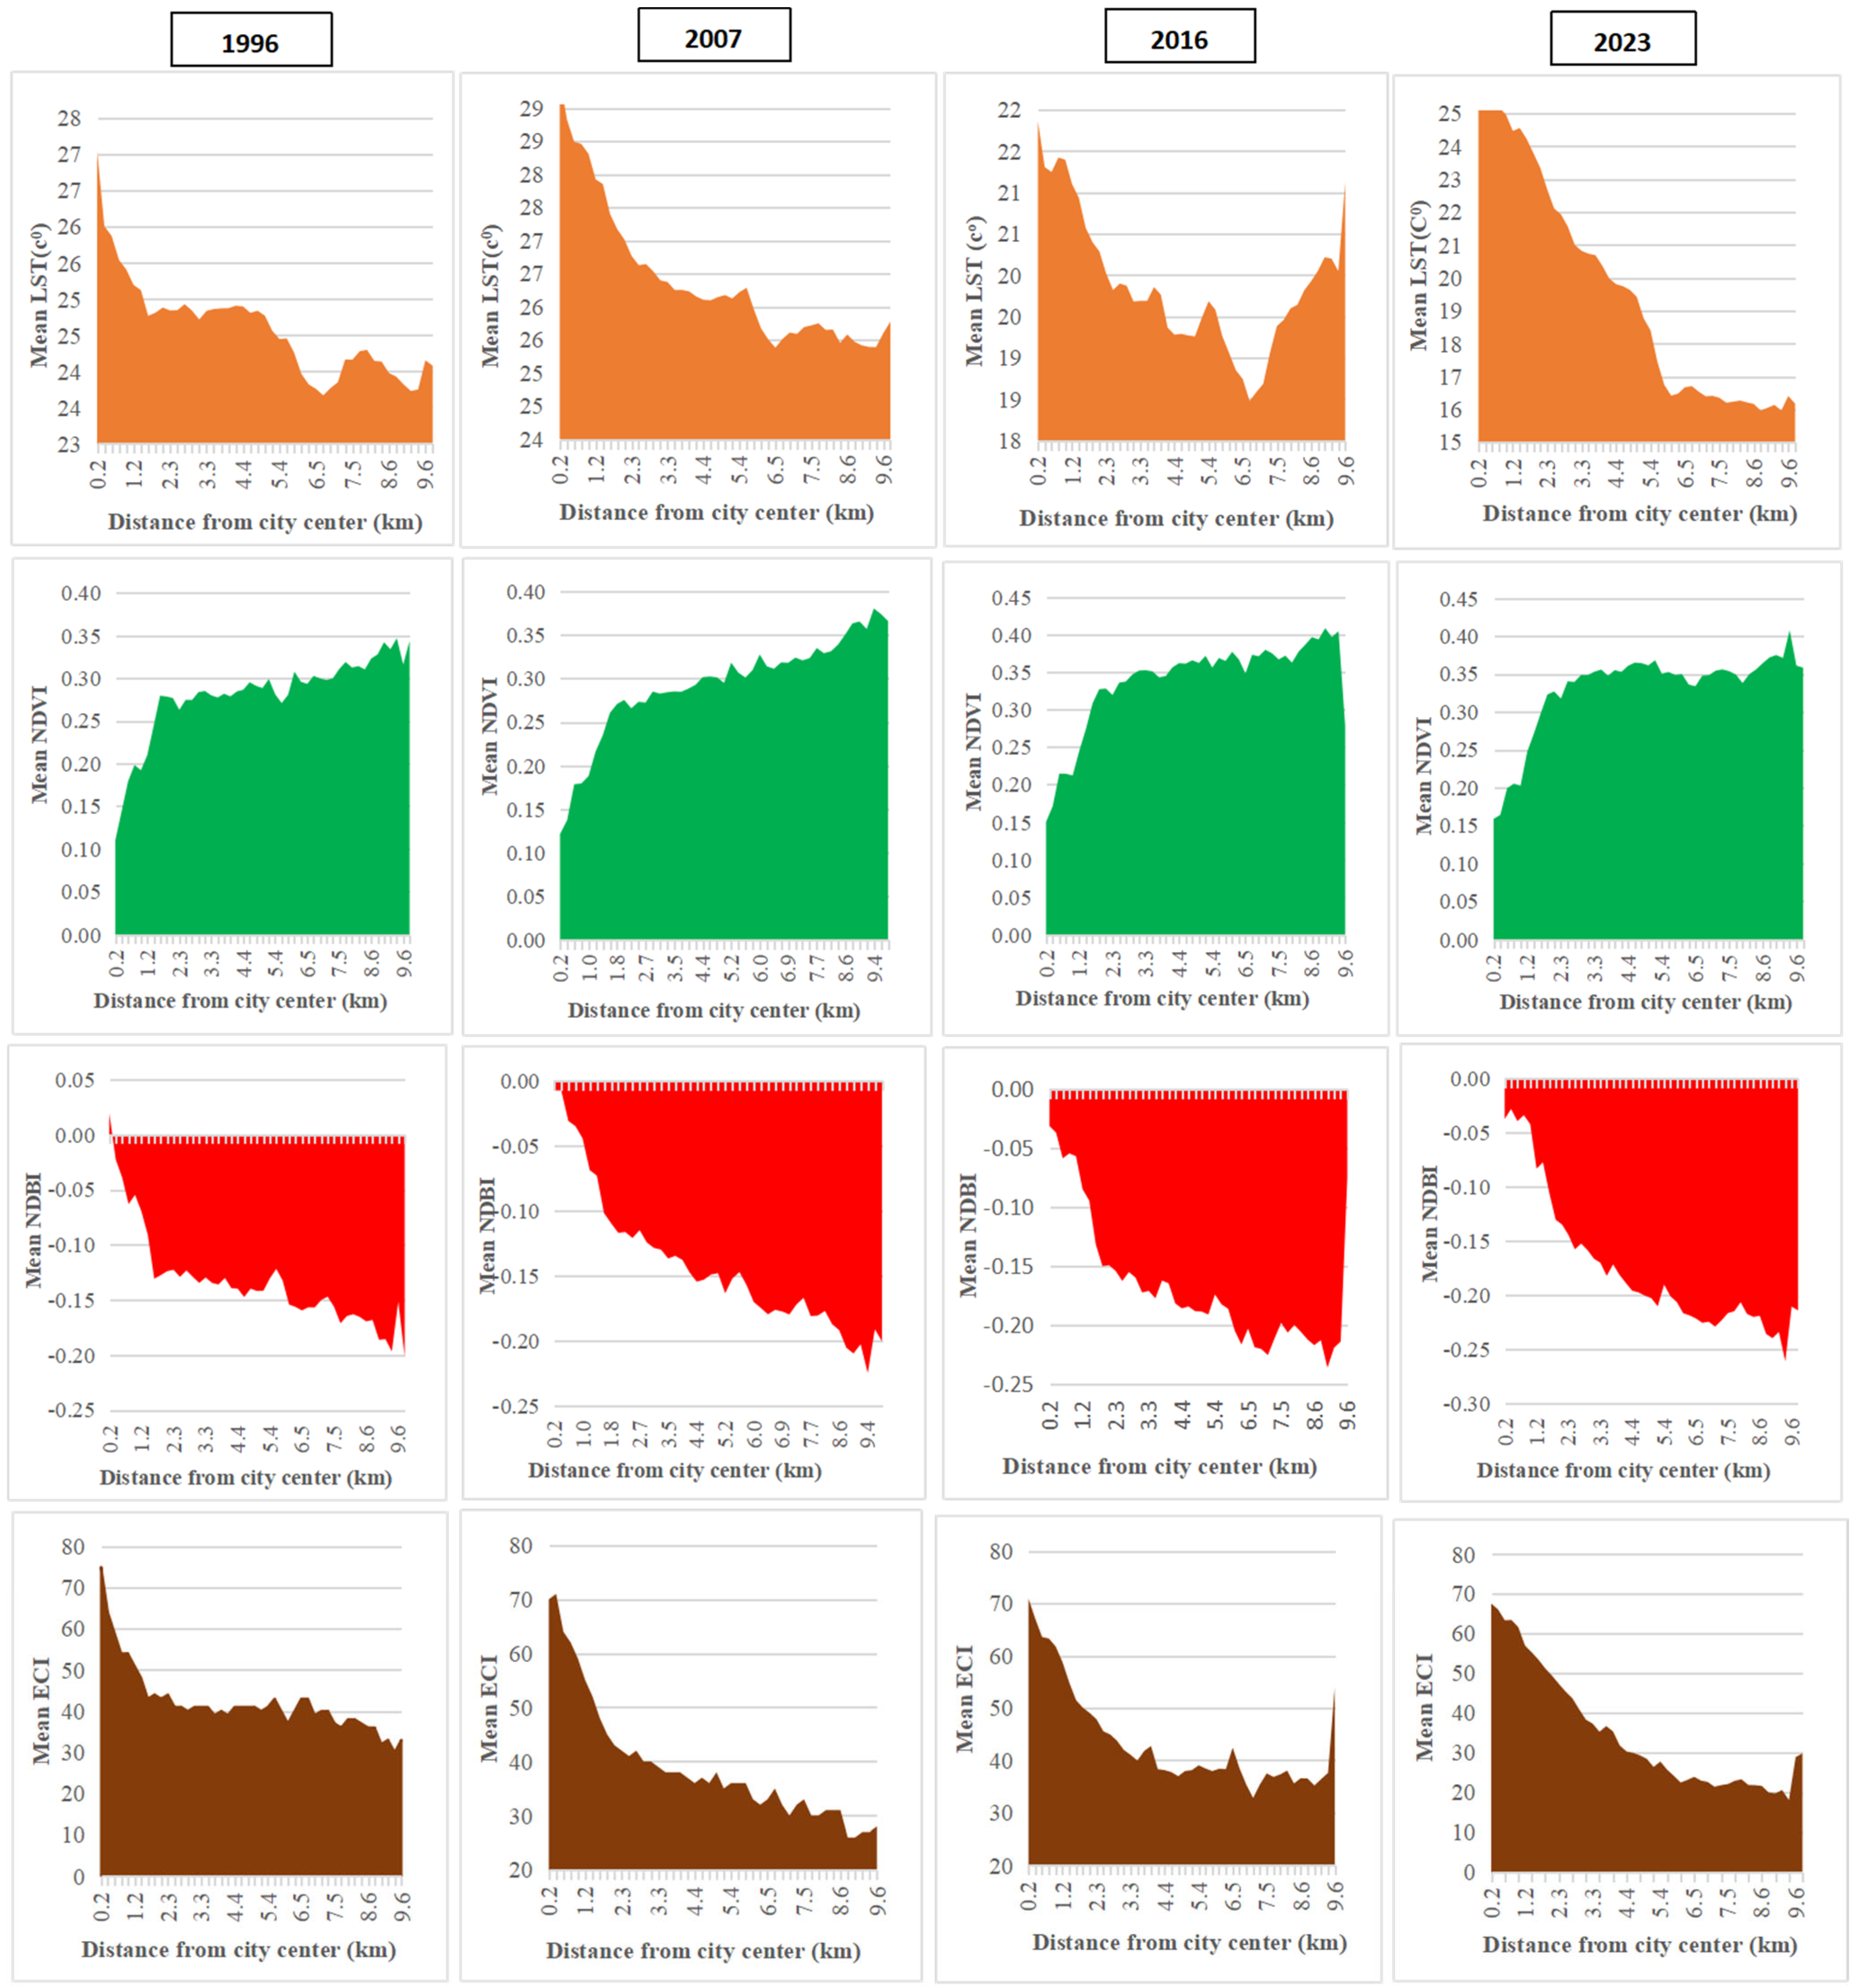
Figure 9 illustrates the distribution patterns of mean LST, mean NDVI, mean NDBI, and mean ECI across gradient zones for the years 1996, 2007, 2016, and 2023. A relatively higher mean LST was observed from the urban core, extending up to 1.2 km outward. The highest mean LST was recorded in 1996 and 2007, followed by a slight decrease in 2016, before rising again by 2023. Across all years, there was a significant drop in LST around 6.5 km from the core, which then increased further outward.
The mean NDVI also showed a notable increase from 0.20, extending up to 1.2 km in all years, and reached approximately 0.35 in the rural periphery, which is around 9.6 km from the urban core. The mean NDBI increased each year in almost all gradient zones, with significant growth observed in 2023. The highest mean NDBI was reported from the urban core extending up to 1.2 km outward. From the outskirts toward the city center, the mean ECI decreased in 2006 and 2016. However, in 2016 and 2023, it showed a slight increase up to 9 km from the city core. Overall, the mean ECI exhibited a slight decreasing trend by 2023 compared to 1996.
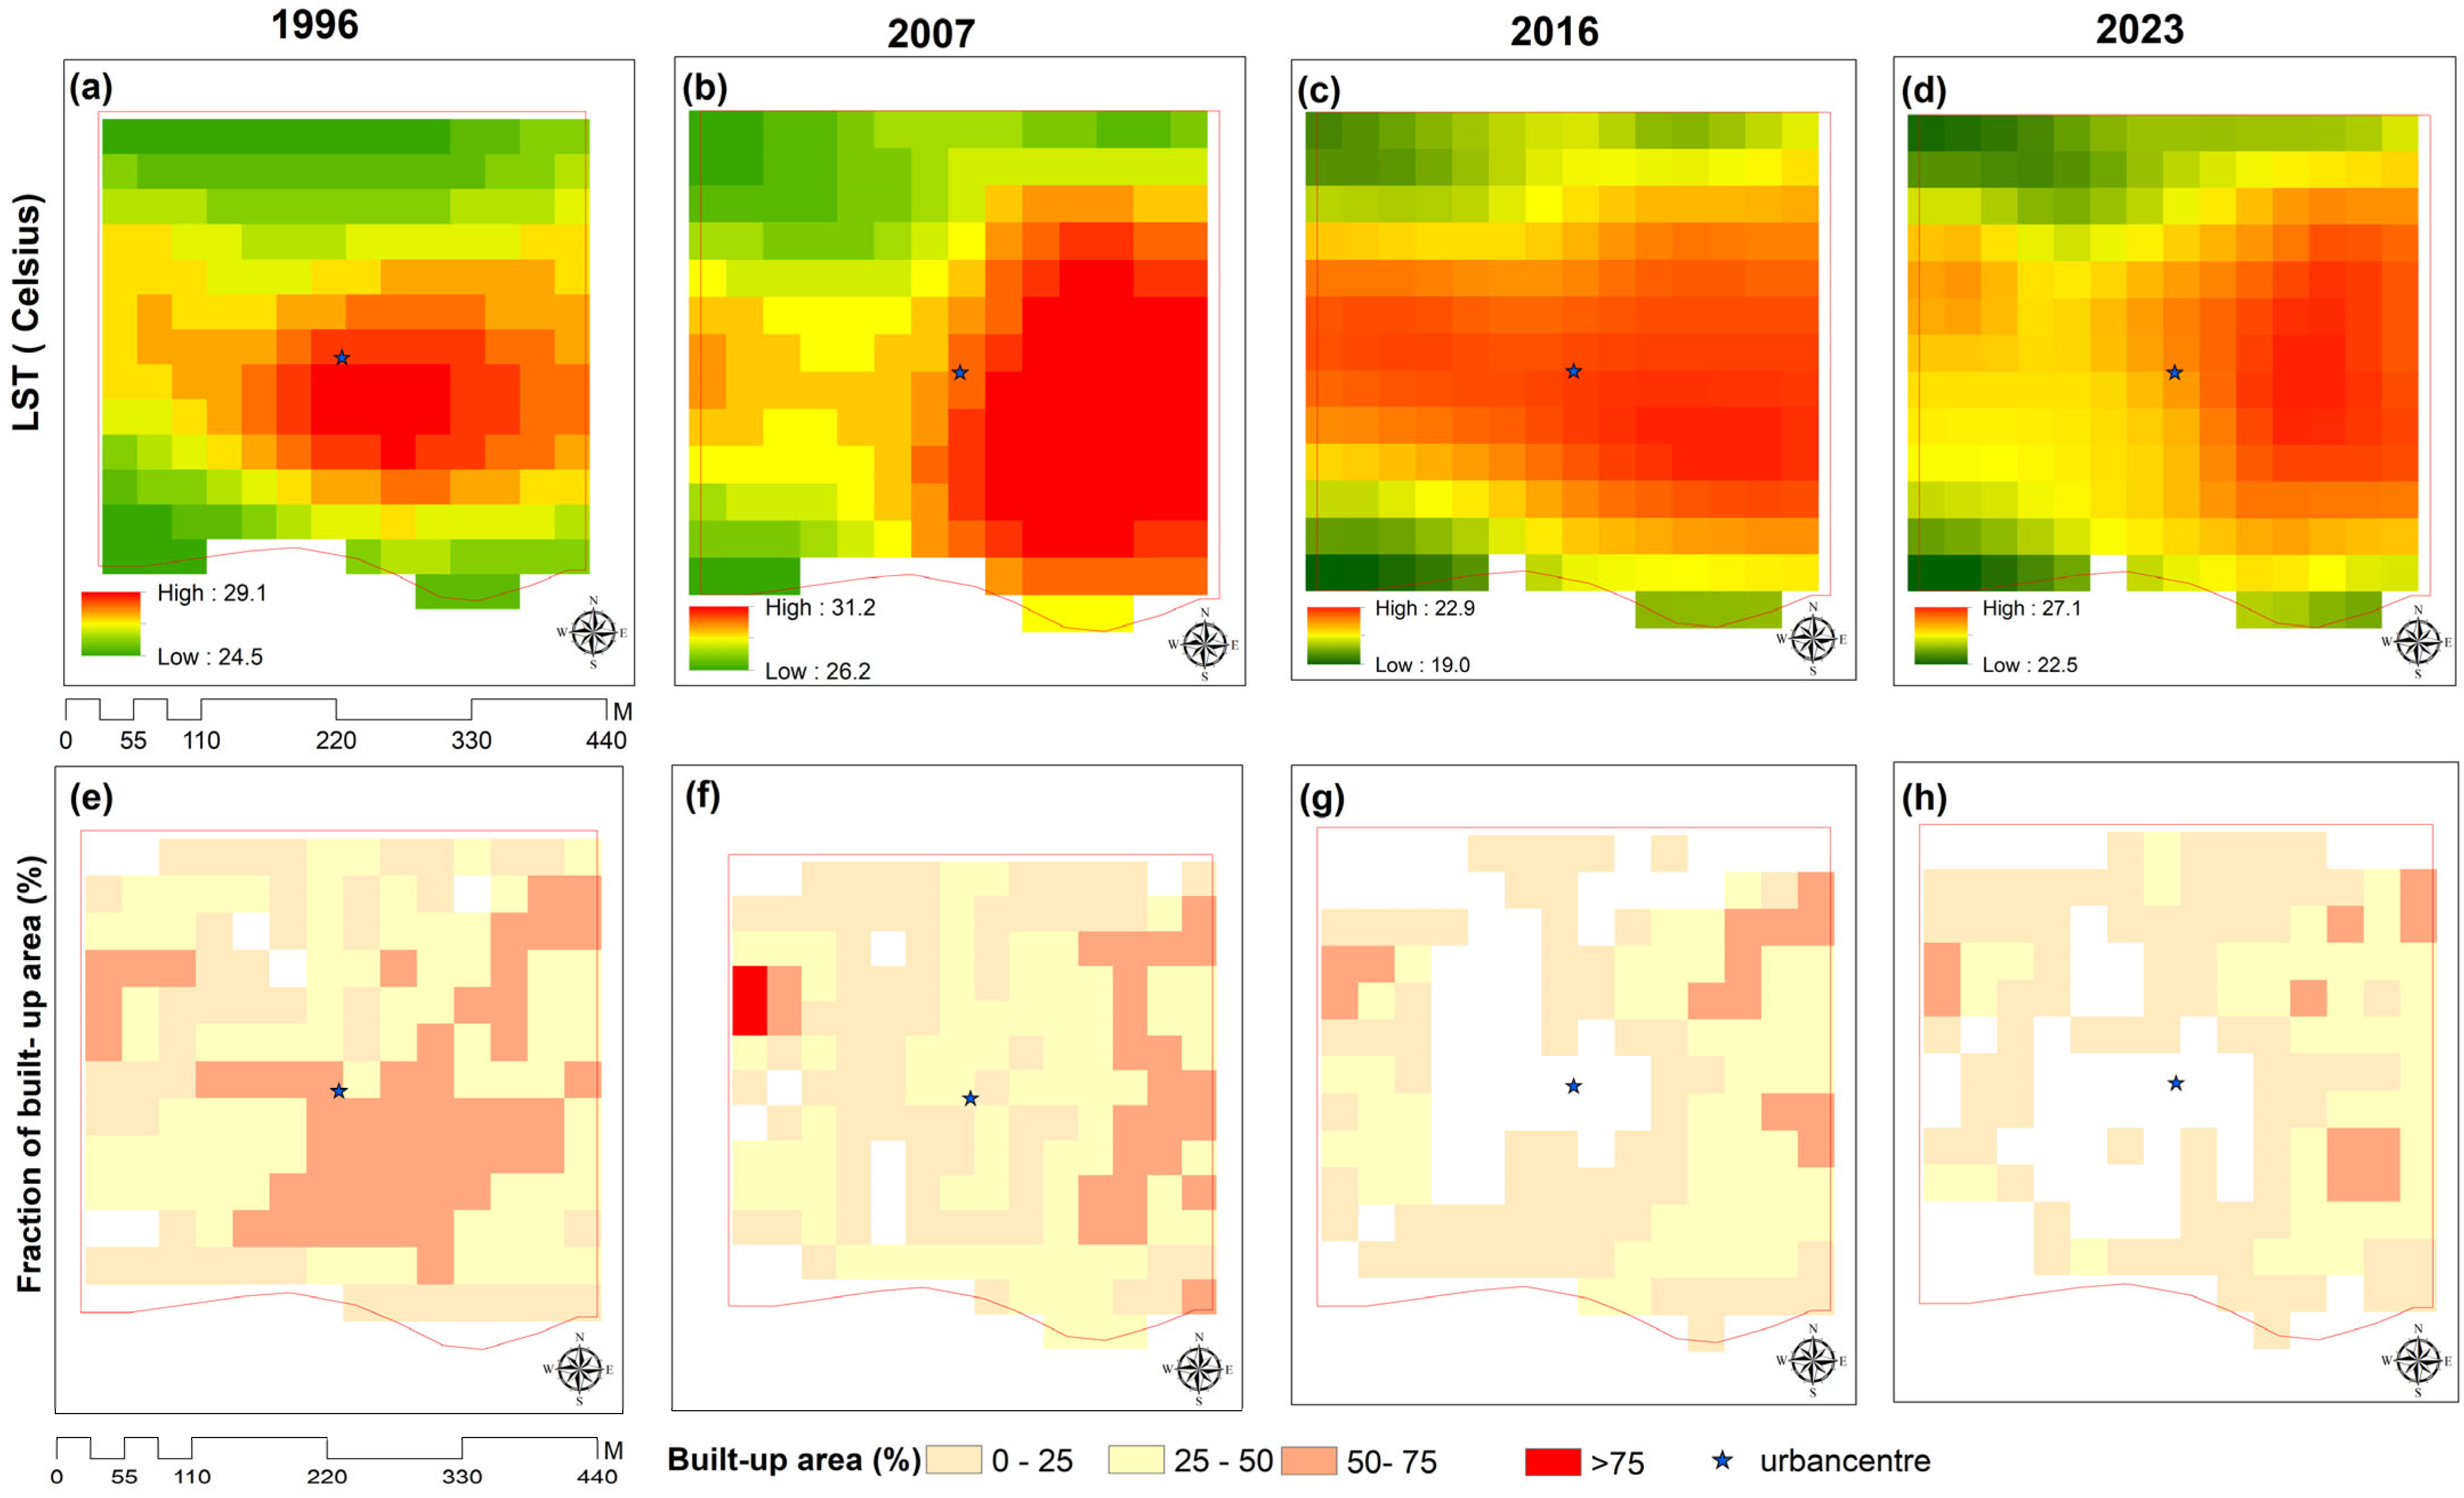
3.7. Dynamics of LST and FBA Within Urban Core
Figure 10 illustrates the spatial distribution and concentration patterns of mean LST and FBA (%) in the urban core across the 210 m × 210 m grid from 1996 to 2023. The highest mean LST was concentrated in the urban core area and displayed an increasing trend toward the southeast from the city center. The results revealed that the highest mean LST, reaching 31 °C, was concentrated in the southeastern portion of the city core in 2007, while the northwestern portion reported a lower LST. The northern and southern grid areas consistently showed comparatively lower mean LST across all years. The most notable observation is that a small vegetation patch was identified in the central part of the urban core grid in the years 2016 and 2023. Comparatively high FBA was observed in the years 1996 and 2007.
3.8. Environmental Criticality in Matara DSD
The environmental criticality maps for the Matara MC area, derived by integrating LST and NDVI images, are depicted in
Figure 11, and descriptive statistics are in
Table A6. In creating the ECI maps, areas covered by vegetation and water bodies were excluded, as these regions are considered to have no criticality [
21,
22]. This exclusion ensures that the criticality maps accurately reflect the environmental pressures in urbanized and potentially vulnerable areas, providing a clear assessment of environmental criticality in regions where vegetation and water bodies do not influence the results.
The ECI for 1996 across the 47 URGZ in Matara DSD exhibits a notable gradient of environmental stress. The highest ECI value of 75, observed in the most urbanized central zones, signifies significant environmental criticality in areas of dense development. Moving outward from the city center, there is a general decline in ECI values, with many zones showing values between 30 and 54. This decreasing trend indicates lower levels of environmental stress in less developed, peripheral areas. The clustering of values around 36 to 54 in the outer zones reflects moderate environmental pressures, suggesting that while these areas are less stressed compared to the urban core, they still face considerable environmental challenges. Overall, the data highlight a gradient of environmental criticality, with the most severe pressures found in the urban core areas and decreasing towards the outskirts.
In 2007, the ECI across the 47 Urban Gradient Zones in Matara DSD presented a noticeable shift in environmental stress compared to previous years. The highest ECI value of 71 is found in the most urbanized central zones, indicating continued significant environmental criticality in these areas. However, there is a marked reduction in ECI values as one moves away from the city center. Peripheral zones exhibit lower ECI values, with many falling between 26 and 36. This decline suggests an improvement in environmental conditions in the less developed outer areas. The clustering of values around 30 to 35 in these zones reflects relatively lower but still notable levels of environmental stress. Overall, while central urban zones continue to experience high criticality, there is a clear trend towards reduced environmental pressure in the outer zones, indicating some progress in mitigating environmental issues in less developed areas.
In 2016, the ECI for the 47 URGZs in Matara DSD indicated a pattern of moderate environmental stress across the region. The highest ECI value of 67 is observed in the central zones, reflecting substantial environmental challenges in the most urbanized areas. Moving outward, there is a gradual decline in ECI values, with many zones exhibiting values between 30 and 35, suggesting reduced criticality in less developed areas. The peripheral zones show lower ECI values, with some as low as 27 to 28, indicating relatively better environmental conditions compared to the central areas. This distribution highlights a continued concentration of environmental stress in the urban core, while peripheral areas experience less criticality, reflecting a trend of improving environmental conditions outside the most densely built-up zones.
In 2023, the ECI across the 47 Urban Gradient Zones in Matara DSD shows a generally stable pattern with some notable variations. The ECI values in the central zones remain relatively high, with values of around 60 to 64, indicating ongoing environmental stress in the most urbanized areas. Moving outward, there is a slight decrease in ECI values, with many peripheral zones showing values between 31 and 45, suggesting moderately improved environmental conditions as urbanization decreases. A few areas at the extreme periphery report lower values, dropping to 28, reflecting better environmental conditions. This distribution underscores a trend of maintaining high environmental criticality in the core urban areas while experiencing slight improvements in the less densely developed zones, indicating ongoing environmental challenges in central zones but with some progress in less urbanized areas.
Over the years, from 1996 to 2023, the ECI for the 47 URGZs in Matara DSD demonstrates a trend of persistent environmental stress in urban areas with gradual improvements in less developed zones. In 1996, the highest ECI values were observed in the central urban zones, indicating significant environmental criticality. As one moved outward, the ECI values decreased, showing lower levels of stress in peripheral areas. By 2007, the central zones continued to show high ECI values, but there was a noticeable reduction in environmental stress in the outer zones, suggesting some progress. In 2016, while central zones still exhibited high ECI values, indicating substantial environmental challenges, peripheral zones showed further improvement with lower ECI values. By 2023, the central areas maintained high ECI values, reflecting ongoing environmental stress, while peripheral zones saw modest improvements, with some areas reporting notably lower ECI values. Overall, the data reflect a consistent pattern of high environmental criticality in central urban zones and improving conditions in less developed areas over time.


 ,
, 


