
Analysis of Greenhouse Gas Emissions of a Mill According to the Greenhouse Gas Protocol


Abstract
1. Introduction
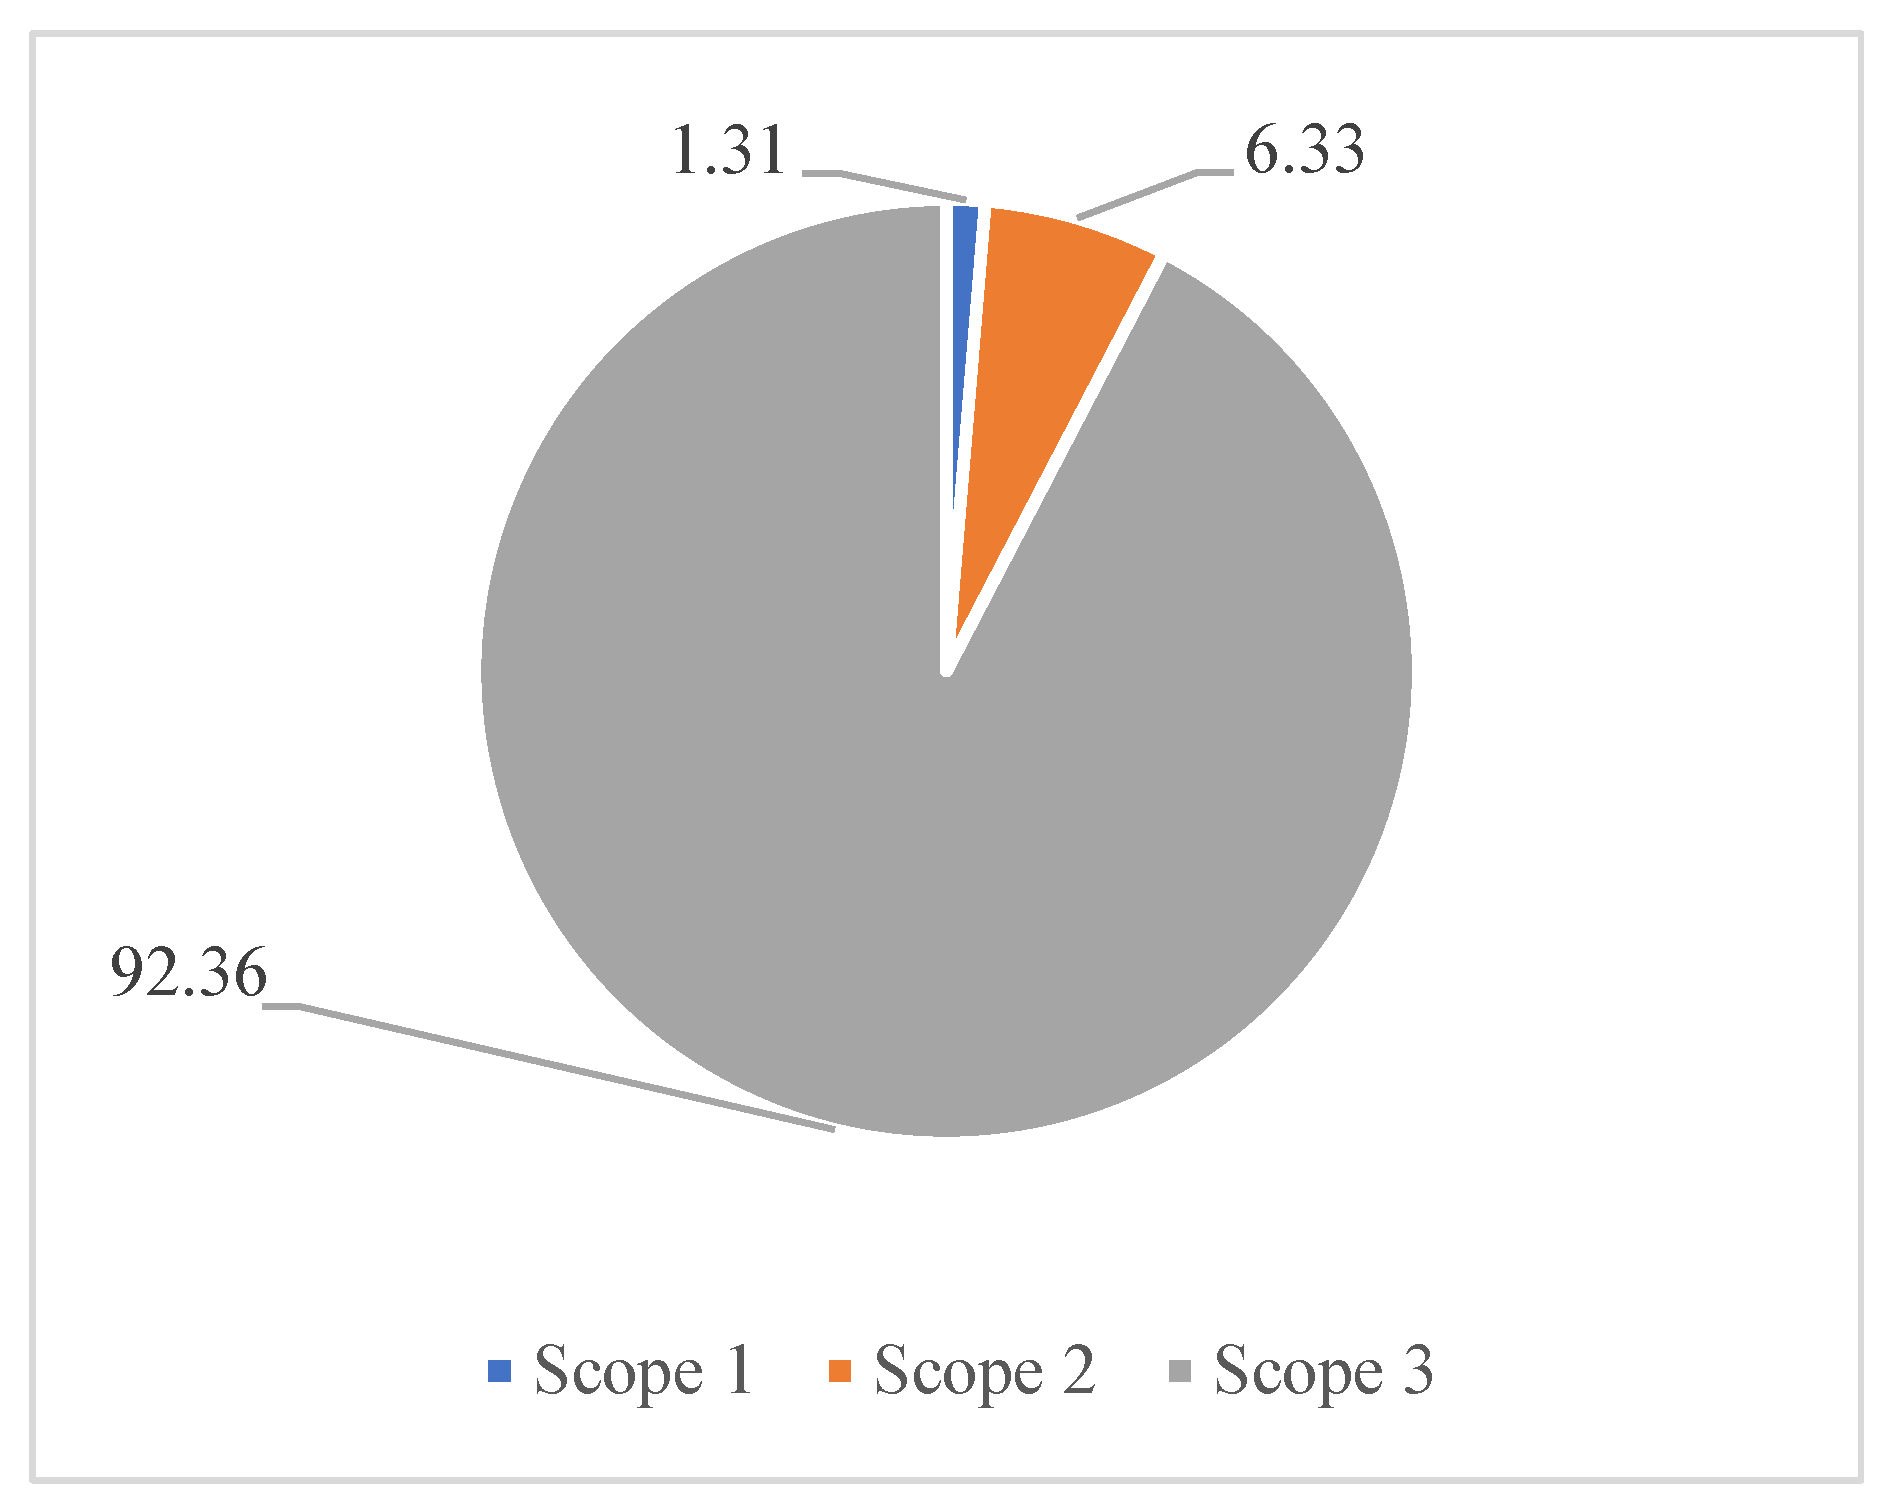
- Scope 1 includes direct emissions resulting from the consumption of fuels and other manufacturing and technological processes and the volatilization of refrigerants;
- Scope 2 includes indirect emissions resulting from the consumption of electricity, district heating and cooling and process steam;
- Scope 3 includes other indirect emissions generated throughout the value chain, such as the purchase/transportation of raw materials and semi-products or the transportation of products, waste management and business travel.
2. Research Material
3. GHG Emission Analysis Methodology
- Direct emissions resulting from, among other things, fuel combustion and processing and natural processes:
- Indirect emissions resulting from the use of energy media (electricity, heat) and/or raw materials in the production of a product or manufacturing process.
Carbon Footprint Calculation Methodology
- Transportation of raw material: transportation of wheat to the mill;
- Processing at the mill: the process of grinding wheat into flour;
- Delivery to the customer: transportation of flour to points of sale or bread production;
- Manufacture of purchased raw materials;
- Employee business travel.
4. Results and Discussion
5. Summary
Author Contributions
Funding
Institutional Review Board Statement
Informed Consent Statement
Data Availability Statement
Conflicts of Interest
Appendix A

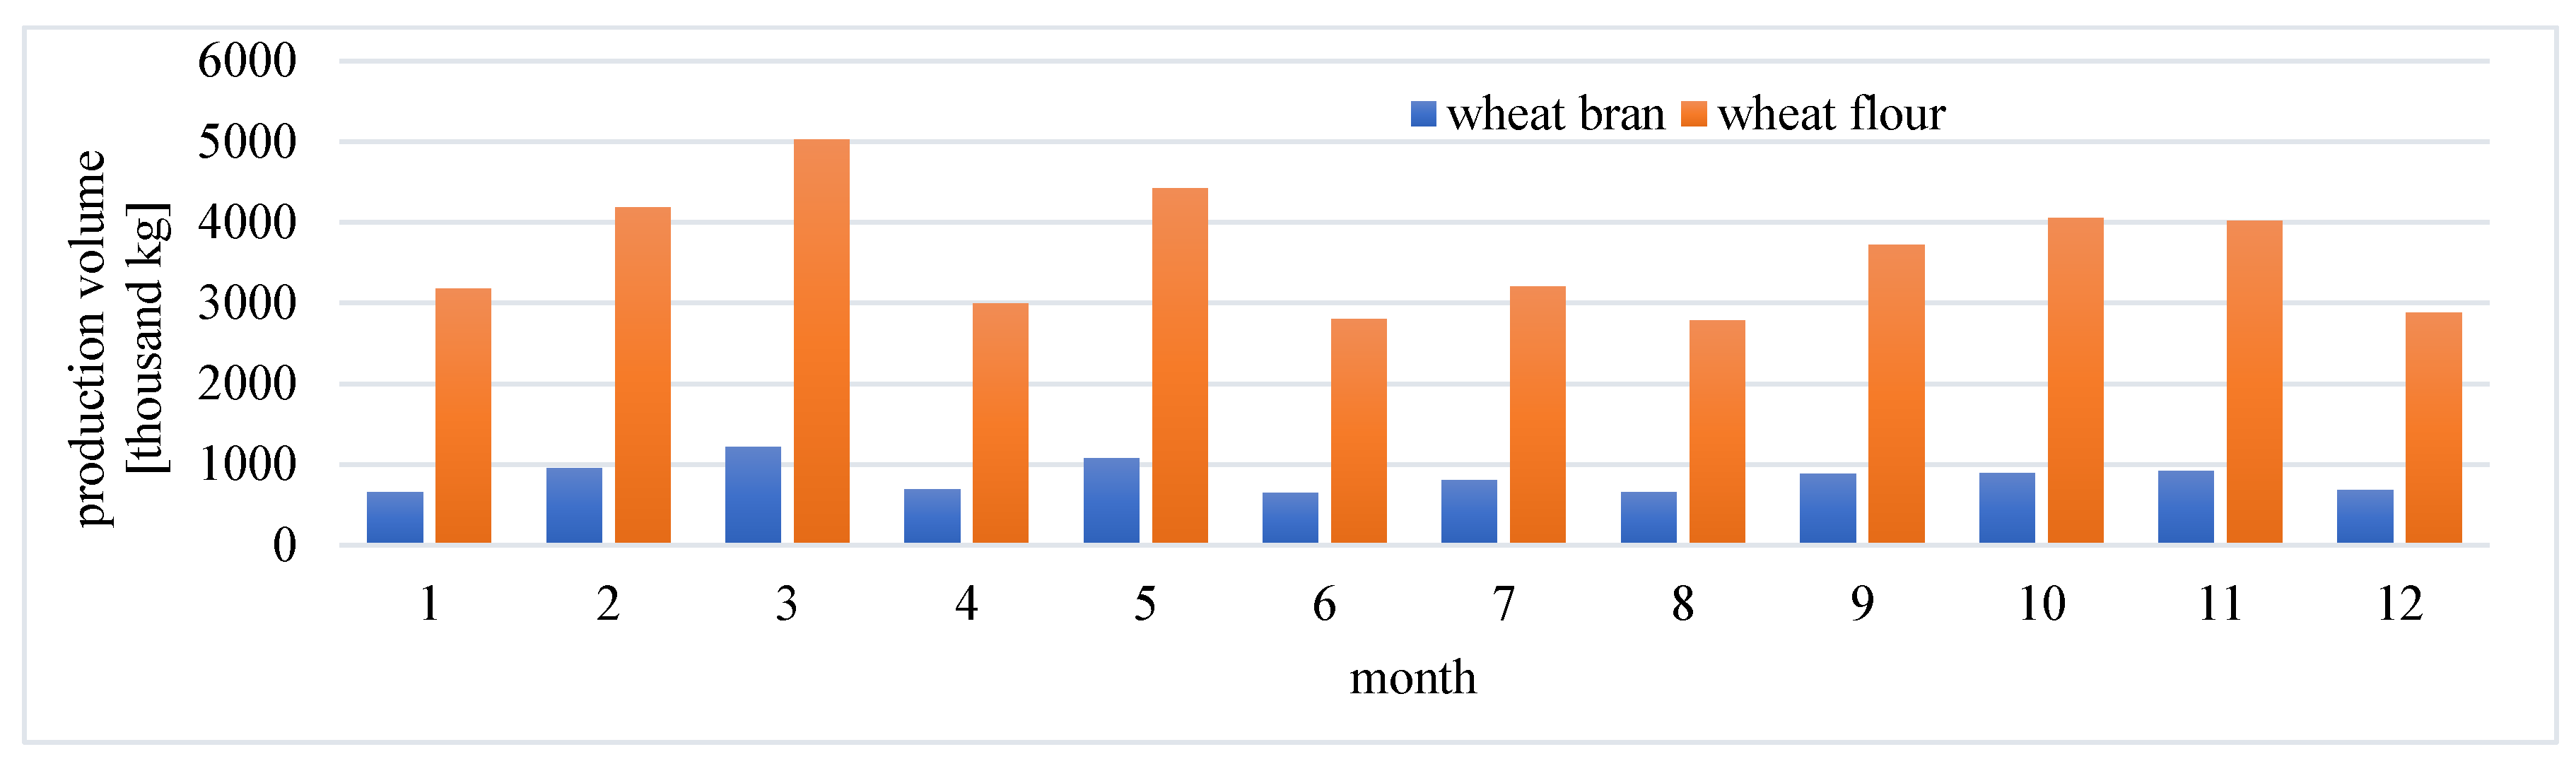
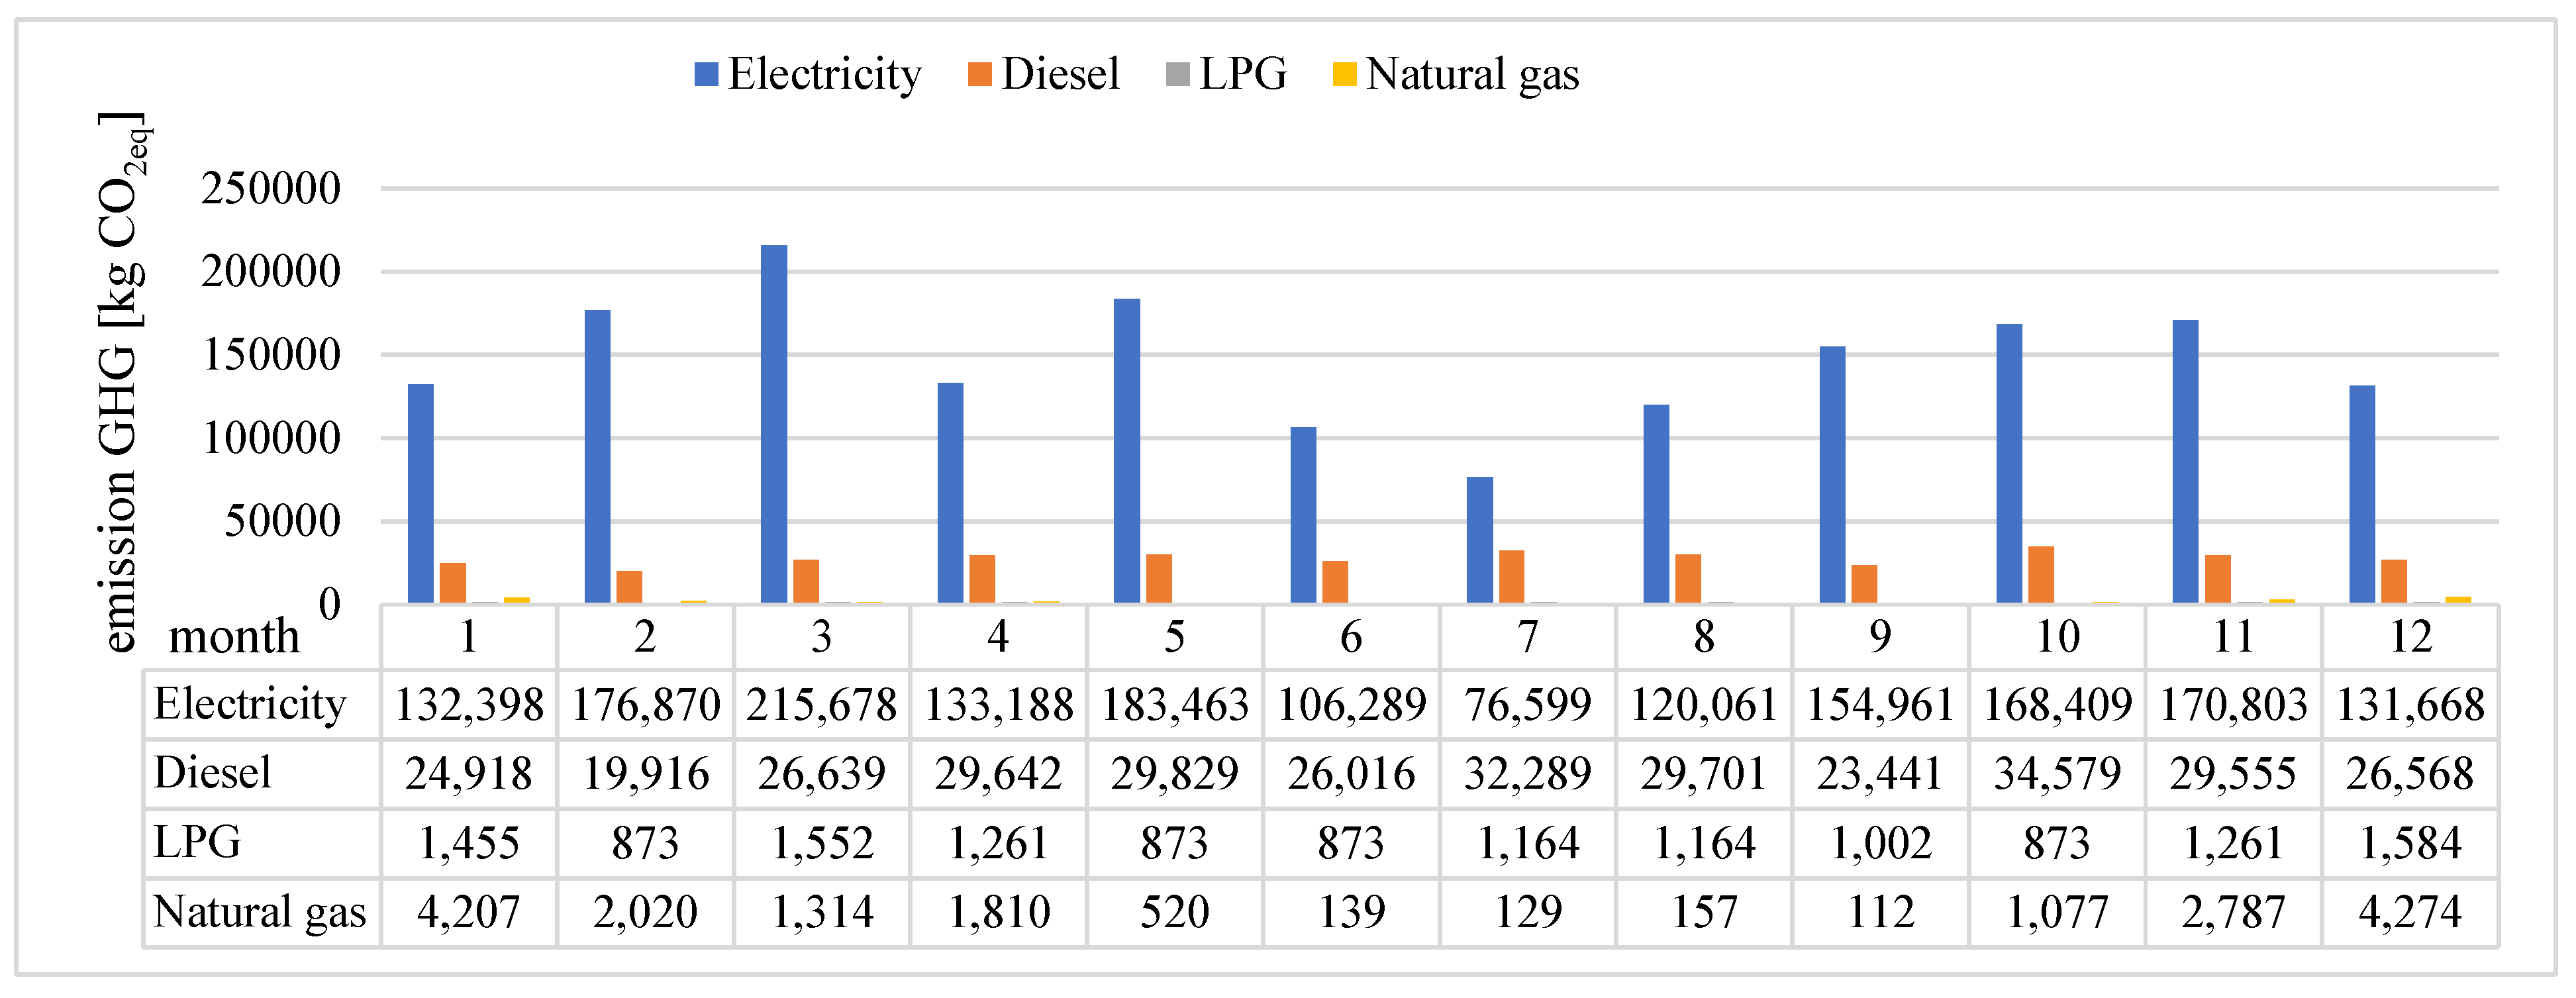
| Month | Production Volume | Electricity | Diesel | LPG | Natural Gas |
|---|---|---|---|---|---|
| kg | kWh | liter | kg | m3 | |
| January | 3,842,655 | 193,282 | 9,367.66 | 495 | 2062 |
| February | 5,147,200 | 258,205 | 7487.32 | 297 | 990 |
| March | 6,239,075 | 314,859 | 10,014.83 | 528 | 644 |
| April | 3,683,355 | 194,435 | 11,143.48 | 429 | 887 |
| May | 5,506,800 | 267,829 | 11,213.89 | 297 | 255 |
| June | 3,453,070 | 155,166 | 9780.52 | 297 | 68 |
| July | 4,008,965 | 111,824 | 12,138.67 | 396 | 63 |
| August | 3,436,500 | 175,271 | 11,165.85 | 396 | 77 |
| September | 4,605,080 | 226,220 | 8812.33 | 341 | 55 |
| October | 4,945,420 | 245,853 | 12,999.45 | 297 | 528 |
| November | 4,940,890 | 249,348 | 11,110.99 | 429 | 1366 |
| December | 3,564,920 | 192,216 | 9988.06 | 539 | 2095 |
| 53,373,930 | 2,584,508 | 125,223.05 | 4741 | 9090 |
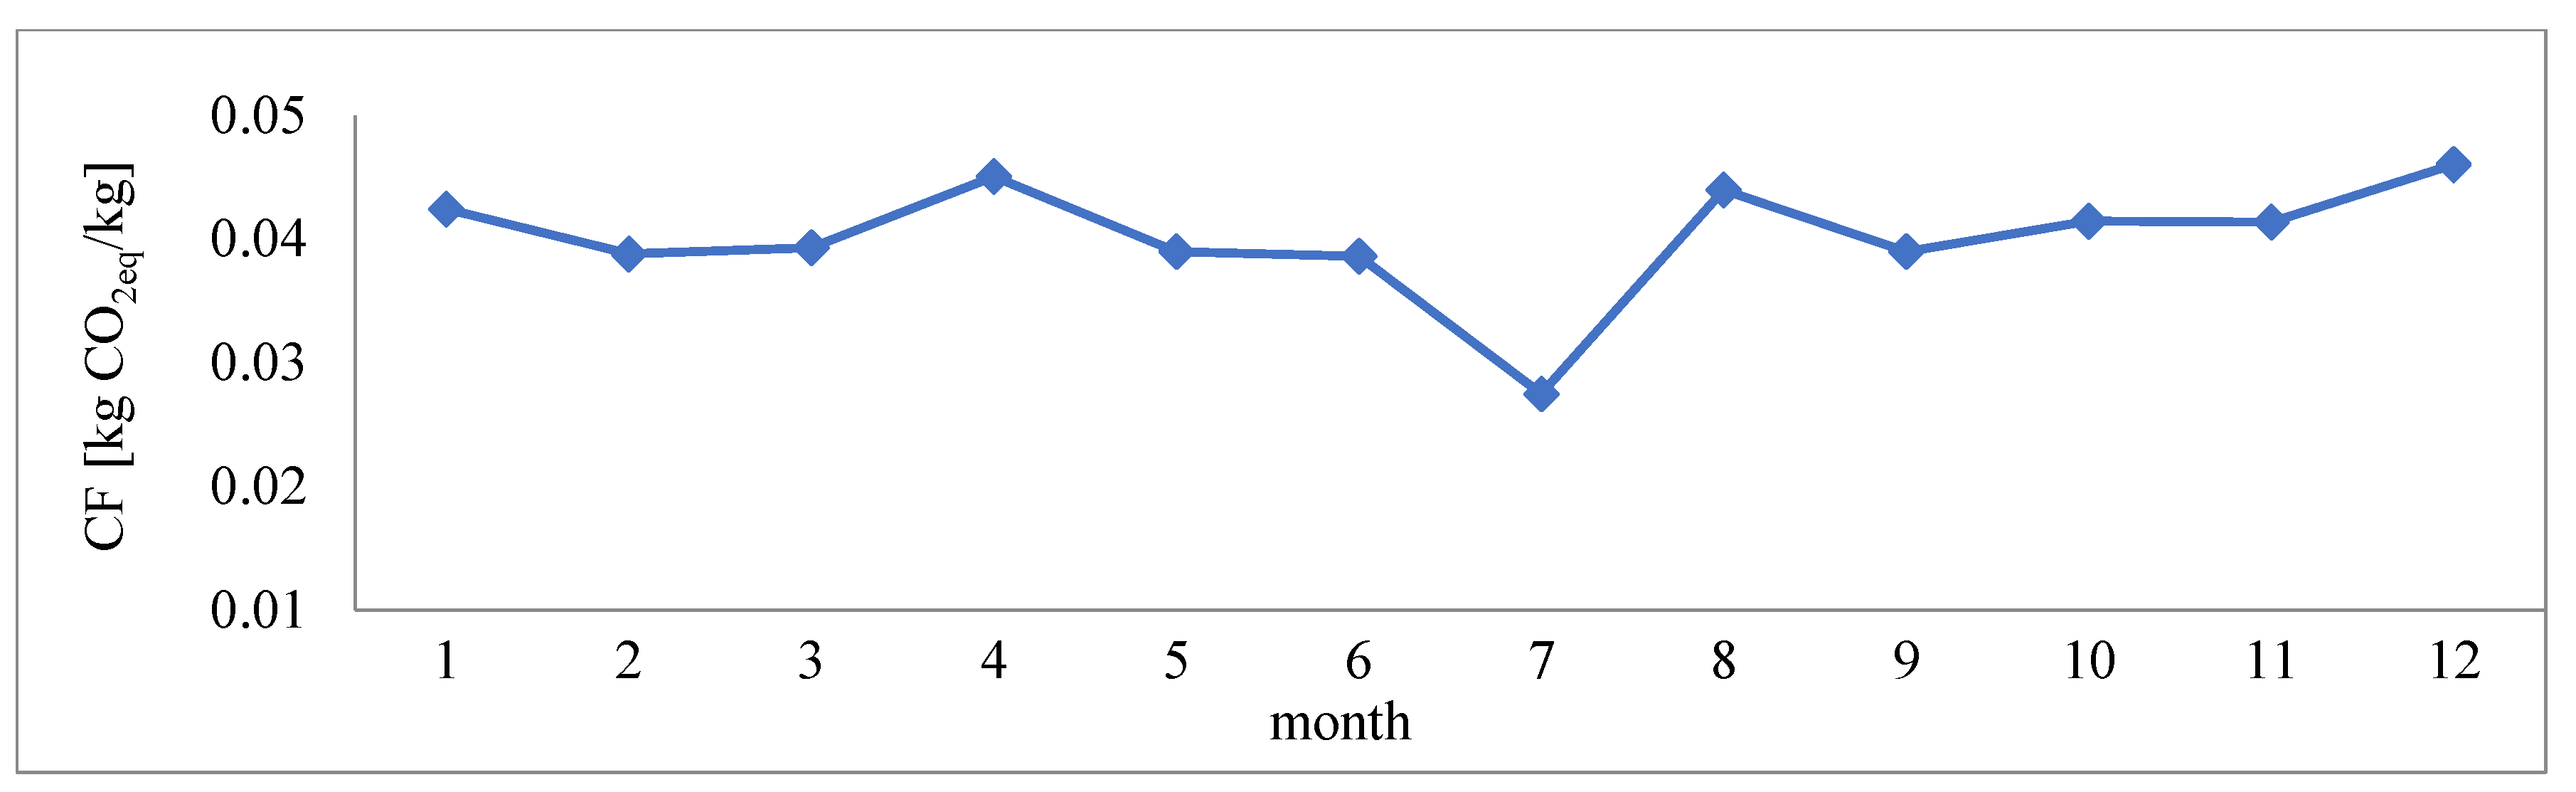
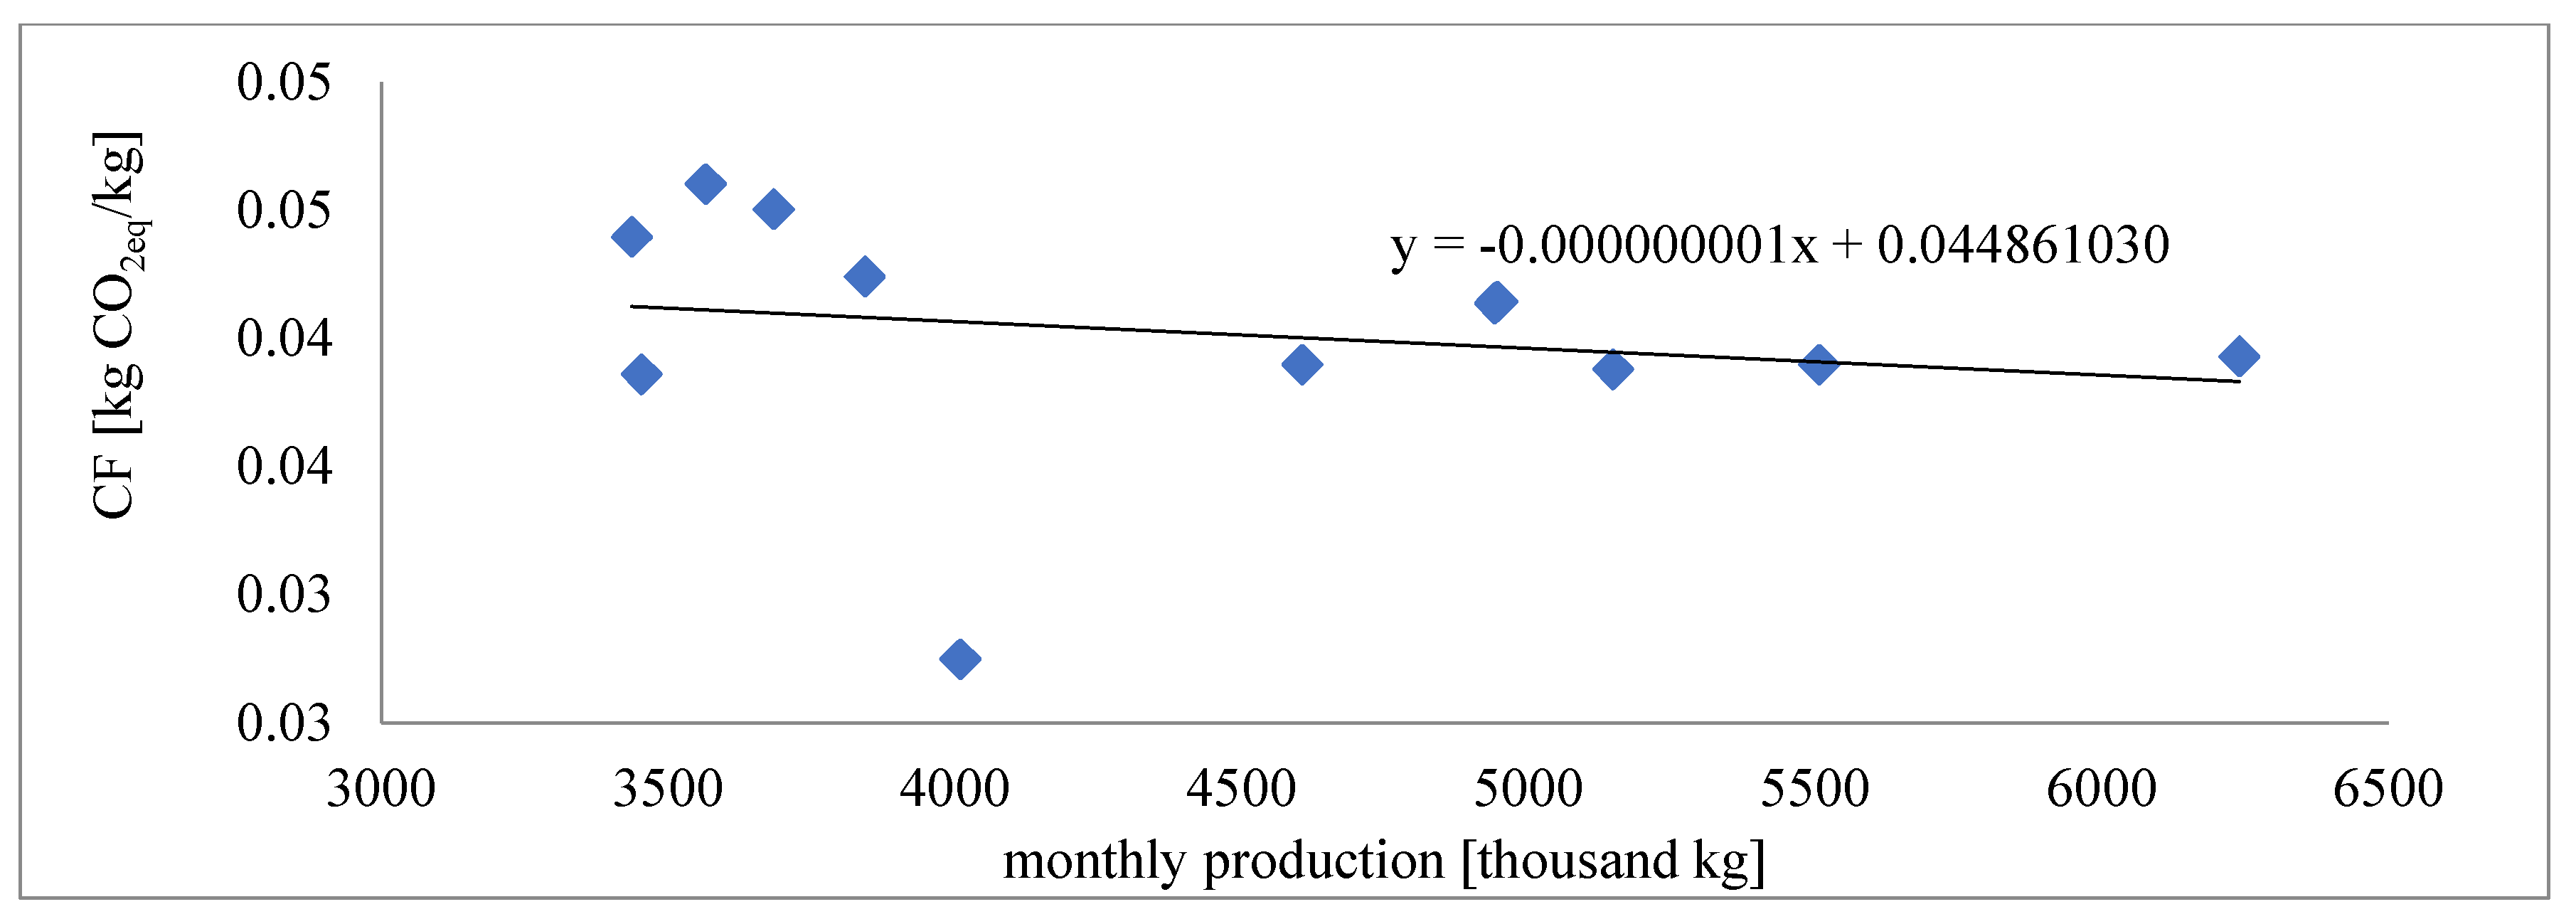
| Month | GHG Emissions Scopes 1 and 2 | CF |
|---|---|---|
| kg CO2eq | kg CO2eq/kg | |
| January | 162,978 | 0.0424 |
| February | 199,679 | 0.0388 |
| March | 245,184 | 0.0393 |
| April | 165,900 | 0.0450 |
| May | 214,685 | 0.0390 |
| June | 133,317 | 0.0386 |
| July | 110,181 | 0.0275 |
| August | 151,083 | 0.0440 |
| September | 179,516 | 0.0390 |
| October | 204,938 | 0.0414 |
| November | 204,406 | 0.0414 |
| December | 164,094 | 0.0460 |
References
- Wiltshire, J.; Tucker, G.; Fendler, A. Carbon footprint of British food production. Food Sci. Technol. Today 2008, 22, 23–26. [Google Scholar]
- Tucker, G.; Foster, C.; Wiltshire, J. Life Cycle Analysis and Carbon Footprinting with Respect to Sustainability in the Agri-Food Sector. CAB Direct. 2010. Available online: www.cabdirect.org/cabdirect/abstract/20103223638 (accessed on 11 November 2024).
- Wróbel-Jędrzejewska, M.; Włodarczyk, E. Carbon footprint—An important parameter of sustainability in the grain and milling industry. Grain and Milling Review. Agriculture 2023, 5, 32–36. (In Polish) [Google Scholar]
- The Common Agricultural Policy: 2023–27. Agriculture and Rural Development. Available online: https://agriculture.ec.europa.eu/common-agricultural-policy/cap-overview/cap-2023-27_pl (accessed on 11 November 2024).
- Available online: https://www.gov.pl/web/rolnictwo/strategia-zrownowazonego-rozwoju-wsi-rolnictwa-i-rybactwa-2030 (accessed on 11 November 2024).
- Schroeder, R.; Aguiar, L.K.; Baines, R. Carbon footprint in meat production and supply chains. J. Food Sci. Eng. 2012, 2, 652–665. [Google Scholar] [CrossRef]
- Reckman, K.; Krieter, J. Environmental impact of the pork supply chain depending on farm performance. In Proceedings of the 8th international Conference on LCA in the Agri-Food Sector, Saint Malo, France, 1–4 October 2012; pp. 668–669. [Google Scholar]
- Directive EU 2022/2464 of the European Parliament and of the Council of 14 December, 402 2022 Amending Regulation (EU) No. 537/2014, Directive 2004/109/EC, Directive 403 2006/43/EC and Directive 2013/34/EU with Regard to Corporate Sustainability Reporting. Available online: https://www.europarl.europa.eu/doceo/document/CJ45-AM-756118_EN.pdf (accessed on 11 November 2024).
- Directorate General for Financial Stability, Financial Services and Capital Markets Union, The Commission Adopts the European Sustainability Reporting Standards. 2023. Available online: https://finance.ec.europa.eu/news/commission-adopts-european-sustainability-reporting-standards-2023-07-31_en (accessed on 11 November 2024).
- Hahnkamper-Vandenbulcke, N. Non-financial Reporting Directive. EPRS European Parliamentary Research Service. PE 654.213. 2021. Available online: https://www.europarl.europa.eu/RegData/etudes/BRIE/2021/654213/EPRS_BRI(2021)654213_EN.pdf (accessed on 11 November 2024).
- Directive (EU) 2024/1760 of the European Parliament and of the Council of 13 June 2024 on Corporate Sustainability Due Diligence and Amending Directive (EU) 2019/1937 and Regulation (EU) 2023/2859. Available online: https://eur-lex.europa.eu/eli/dir/2024/1760/oj (accessed on 11 November 2024).
- Regulation (EU) 2020/852 of the European Parliament and of the Council of 18 June 2020 on the Establishment of a Framework to Facilitate Sustainable Investment, and Amending Regulation (EU) 2019/2088. Available online: https://eur-lex.europa.eu/eli/reg/2020/852/oj (accessed on 11 November 2024).
- Regulation (EU) 2023/1115 OF THE European Parliament and of the Council of 31 May 2023 on the Making Available on the Union Market and the Export from the Union of Certain Commodities and Products Associated with Deforestation and Forest Degradation and Repealing Regulation (EU) No 995/2010. Available online: https://eur-lex.europa.eu/legal-content/EN/TXT/?uri=CELEX%3A32023R1115 (accessed on 11 November 2024).
- Wang, C.; Du, D.; Liu, T.; Li, X.; Zhu, Y.; Du, W.; Xu, F.; Yan, M.; Chen, J. Environmental Regulations, Green Technological Innovation, and Green Economy: Evidence from China. Sustainability 2024, 16, 5630. [Google Scholar] [CrossRef]
- Wróbel-Jędrzejewska, M.; Przybysz, Ł.; Włodarczyk, E. Carbon footprint comparison for technologies using frozen vegetable outgrades. J. Food Eng. 2024, 374, 112053. [Google Scholar] [CrossRef]
- Wróbel-Jędrzejewska, M.; Włodarczyk, E. Comparison of Carbon Footprint Analysis Methods in Grain Processing-Studies Using Flour Production as an Example. Agriculture 2024, 14, 14. [Google Scholar] [CrossRef]
- Wróbel-Jędrzejewska, M.; Włodarczyk, E.; Przybysz, Ł. Carbon Footprint of Flour Production in Poland. Sustainability 2024, 16, 4475. [Google Scholar] [CrossRef]
- GHG Protocol 2004. World Resources Institute and World Business Council for Sustainable Development. USA. Available online: https://ghgprotocol.org/ (accessed on 11 November 2024).
- Dobrowolski, Ł.; Drewko, A.; Kajzerek, M.; Trzebiatowska, W.; Michalczuk, M.; Mindykowska, S.; Broniewska, B.; Liszka-Dobrowolska, A.; Broniewski, Ł. Decarbonizing the Company—Climate Competitiveness 2.0; Climate Strategies Poland Foundation: Gdańsk, Poland, 2024; ISBN 978-83-964094-0-9. (In Polish) [Google Scholar]
- Central Statistical Office (GUS). Production and Foreign Trade in Agricultural Products in 2019; Central Statistical Office (GUS): Warsaw, Poland, 2020. (In Polish) [Google Scholar]
- Szafrańska, A.; Boniecka, A.; Jastrzębska, E.; Ograbek, B.; Rasińska, M.; Gańko, K.; Wilczyński, W.; Grabarczyk, J. Quality of Polish Wheat Harvest; Prof. Wacław Dąbrowski Institute of Agricultural and Food Biotechnology—State Research Institute: Warsaw, Poland, 2023; ISBN 978-83-963861-6-8. [Google Scholar]
- Szafrańska, A.; Stępniewska, S.M. Changes in bread making quality of wheat during postharvest maturations. Int. Agrophys. 2021, 35, 179–185. [Google Scholar] [CrossRef]
- Szafrańska, A.; Podolska, G.; Świder, O.; Kotyrba, D.; Aleksandrowicz, E.; Podolska-Charlery, A.; Roszko, M. Factors Influ-encing the Accumulation of Free Asparagine in Wheat Grain and the Acrylamide Formation in Bread. Agriculture 2024, 14, 207. [Google Scholar] [CrossRef]
- Wiwart, M.; Szafrańska, A.; Suchowilska, E. Grain of Hybrids Between Spelt (Triticum spelta L.) and Bread Wheat (Triticum aestivum L.) as a New Raw Material for Breadmaking. Pol. J. Food Nutr. Sci. 2023, 73, 265–277. [Google Scholar] [CrossRef]
- Available online: https://www.gov.uk/government/publications/greenhouse-gas-reporting-conversion-factors-2023 (accessed on 11 November 2024).
- KOBiZE, 2023. National Centre for Emissions Management. Report: Emission factors of CO2, SO2, NOX, CO and Total Dust for Electricity Published in December. 2023. Available online: https://www.kobize.pl/uploads/materialy/materialy_do_pobrania/wskazniki_emisyjnosci/Wskazniki_emisyjnosci_2022.pdf (accessed on 11 November 2024).
- Dias, A.C.; Arroja, L. Comparison of methodologies for estimating the carbon footprint—Case study of office paper. J. Clean. Prod. 2012, 24, 30–35. [Google Scholar] [CrossRef]
- Alsabri, A.; Tahir, F.; Al-Ghamdi, S.G. Environmental impacts of polypropylene (PP) production and prospects of its recycling in the GCC region. Mater. Today Proc. 2022, 56, 2245–2251. [Google Scholar] [CrossRef]
- Sun, M.; Wang, Y.; Shi, L.; Klemeš, J.J. Uncovering energy use, carbon emissions and environmental burdens of pulp and paper industry: A systematic review and meta-analysis. Renew. Sustain. Energy Rev. 2018, 92, 823–833. [Google Scholar] [CrossRef]
- Available online: https://apps.carboncloud.com/climatehub/product-reports/id/118660698267 (accessed on 11 November 2024).
- Żyłowski, T. Carbon footprint of major crops in Poland. Stud. Rep. IUNG-PIB 2022, 67, 25–35. (In Polish) [Google Scholar] [CrossRef]
- Francke, I.C.M.; Castro, J.F.W. Carbon and water footprint analysis of a soap bar produced in Brazil by Natura Cosmetics. Water Resour. Ind. 2013, 1–2, 37–48. [Google Scholar] [CrossRef]
- Deviatkin, I.; Horttanainen, M. Carbon footprint of an EUR-sized wooden and a plastic pallet. In Proceedings of the E3S Web of Conferences 158, 03001 (2020) ICEPP 2019, Melbourne, Australia, 18–20 December 2019. [Google Scholar] [CrossRef]
- Available online: https://apps.carboncloud.com/climatehub/product-reports/id/187855457375 (accessed on 11 November 2024).
- Base Ecoinvnet 3.8—Biowaste {RoW}I Market for I Cut-Off, S. Available online: https://support.ecoinvent.org/ecoinvent-version-3.8 (accessed on 11 November 2024).
- Available online: https://www.sustainable-ships.org/stories/2022/carbon-footprint-steel (accessed on 11 November 2024).
- Available online: https://www.theguardian.com/environment/green-living-blog/2010/sep/23/carbon-footprint-new-car (accessed on 11 November 2024).
- Available online: https://www.volvotrucks.com/en-en/trucks/information-and-tools/environmental-footprint/environment-footprint-calculator.html?lang=en&market=gb&view=single&trucks=fmx_methaneDiesel&ucategories=regional,longhaul (accessed on 11 November 2024).
- Available online: https://www.onecharge.biz/blog/carbon-footprint-of-electric-forklifts/ (accessed on 11 November 2024).
- ISO 14040; Environmental Management, Life Cycle Assessment, Principles and Structure. ISO: Geneva, Switzerland, 2009.
- ISO 14044; Environmental Management, Life Cycle Assessment—Requirements and Guidelines. ISO: Geneva, Switzerland, 2009.
- Wróbel-Jędrzejewska, M.; Włodarczyk, E. Research on the carbon footprint of bread production. Grain Milling Rev. 2024, 1, 49–55. (In Polish) [Google Scholar] [CrossRef]

| Energy Utilities | Indicator Value | Source |
|---|---|---|
| Diesel [liter] | 2.66 kg CO2eq/liter | [25] |
| LPG [kg] | 2.94 kg CO2eq/kg | |
| Natural gas [m3] | 2.04 kg CO2eq/m3 | |
| Electricity [kWh] | 0.685 kg CO2eq/kWh | [26] |
| No. | Category | Characteristic |
|---|---|---|
| 1 | Purchased goods and services | Emissions resulting from the extraction, production and transportation of goods and services purchased by the company, for example, raw materials for production, such as metals or chemicals, production of goods purchased for sale in stores, office supplies, such as paper, and IT services, such as external data centers. |
| 2 | Capital goods | All upstream emissions from the production of capital goods purchased by the company in the year for which the carbon footprint is calculated. Examples of capital goods include equipment, machinery, buildings, appliances and vehicles. |
| 3 | Energy and fuel-related emissions not included in Scopes 1 and 2 | For example, emissions from wells to tanks of purchased fuels, electricity, transmission and distribution losses. |
| 4 | Upstream—transportation and distribution | Transportation and distribution of products purchased by a company, counting its carbon footprint between Tier 1 suppliers and its facilities in vehicles or facilities that are not owned or controlled by the company. |
| 5 | Waste generated by operations | Disposal and treatment of waste during the reporting period at facilities that are not owned and controlled by the reporting company. |
| 6 | Business travel | Transportation of employees related to business activities during the reported period in vehicles that are not owned or managed by the reporting company. |
| 7 | Employee work commuting | Transportation of employees between their homes and the workplace during the reporting year in vehicles that are not owned or operated by the reporting company. |
| 8 | Upstream—leased assets | Issues related to the operation of assets leased by the reporting company (as a tenant) in the reporting year and not covered by Scopes 1 and 2. |
| 9 | Downstream—transportation and distribution | Transportation and distribution of sold products in vehicles or facilities not owned or controlled by the company. |
| 10 | Processing of products sold | Refers to emissions from the processing of intermediate products by other companies, for example, chemical products or products from automotive suppliers. |
| 11 | Use of sold products | Total projected lifetime emissions of all products sold in the reporting year. For example, products that use energy or emit greenhouse gases when used (electrical appliances, cars or industrial machinery). |
| 12 | Dealing with sold products after use | Emissions associated with the disposal and treatment of waste from products sold by the company at the end of their useful life. |
| 13 | Downstream—leased assets | Operation of assets owned by the reporting company (as lessor) and leased to others in the reporting year, not included in Scopes 1 and 2. Energy consumption of leased buildings and machinery, including leased vehicles, leased office buildings and production facilities. |
| 14 | Franchises | Emissions of franchisees in Scopes 1 and 2 (for example, energy consumption of restaurants in the franchise system). |
| 15 | Investments | Investment activities (including equity and long-term investments and project financing in the reporting year not covered by Scope 1 or 2), for example, direct and indirect consumption through investments in other companies, joint ventures or corporate loans granted. Applies mainly to private financial institutions (for example, banks) but also public financial institutions. |
| Element | Indicator Value | Source |
|---|---|---|
| I. Emissions related to the production of purchased raw materials and semi-finished products | ||
| Paper packaging | 0.00109 kg CO2eq/kg | [27] |
| Packaging—foil | 0.002529 kg CO2eq/kg | [28] |
| Office supplies | 0.95 kg CO2eq/kg | [29] |
| Raw material barley flour—for production of special flours | 0.7 kg CO2eq/kg | [30] |
| Grains | 0.49 kg CO2eq/kg | [31] |
| Sanitary materials | 1.65 kg CO2eq/kg | [32] |
| Wooden pallets (used) | 0.2 kg CO2eq/kg | [33] |
| Raw material ascorbic acid—added when preparing flour for shipment | 25 kg CO2eq/kg | [34] |
| II. Emissions related to transportation of purchased raw materials and semi-finished products | ||
| Transportation of packaging | 2.66 kg CO2eq/kg | [25] |
| Transportation of foil | ||
| Transportation of office supplies | ||
| Transportation of raw materials—barley flour | ||
| Transportation of grain | ||
| Transportation of sanitary materials | ||
| Transportation of pallets. Packaging | ||
| Transportation of ascorbic acid | ||
| III. Emissions associated with the management of generated waste | ||
| Pomace, sludge and other waste | 0.0000393 kg CO2eq/kg | [35] |
| Paper and cardboard packaging | 0.00109 kg CO2eq/kg | [27] |
| Plastic packaging | 0.002529 kg CO2eq/kg | [28] |
| Iron and steel | 1.4 kg CO2eq/kg | [36] |
| IV. Issues related to employee business travel | ||
| Business travel | 2.66 kg CO2eq/kg | [25] |
| Trader | ||
| Company car—handling Company matters—small purchases. Commuting to offices, etc. | ||
| Business travel between plants | ||
| V. Emissions related to transportation of sold products | ||
| Data given for emissions in Scopes 1 and 2 | 2.66 kg CO2eq/kg | [25] |
| VI. Emissions related to employee work commuting | ||
| Bike commute | 0 | |
| Car commute | 2.66 kg CO2eq/kg | [25] |
| VII. Issues related to capital goods purchased by the company | ||
| Car | 17,000 kg CO2eq/kg | for a medium-sized passenger car [37] |
| Truck | 17,400 kg CO2eq/kg | [38] |
| Forklift | 10,000 kg CO2eq/kg | for an electric forklift with battery [39] |
| VIII. Emissions related to transportation, transmission of fuels, energy and transmission losses | ||
| Diesel fuel transportation | 2.66 kg CO2eq/kg | [25] |
| Quantity | GHG Emissions [kg CO2eq] | |
|---|---|---|
| Scope 1 | ||
| Diesel | 125,223.05 L | 333,093.00 |
| LPG | 4741.00 m3 | 13,935.50 |
| Natural gas | 9090.00 m3 | 18,543.60 |
| TOTAL GHG EMISSIONS (Scope 1) | 365,572.10 | |
| Scope 2 | ||
| Electricity | 2,584,508.00 kWh | 1,770,388.00 |
| TOTAL GHG EMISSIONS (Scope 2) | 1,770,388.00 | |
| Scope 3 | ||
| I. Emissions related to the production of purchased raw materials and semi-finished products | ||
| Paper packaging | 100,069.36 kg | 109.08 |
| Packaging—foil | 9740.60 kg | 24.63 |
| Office supplies | 421.30 kg | 400.24 |
| Raw material: barley flour—for the production of special flours | 18,000 kg | 12,600.00 |
| Crops | 48,174,120.00 kg | 23,605,318.80 |
| Sanitary materials | 3795.24 kg | 6262.15 |
| Wooden pallets (used) | 1440 kg | 288.00 |
| Raw material: ascorbic acid—added when flour is prepared for shipment | 2650 kg | 66,250.00 |
| TOTAL GHG EMISSIONS CAT. I | 23,691,252.89 | |
| II. Emissions related to transportation of purchased raw materials and semi-finished products | ||
| Transportation of packaging | 5517.50 km | 4667.14 |
| Transportation foil | 1364.00 km | 1153.78 |
| Transportation of office supplies | 466.20 km | 394.35 |
| Transportation of raw materials—barley flour | 2440.00 km | 2063.95 |
| Grain transportation | 115,560.00 km | 97,749.89 |
| Transportation of sanitary materials | 2924.00 km | 2473.35 |
| Transportation of pallet packaging | 2.00 km | 1.69 |
| Transportation of ascorbic acid | 636.00 km | 537.98 |
| TOTAL GHG EMISSIONS CAT. II | 109,042.14 | |
| III. Emissions associated with the management of generated waste | ||
| Pomace, sediment and other waste | 26,690 kg | 1.05 |
| Paper and cardboard packaging | 4945 kg | 5.39 |
| Plastic packaging | 1465 kg | 3.70 |
| Iron and steel | 12,163 kg | 17,028.20 |
| TOTAL GHG EMISSIONS CAT. III | 17,038.34 | |
| IV. Issues related to employee business travel | ||
| Business trips | 11,216.34 L | 29,835.46 |
| Trader | 4259.67 L | 11,330.72 |
| Company car—handling company matters, such as small purchases, travel to offices, etc. | 577.57 L | 1536.34 |
| Business trips between plants | 163.52 L | 434.96 |
| TOTAL GHG EMISSIONS CAT. IV | 43,137.49 | |
| V. Emissions related to transportation of products sold | ||
| Transportation of flour in tanks | 1,477,505 km | 1,249,791.93 |
| Transportation of loose bran | 155,210 km | 131,289.03 |
| Transportation of flour in bags | 274,867 km | 232,504.50 |
| TOTAL GHG EMISSIONS CAT. V | 1,613,585.46 | |
| VI. Emissions related to commuting of employees to work | ||
| Access by bike | 0 | 0 |
| Access by car | 70,738.8 km | 188,165.21 |
| TOTAL GHG EMISSIONS CAT. VI | 188,165.21 | |
| VII. Issues related to capital goods purchased by the company | ||
| Passenger car | 3 pieces | 51,000 |
| Truck | 6 pieces | 104,400 |
| Forklift | 1 piece | 10,000 |
| TOTAL GHG EMISSIONS CAT. VII | 165,400 | |
| VIII. Emissions related to transportation, transmission of fuels, energy and transmission losses | ||
| Diesel transportation | 814 km | 688.55 |
| TOTAL GHG EMISSIONS CAT. VIII | 688.55 | |
| TOTAL GHG EMISSIONS (Scope 3) | 25,828,310.08 | |
| TOTAL GHG EMISSIONS (Scopes 1, 2 and 3) | 27,964,270.18 | |
Disclaimer/Publisher’s Note: The statements, opinions and data contained in all publications are solely those of the individual author(s) and contributor(s) and not of MDPI and/or the editor(s). MDPI and/or the editor(s) disclaim responsibility for any injury to people or property resulting from any ideas, methods, instructions or products referred to in the content. |
© 2024 by the authors. Licensee MDPI, Basel, Switzerland. This article is an open access article distributed under the terms and conditions of the Creative Commons Attribution (CC BY) license (https://creativecommons.org/licenses/by/4.0/).
Share and Cite
Wróbel-Jędrzejewska, M.; Włodarczyk, E.; Przybysz, Ł. Analysis of Greenhouse Gas Emissions of a Mill According to the Greenhouse Gas Protocol. Sustainability 2024, 16, 11214. https://doi.org/10.3390/su162411214
Wróbel-Jędrzejewska M, Włodarczyk E, Przybysz Ł. Analysis of Greenhouse Gas Emissions of a Mill According to the Greenhouse Gas Protocol. Sustainability. 2024; 16(24):11214. https://doi.org/10.3390/su162411214
Chicago/Turabian StyleWróbel-Jędrzejewska, Magdalena, Ewelina Włodarczyk, and Łukasz Przybysz. 2024. "Analysis of Greenhouse Gas Emissions of a Mill According to the Greenhouse Gas Protocol" Sustainability 16, no. 24: 11214. https://doi.org/10.3390/su162411214
APA StyleWróbel-Jędrzejewska, M., Włodarczyk, E., & Przybysz, Ł. (2024). Analysis of Greenhouse Gas Emissions of a Mill According to the Greenhouse Gas Protocol. Sustainability, 16(24), 11214. https://doi.org/10.3390/su162411214