Article

Evaluation of a Grid-Connected Photovoltaic System at the University of Brasília Based on Brazilian Standard for Performance Monitoring and Analysis

by
Paulo Fernandes
1,
Alex Reis
1,
Loana N. Velasco
1,
Tânia M. Francisco
2,
Ênio C. Resende
3 and
Luiz C. G. Freitas
3,*
1
Faculty of Science, Technology in Engineering, and Energy Engineering, University of Brasilia, Brasilia 72444-240, Brazil
2
Administration, Federal University of São Paulo, São Paulo 04021-001, Brazil
3
Faculty of Electrical Engineering, Federal University of Uberlandia, Uberlandia 38400-902, Brazil
*
Author to whom correspondence should be addressed.
Sustainability 2024, 16(24), 11212; https://doi.org/10.3390/su162411212
Submission received: 7 October 2024 / Revised: 10 December 2024 / Accepted: 16 December 2024 / Published: 20 December 2024
(This article belongs to the Special Issue Safety and Reliability of Renewable Energy Systems for Sustainability)

Abstract

:
This work presents the results of research aimed at evaluating the performance of the photovoltaic system connected to the electrical grid at the University of Brasília (UnB), Brazil. Following the guidelines established by the Brazilian Standard for Performance Monitoring and Analysis of Grid-connected Photovoltaic Systems, it was possible to evaluate the system’s performance by determining the Performance Ratio (PR) indicator. The operating temperatures were estimated using measured values of the ambient temperature and solar irradiation. These data were collected by a nearby solarimetric station. Next, the theoretical energy injected into the electrical grid was determined based on calculations of the Direct Current (DC) power at the inverter input and the Alternating Current (AC) power at the inverter output. To this end, the coefficients of the inverter efficiency curve were considered as well as a loss scenario, as recommended. With these results, as well as the information about the total photovoltaics (PV) system AC production obtained from the inverter supervisory system, it was possible to determine the average annual PR achieved and compare the theoretical and practical results obtained. The main contribution of this paper is the performance evaluation of a 125 kWp grid-connected photovoltaic system at the University of Brasília (UnB), assessed using Brazilian Standards for performance monitoring and analysis. The system, installed on the rooftop of the UED building, consists of 298 Canadian Solar HiKu CS3W-420P modules with a 15-degree north pitch angle facing geographic north. It interfaces with the grid through two three-phase inverters, model CSI-75K-T400 (74.76 kWp) and a CSI-50KTL-GI (50.4 kWp). The results showed that the system with a 50kW inverter had an average PR of 78%, while the system with a 75 kW inverter showed a PR variation from 56% to 93%. The information obtained in this work will be used to develop computational tools capable of monitoring and evaluating, in real time, the performance of photovoltaic systems and ensuring that the expected financial return is achieved through the use of preventive and corrective maintenance actions in a timely manner.

1. Introduction

The enactment of Resolution No. 482/2012 by the Brazilian National Electric Energy Agency—ANEEL [1] regulated Distributed Generation in Brazil. It categorized Mini DG as systems up to 5 MWp and Micro DG as systems up to 75 kWp. Since then, photovoltaic solar energy has rapidly expanded, with thousands of new installations each year. Due to its financial attractiveness and contributions to sustainability, together with a significant reduction in the implementation costs, this technology has become established in the electric energy sector as a viable alternative electricity solution for commercial, residential, and industrial clients [2].
In order to reach this goal, it is necessary to monitor the photovoltaic system to identify operational failures and/or the need for corrective or preventive maintenance [3,4,5,6,7,8,9]. In the Brazilian context, the Standard ABNT NBR 16274:2014 [10] defines the minimum required procedures to evaluate the performance of a Grid-Tie Photovoltaic System (GTPVS) since the early operation. These procedures are essential for analyzing the performance indicators of photovoltaic generators to assess system effectiveness. This is important for assessing PV generation under real-world conditions, including irradiance, location, and installation setup to ensure the optimal energy production, improve the efficiency, and address the potential long-term issues.
In this context, several studies have addressed the evaluation of long-term PV system operation. In [11] the authors explore the applicability and feasibility of grid-connected rooftop PV systems in faculty building at Marmara University in Istanbul through a simulation. In [12], a long-term evaluation is proposed of the Performance Ratio (PR) and degradation rate of 10 years of the domestic PV system in the United Kingdom and Ireland. It analyzed 120 sites and concluded that they presented PRs ranging from a decrease of 0.4% to 1%, depending on the location. Moreover, [13] conducted a study of the reliability and durability of a PV system located in the south of Tenerife, Canary Islands, in the municipality of Granadilla. The study’s main contribution was analyzing how a subtropical climate affects the PR value. This is justified because the value of the PR of a PV system is significantly influenced by geographic conditions and, therefore, it is necessary to perform PV performance assessment for different locations. Similarly, other papers address this topic in regard to PV facilities located in Rzeszów, Poland [14], diverse cities in Mali [15], and in the Maldives [16].
The Performance Ratio (PR) is a key metric widely used for evaluating various types of solar installations due to its ability to generalize across different environments and technologies. For example, in [17], PR was employed to evaluate PV power plants installed on water bodies, comparing three PV panel technologies: Multicrystalline Silicon (Multi-Si), heterojunction with Intrinsic Thin layer (HIT), and Cadmium Telluride (CdTe). The results showed that CdTe technology achieved the highest PR values in water-based installations. Additionally, the study in [18] applied the PR metric to assess the performance of large-scale PV plants at the Quaid-e-Azam Solar Park in Pakistan. Meanwhile, the research in [19] used PR to compare inverter- and micro-inverter-based PV systems in France, concluding that the PR values were comparable across both configurations.
The foregoing highlights the importance of the PR metric for assessing solar facility performance. As Brazil has significant potential for photovoltaic solar energy production but remains an emerging country in this sector, performance evaluation is crucial to optimize its solar energy production and ensure that photovoltaic systems are designed to meet the specific demands of Brazil’s diverse climate. In this context, there is a lack of studies in the international literature analyzing PV system performance in light of the Brazilian Standard ABNT NBR 16274:2014 [10]. Therefore, the main contribution of this work is to present the Performance Evaluation of a Grid-Connected Photovoltaic System installed at the University of Brasília (UnB) based on the Brazilian Standards for Performance Monitoring and Analysis. The analyzed system has a 125.0 kWp installed capacity and is illustrated by Figure 1, marked as number 1. The solar array was installed on the rooftop of the building, UED (1), which is composed of 298 Canadian Solar ® modules (model HiKu CS3W-420P) with a peak power of 420 Wp. The pitch angle is 15 degrees, oriented to geographic north. The interface between the solar plant and the grid is performed by two three-phase inverters also manufactured by Canadian Solar ®. One of the inverters is a CSI-75K-T400 with 74.76 kWp, and the other is the CSI-50KTL-GI model with 50.4 kWp. The photovoltaic systems installed at the (2) Academic Unit (UAC), (3) Sports and Equipment Services Module (MESP), and (4) Laboratory for Transport Development and Alternative Energies (LDTEA) are outside the scope of this work.
Figure 2a illustrates the CSI-50KTL-GI and CSI-75K-T400 inverters along with the electrical panel. The electrical panel serves as the common coupling point between the inverters, the load, and the grid. Additionally, Figure 2b,c provide an internal view of the panel connections, where the switches responsible for connecting the photovoltaic solar plant and electrical loads to the Point of Common Coupling (PCC) can be seen.
To present the results obtained, this article is divided into five sections, including this introduction. Section 2 presents the technical specifications of the main components of the system. Section 3 outlines the performance analysis methodology used, and Section 4 presents the main practical and theoretical results obtained. Finally, Section 5 offers reflections on the results achieved, and Section 6 presents the final conclusions.

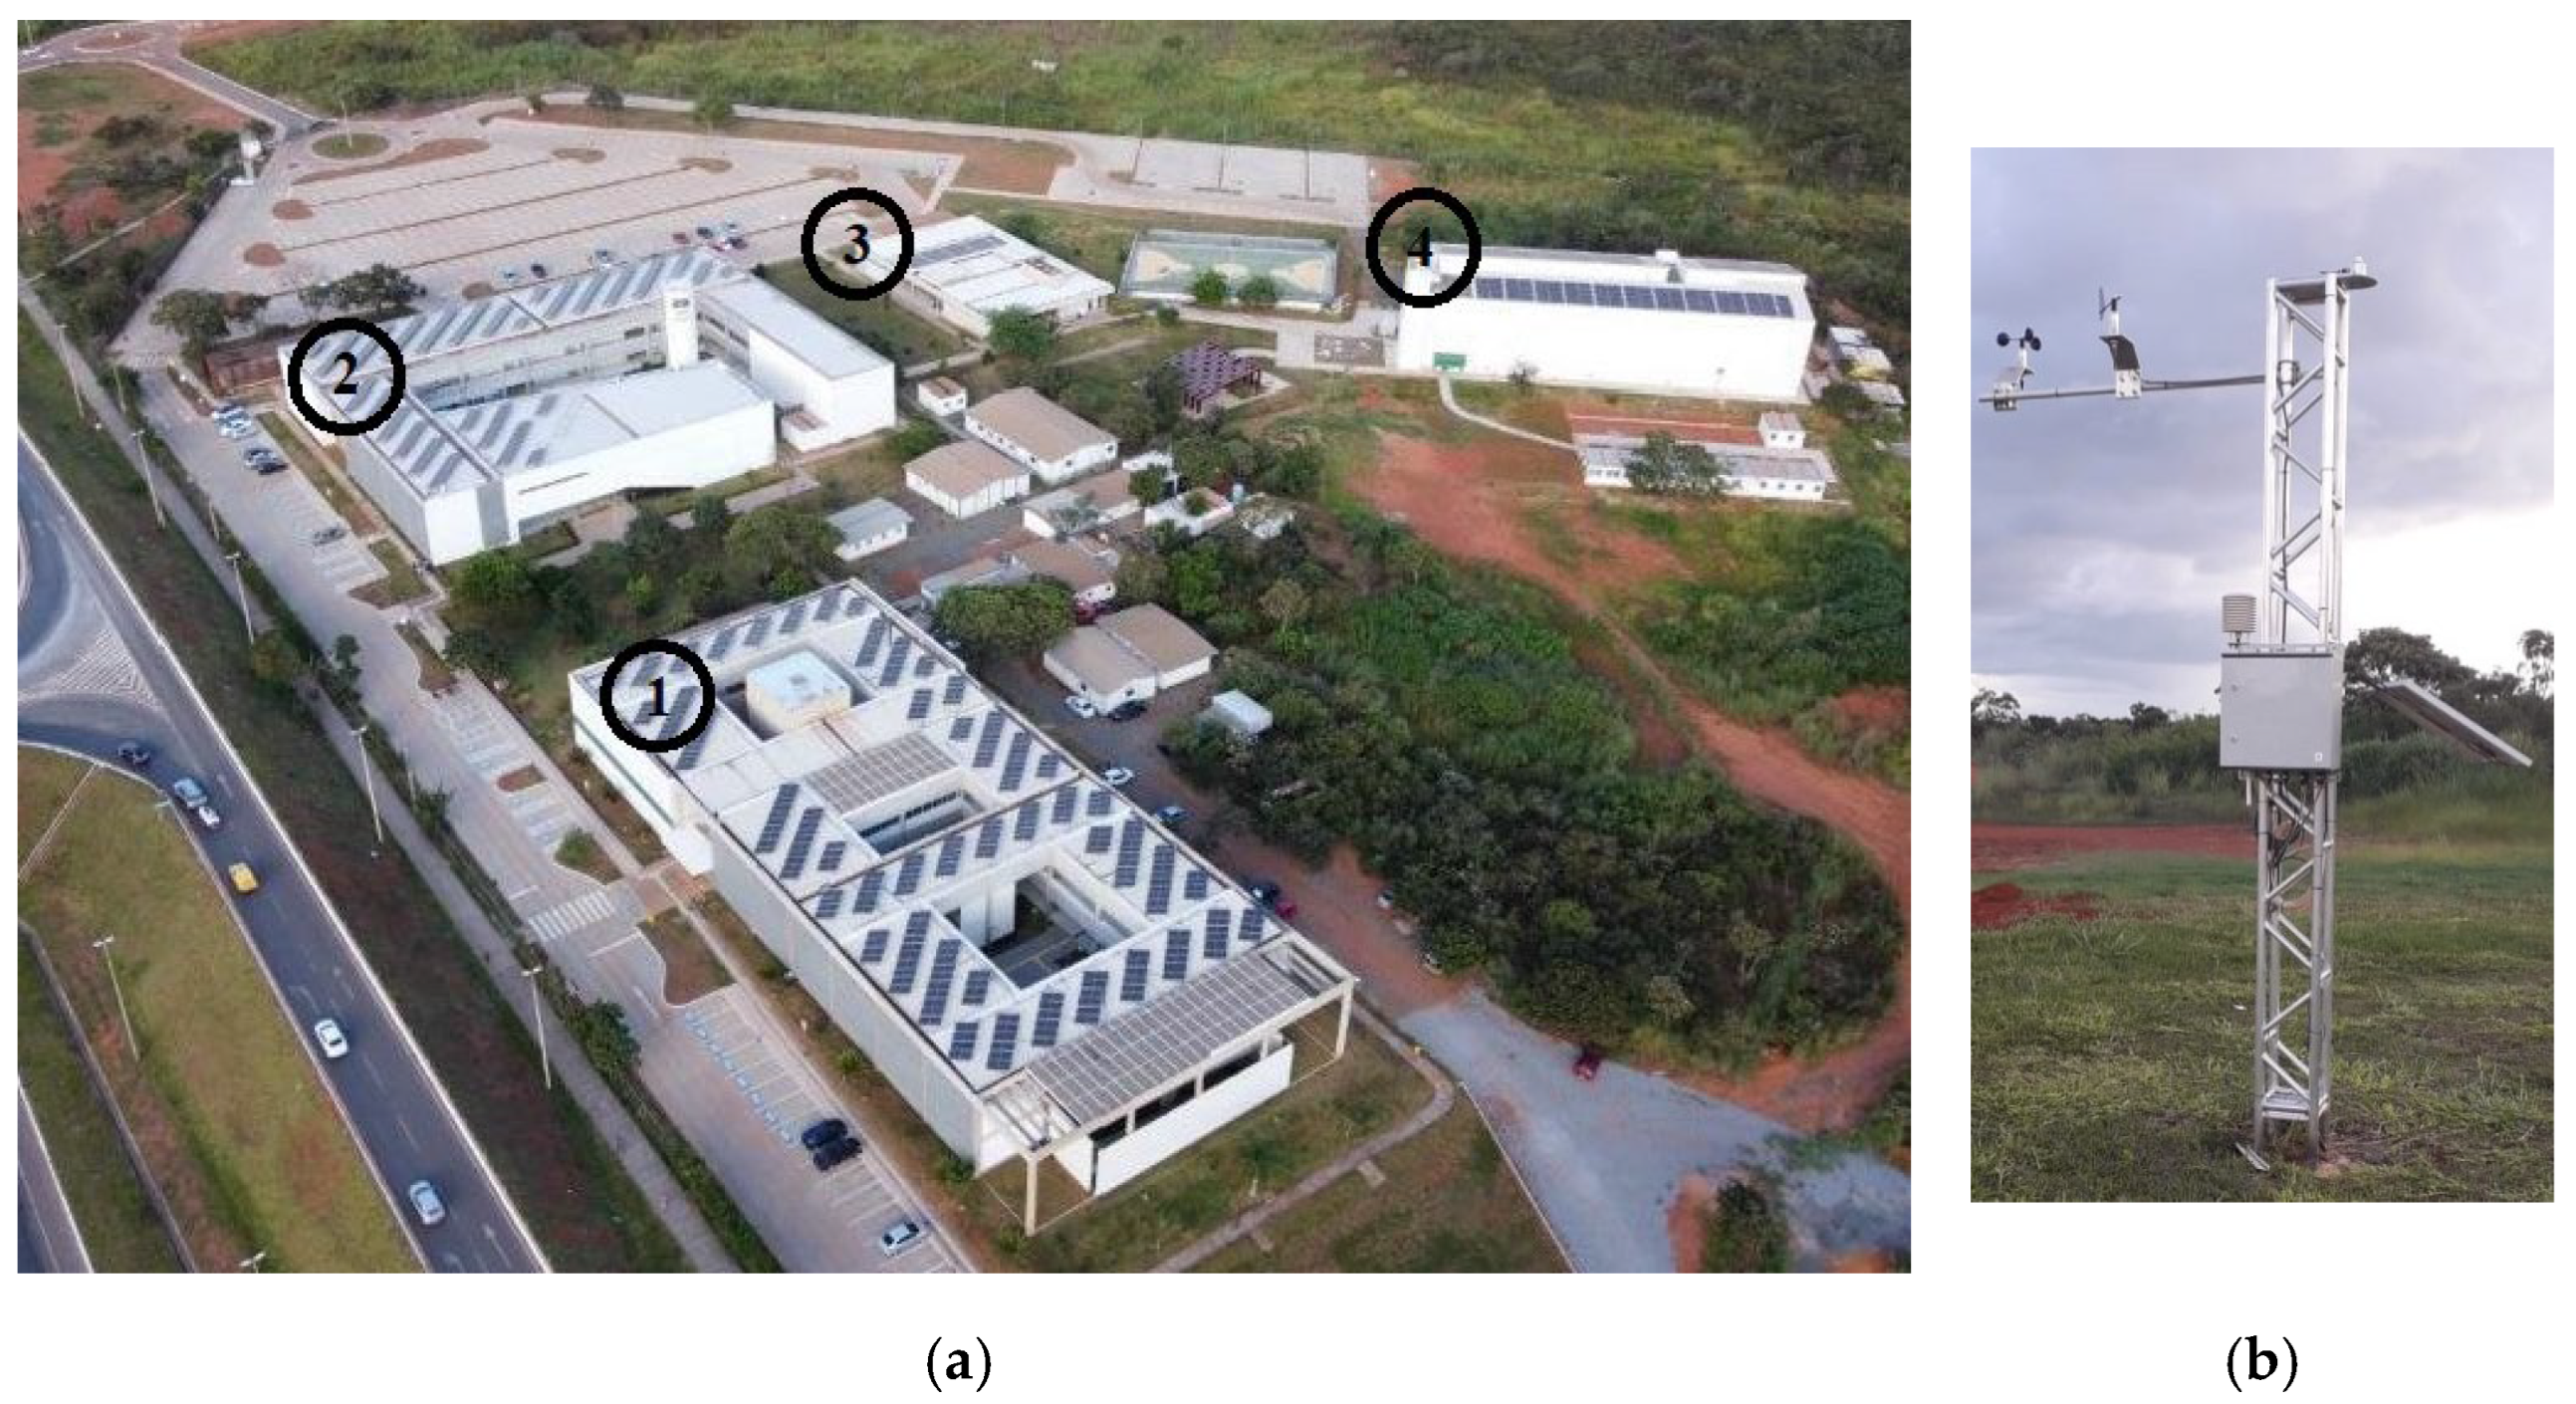
2. Power Structure Description

Figure 1 shows the Gama Campus of the University of Brasília, where the photovoltaic system is installed and connected to the distribution network of Neoenergia Brasília® (Brasilia, Brazil) through an existing substation on the campus. The PV system under analysis is installed on the roof of the teaching unit (UED). It consists of 298 photovoltaic modules manufactured by Canadian Solar (Guelph, ON, Canada), using the model, HiKu CS3W-420P. Each module has a peak power of 420 Wp, is tilted at a 15° inclination, and is oriented to geographic north. The photovoltaic modules are connected to two three-phase string inverters from the manufacturer, Canadian Solar, one being the CSI-75K-T400 model with 74.76 kWp and the other the CSI-50KTL-GI model with 50.4 kWp.
Table 1 presents the parameters of the installed photovoltaic modules and both inverters. Inverter 1 has nine independent inputs, each equipped with a Maximum Power Point Tracking (MPPT) system. The solar arrays are connected to eight of these inputs. At inputs 1, 2, 5, and 6, two strings are connected in parallel, each with 11 modules per string. At inputs 3 and 4, two strings are connected in parallel, each composed of 14 modules. Input 7 has two strings connected in parallel, each string consisting of 12 modules, and input 8 has only one string with 10 modules. Inverter 2 has four independent MPPT inputs, and the modules are distributed as follows: Input 01 has two strings connected in parallel, with 14 modules in each. In inputs 2 and 4, two strings are connected in parallel, each with 12 modules. Finally, input 3 has three strings connected in parallel, with 14 modules in each string.

3. Material and Methods as Recommended by Brazilian Standard ABNT NBR 16274:2014

The Brazilian Standard ABNT NBR 16274:2014 [10] adopts the Performance Ratio (PR) as a PV system performance indicator and specifies commissioning tests, inspection criteria, and documentation requirements to ensure system safety and proper operation. It also provides guidelines for periodic checks and the performance evaluation of such systems. This standard applies to both low-voltage DC and AC installations but is not applicable to PV systems using AC modules, energy storage, or hybrid systems. It is intended for designers and installers, offering a model for adequate documentation and assisting in the inspections, maintenance, or modifications of PV systems after installation. The document also references key standards: ABNT NBR 10899 [20], ABNT NBR 16149 [21], IEC 60364 (all parts) [22], IEC 60364-6 [23], IEC 60364-7-712 [24], IEC 61010 (all parts) [25], IEC 61557 (all parts) [26], IEC 61730-1 [27], IEC 61730-2 [28], and IEC TS 61724-3:2017 [29].

3.1. Performance Ratio (PR)

The PR parameter is defined as the ratio between real power and the theoretical power generated by a PV system; therefore, it is an important metric to evaluate the losses of the solar power plant. The intrinsic impedances of cables, semiconductor switching, temperature, and other contingences can reduce the system efficiency. Regarding power losses, ref. [30] presents a literature review on the Performance Ratio (PR) definitions and calculation methods. The review highlights the different methodologies used in each study, including their definitions, parameters, PR variation rates, analysis intervals, limitations, and recommendations.
In this study, the authors followed the ABNT NBR 16274:2014 [10] recommended procedures to determine the PR, which is given as the ratio of the final system yield (Yf) to that of the reference yield (Yr), as given by (1).
P R = Y f Y r
The system’s Yf, as defined by Equation (2), represents the Total PV System Production (EPV) over a specific time period (kWh/month, kWh/year, kWh/day), divided by the Rated PV Capacity (PPV) given in kilowatt-peak (kWp). In this study, the standby energy consumption of the PV system was disregarded.
Y f = E P V P P V
The reference yield (Yr), as defined by Equation (3), is the ratio between the solar radiation in the plane of the solar array (kWh/m2/month, kWh/m2/year) (GI) to the radiation received by a reference system ( G I , r e f ) , where G I , r e f   has a value of 1.0 kW/m2.
Y r = G I G I , r e f
Practically speaking, Equations (1)–(3) related to practical parameters provide significant insights into the PV system performance.

3.2. Theoretical Energy Injected into the Grid ( E R * )

For theoretical foundations, the ABNT NBR 16274:2014 [10] standard provides a series of documents and calculation procedures for analyzing the performance of a grid-connected photovoltaic system. According to Steps 7 and 8 of the Performance Evaluation Calculation Methodology outlined in ABNT NBR 16274:2014, the theoretical energy injected into the grid ( E R * ) is calculated using (4) through (7), based on the theoretical calculations of the Direct Current (DC) power at the inverter input ( P D C * ) and the Alternating Current (AC) power at the inverter output ( P A C * ).
The Direct Current (DC) power at the inverter input ( P D C * ) is given as,
P D C * ( i ) = P N · G ( i ) 1000 · 1 γ · T c i 25 · 1 + c · l n G ( i ) 1000
where:
  • i—i-th measured value.
  • PN—PV system nominal power.
  • G—Total irradiance on the PV plane.
  • γ—Temperature Coefficient (%/°C).
  • Tc—Cell Temperature.
  • c—Irradiance Coefficient (The value of c is derived from the ratio of the module efficiencies at 200 W/m2 to 1000 W/m2, which is provided by the manufacturer. The module efficiency, in relation to irradiance, presents a curve that can be modeled by a logarithmic equation of the form η = 1 + c ln(G/1000), where c fits the equation to the efficiency curve of a given module model. For crystalline silicon modules, this efficiency ratio is often η200/η1000 = 0.95, which corresponds to c = 0.031).
The operating cell temperature is given by:
T c i = T a i + G i 800 · T N O C T 20
where Ta is the air temperature, TNOCT is the nominal operating cell temperature, and G is the power density at a particular time.
The AC power at the inverter output ( P A C * ) is given by:
P A C * i = P N I · k 1 + 1 + k 1 + 1 2 4 · k 2 · k 0 P D C * ( i ) P N I 2 · k 2
where:
  • PNI—Inverter Nominal Power (In the case of systems with multiple subsystems (multiple inverters) PNI is the sum of the nominal power of all inverters).
  • k0, k1, and k2—Inverter efficiency coefficients.
Finally, the theoretical energy injected into the grid ( E R * ) is given by:
E R * = i = 1 n P A C * i · Δ t
where:
  • Δt—Integration Period.
  • n—Number of measurements.

3.3. Coefficients k0, k1, and k2 for the Inverter Efficiency Curve

Equation (8) provides a way to obtain the coefficients for the inverter efficiency curve, through the best fit of k0, k1, and k2 for the pairs P D C and P A C . In the case of systems with multiple subsystems (multiple inverters), for each tested subsystem that does not present anomalous operation, k0, k1, and k2 must be calculated. The averages of each coefficient must be used in (6).
P A C ( m e a s u r e d ) i P D C * ( m e a s u r e d ) ( i ) = P A C ( m e a s u r e d ) ( i ) P N I P A C   ( m e a s u r e d ) ( i ) P N I + k 0 + k 1 · P A C ( m e a s u r e d ) ( i ) P N I + k 2 · P A C ( m e a s u r e d ) ( i ) P N I 2

3.4. Losses Scenario

Photovoltaic systems have several loss factors, from the PV array to the point of connection to the power grid. Some of them are relatively easy to include in mathematical models, such as PV system parasitic losses during standby operation or inverter/module losses. Others are not, due to the necessity of highly complex models or due to their randomness, such as climate variations and component/utility grid outages.
Therefore, for the case where the measured energy E R is smaller than 95% of the theoretical energy ( E R * ) or E R > 1.05 × E R * , it is recommended to adjust the calculated values using a loss scenario, which is calculated using Equations (9) and (10). These equations define the adjustments to the DC and AC power outputs to account for the loss factors.
P D C a d j u s t * = P D C * · C P D C
P A C a d j u s t * = P A C * · C P A C
where:
  • C P D C DC loss scenario.
  • C P A C AC loss scenario.

3.5. Electricity Delivered to the Utility Grid

The loss scenario may vary based on the specific design and configuration of each PV system and can be a fixed value or a function of an electrical or environmental variable. In some cases, it is necessary to obtain the loss scenario through the ratio between the measured AC power ( P A C ) or DC power ( P D C ) in a real PV system and the corresponding theoretical calculated value, as given by Equations (11) and (12).
C P D C = P D C P D C *
C P A C = P A C P A C *
Alternatively, the theoretical adjusted energy injected into the grid over a year, considering all the measurements taken during that time, can be calculated by Equations (13)–(15).
  P D C a d j u s t * ( i ) = C P D C · P N · G ( i ) 1000 · 1 γ · T c i 25 · 1 + c · l n G ( i ) 1000
P A C a d j u s t * i = C P A C · P N I · k 1 + 1 + k 1 + 1 2 4 · k 2 · k 0 P D C a d j u s t * ( i ) P N I 2 · k 2
E R , y e a r ( a d j u s t ) = i = 1 n P A C a d j u s t * i · Δ t
where:
  • P D C a d j u s t * Adjusted theoretical DC power.
  • P A C a d j u s t * Adjusted theoretical AC power.
The calculation of overall performance is determined by Equation (16).
P R = E R , y e a r ( a d j u s t ) P N · G S T C H
where:
  • PN—PV system rated power.
  • GSTC—Irradiance under standard test conditions (1000 W/m2).
  • H—Total annual irradiance on the plane of the photovoltaic arrays.

4. Obtained Results

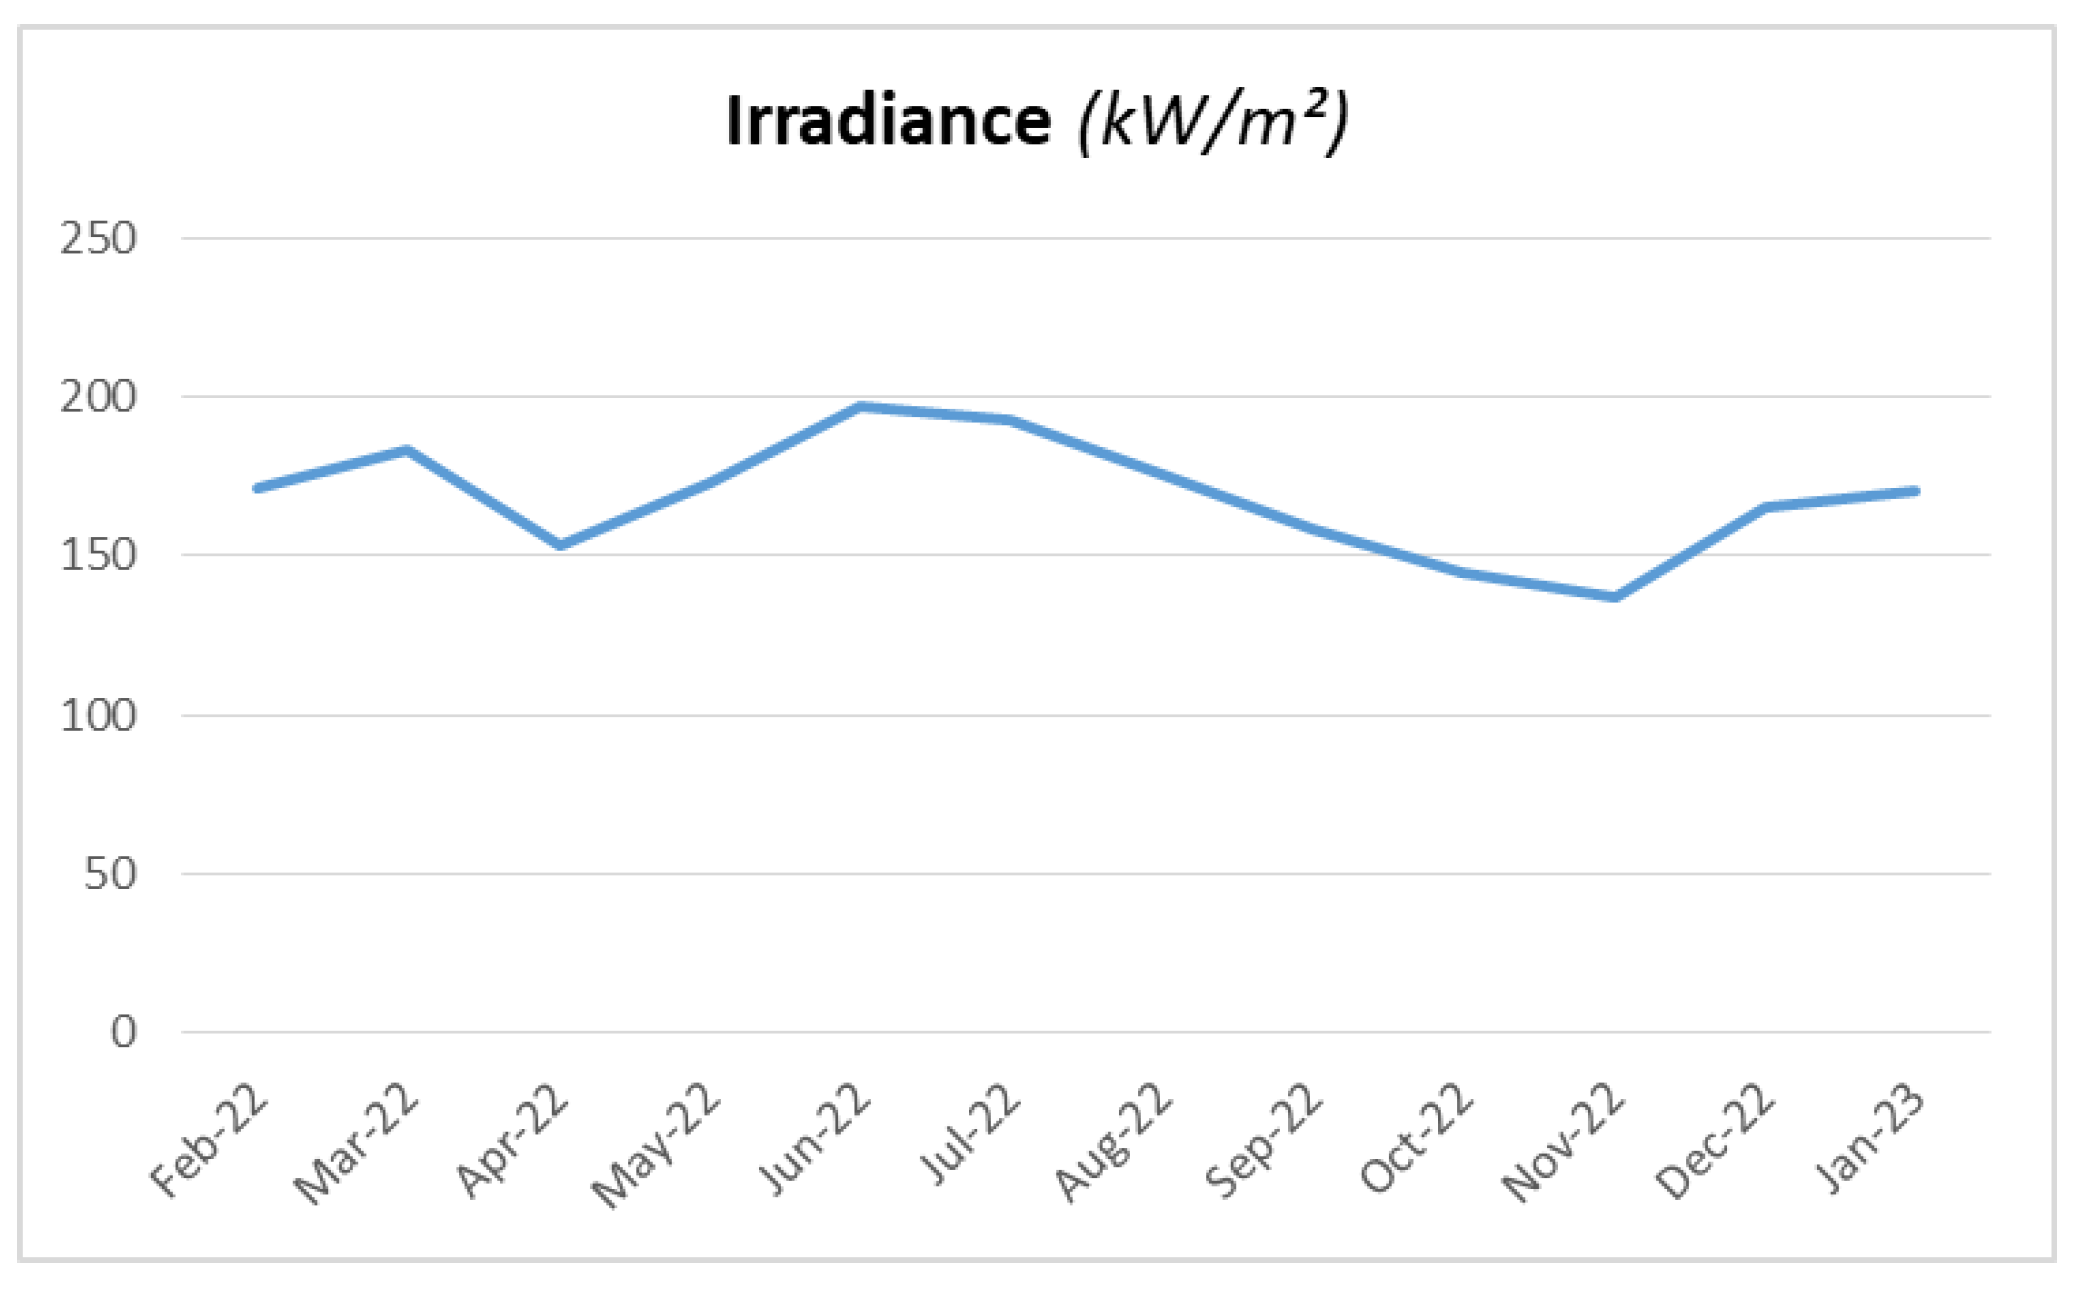
4.1. Solarimetric Data Collection

For the proper design of photovoltaic projects, it is essential to understand the available resources. Given that solar energy is highly variable, it is crucial to have a reliable resource measurement system [31].
To monitor the environmental parameters, the installed photovoltaic system is equipped with a solarimetric station that measures and records critical environmental data. Figure 1b illustrates the solarimetric station. This station includes a fieldlogger data collector for collecting and storing the data from sensors; temperature sensor operating from −40 °C to 80 °C; relative air humidity sensor; second-class pyranometer (model SR05-D2A2-HUKSEFLUX) for measuring solar radiation, with a measurement range from 0 to 1600 W/m2; wind speed sensor with a measurement range from 0.4 to 55 m/s; wind direction sensor measuring from 0° to 360°; and a IP66 data collection box with a 30 W solar panel and a 12 Ah battery.

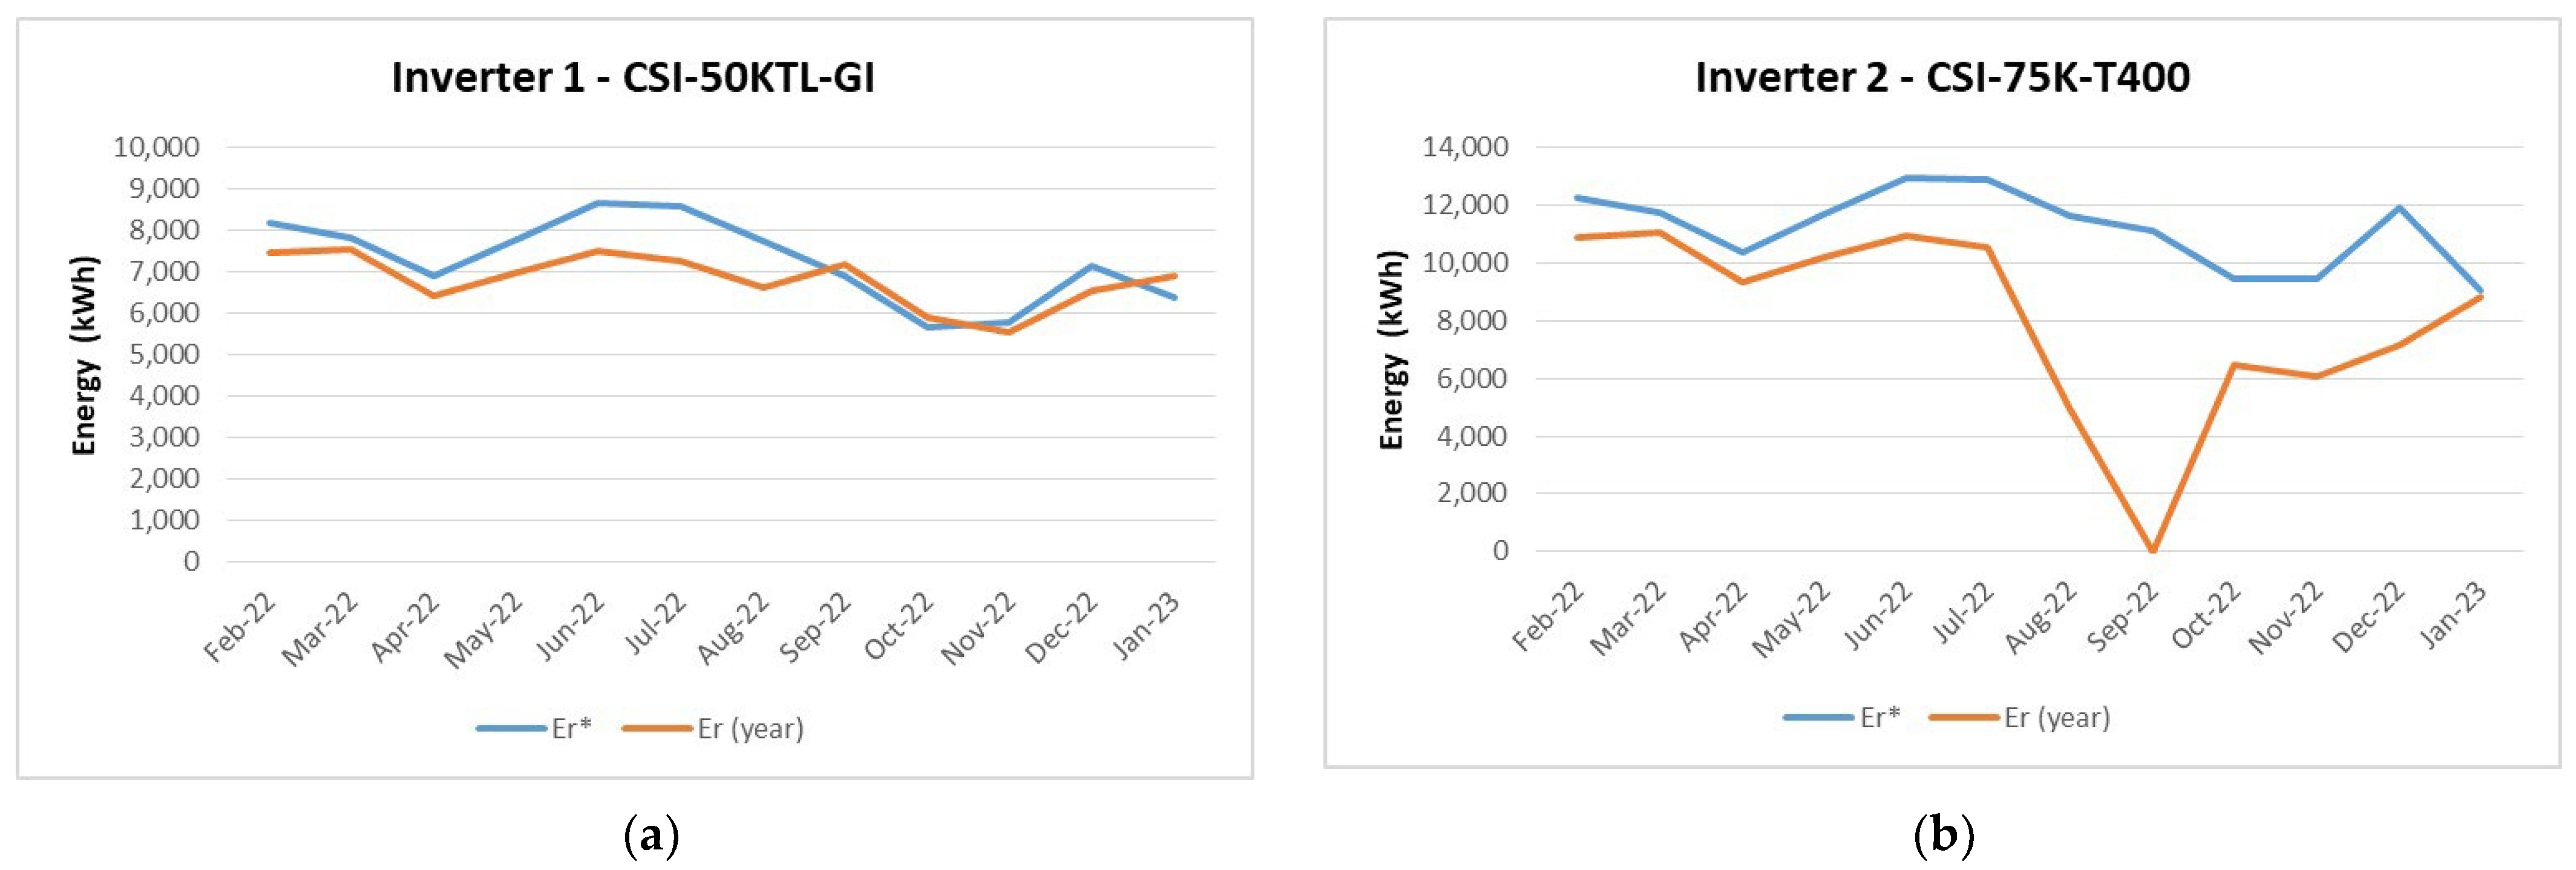
4.2. Data Collection—Energy Injected into the Grid

In terms of obtaining the energy effectively produced by the photovoltaic system, including the power at the input ( P D C ) and output ( P A C ) of the inverter, the data were obtained via a supervisory system for monitoring the inverter, provided by the manufacturer, Canadian Solar.

4.3. Data Processing

The solarimetric station records data at 1 min intervals. However, it is important to note that there is a possibility of data loss, where data may not be recorded at the expected intervals. On the other hand, the inverters record their data at 5 min intervals. To align the datasets, the recording times were synchronized, ensuring that the data from the solarimetric station and inverters shared the same periodicity. Mean values were calculated for each inverter, using the inverter’s recording time as the reference. Another step involved excluding rows from the solarimetric data where negative irradiance was recorded, which corresponded to times when the incident irradiance was not yet sufficient to generate electrical energy.

4.4. Application of the Brazilian Standard ABNT NBR 16274:2014 for Performance Analysis

After data processing, 24 spreadsheets were created—one for each month and one for each installed photovoltaic system. Using the data provided by the solarimetric station and the monitoring system of each inverter, the formulations for Steps 7 and 8 of the performance analysis methodology outlined in ABNT NBR 16274:2014 were implemented [10]. The implementation methodology is presented below, and a summary of the results is shown in Table 2. The calculations were based on the months of inverter operation (from March 2022 to February 2023), totaling 12 months of analysis. The theoretical PR found for each system each month was very similar, as the irradiance averages for each photovoltaic array were the same. Since there were minor variations in the final adjusted PR for each system, an arithmetic average of the values was calculated to determine the final PR for each monitored month of operation.
As described in Step 7, the operating temperatures of the photovoltaic cells were initially calculated using Equation (12), with the input data being the average ambient temperature and irradiance, aggregated into 5 min intervals, provided by the solarimetric station, thus aligning with the inverter recording times. A TNOC value of 42 °C, provided by the manufacturer, was also used. Then, it was necessary to determine the inverter efficiency curve coefficients, k0, k1, and k2.
According to Equation (7), the two dependent variables for calculating the coefficients are the power values   P D C and P A C measured from the inverters. Analyzing the first two months (March and April), it was observed that the coefficient values were similar. Therefore, the average values found for these two months were used for the remaining months.
Rearranging Equation (7), it is possible to obtain Equation (17), to which the Least Squares Method was applied to determine the values of k0, k1, and k2.
P D C = k 0 · P N I + k 1 + 1 · P C A + k 2 P N I · P C A 2
Once the coefficient values were determined, Equation (4) was used to find the theoretical value of   P D C * . With this value, and by applying the coefficients, the theoretical value of P A C *   was obtained using Equation (5). According to the standard, the value of c for crystalline silicon modules is 0.031, and from the module manufacturer’s catalog, the value of γ is −0.37%/°C.
To calculate the theoretical energy injected into the grid, the arithmetic averages of P A C * were calculated for each day of the month, and then multiplied by the total recorded time in hours for that day, as registered by the inverter, following Equation (6). The daily results were summed to determine the total theoretical energy injected each month, in kWh. Thus, the theoretical energy injected by each installed photovoltaic system was calculated.
Next, it was checked whether E R , y e a r < 0.95 × E R * or E R , y e a r > 1.05 × E R * . If either of these conditions was true, it was necessary to adjust the values of P D C * and P A C * by applying a loss scenario determined in Equations (8)–(11). Subsequently, as described in Step 8, the new value for the theoretical energy injected into the grid for the month was calculated using Equation (15).
With the monthly value of energy injected into the grid, the system’s PR for the month was finally calculated using Equation (16). The value of H was obtained using the same procedure, by calculating the average irradiance for each day, then multiplying by the recorded time for that day, and finally summing the daily values to find the total for the respective month.
Finally, Figure 3 compares the values of theoretical energy and of the measured energy for the analyzed period. Figure 4, in turn, shows the values of the measured irradiance for each month. In some instances, the solarimetric station did not record irradiance data for several days. For example, in July, there were 7 days without records from the station, although the inverter continued recording. For these days without data, the average from the remaining days of the month was used to determine the total irradiance and also the theoretical energy yield ( E R * ).
Regarding the photovoltaic system installed with a 75 kW inverter (Figure 3b), it should be noted that a significant energy yield (ER) reduction was observed between September 2022 and January 2023, as presented in Table 3. This outcome was associated with two factors: The first involves technical issues that led to the inverter’s failure and, consequently, the system shutdown in mid-September. A new inverter was installed in November, allowing the system to reconnect. The second factor that contributed to the energy yield (ER) reduction was the disconnection of several rows of photovoltaic modules due to the activation of protection devices installed at the photovoltaic array terminals. This issue was only identified at the end of January due to the absence of a performance monitoring system capable of detecting faults and determining the corrective and/or preventive actions necessary to ensure the desired PR.

5. Discussion

This section presents and discusses the results obtained after executing the procedures outlined in Steps 7 and 8 of the type 2 performance evaluation methodology, as specified in the Brazilian Standard ABNT NBR 16274 [10].
Figure 5 shows the PR calculated for the two installed photovoltaic systems based on the energy generation data. In the initial months (March 2022 to April 2023), after the photovoltaic system began operating, it was observed that the modules remained relatively clean, allowing for better energy conversion and a higher PR. However, as the year progressed, particularly during the dry season (from May 2022 to October 2022), the accumulation of dust and the lack of preventive maintenance led to a reduction in the system’s performance. The effect of dirt accumulation on the module performance varies by location. The deposition behavior and the physical–chemical composition of contaminants are influenced by site-specific variables [32].
Regarding the photovoltaic system installed with a 75 kW inverter (Figure 5b), a significant PR reduction was observed between September 2022 and January 2023. This outcome is associated with two factors: The first involves the technical issues that led to the inverter’s failure and, consequently, the system shutdown in mid-September. As mentioned before, a new inverter was installed in November, allowing the system to reconnect. The second factor that contributed to the PR reduction was the disconnection of several rows of photovoltaic modules due to the activation of protection devices installed at the photovoltaic array terminals, which was only identified at the end of January. This highlights the importance of continuously monitoring the performance of photovoltaic systems to ensure that potential failures are identified promptly, and financial losses are avoided.
It is also worth noting that ABNT NBR 16274 recommends that solarimetric data measurement instruments be located at the same site and height as the photovoltaic array. In this study, the solarimetric station was located on the ground, approximately 50 m away from the array installed on the building’s roof. There were also instances where the solarimetric station failed to record irradiance data. For example, in July 2022, seven days went unrecorded, and the average from the remaining days of the month was used to determine the irradiance for calculating the PR for July. In other cases, such as in May 2022, neither the inverter monitoring system nor the station recorded data for a period of 3 days. In this case, the energy injected into the grid that month was lower than the average for other months.

6. Conclusions

This work focused on evaluating the performance of the photovoltaic system in-stalled in the UED block of FGA/UnB, based on the premises established by the Brazilian Standard ABNT NBR 16274:2014.
Using irradiance and ambient temperature measurements provided by the solar-imetric station, as well as information about the generated electric energy provided by the supervisory systems of the installed inverters, the PR of the photovoltaic systems was calculated.
For the 12 months of monitoring, between March 2022 and February 2023, the results for the system with a 50 kW inverter indicated an average global PR of 78%, which is considered consistent given that there was no module cleaning and no failures detected in either the photovoltaic array or the inverter.
On the other hand, the system with a 75 kW inverter exhibited a PR ranging from 56% to 93%, reflecting significant performance variability. In this case, the failure of the 75 kW inverter, which led to the system being disconnected for about 45 days, and the disconnection of photovoltaic strings due to the blowing of protection fuses, are identified as the main factors leading to the system’s poor performance.
These findings highlight the need for the continuous monitoring of photovoltaic system performance to ensure that any failures and reductions in electricity generation are identified in a timely manner, preventing financial losses.
The research group responsible for this work is concentrating efforts on developing computational tools capable of real-time monitoring of photovoltaic system performance, ensuring the expected financial return through timely preventive and corrective maintenance actions. The results of this new research will be published in future works.

7. Directions for Further Research

Future research should prioritize long-term PR evaluation for PV installations. As a crucial metric for assessing the overall performance of a PV power plant, a multi-year PR analysis could yield valuable insights into system degradation trends and maintenance needs. Additionally, examining the influence of varying climate conditions on PR is essential. Applying similar analyses to PV plants in different Brazilian climate zones would allow for the assessment of PR variability under environmental factors such as temperature, humidity, and dust.
In terms of monitoring, the study can be expanded to include systems equipped with advanced IoT-based sensors and signal processing techniques, enabling more precise data collection and analysis. Investigating PR in hybrid or autonomous PV systems would further reveal the differences in degradation rates across the system types. Research could also explore the PR performance in hybrid setups with complementary energy sources, such as wind, tidal, or biomass.
Finally, applying machine learning techniques to predict PR trends could optimize plant maintenance schedules, while comparisons with alternative performance metrics might identify complementary indicators that enhance the PR assessment accuracy. These efforts would be particularly relevant for emerging technologies and non-traditional system configurations, leading to improved performance tracking and operational efficiency.

Author Contributions

Conceptualization, A.R. and L.N.V.; methodology, validation, formal analysis, investigation, P.F., A.R. and L.N.V.; resources, A.R., L.N.V. and T.M.F.; data curation, P.F., A.R., Ê.C.R. and L.C.G.F.; writing—original draft preparation, P.F. and A.R.; writing—review and editing, L.N.V., Ê.C.R. and L.C.G.F.; supervision, funding acquisition, and project administration, A.R., L.N.V. and T.M.F. All authors have read and agreed to the published version of the manuscript.

Funding

This research was partially funded in part by Universidade de Brasília (UnB), and in part by the Ministério da Educação (MEC)—Grant SIMEC-ted-pt-13285, and Fundação de Amparo à Pesquisa do Distrito Federal (FAPDF)—Grant SEI-GDF: 00193-00002423/2023-11.

Data Availability Statement

The datasets presented in this article are not readily available because the data are part of an ongoing study. Requests to access the datasets should be directed to alexreis@unb.br.

Acknowledgments

The authors would like to thank Ministério da Educação (MEC) and Fundação de Amparo à Pesquisa do Distrito Federal (FAPDF) for supporting this research project.

Conflicts of Interest

The authors declare no conflicts of interest.

References

  1. ANEEL. Resolução Normativa 482; ANEEL: Brasília, Brazil, 2012; pp. 1–13. Available online: https://www.gov.br/aneel/pt-br/assuntos/geracao-distribuida (accessed on 6 October 2024).
  2. IRENA [International Renewable Energy Agency]. Future of Solar Photovoltaic: Deployment, Investment, Technology, Grid Integration and Socio-Economic Aspects. 2019. Available online: https://www.irena.org/-/media/Files/IRENA/Agency/Publication/2019/Nov/IRENA_Future_of_Solar_PV_2019.pdf (accessed on 26 September 2024).
  3. Quinelato, D.D.D.; Batista, E.A.; Santos, R.R.; Allatta, E.; Brito, M.A.G. Projeto de um estimador de perdas por sujidade em módulos fotovoltaicos utilizando modelo preditivo. Rev. Eletrôn. Potência 2021, 26, 84–93. [Google Scholar] [CrossRef]
  4. Lopes, B.M.; Costa, A.M.; Uturbey, W. Simulation with performance evaluation of photovoltaic production using long term monthly irradiation data. Renew. Energy 2024, 223. [Google Scholar] [CrossRef]
  5. Felipe, T.A.; Melo, F.C.; Freitas, L.C.G. Design and Development of an Online Smart Monitoring and Diagnosis System for Photovoltaic Distributed Generation. Energies 2021, 14, 8552. [Google Scholar] [CrossRef]
  6. Karaveli, A.B.; Ozden, T.; Akinoglu, B.G. Determining Photovoltaic Module Performance and Comparisons. In Proceedings of the International Conference on Photovoltaic Science and Technologies (PVCon), Ankara, Turkey, 4–6 July 2018; pp. 1–5. [Google Scholar] [CrossRef]
  7. Riley, E. Photovoltaic system model validation and performance testing: What project developers and technology providers must do to support energy production estimates. In Proceedings of the 38th IEEE Photovoltaic Specialists Conference, Austin, TX, USA, 3–8 June 2012; pp. 3053–3055. [Google Scholar] [CrossRef]
  8. Rediske, G.; Michels, L.; Siluk, J.C.M.; Rigo, P.D.; Rosa, C.B.; Lima, A.C. A proposed set of indicators for evaluating the performance of the operation and maintenance of photovoltaic plants. Appl. Energy 2024, 354, 122158. [Google Scholar] [CrossRef]
  9. Kim, G.G.; Hyun, J.H.; Choi, J.H.; Ahn, S.-H.; Bhang, B.G.; Ahn, H.-K. Quality Analysis of Photovoltaic System Using Descriptive Statistics of Power Performance Index. IEEE Access 2023, 11, 28427–28438. [Google Scholar] [CrossRef]
  10. ABNT NBR 16274-2014; Grid Connected Photovoltaic Systems. Associação Brasileira de Normas Técnicas: Rio de Janeiro/São Paulo, Brazil, 2014.
  11. Akpolat, A.N.; Dursun, E.; Kuzucuoğlu, A.E.; Yang, Y.; Blaabjerg, F.; Baba, A.F. Performance Analysis of a Grid-Connected Rooftop Solar Photovoltaic System. Electronics 2019, 8, 905. [Google Scholar] [CrossRef]
  12. Dhimish, M. Performance Ratio and Degradation Rate Analysis of 10-Year Field Exposed Residential Photovoltaic Installations in the UK and Ireland. Clean Technol. 2020, 2, 170–183. [Google Scholar] [CrossRef]
  13. Montes, C.; Dorta-Guerra, R.; González-Díaz, B.; González-Pérez, S.; Ocaña, L.; Llarena, E. Study of the Evolution of the Performance Ratio of Photovoltaic Plants Operating in a Utility-Scale Installation Located at a Subtropical Climate Zone Using Mixed-Effects Linear Modeling. Appl. Sci. 2022, 12, 11306. [Google Scholar] [CrossRef]
  14. Zdyb, A.; Sobczyński, D. An Assessment of a Photovoltaic System’s Performance Based on the Measurements of Electric Parameters under Changing External Conditions. Energies 2024, 17, 2197. [Google Scholar] [CrossRef]
  15. Ali, A.; Volatier, M.; Darnon, M. Optimal Sizing and Assessment of Standalone Photovoltaic Systems for Community Health Centers in Mali. Solar 2023, 3, 522–543. [Google Scholar] [CrossRef]
  16. Mohamed, K.; Shareef, H.; Nizan, I.; Esan, A.B.; Shareef, A. Operational Performance Assessment of Rooftop PV Systems in the Maldives. Energy Rep. 2024, 11, 2592–2607. [Google Scholar] [CrossRef]
  17. Kumar, M.; Kumar, A. Performance Assessment of Different Photovoltaic Technologies for Canal-Top and Reservoir Applications in Subtropical Humid Climate. IEEE J. Photovolt. 2019, 9, 722–732. [Google Scholar] [CrossRef]
  18. Jamil, I.; Lucheng, H.; Habib, S.; Aurangzeb, M.; Ali, A.; Ahmed, E.M. Performance Ratio Analysis Based on Energy Production for Large-Scale Solar Plant. IEEE Access 2022, 10, 5715–5735. [Google Scholar] [CrossRef]
  19. Lagarde, Q.; Beillard, B.; Mazen, S.; Denis, M.S.; Leylavergne, J. Performance ratio of photovoltaic installations in France: Comparison between inverters and micro-inverters. J. King Saud Univ. Eng. Sci. 2023, 35, 531–538. [Google Scholar] [CrossRef]
  20. ABNT NBR 10899; Energia Solar Fotovoltaica—Terminologia. Associação Brasileira de Normas Técnicas: Rio de Janeiro, Brazil, 2006.
  21. ABNT NBR 16149; Sistemas Fotovoltaicos (FV)—Características da Interface de Conexão com a Rede Elétrica de Distribuição. Associação Brasileira de Normas Técnicas: Rio de Janeiro, Brazil, 2013.
  22. IEC 60364 (all parts); Low-Voltage Electrical Installations. IEC: Geneva, Switzerland, 2005.
  23. IEC 60364-6; Low-Voltage Electrical Installations—Part 6: Verification. IEC: Geneva, Switzerland, 2006.
  24. IEC 60364-7-712; Electrical Installations of Buildings—Part 7-712: Requirements for Special Installations or Locations—Solar Photovoltaic (PV) Power Supply Systems. IEC: Geneva, Switzerland, 2002.
  25. IEC 61010 (all parts); Safety Requirements for Electrical Equipment for Measurement, Control, and Laboratory Use. IEC: Geneva, Switzerland, 2019.
  26. IEC 61557 (all parts); Electrical Safety in Low Voltage Distribution Systems up to 1000 V a.c. and 1500 V d.c.—Equipment for Testing, Measuring or Monitoring of Protective Measures. IEC: Geneva, Switzerland, 2019.
  27. IEC 61730-1; Photovoltaic (PV) Module Safety Qualification—Part 1: Requirements for Construction. IEC: Geneva, Switzerland, 2016.
  28. IEC 61730-2; Photovoltaic (PV) Module Safety Qualification—Part 2: Requirements for Testing. IEC: Geneva, Switzerland, 2023.
  29. IEC 61724; Photovoltaic System Performance Monitoring—Guidelines for Measurement, Data Exchange and Analysis [S.l.]. International Electrotechnical Commission: Geneva, Switzerland, 2017.
  30. Khalid, A.M.; Mitra, I.; Warmuth, W.; Schacht, V. Performance ratio—Crucial parameter for grid connected PV plants. Renew. Sustain. Energy Rev. 2016, 65, 1139–1158. [Google Scholar] [CrossRef]
  31. Lira, A.L.d.O.; Soares, B.d.L.; Santos, S.d.A. Estação solarimétrica de referência—Instalação, operação e manutenção. Rev. Bras. Energ. Sol. 2017, 7, 132–139. [Google Scholar] [CrossRef]
  32. Silva Costa, S.C.; Alves Cardoso Diniz, A.S.; Camatta, V.; Lee Kazmerski, L. Determinação das taxas de sujidade para módulos fotovoltaicos de filme fino e silício cristalino instalados em diferentes zonas climáticas brasileiras. Rev. Bras. Energ. Sol. 2021, 11, 58–67. [Google Scholar] [CrossRef]
Figure 1. Gama Campus of the University of Brasília: (a) (1) teaching unit (UED); (2) academic unit (UAC); (3) sports and equipment services module (MESP); (4) laboratory for transport development and alternative energies (LDTEA); (b) solarimetric stations installed nearby (1) teaching unit (UED).
Sustainability 16 11212 g001
Figure 2. Electrical devices that connected the PV power plant to grid and loads: (a) solar inverters (b) internal view of the electrical panel 1 (c) internal view of the electrical panel 2.
Sustainability 16 11212 g002
Figure 3. Comparison between the values of theoretical energy yield and of the measured energy yield for the analyzed period: (a) 50 kW inverter (b) 75 kW inverter.
Sustainability 16 11212 g003
Figure 4. Values of the measured irradiance for each month.
Sustainability 16 11212 g004
Figure 5. PR calculated for the two installed photovoltaic systems based on the electric energy generation data provided by the inverter monitoring system: (a) 50 kW inverter (b) 75 kW inverter.
Sustainability 16 11212 g005
Table 1. Parameters of the installed modules and of the inverters responsible for grid connection.
Modules Parameters
Maximum Rated Power ( P m a x ) 420 W
MPPT Voltage ( V m a x ) 39.5 V
MPPT Current ( I m a x ) 10.64 A
Open Circuit Voltage48 V
Short Circuit Current11.26 A
Module Efficiency19.01%
Operational Temperature−40 °C to +85 °C
Inverter 1—CSI-75K-T400
Maximum PV Power112.5 kW
Maximum DC Input Voltage1100 Vdc
DC Start Voltage195 Vdc
MPPT Voltage Range180–1000 Vdc
Maximum Input Current (Imp) per MPPT26 A
Maximum Short-Circuit Current (Isc) per MPPT40 A
Nominal AC Output Power75 kW
Nominal Output Voltage220/380 Vac
Nominal Grid Output Current114 A
Maximum Efficiency98.7%
Inverter 2—CSI-50KTL-GI
Maximum PV Power58 kW
Maximum DC Input Voltage1100 Vdc
DC Start Voltage200 Vdc
MPPT Voltage Range439–850 Vdc
Maximum Input Current (Imp) per MPPT28.5 A
Maximum Short-Circuit Current (Isc) per MPPT44.5 A
Nominal AC Output Power50 kW
Nominal Output Voltage380/400 Vac
Nominal Grid Output Current76/72.2 A
Maximum Efficiency98.8%
Table 2. Summary of the results obtained for the PV System with Inverter 1—CSI-50KTL-GI.
ParametersMAR.
(2022)
APR.
(2022)
MAY.
(2022)
JUN.
(2022)
JUL.
(2022)
AUG.
(2022)
SEP.
(2022)
OCT.
(2022)
NOV.
(2022)
DEC.
(2022)
JAN.
(2023)
FEB.
(2023)
k00.00230.00230.00230.00230.00230.00230.00220.00220.00220.00220.00210.0021
k10.0090.0090.0090.0090.0090.0090.0100.0090.0090.0090.0100.010
k20.0220.0220.0220.0220.0220.0220.0220.0230.0230.0230.0210.021
E R * (kWh)817678156896779486558576775169205653580071616370
E R ,   y e a r (kWh)745075606420699075207270661072005910554065306900
Loss AdjustmentYesNoYesYesYesYesYesNoNoNoYesNo
ER,year(ajust) (kWh)7419-64266803742672916545---6041-
Irradiance (kW/m2)171.61182.80153.25173.27196.52192.77175.82158.35144.20137.19165.00170.00
P R a v g 0.870.810.840.810.770.750.750.910.820.810.790.81
PRtheo0.950.890.90.90.880.890.880.870.780.850.870.75
PRadjust0.86-0.840.790.760.760.74---0.73-
Table 3. Summary of the results obtained for the PV system with Inverter 2—CSI-75K-T400.
k00.00230.00230.00230.00230.00230.00230.00220.00220.00220.00220.00210.0021
k10.0090.0090.0090.0090.0090.0090.0100.0090.0090.0090.0100.010
k20.0220.0220.0220.0220.0220.0220.0220.0230.0230.0230.0210.021
E R * (kWh)12,26411,72210,34411,69112,92512,86411,62811,0949456942811,9299065
E R ,   y e a r (kWh)10,87011,050934010,20010,93010,5404910-6470608071508800
Loss AdjustmentYesYesYesYesYesYes--YesYesYesNo
ER,year(adjut) (kWh)10,90110,9439210962910,51711,059--608963257316-
Irradiance (kW/m2)171.61182.80153.25173.27196.52192.77175.82158.35144.20137.19165.00170.00
P R a v g 0.840.810.810.780.740.730.37-0.600.590.580.69
PRtheo0.950.890.90.90.880.890.880.930.870.920.960.71
PRadjust0.850.80.80.740.710.76--0.560.610.59-
Disclaimer/Publisher’s Note: The statements, opinions and data contained in all publications are solely those of the individual author(s) and contributor(s) and not of MDPI and/or the editor(s). MDPI and/or the editor(s) disclaim responsibility for any injury to people or property resulting from any ideas, methods, instructions or products referred to in the content.

