1. Introduction
Air pollution represents a significant global health concern, with over 6.5 million early fatalities attributed to it annually, according to the World Health Organization [
1]. Of the reported cases, more than four million deaths have been directly linked to outdoor-related pollution since 2019, underscoring the severity of the air quality crisis and its impact on public health [
1].
In the last decade, there has been an intensified focus on air quality monitoring systems, both indoor and outdoor, due to the intrinsic connection between air quality and human health, as well as the incidence of deaths across both industrialized and emerging countries [
2]. In this context, the evolution of sensor technologies for pollutant monitoring and detection represents a significant advance in the management of these environmental and population welfare challenges [
3]. This is particularly relevant given the potential for contaminant concentrations to vary drastically as a result of various human activities and natural phenomena.
In urban environments, vehicle exhaust emissions, the combustion of fossil fuels in industries, and construction activities are the primary contributors to pollution [
4], a phenomenon exacerbated by the release of particulate matter during adverse weather events. Some of the most frequent air pollutants are nitrogen oxides (NO
x), particulate matter (PM
2.5 and PM
10), sulfur dioxide (SO
2), and ground-level ozone (O
3) [
5], which have a significant impact on human health [
6,
7].
Frequent exposure to these pollutants is associated with respiratory and cardiovascular diseases, as well as increased overall mortality, particularly affecting those who perform outdoor work [
4]. Likewise, extended exposure to elevated pollution levels can contribute to the development of other chronic health problems, such as asthma, bronchitis, and lung cancer [
8]. Therefore, continuous monitoring of outdoor air quality becomes an essential priority to protect the health of all communities and improve the overall well-being of the population.
1.1. Technologies for Air Quality Monitoring
Conventional approaches to monitoring air quality usually employ non-portable stations equipped with a plurality of sensors or are based on manual sampling using different instruments that are not integrated into a single platform, which implies the collection of data in a dispersed manner, and whose analysis and interpretation must be performed in specialized facilities [
9,
10,
11].
Although these methods can offer high accuracy depending on the quality of the equipment, they require bulky and expensive devices, which decreases their feasibility as a scalable solution for efficient monitoring of outdoor contamination events [
12], in addition to the fact that they are often implemented intermittently, limiting the continuity and frequency of the data collection [
13]. Finally, the analysis of air quality using these technologies is usually complex and requires trained personnel for their operation, which further complicates their implementation in accessible, portable, low-cost, and low-energy consumption devices [
14].
In the face of these limitations, unmanned aerial systems (UASs), often referred to as drones, have recently become a promising alternative for air quality monitoring [
15]. Advances in drone technology, coupled with advanced sensor systems and connectivity provided by wireless data transmissions, facilitate the integration of advanced systems that can measure a variety of outdoor air pollutants with high accuracy [
16]. In addition, their ability to cover large areas and access hard-to-reach regions allows for real-time data collection, which is especially useful in emergencies or in areas where ground monitoring is impractical [
17].
The combination of unmanned aerial systems (UASs) with air quality monitoring technologies offers a versatility that optimizes both data collection and analysis. This integration also enables the system to be customized according to the unique requirements of each environment, making drones powerful tools for air quality assessment. Furthermore, their ability to take measurements at multiple points in a short period significantly improves the response to sudden or localized pollution events.
1.2. Design Approach and Paper Structure
This paper outlines the creation of an affordable wireless air quality monitoring platform, integrating an unmanned aerial system (UAS), air quality sensors, a wireless communication system based on the LoRa protocol, and a real-time monitoring web application. The solution aims to establish an accessible monitoring system that facilitates the measurement of outdoor air pollutants in specific sectors. Development and use of the platform not only allow for immediate analysis of air quality data but also provide tools for informed environmental management decisions when used continuously. This facilitates the implementation of more effective policies in any context.
The integration of these technologies creates a robust, efficient, and portable monitoring system. The web application’s intuitive interface facilitates the graphical representation of real-time data, trend graphs, and pollution maps, enhancing the understanding of air quality. Additionally, the ability to generate automatic alerts for critical pollutant levels contributes to a swift response in emergencies. The system’s adaptability to various pollutants and contexts addresses the immediate issue of air pollution and aligns with sustainable development goals, promoting a healthier environment for current and future generations.
This article is structured as follows.
Section 2 provides an overview of the current research landscape, focusing on the integration of unmanned aerial systems (UASs) with other technologies for air pollution analysis.
Section 3 describes the design and implementation of the platform, using both hardware and software tools.
Section 4 presents the main findings from the initial assessment of the system, while
Section 5 focuses on the analysis of those findings. Lastly,
Section 6 synthesizes the conclusions derived from this research and proposes future directions based on the lessons learned.
2. Previous Developments
To adequately inform the design and implementation of the platform, it is essential to review the research history of air quality monitoring technology development. In this section, we examine previous innovations and approaches that have contributed to the evolution of these systems, as well as the methods used in previous studies. Through this review, we seek to contextualize the importance of emerging technologies in environmental monitoring and highlight the foundations that have underpinned the design and implementation of the proposed platform.
2.1. Tools and Techniques for Air Quality Monitoring
The development of increasingly compact, portable, and efficient data collection and processing devices has prompted the creation of various technological systems for air quality assessment in both indoor and outdoor settings [
18]. These systems include low-cost solutions, high-cost monitoring stations, and hybrid methods, which can combine commercial systems [
19] or experimental devices developed by research teams [
20].
According to a review conducted by the International University of Rabat [
21], high-cost stations are more common in high-income countries, while low-cost sensors, although less accurate, offer greater accessibility in different regions. Additionally, three primary prediction techniques are recognized: spatiotemporal approaches, feature-based methods, and time series models [
21,
22]. Despite advances in this area, limitations persist, such as a lack of geographical coverage, low data diversity, and a lack of contextual factors, which reduce the accuracy of the predictions [
23].
Another relevant systematic review in the area identifies significant advances in air quality sensor technologies, highlighting their crucial role in pollution tracking and assessment, both from natural and man-made sources [
3]. Despite the progress made in sensors for monitoring various air pollutants, as also shown in [
24], challenges such as calibration, standardization, and data integration persist in some cases, making reliable air quality assessments difficult [
3,
25].
Numerous studies have developed methodologies for the development and deployment of IoT-driven air quality monitoring systems. These systems use a variety of specialized sensors for the measurement of air pollutants, such as PM
2.5 and PM
10 suspended particulate matter, as well as gases such as O
3, NO
2, SO
2, and CO [
26,
27,
28]. Integrating these sensors with IoT devices facilitates real-time data gathering, easing the creation of denser monitoring networks with greater geographic coverage [
29]. This, in turn, improves the accuracy of the analysis and the ability to detect local variations in air quality, which is essential for informed choices in terms of ecosystem management and the protection of public health [
30].
It is highlighted that machine learning algorithms are commonly used to predict pollution levels, allowing for anticipating adverse conditions and making informed decisions to minimize the general public’s exposure to air pollution [
26]. AI-based techniques are considered critical to transforming the way air pollution is predicted due to their machine learning capabilities, accuracy, and adaptability in the face of changing conditions [
31].
Finally, in the field of data analysis using intelligent techniques, artificial intelligence (AI) has revolutionized this area, offering more accurate results with less need for initial data [
32]. Among the most widely used techniques are support vector machines (SVMs), fuzzy logic, artificial neural networks (ANNs), and deep neural networks (DNNs), all of which have shown effectiveness in forecasting air quality parameters. Of these, DNNs stand out for their high performance in identifying pollution episodes [
33].
2.2. Wireless Data Transmission and Sensor Networks
The advancement of embedded devices has enabled the creation of interconnected systems that form wireless sensor networks dedicated to air quality monitoring. These networks are critical for real-time data collection from multiple locations, enabling more accurate monitoring of air pollutants [
34]. In recently developed studies, such as the one described in [
35], different sensor networks are used to obtain more complete parameters. This work focuses on low-cost electrochemical sensors specifically designed to monitor the concentration of gaseous pollutants, such as ozone (O
3) and nitrogen dioxide (NO
2).
Another relevant example is presented in [
36], where an experimental system for efficient air quality monitoring using LoRa low-power wide-area network (LPWAN) gateways is introduced. The primary benefits of this approach include the high processing speed and low latency, low power consumption, ease of data collection from multiple nodes, and cost efficiency. Although other technologies, such as Zigbee communication and GSM modules for remote areas, have been considered, they have disadvantages, such as the higher power consumption and higher latency [
37].
A similar development was developed by the University of Malta [
38], which involves the design, implementation, and evaluation of a wireless sensor mesh for air quality assessment in real time. This device, characterized by a low-power draw, incorporates affordable sensors and employs LoRa communication. Thanks to its optimized design, it represents a viable solution for long-term environmental monitoring.
Within this framework, LoRa has established itself as a leading protocol for data transmission, thanks to its numerous advantages, such as its wide range, robustness in urban environments, low power consumption, and high capacity to manage large volumes of information [
39].
These characteristics have driven its use in various environmental monitoring applications, generating a growing interest in the research and development of systems that maximize its effectiveness [
40,
41]. Such is the case for the development made at Universiti Kebangsaan Malaysia [
42], where a pollution monitoring system was proposed that surmounts the limitations of short-range wireless protocols like Bluetooth, Wi-Fi, and Zigbee. These low-cost systems allow real-time data transmission, proving to be effective in detecting and classifying different types of contamination [
43].
Finally, LoRa tests highlight its effectiveness for long-range air monitoring, with results comparable to meteorological stations. The distributed embedded system (DES), equipped with MOS, optical, and meteorological sensors, offers an economical and portable alternative for real-time monitoring, as presented in [
44]. These studies recommend improving the coverage by adding more gateways and incorporating sensors for other gases in future research, which would optimize the system’s ability to more accurately address urban pollution.
2.3. UAS for Air Quality Monitoring
In recent years, the use of unmanned aerial systems (UASs) for air quality monitoring has gained popularity due to their flexibility and ability to cover large areas and obtain real-time data [
15,
45]. UASs can be equipped with a variety of sensors, allowing them to detect and measure a wide range of air pollutants [
46]. These devices offer an innovative and efficient alternative to traditional ground-based monitoring methods, allowing data collection in areas that are difficult to access or in densely populated urban areas, providing key data for air quality management and sustainable urban planning.
A prominent work proposes the use of Arduino Uno microcontrollers and NodeMcu for a real-time air quality monitoring IoT system designed for hard-to-reach areas. This system detects pollutants such as CO, O
3, NO
2, PM
2.5, PM
10, and SO
2, with online data updates and alerts for hazardous levels, facilitating continuous and accurate monitoring in remote regions [
47].
Another outstanding work presented in [
48] shows the development of a real-time air quality monitoring system relying on internet-capable drones, which uses the random forest method to ensure effective communication between hardware and software. This allows for handling large datasets, improving the accuracy in air quality prediction and pollution categorization, which is also denoted in [
49].
UASs are particularly useful for air quality monitoring in industrial environments. On that research path, the study conducted in [
50] presents an innovative air pollution monitoring system that uses UAVs equipped with low-cost sensors and LoRa transmission technology, managing to send real-time data over distances of up to 5 km. This system is effective in classifying industrial areas according to the Air Quality Index (AQI), offering wide coverage and a dynamic approach to measuring pollution in hard-to-reach places.
Finally, the work developed at Montana Technological University [
51] focuses on the development of a lightweight and affordable system for monitoring methane (CH
4) over oil fields. This system, which also employs LoRa transceivers, allows the detection of gas leaks and the measurement of environmental conditions, all with easy implementation and operation.
3. Platform Design and Implementation
This section describes the design process for the air quality monitoring platform. It details the instruments and tools used in the construction of the system, as well as the analytical techniques applied in its development. In addition, the experimental procedures implemented are presented, providing a clear view of the methodology used to carry out the system design.
3.1. General Architecture of the Platform
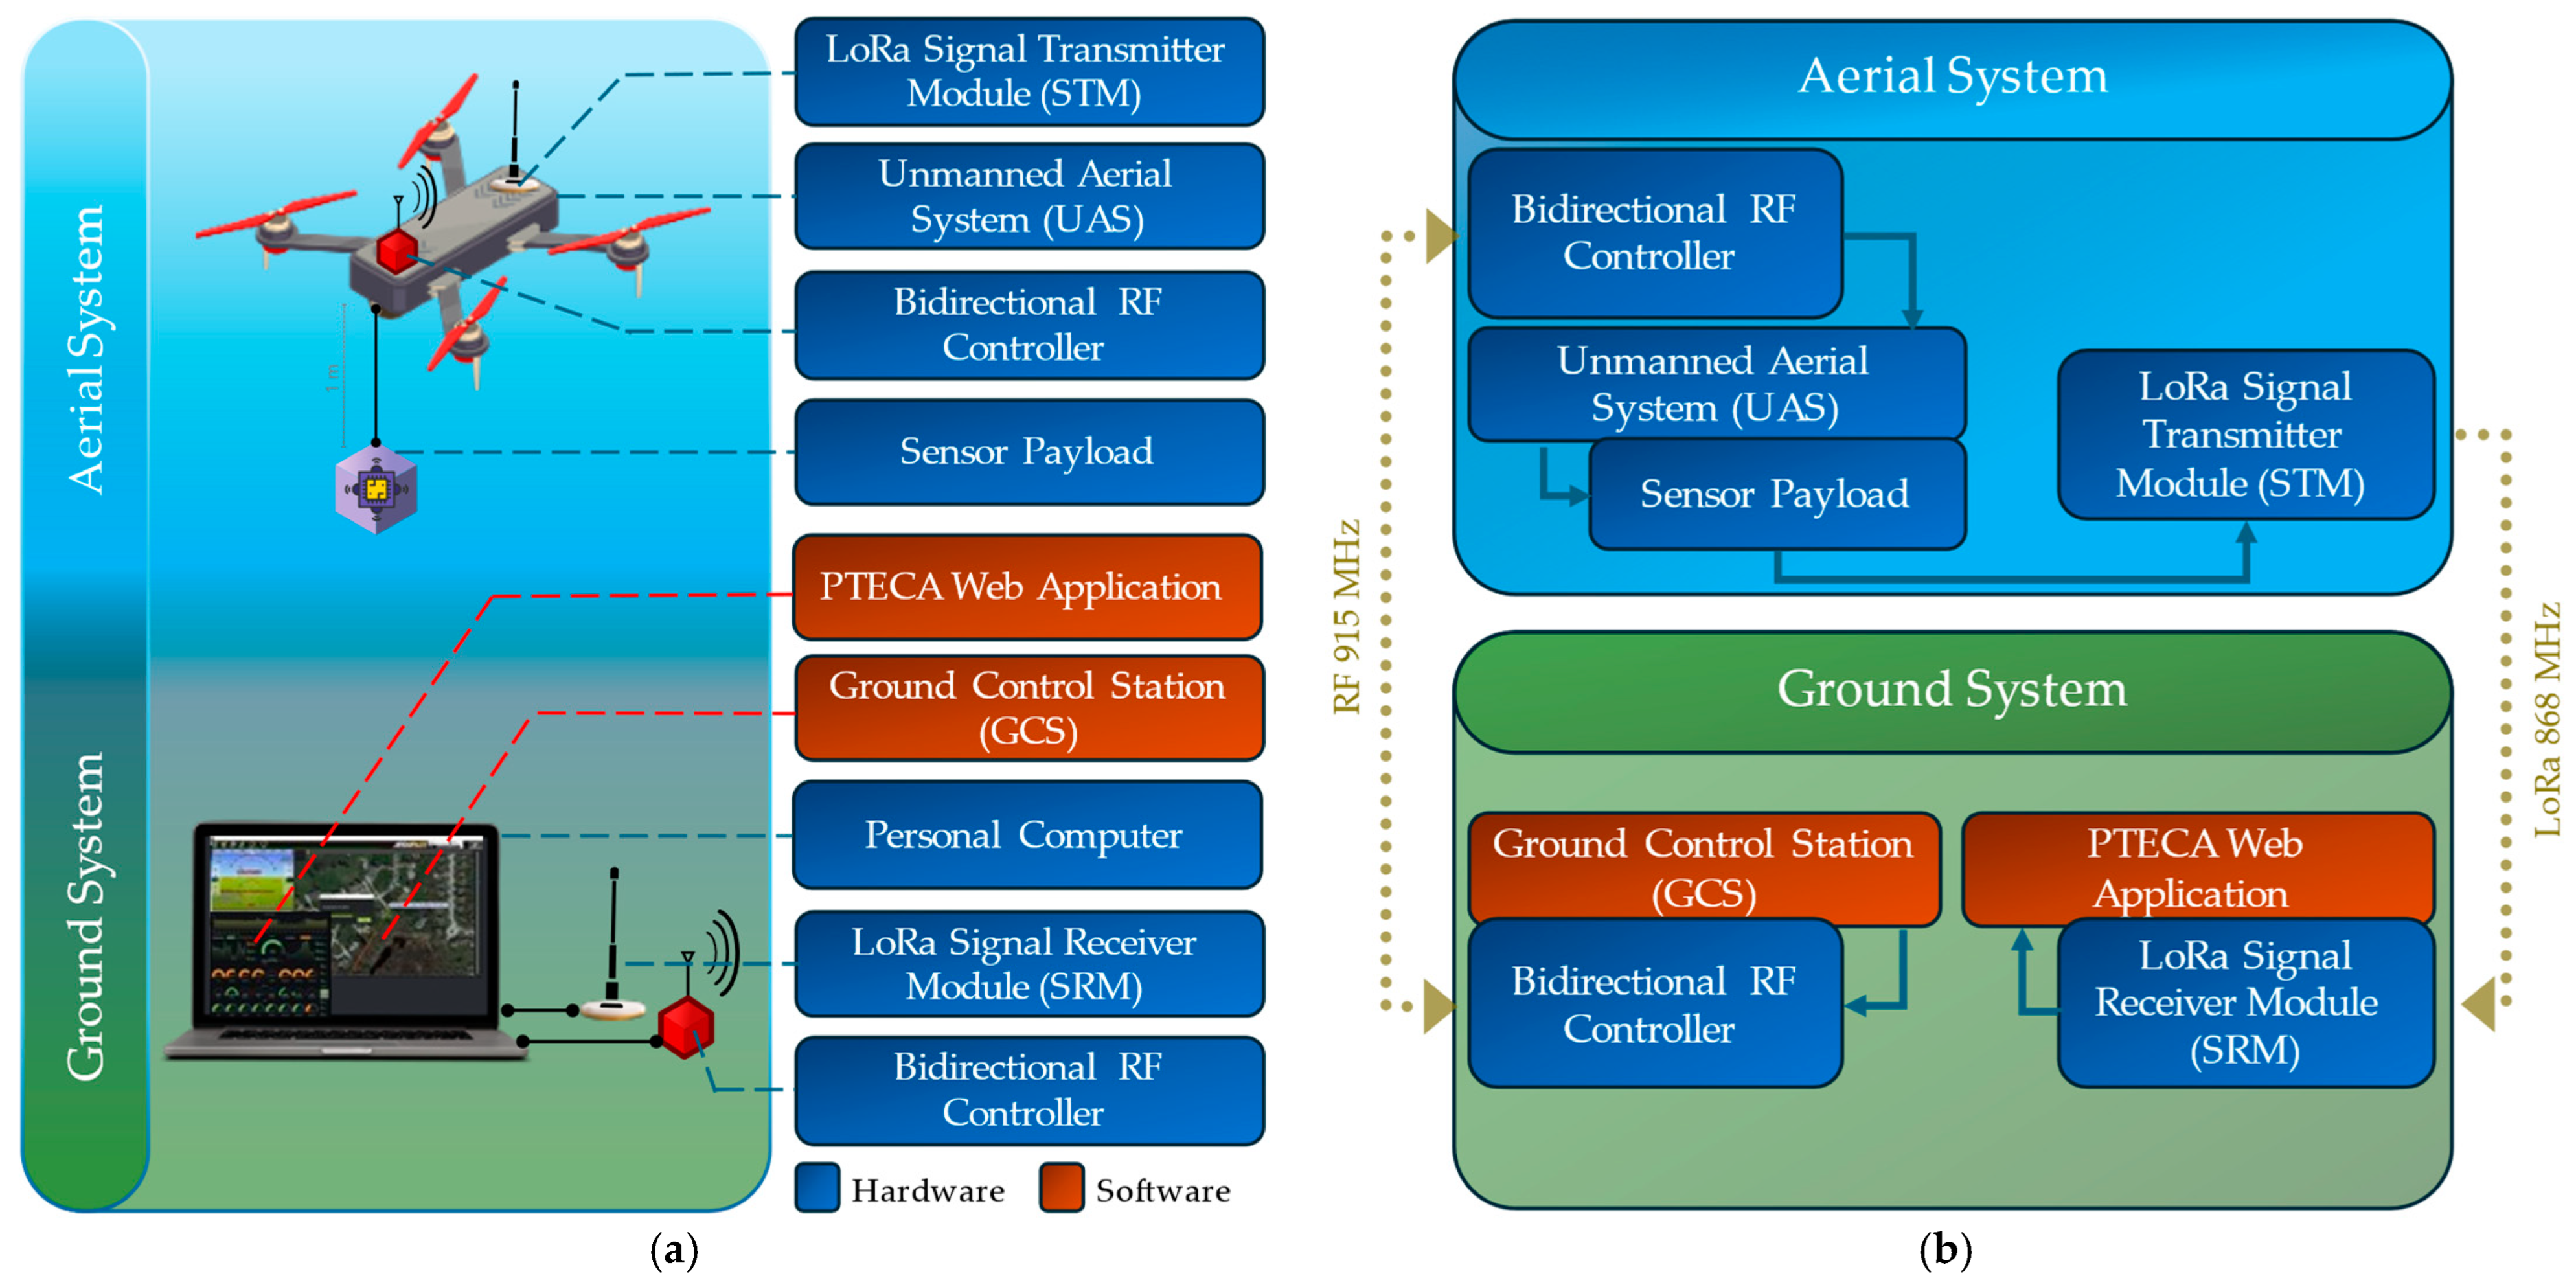
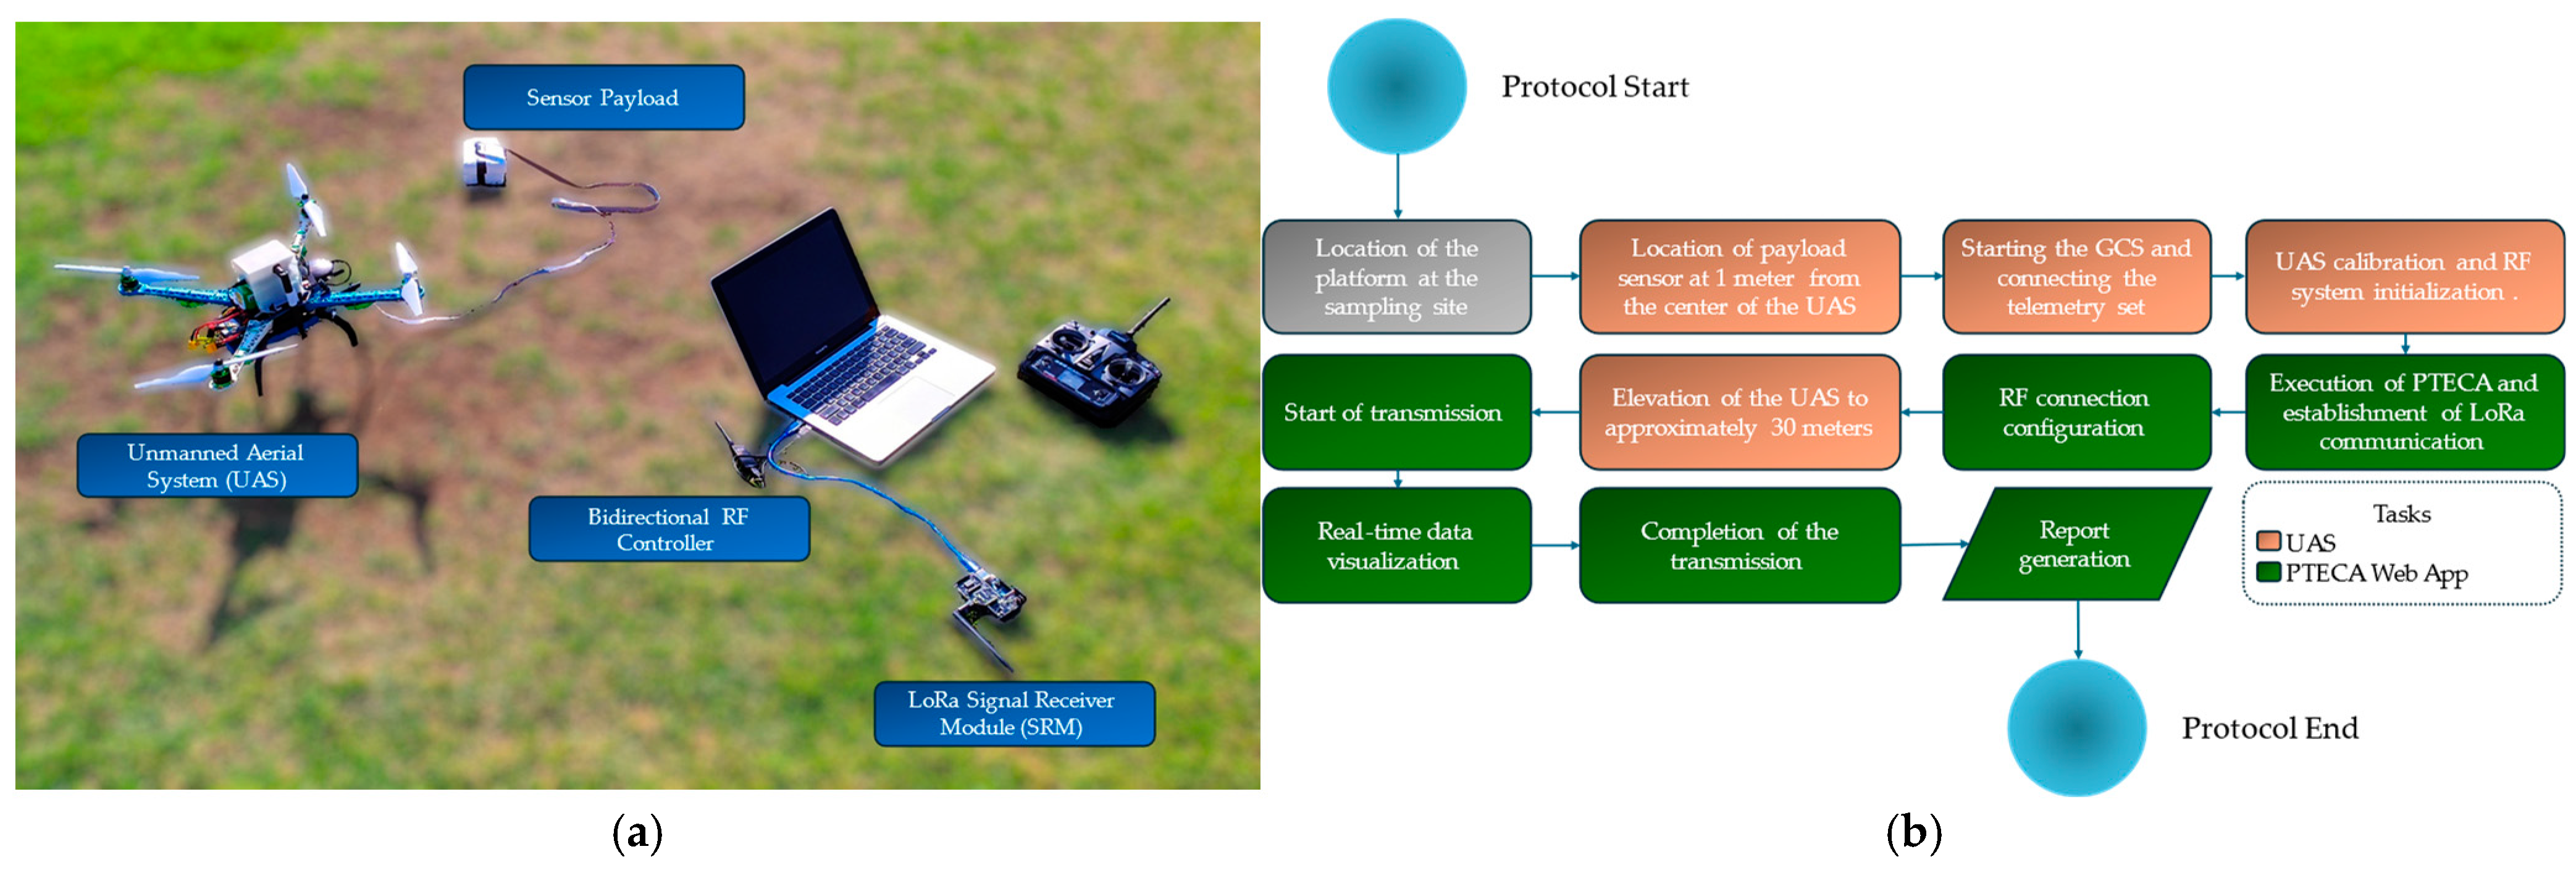
The overall architecture of the platform is based on the integration of complementary technologies. On the one hand, the hardware components include a UAS equipped with a sensor payload that houses the sensors required for air quality monitoring, along with wireless communication channels. On the other hand, the software components comprise a flight control and navigation system, known as ground control station (GCS), and a web application dedicated to receiving real-time data. This configuration allows for efficient information management, integrating all the elements of the platform to optimize its operation and functionality.
Likewise, the configuration of this platform can be interpreted in a logical division between an aerial system, implemented on the UAS, and a ground system, implemented through the use of a personal computer.
Figure 1a below illustrates the layout of each of these components and their interactions.
Figure 1b illustrates by means of a block diagram how the elements that make up the platform architecture form a closed control loop.
In this system, independent communication modules that manage different types of data are involved. On the one hand, modules based on the LoRa protocol are used for the transmission of information related to air quality. This approach enables efficient, long-range communication, ensuring that environmental data are collected and transmitted in real time. On the other hand, the UAS control and associated telemetry rely on radio frequency (RF) signals, facilitating precise and immediate control of drone operations.
3.2. Hardware for the Proposed Platform
The platform combines various hardware technologies, with the unmanned aerial system (UAS) serving as the central component for air quality monitoring. This system is complemented by the dedicated sensor module for the measurement of air quality parameters, as well as the communication modules that allow the efficient transmission of data in real time. The main elements that integrate the operation of the platform at the physical level are described in detail below.
3.2.1. Unmanned Aerial Systems (UASs)
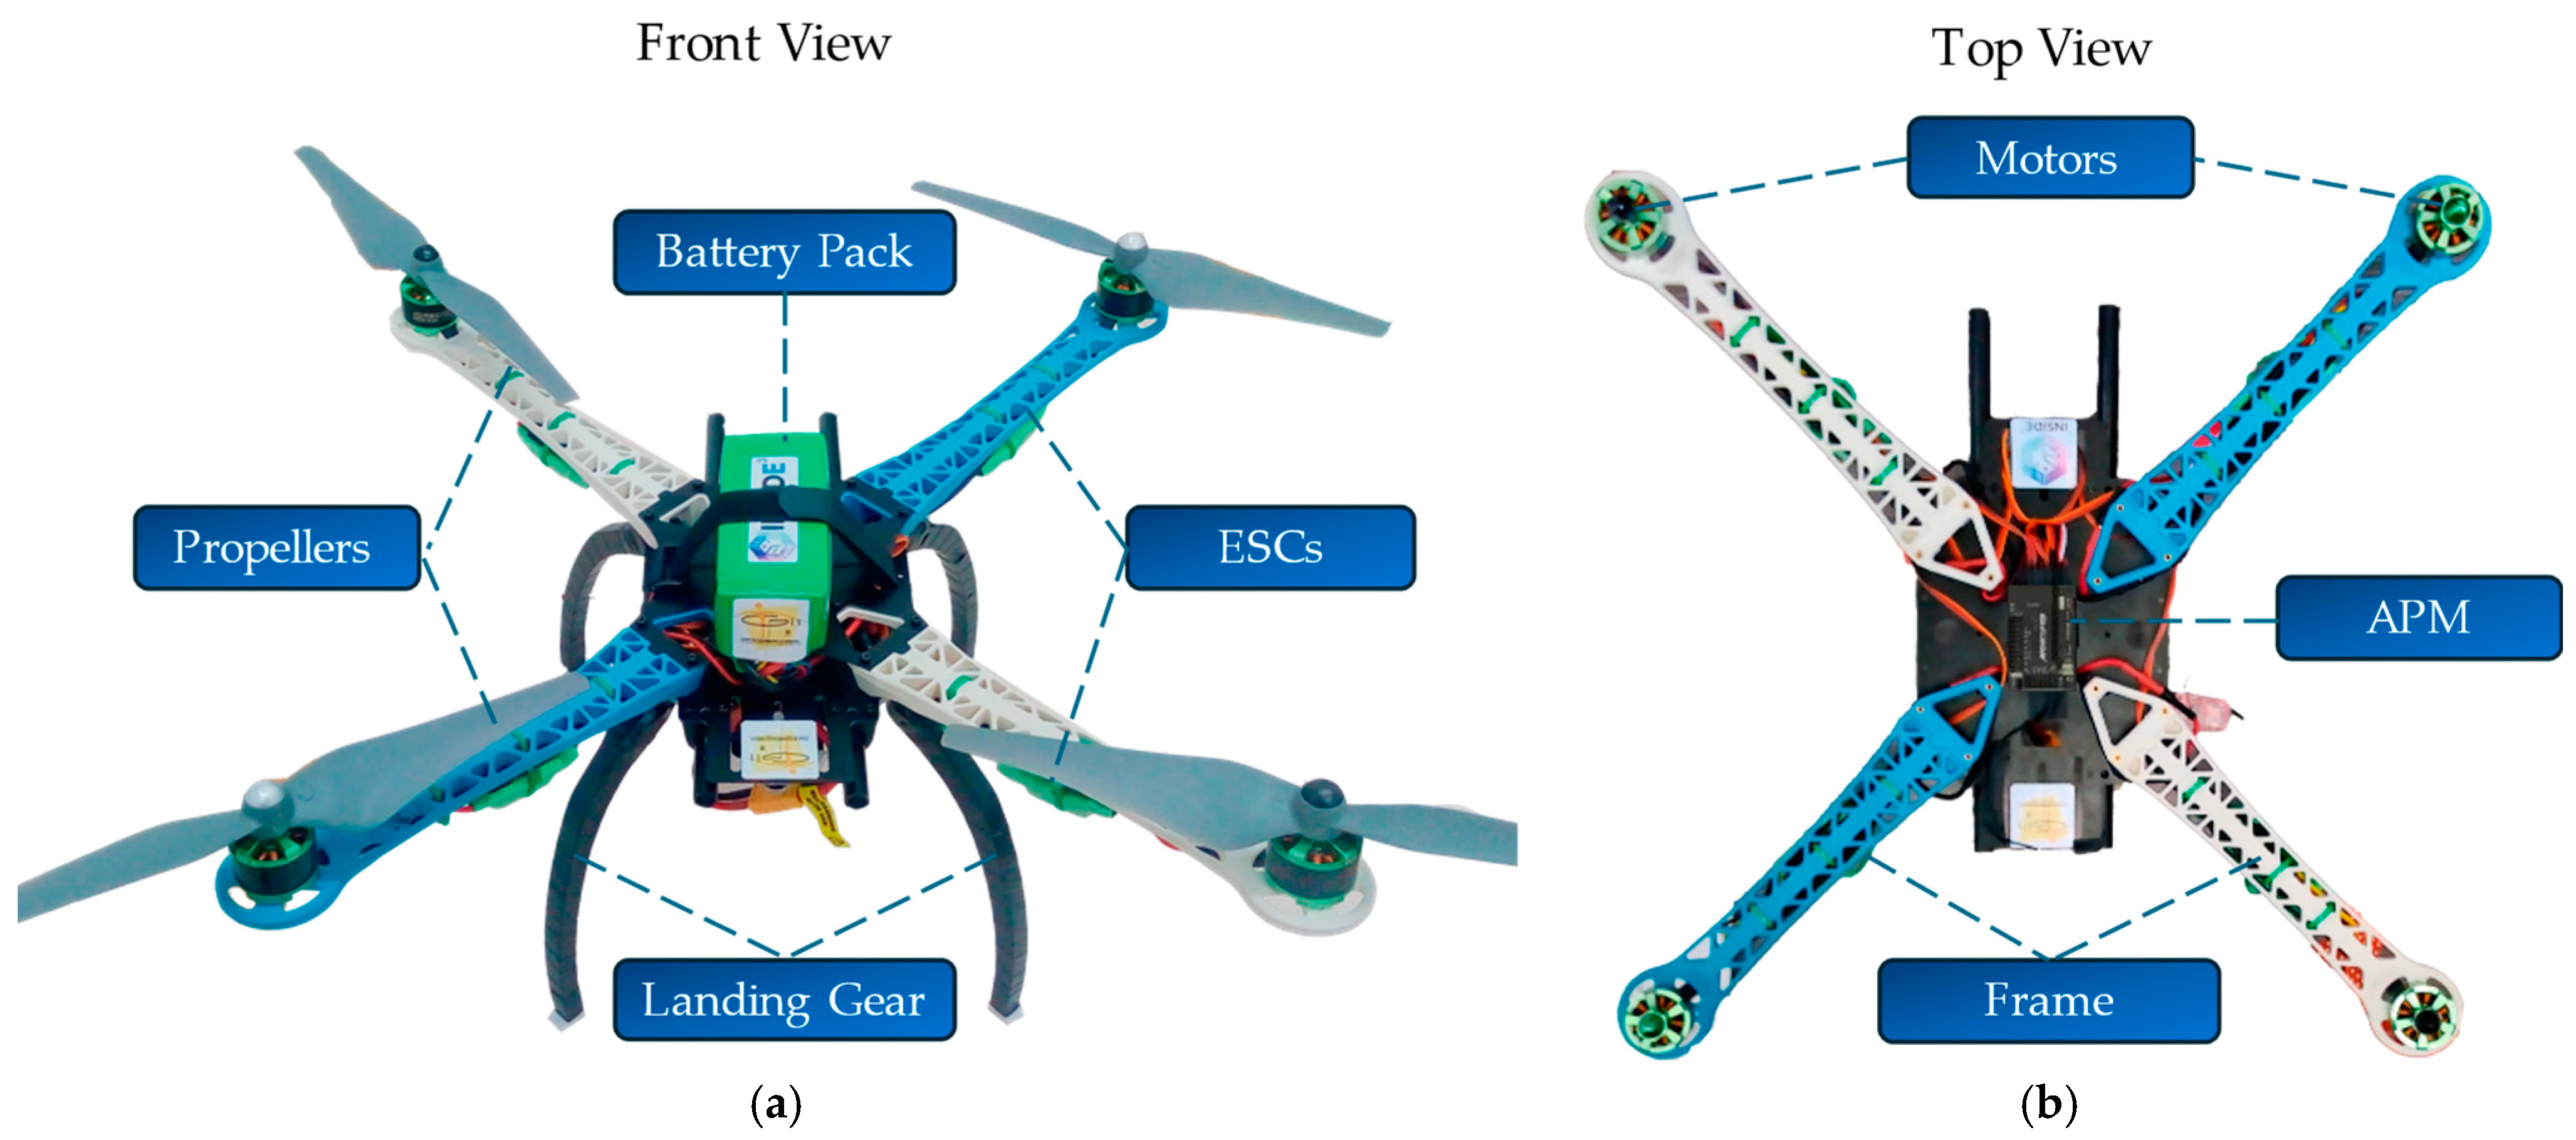
For the development of this research, an unmanned aerial system (UAS) of the quadcopter type with an X configuration was used, as illustrated in
Figure 2. This UAS was designed and built by the research team, which allowed for further customization and adaptation to the specific requirements of the air quality monitoring platform.
The design focused on meeting the payload (sensor) needs and facilitating sample collection missions within an outdoor geofencing environment. To ensure safe and stable operation during missions, a 3D-printed protective hull was incorporated to secure the battery and other hardware components firmly to the chassis, providing a robust attachment that minimizes the risk of detachment during complex flight maneuvers.
The UAS is equipped with an ArduPilot Mega flight controller module (APM) v2.8, which is shown in
Figure 2b, an essential component that manages the stability, navigation, and maneuverability of the UAS, efficiently integrating the different subsystems, such as the propulsion system, attitude control, and communication system.
The choice of this integrated controller module was based on its versatility and ability to adapt to the needs of the mission, allowing precise adjustments in flight parameters through the ground control station (GCS), as well as integration with additional sensors for data collection.
3.2.2. Sensor Payload
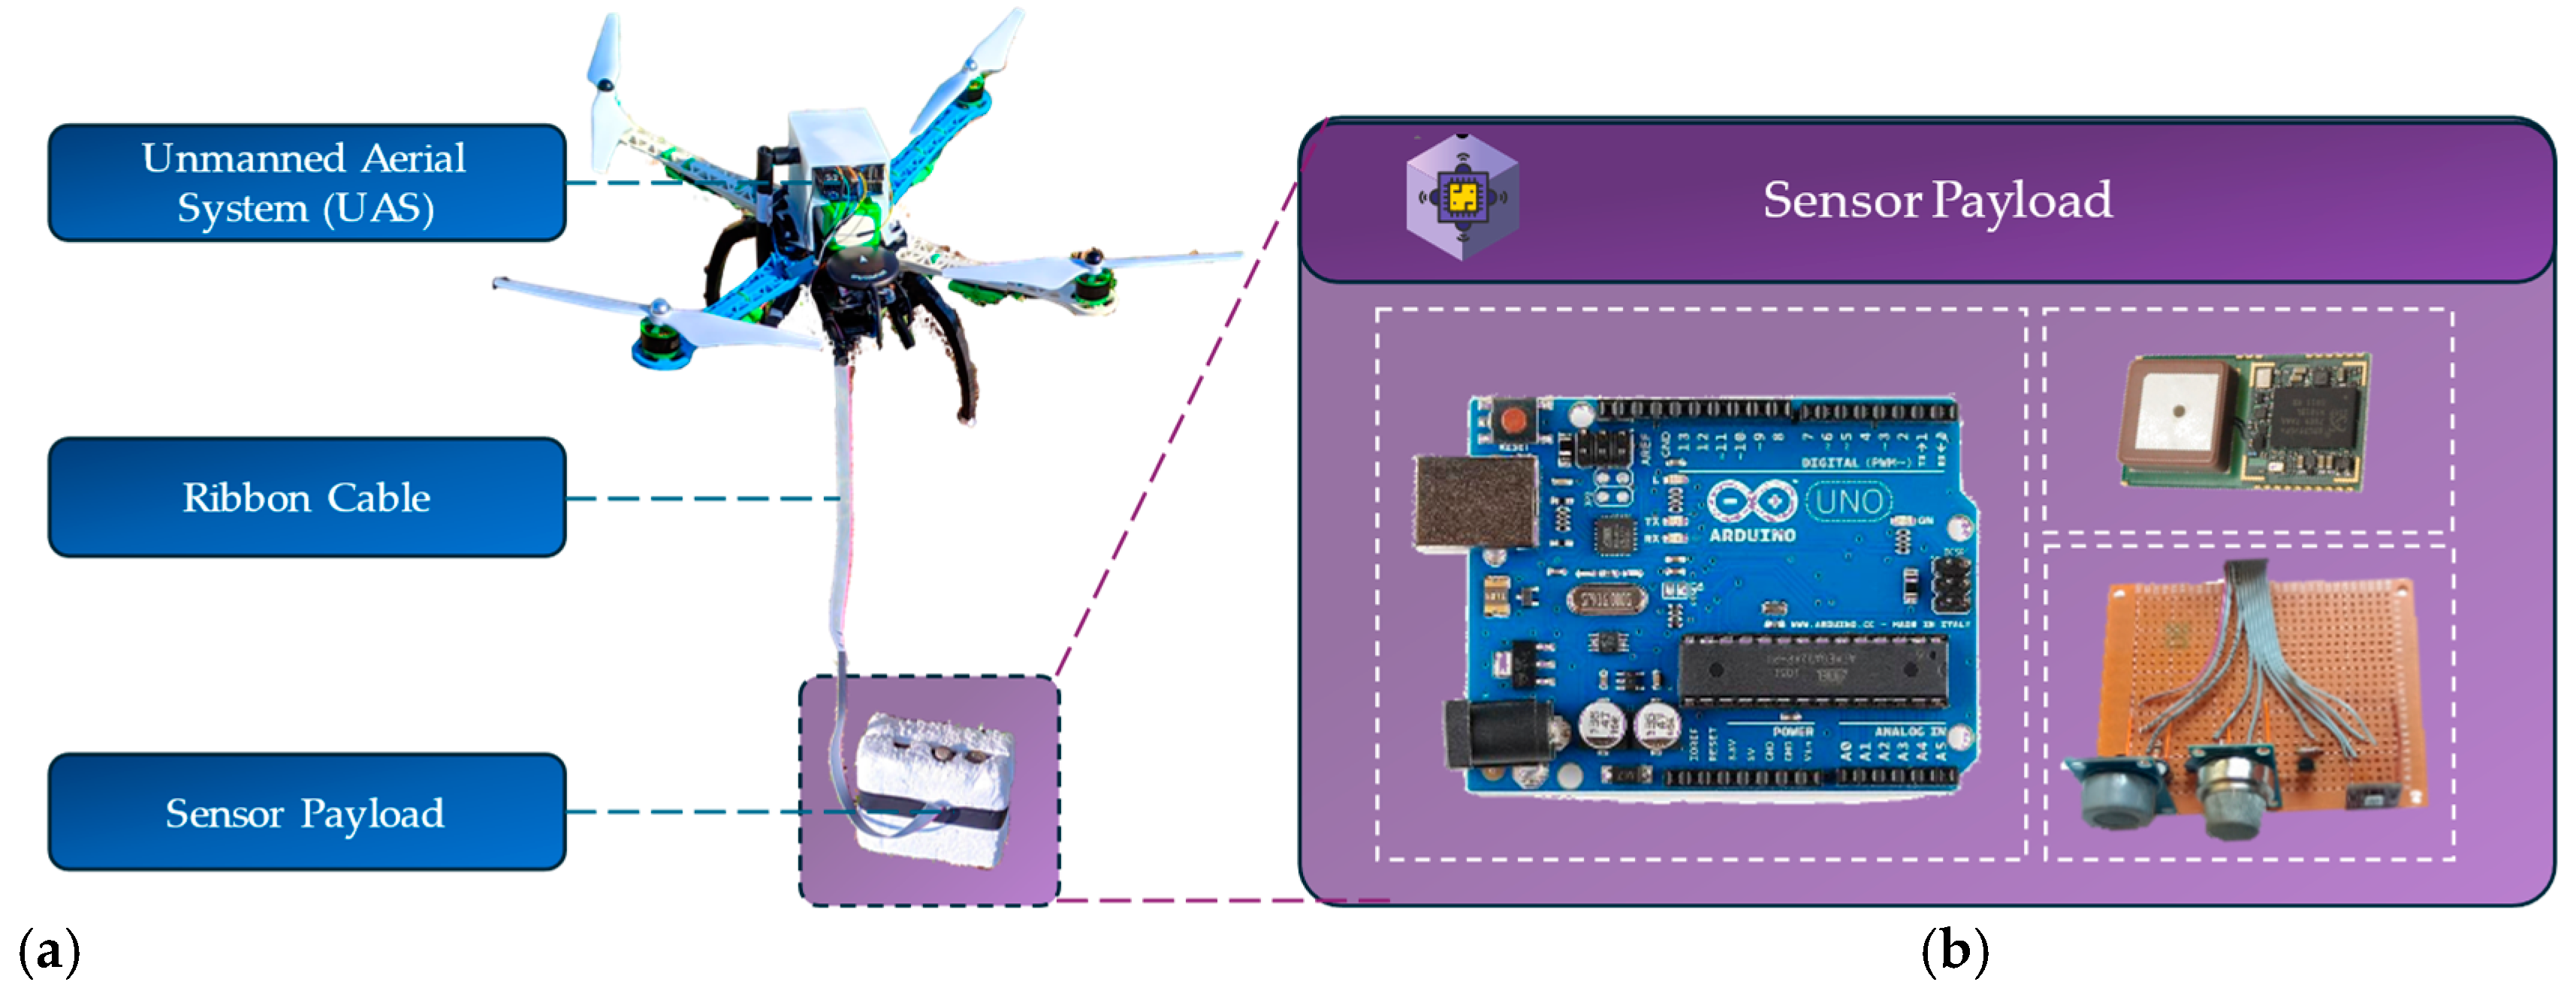
The sensor payload designed for the UAS has the primary objective of accurately measuring the air quality through specialized sensors. This sensor and data processing module is housed in a polystyrene box, which optimizes the weight of the system and provides adequate insulation for the electronic components, thus ensuring protection against impacts and environmental variations during flight missions.
The sensors are arranged independently of the UAS body, suspended by a one-meter-long ribbon cable, as illustrated in
Figure 1a and
Figure 3a. This configuration allows the sensors to be placed at the maximum possible distance from the center of the aircraft, minimizing the influence of air scattering generated by the propellers and ensuring that air sampling is performed without significant disturbance, which is suggested in [
52].
Figure 3b shows the different components of the payload, including the sensors and the data processing system.
The sensor payload includes an Arduino Uno microcontroller (Arduino, Monza, Italy), which acts as the central processing unit, coordinating the collection of data from the different sensors and managing their transmission. In addition, an A1035 GPS module manufactured by Tyco Electronics (Schaffhausen, Switzerland) is integrated into the system, which provides precise location data, thus facilitating the georeferencing of the collected air samples. The sensor technology related to air quality monitoring present in the payload is mainly composed of three sensors: the MQ7 sensor by Tomson Electronics (Kochi, India) for measuring carbon monoxide (CO), the MQ131 sensor by Winsen Sensors (Zhengzhou, China) for detecting ozone (O3), and the MICS6814 sensor by SGX SENSORTECH (Corcelles-Cormondrèche, Switzerland), which is in charge of measuring nitrogen dioxide (NO2).
The sensors were chosen based on tests performed in a previous characterization work [
5]. This payload structure allows the UAS to adapt to various flight conditions and monitoring environments, achieving high-precision data collection for real-time air quality analysis.
Table 1 below presents a summary of the sensorics contained in the payload.
3.2.3. LoRa Signal Transmitter Module (STM) and Signal Receiver Module (SRM)
The signal transmitter module (STM) is a fundamental component of the UAS, responsible for transmitting data to the ground station. This module communicates directly with the signal receiver module (SRM), located on the ground part of the platform.
The SRM, in turn, facilitates the connection with a web application that enables the visualization, management, and analysis of the information collected during aerial missions. This application not only serves as a user interface but also allows for data processing, contributing to a deeper analysis of air quality.
The interconnection between the STM and the SRM is essential to ensure fast and reliable communication, which is crucial for successful operations. To ensure real-time communication with the base station, a multiprotocol radio shield compatible with the microcontroller has been incorporated, accompanied by a LoRa SX1272 module. This configuration allows data to be sent over long distances with reduced power consumption, thus optimizing the system’s autonomy during long flights.
The LoRa SX1272 module employs a spread spectrum modulation technique, making it well suited for data transmission at reduced data rates across extended distances. According to tests conducted by the manufacturer, this module has achieved a range of approximately 22 km of the line of sight (LOS) and 2 km in urban environments with obstacles (NLOS). This makes it a suitable option for UAS data transmission, even in areas with challenging signal conditions.
Table 2 below details the operating modes of the LoRa protocol-based STM and SRM systems, each characterized by its bandwidth (BW), spreading factor (SF), coding rate (CR), and noise level (NL).
In Mode 1, with a bandwidth of 125 kHz and a spreading factor of 12, the maximum transmission range is achieved, albeit at a slow data rate (−134 dBm). Mode 5 uses a bandwidth of 250 kHz and a spreading factor of 10, offering average values and default settings, with a noise floor of −126 dBm. Finally, Mode 10, operating at 500 kHz with a dispersion factor of 7, allows high-speed transmission with minimal range and reduced impact on the battery, achieving a noise level of −114 dBm.
Depending on the distance at which the measurements will be taken, the mode automatically switches between Mode 5 and Mode 1. Mode 10 is discouraged due to potential interference outside and possible interference with the other RF communication system on the UAS.
3.2.4. Radiofrequency (RF) Teleoperation and Telemetry Systems
The teleoperation and telemetry system of the implemented UAS is provided by the SiK Telemetry Radio modules, specifically on the 915 MHz frequency. One of the modules is on board the UAS, while the other is connected to the operator’s laptop computer on the ground. This system is used by the ground control station (GCS) for the teleoperation of the UAS, allowing the transmission of real-time data, such as the position and speed of the drone, which facilitates precise control during missions.
This system is crucial for collecting essential data during UAS operations. The ability to receive real-time information about the drone’s status, such as the altitude, temperature, and battery level, enables the UAS operator to make informed decisions and adjust the flight parameters accordingly. This constant monitoring improves the mission safety and efficiency, as operators can react quickly to any anomalies or unforeseen situations.
3.3. Software for the Proposed Platform
The platform has software components that manage its operation at a logical level. These include the ground control station (GCS) and the web application for real-time data reception, which allow the system to be controlled and monitored from a computer. These key elements and their role in the operation of the platform are detailed below.
3.3.1. Ground Control Station (GCS)
The ground control system (GCS) is a software that functions as a virtual cockpit, facilitating the configuration and operability of the unmanned aerial vehicle (UAS). This system can be used for both the calibration and the configuration of the drone and to provide dynamic control during autonomous flights. In this context, the open-source software Mission Planner version 1.3.78, which is compatible with Windows and MacOS operating systems, is used.
Mission Planner offers a variety of functionalities, including the ability to enter waypoints by clicking on an interactive map using Google Maps data. In addition, it allows you to adjust various flight controller settings, log missions to files for later analysis, and simulate flights to evaluate the effectiveness of mission plans. To ensure optimal and safe UAS performance, it is essential to perform three calibrations before each flight: accelerometer, compass, and manual radio frequency control. This procedure ensures that the drone is properly prepared for efficient and safe operations.
3.3.2. PTECA Web Application
The reception of air quality data through the architecture proposed above requires a web application that facilitates the administration of the collected samples, the organization of the data, and the management and collection of new samples, as well as a centralized system for the analysis of the information. Therefore, a web application called Pollution Tracking and Evaluation for Climate Analysis (PTECA) has been developed.
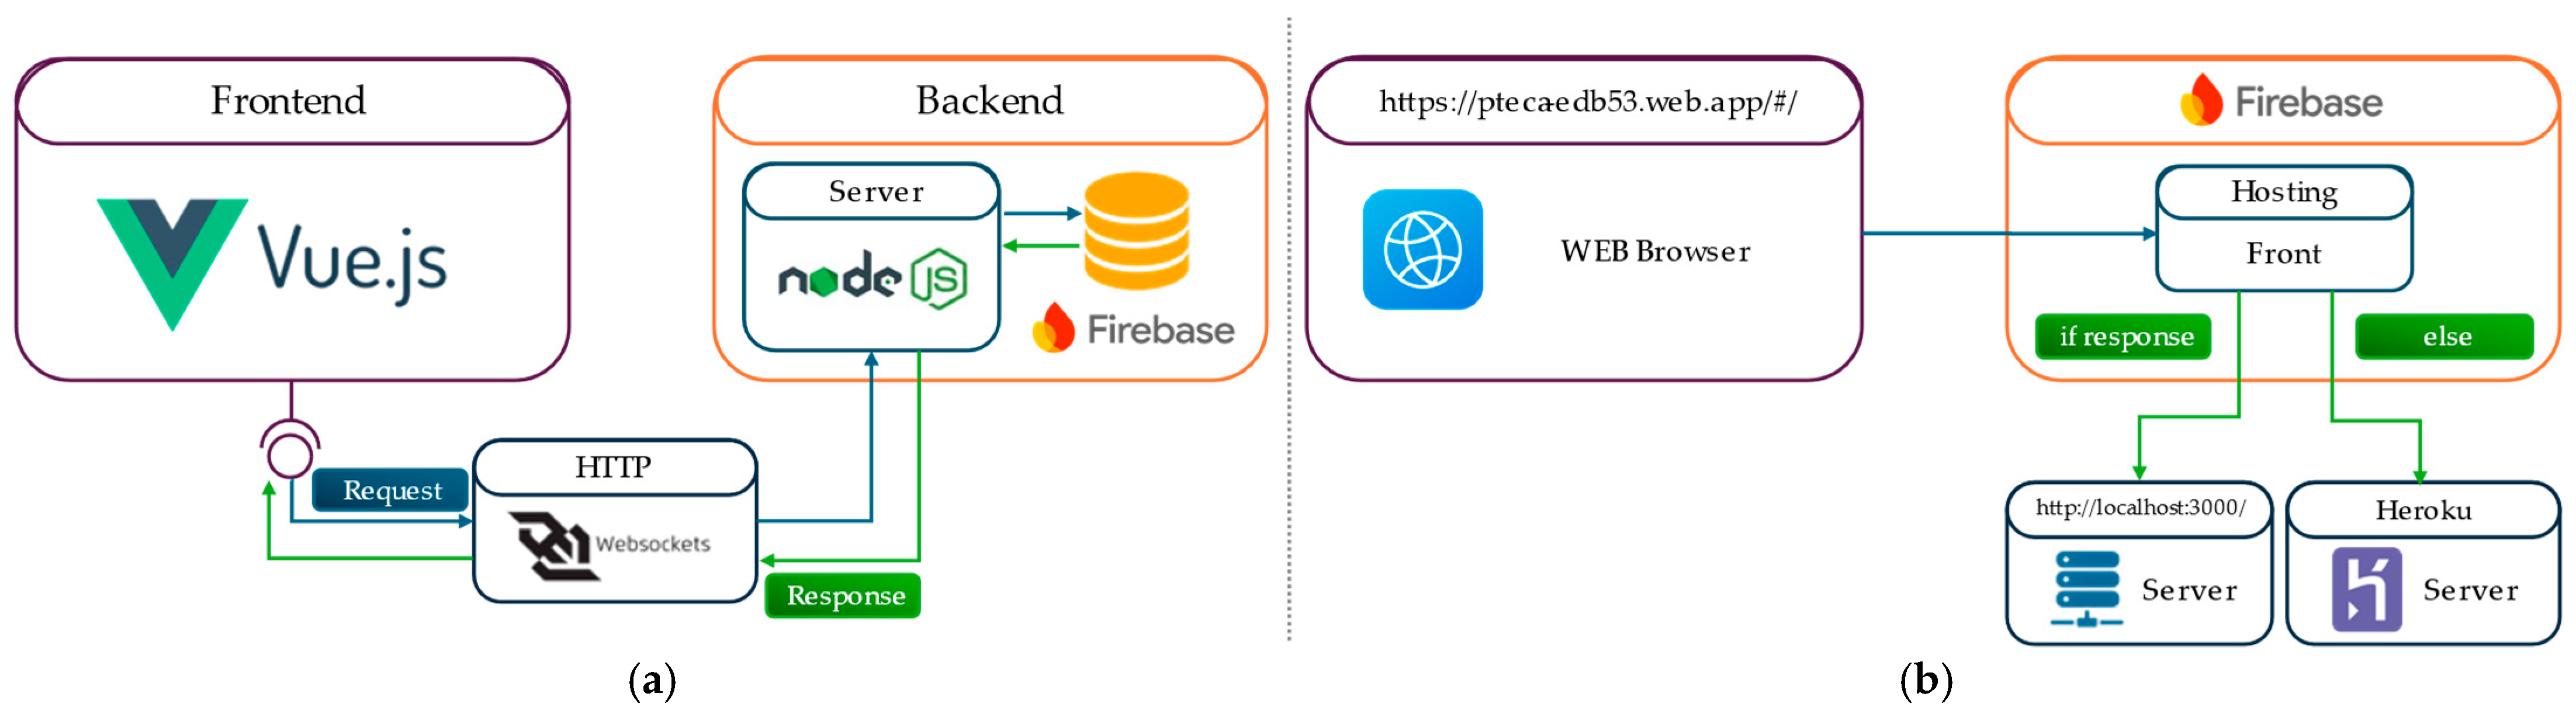
The application designed for air quality sample management is based on five main modules: user authentication, sample management, real-time visualization, file processing, and report generation. The system has two defined roles: the administrator, responsible for managing samples and generating reports, and the end user, who has access to real-time sample visualization. The development view presented in
Figure 4a illustrates the general architecture and the communication process between the different components of the PTECA application, while
Figure 4b shows the application deployment process.
The application architecture is characterized by a communication process that starts with the HTTP protocol and, once the connection is established, transitions to WebSockets. This transition allows for a more fluid and dynamic interaction between the server and the client. The tools selected for development include Vue.js, Node.js, and Firebase. Vue.js is used for the creation of a reactive user interface, while Node.js provides a robust backend environment. Firebase, as a backend-as-a-service (BaaS) platform, provides a NoSQL database that adapts to the real-time response needs of the system.
The database is designed to store samples in a structured format, where each entry includes at least one compound to be analyzed. Each sample gathers data collected over time and can include waypoints obtained from the GPS sensor payload. Sample management allows for creating, editing, deleting, and listing entries, requiring specific information such as the sample title, a brief description, as well as the date and time of sampling, and details about the compound analyzed.
The real-time display module is activated by connecting the sensor payload to the computer via the LoRa protocol. By correctly configuring the connection parameters, the collected data are processed and stored in the database. Whenever changes to the information are received, they are transmitted to all the connected WebSockets, allowing the frontend to automatically update the data display. In situations where the connectivity is limited, the system offers the option of loading samples from text (.txt) files, ensuring continuity in data collection.
The generation of reports is another core functionality, allowing the graphical representation of the analyzed data through line and bar charts, and the export of this information in PDF format for further analysis. For the deployment of the application, Firebase is used for the frontend, providing fast and efficient access, while the backend is deployed in Heroku, ensuring robust and scalable operation. This comprehensive structure enables effective management of air quality samples, facilitating the collection, processing, and visualization of data in real time, adapting to the diverse needs of users.
4. Results
This section presents the results obtained from the performance tests of the aforementioned platform. These tests include the evaluation of the UAS performance, the integration, and the effectiveness of the sensor payload for environmental pollution data collection, as well as the performance of the PTECA web application for processing and visualization of the collected data. The results are analyzed in terms of the accuracy, flight stability, quality of the recorded information, and functionality of the web platform in data interpretation.
The validation of the proposed platform was carried out on the campus of the Universidad Pedagógica y Tecnológica de Colombia (UPTC), an ideal environment for initial testing due to its large open space and low electromagnetic interference. Around the campus, there are major avenues that cross the city from north to south, which makes it likely that air pollution is influenced by vehicle combustion engine emissions. In addition, the proximity to other cities with industrial activity and the geographic characteristics of the region favor the accumulation of particulate matter, which makes this area a strategic place to evaluate the performance of the system under real air pollution conditions.
4.1. UAS Calibration and Configuration
The calibration stage of the UAS is crucial to ensure its optimal performance and accuracy in sampling atmospheric pollutants. At this stage, key adjustments are made that optimize the operation of the UAS in different environmental conditions, improving its stability and navigation, and reducing the errors during data collection. In addition, rigorous calibration increases the operator’s confidence in the accuracy and reliability of each flight. The calibration process consisted of three mandatory steps to ensure the accuracy of the UAS, which are described below.
4.1.1. Accelerometer Calibration
Accelerometer calibration was performed with the assistance of the ground control station (GCS). During this process, the operator moves the UAS in various directions: up, down, forward, backward, right, and left. The GCS provides precise instructions on how to move the UAS manually and on the ground, ensuring that the system correctly senses its orientation in space. This step is critical for the UAS to stabilize properly during flight.
4.1.2. Magnetometer and Gyroscope Calibration
This process requires the UAS to be manually moved on the ground while following a specific pattern. The GCS displays a colored trail that the operator must align with white dots on the screen. Through these movements, the UAS collects position data, allowing for better compensation and therefore more accurate navigation. Compass calibration is essential to avoid deviations during flight, which could result in poor sampling of contaminants.
4.1.3. Calibration of the Radio Frequency (RF) Telemetry and Teleoperation System
Calibrating the radio transmitter is a step that should not be underestimated, as it ensures continuous communication between the operator and the UAS. This calibration is performed by adjusting the functionality, sensitivity, range, and direction of the controls. Regardless of whether the flight is automatic or manual, it is essential to maintain stable communication in order to respond to any eventuality that may arise during the flight.
4.2. Flight Execution
The execution of the flights was performed in a controlled, open environment, where the platform was also assembled and tested following the previously established design parameters, as shown in
Figure 5a. Each flight consisted of continuous sampling tests for approximately 10 min, as specified in the protocol illustrated in
Figure 5b. During this period, the UAS collected air quality data, including the concentration of various air pollutants.
To perform the measurements, the computer running the GCS Mission Planner was connected to the UAV via the RF telemetry and control module. This system not only facilitates control of the UAV but also allows for real-time data collection. The GCS acts as a local server, receiving data from the sensor payload and uploading it to a database for further analysis. During the flights, the operators continuously monitored the flight parameters and the quality of the collected data to ensure that all the flight conditions were optimal. Careful preparation and execution of the flights were essential to ensure that accurate and reliable data were obtained during sampling.
4.3. Sampling Results and Data Visualization in the PTECA Web Application
The first test was carried out to ensure effective data transmission between the different modules of the system and to analyze the performance of the sensors during the collection of air quality samples. During this stage, it was verified that the data collected by the sensors were properly sent to the processing and storage module, without loss of information or interruptions in communication.
The integrity and accuracy of the data collected in real time are crucial to the reliability of any environmental monitoring system. In the case of the proposed system, several methods were implemented to ensure that the data obtained by the sensors were as accurate as possible. First, a rigorous sensor calibration process was carried out, including the calibration of the accelerometers, magnetometers, gyroscopes, and radio frequency systems, to minimize errors in the data collection and improve the stability during flight. This process allows more accurate navigation, avoiding deviations that could affect data quality.
In addition, the LoRa protocol was adopted for data transmission, which helped to reduce the latency and maintain continuous and robust communication between the UAS and the base station, ensuring that data arrived with integrity and without loss. The use of real-time synchronization systems was also essential to avoid temporal discrepancies between measurements, thus improving the consistency of the information obtained. On the other hand, the PTECA web platform incorporated functionalities for data validation prior to processing and visualization, allowing the detection of possible inconsistencies or anomalies in the reported values. These methods not only increase the accuracy of the measurements but also increase the reliability of the system in large-scale monitoring situations and under dynamic conditions, which is essential for generating useful information taken in real time for environmental management decision-making.
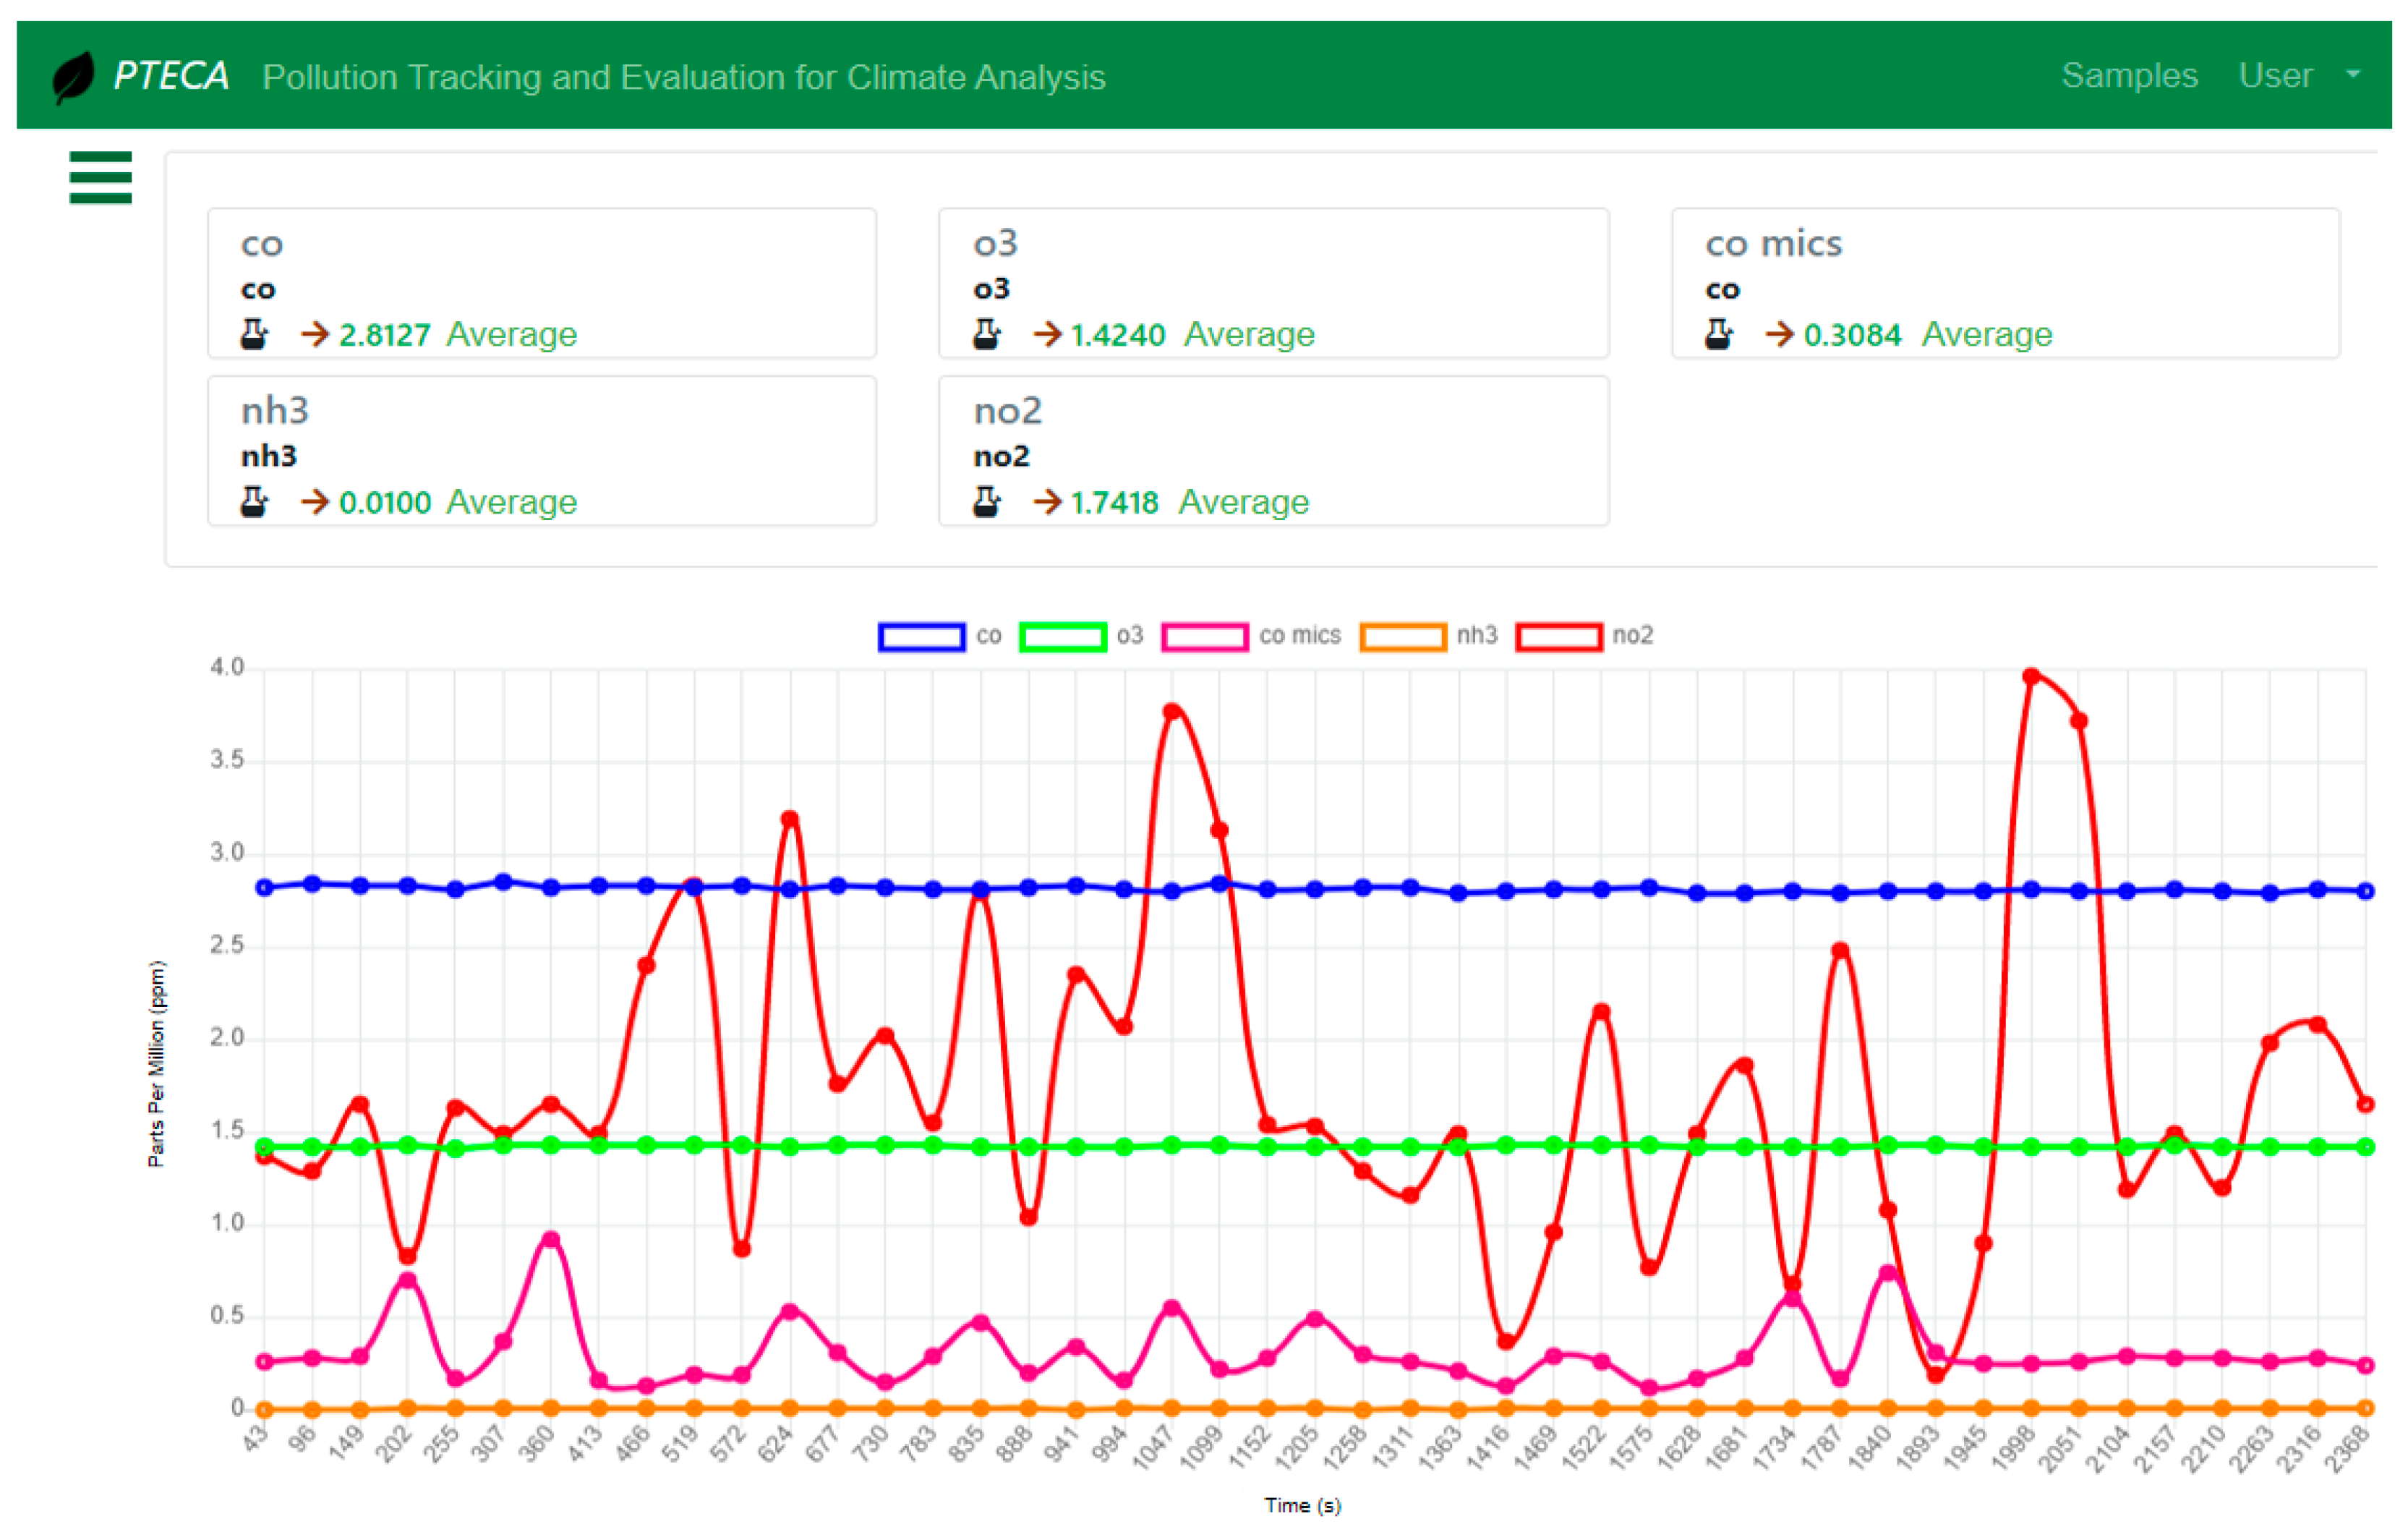
The results of the sample capture were visualized through graphical representations in the PTECA web application, which allowed real-time evaluation of the behavior of each sensor and the accuracy of the data collected, thus ensuring the correct integration and operation of the system under operational conditions, as shown in
Figure 6.
The distribution of the data shows that the MICS6814 sensor has the greatest variability in its measurements, particularly in the nitrogen dioxide (NO2) detection channel. This variability suggests the high sensitivity of the sensor to changes in ambient NO2 concentrations, which could be useful for detecting rapid fluctuations in air quality. However, it may also indicate the need for more precise calibration to improve the measurement stability and reduce potential errors.
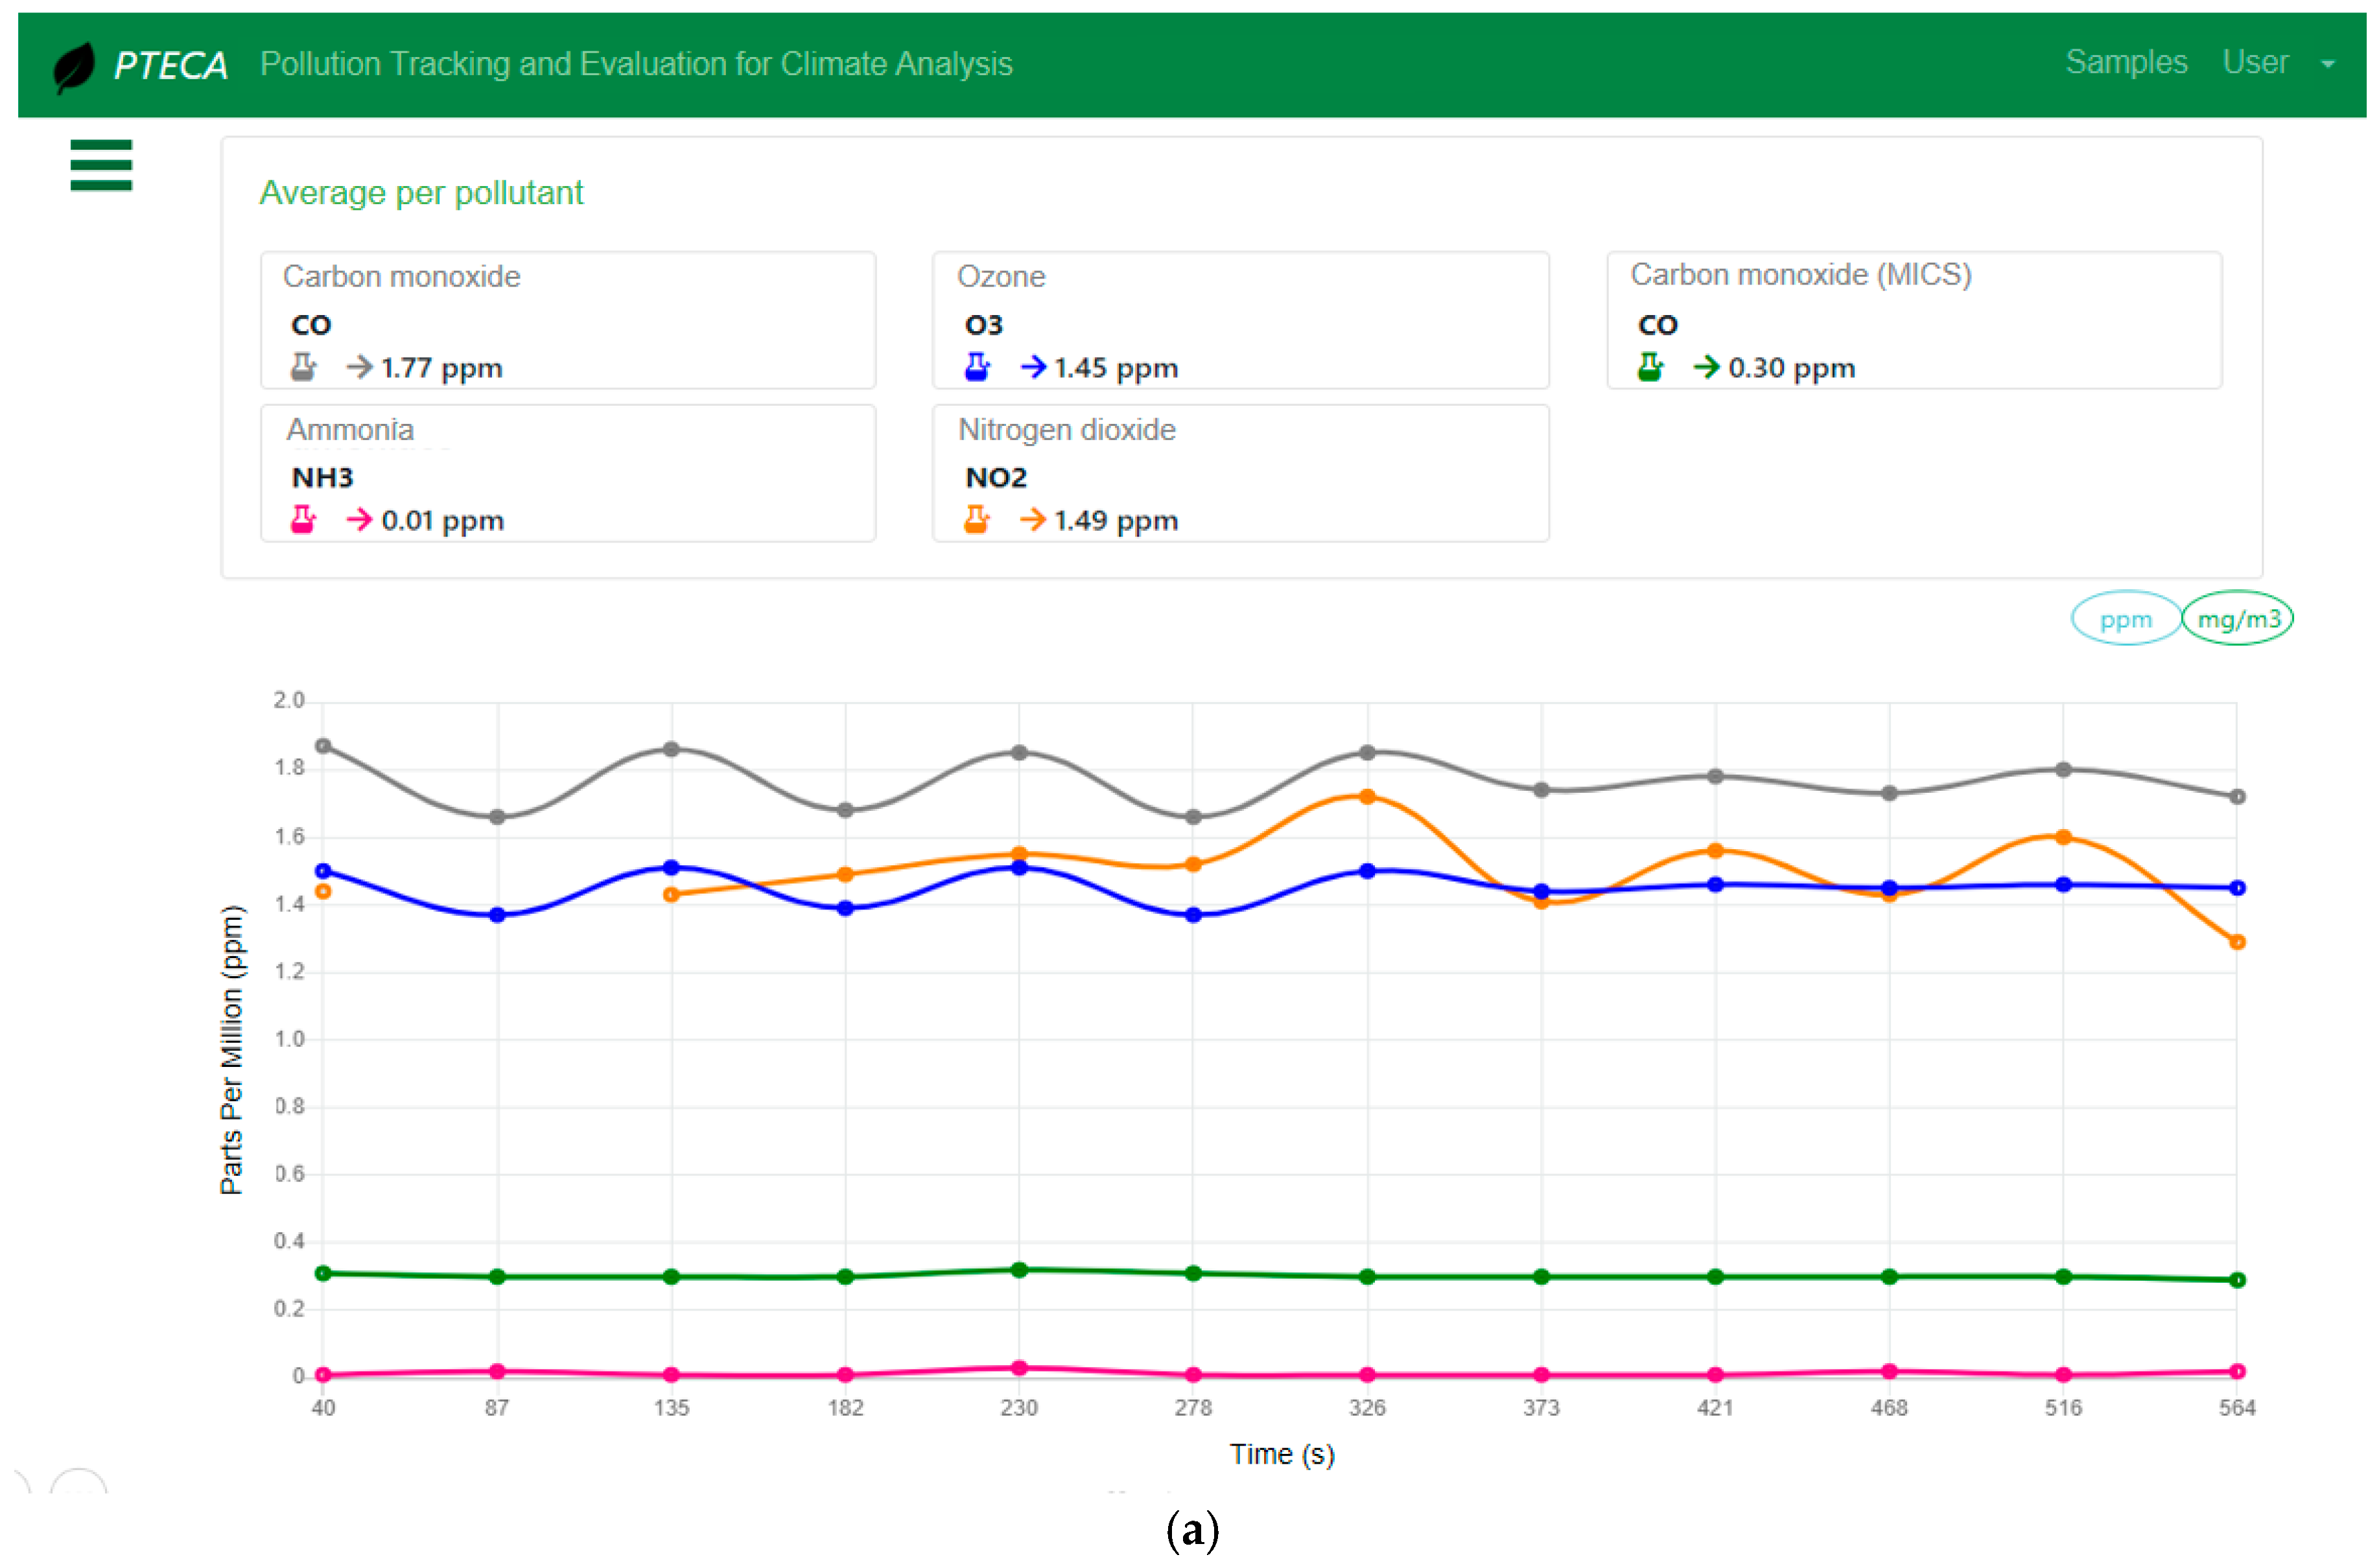
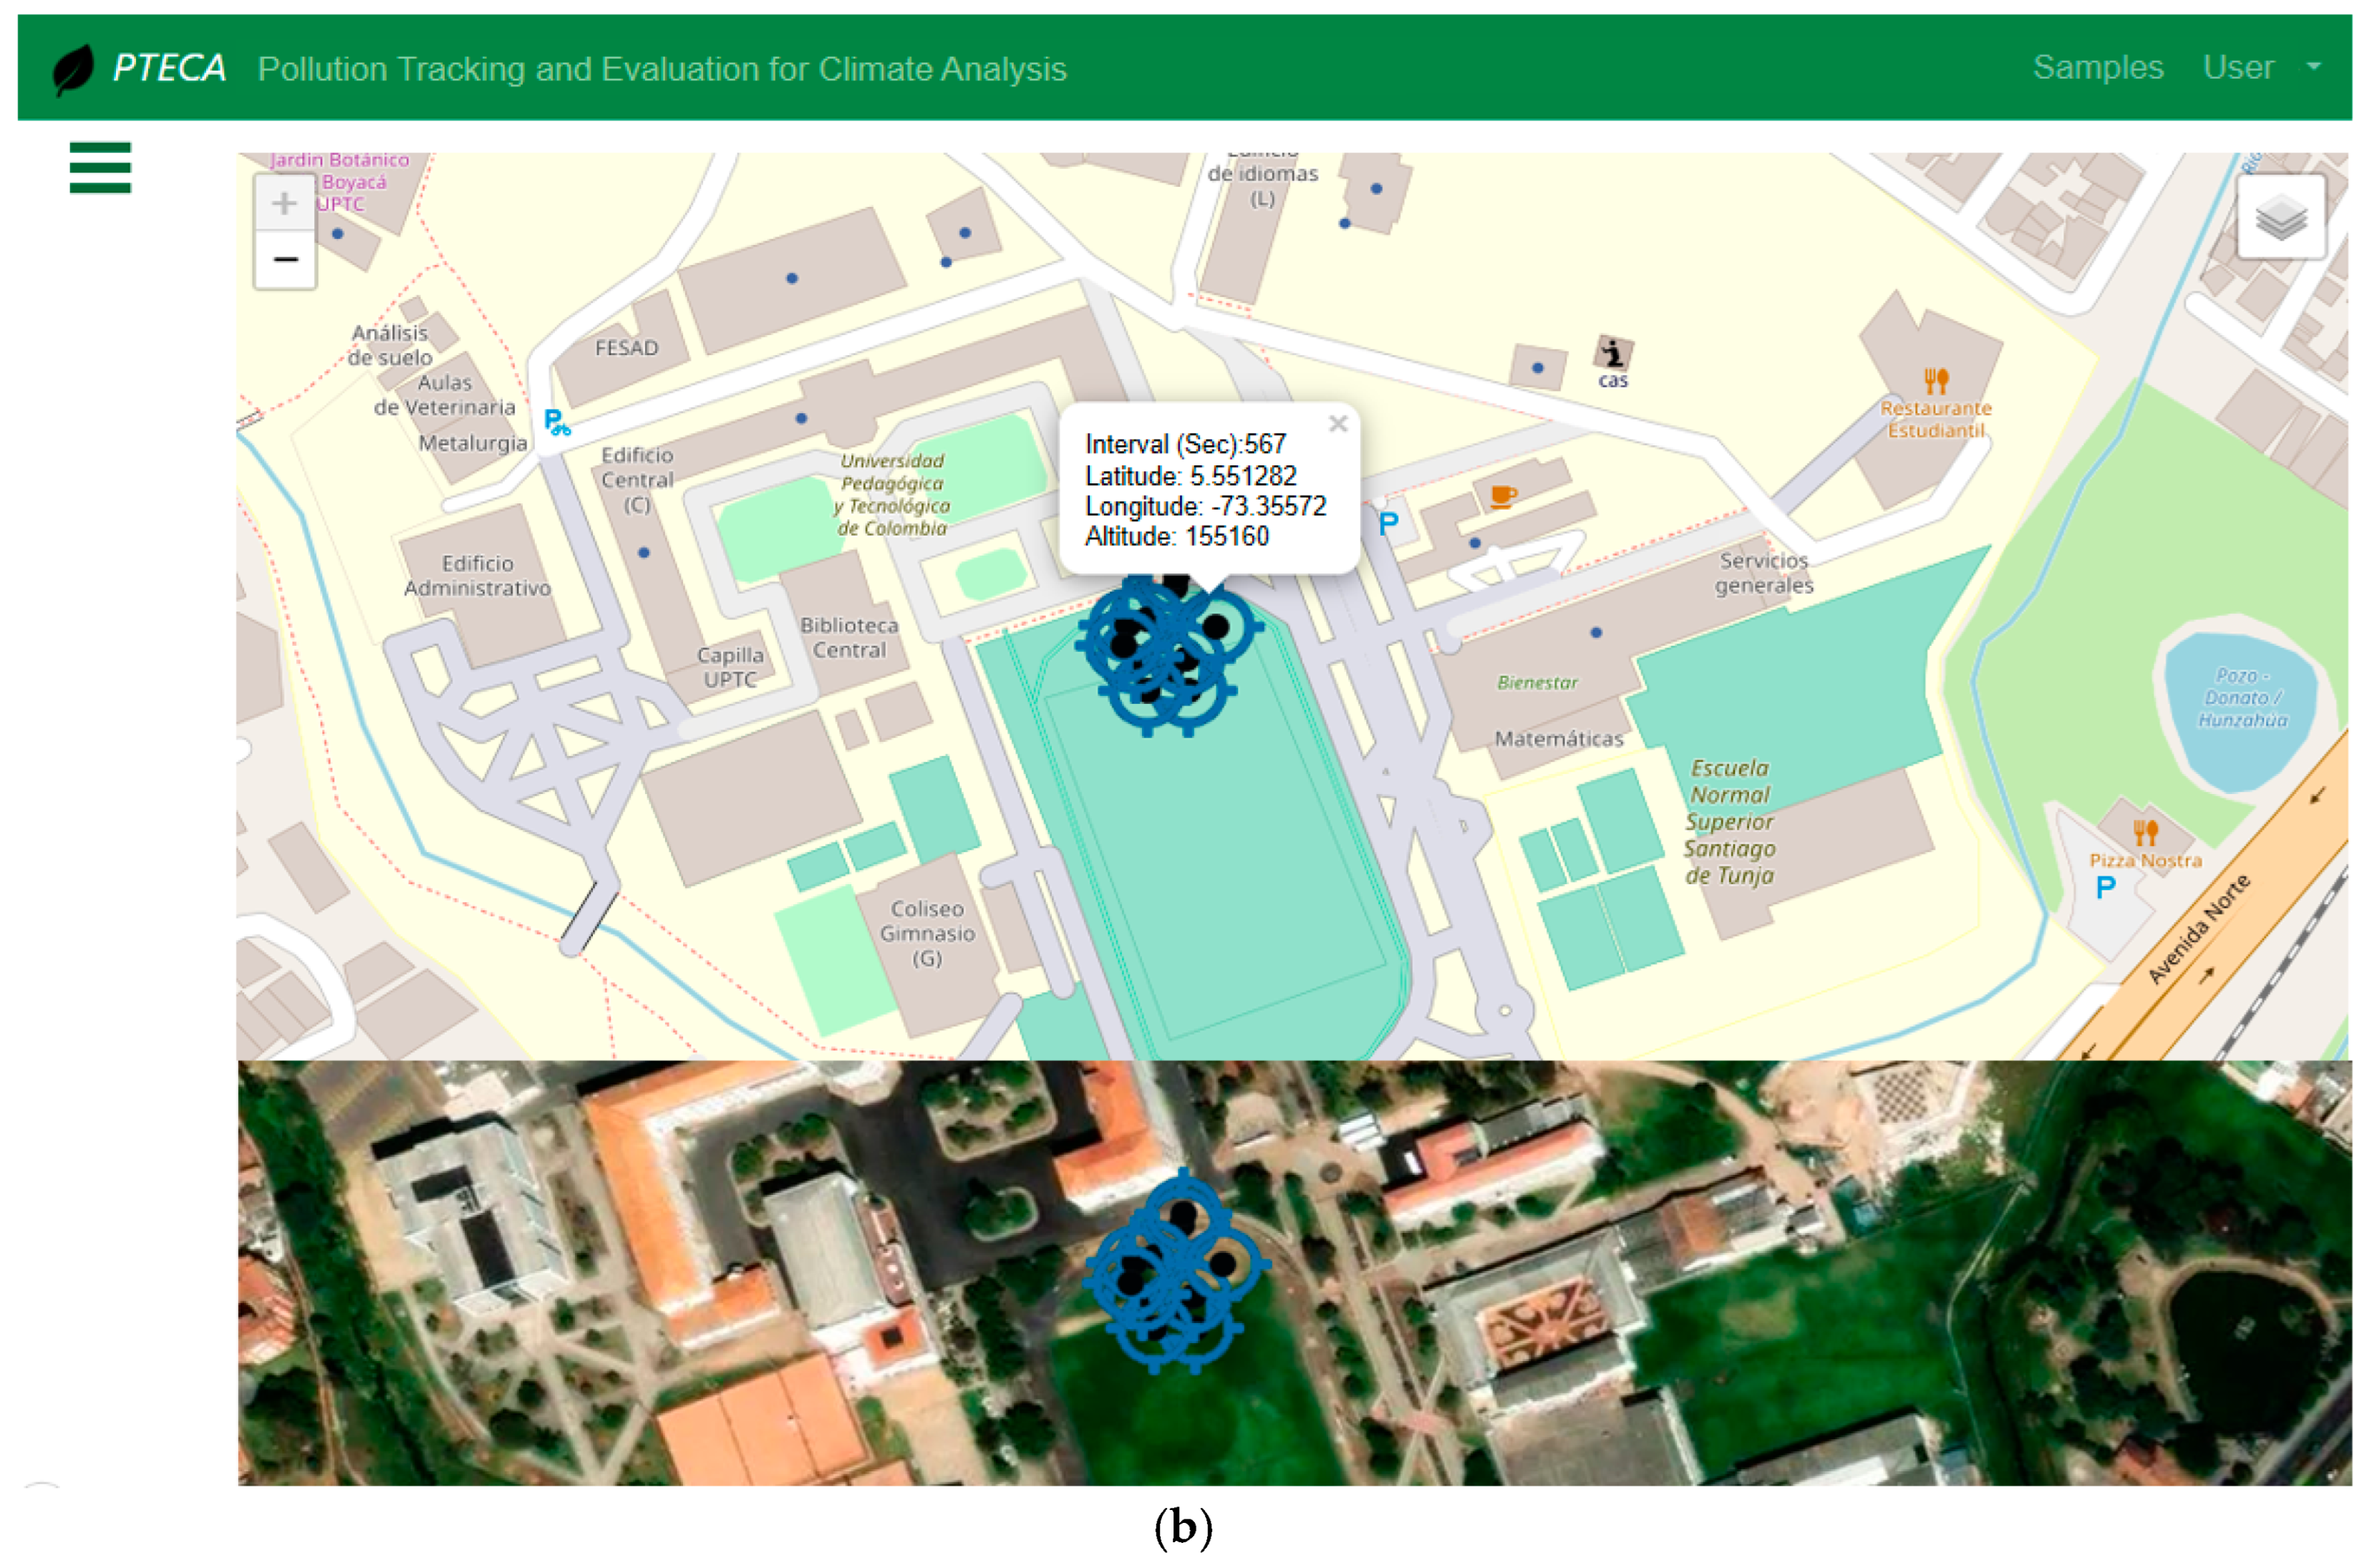
Subsequent testing focused on sample collection at the previously selected site, as mentioned at the beginning of this section. The results of the measurements indicated relatively low levels of pollutants, suggesting good air quality in the sampled area. In
Figure 7a, it can be observed that the measurements exhibit stable behavior, without drastic changes or significant variations, reinforcing the positive evaluation of the air quality in the area. This stability in the measurements also demonstrates the efficiency of the sampling process and the platform’s good performance.
The graphs not only show the pollutant levels but also offer the option to change the measurement scale between parts per million (ppm) and milligrams per cubic meter (mg/m3). This functionality is crucial, as air quality regulations are usually expressed in mg/m3, allowing direct comparisons with established standards.
The waypoints generated by the payload’s GPS indicate the specific points over which the UAV flew. Each waypoint was recorded with precise information, including the time interval at which it was captured, as well as the latitude, longitude, and altitude. This information was plotted on a map within the application, providing a geographic visualization of the UAV’s trajectory during sampling, as shown in
Figure 7b.
To complete the validation of the platform, three open field tests were conducted over an area delimited by geofencing, using a UAS programmed with automatic missions through the GCS system.
In test 1, overflights were conducted without the presence of pollutants, allowing baseline values to be obtained. Test 2 involved the controlled release of carbon monoxide during flights, evaluating the impact of this specific pollutant in an open environment. Finally, test 3 focused on the complete validation of the platform in real conditions, demonstrating its ability to perform effective environmental sampling in the open field. The results are presented in a consolidated form in
Table 3.
The results presented in
Table 3 show a clear differentiation in the contaminant levels between the three open field tests. In test 2, an increase in the carbon monoxide (CO) measurements was observed for both the MQ7 and MICS sensors, validating the response of the sensors to controlled exposure to the pollutant. The ozone (O
3) and ammonia (NH
3) values also showed the expected variations, while nitrogen dioxide (NO
2) maintained relatively stable values. These results confirm the effectiveness of the platform for accurate environmental sampling in real and controlled environments.
Additionally, the minimum and maximum values of the average measurements are also recorded, considering the accuracy and precision characteristics of the sensors. This information is crucial for assessing the reliability of the collected data, as it reflects the sensors’ capacity to consistently produce results within a defined margin of error. The accuracy range, as shown in the table, underscores the sensitivity of each sensor type to environmental factors and their ability to detect changes in pollutant levels with high reliability. This ensures that the platform’s performance aligns with quality standards for environmental monitoring and allows for more informed interpretations of field data.
5. Discussion
The development of a low-cost solution for air quality monitoring based on an unmanned aerial system (UAS), as presented in this paper, offers a promising alternative to traditional monitoring methods. Unlike traditional monitoring stations, which are costly and difficult to deploy, the integration of drone technology and specialized sensors allows for real-time data collection over large and hard-to-access areas. This approach aligns with current trends in environmental monitoring, where the demand for low-cost, high-impact solutions is becoming increasingly critical, especially in contexts with limited resources.
This work has consolidated a robust architecture and an efficient protocol for air quality data collection using an unmanned aerial system (UAS). The platform has been successfully validated in terms of key aspects such as the control, data transfer, and real-time synchronization, and it stands out as a low-cost alternative.
In emergency situations such as natural disasters or sudden environmental pollution events, the response speed and efficiency of monitoring systems are crucial for effective mitigation and public safety. The proposed UAS-based system outperforms traditional stationary monitoring stations in several aspects, particularly in its ability to respond quickly to rapidly changing conditions. This capability allows for immediate aerial surveillance of affected areas, enabling the rapid detection of pollution spikes or hazardous conditions without the need for extensive ground infrastructure.
In contrast, traditional systems, often requiring recalibration or manual intervention to adapt to shifting conditions, may face delays in providing real-time data.
Preliminary results from the system performance tests indicate that the sensors implemented in the UAS are capable of detecting significant variations in pollutant levels, such as carbon monoxide (CO) and nitrogen dioxide (NO
2). These results are consistent with those reported in previous studies demonstrating the effectiveness of emerging technologies in air quality monitoring, as seen in [
3,
25]. However, it is important to note that although low-cost sensors offer accessibility, they may present limitations in terms of accuracy and the need for frequent calibrations to maintain the measurement reliability, as also highlighted in the literature [
21,
23].
The system’s ability to integrate various types of sensors allows it to be customized for measuring a wide range of air pollutants. This versatility is critical, given that pollutant concentrations can vary significantly due to multiple factors, including vehicular traffic and industrial activities. In this sense, the system’s flexibility to adapt to different conditions, as observed in the case of sensor-based IoT systems [
26,
30], reinforces its applicability in diverse scenarios, from urban areas to more remote regions. In addition, the portability of the system enhances its versatility, facilitating its use in different environments beyond those evaluated in this study. This is key, as the ability to perform flexible and adaptive monitoring can provide more relevant and up-to-date data, allowing for a more agile response to emergencies, as suggested in previous research on environmental monitoring [
38,
42].
Another relevant aspect that stands out is the integration of the platform with the PTECA web application, which not only facilitates real-time data visualization but also optimizes the management and analysis of the collected samples. This platform complements the monitoring system by enabling efficient tracking of air quality through an accessible and user-friendly interface, which is in line with the growing need for intelligent real-time monitoring platforms [
34,
39].
In terms of communications, the implementation of the LoRa protocol for data transmission stands out for its low power consumption and its ability to operate in urban environments, which are key to extending the coverage of the monitoring system. As shown in previous studies on wireless sensor networks [
15,
17,
35,
36,
37,
38,
39,
40,
41,
42,
43,
44,
45], the implementation of LoRa has proven to be effective in collecting data reliably and covering larger areas, which offers a significant advantage over other short-range transmission technologies, such as Zigbee or Wi-Fi.
Finally, while the preliminary results are promising, further testing in different environments is needed to more thoroughly evaluate the accuracy and stability of the system under various conditions. Moving toward further standardization of the sensors and optimization of the prediction algorithms, as suggested by recent research on AI-based monitoring systems [
22,
23,
32,
33], will be crucial to improving the reliability and predictive capability of the system, overcoming some of the inherent limitations of low-cost sensors.
6. Conclusions and Future Work
In conclusion, it can be stated that the UAS-based air quality monitoring system presented in this study represents a significant advance in the search for affordable and effective solutions for air quality management. The integration of sensor technologies, wireless communication, and a web application for real-time visualization not only improves the data collection efficiency but also promotes a better understanding of pollution patterns in different contexts.
The success of the preliminary tests suggests that this platform could be an essential component in the development of denser and more effective environmental monitoring networks. As the technology continues to be refined, particularly in terms of the sensor accuracy and calibration, it is expected that this system will contribute significantly to the protection of public health and the formulation of more effective environmental policies.
The use of unmanned aerial systems (UASs) for air quality monitoring has several advantages, among which is their ability to cover large areas efficiently and in real time, especially in places that are difficult to access, such as rural or densely populated urban areas. This technology allows the collection of quality data without the need for expensive fixed monitoring equipment, offering a more economical and flexible solution for assessing pollution levels in time and space. In addition, UASs can operate in variable conditions and adapt quickly to different environments, which improves the adaptability of monitoring systems to environmental changes.
However, there are some disadvantages associated with the use of UASs. One of the main limitations is the battery life, which restricts the drones’ ability to perform extended flights, which can limit the amount of data collected in a single flight. Also, the accuracy of low-cost sensors, which are often used on these platforms, can be affected by factors such as the calibration and weather conditions, which could impact the reliability of the results. Finally, the use of UASs for environmental monitoring is subject to legal and operational regulations, which vary by region, which could make large-scale deployment difficult in some contexts. However, despite these limitations, the advantages of using UASs in air quality monitoring continue to gain relevance, particularly in scenarios where traditional methods are less accessible or feasible.
With a view to future developments, the integration of autonomous flight into unmanned aircraft systems (UASs) is proposed, eliminating the need for human intervention in piloting. This innovation will allow UASs to navigate three-dimensional spaces with enhanced precision, facilitating a more detailed and dynamic assessment of pollutant dispersion in different areas. In addition, it will address the challenge of flight autonomy, which is currently approximately 20 min. To overcome this limitation, the implementation of autonomous recharging systems and the possibility of integrating additional batteries are considered, which would significantly extend the duration of the missions.
Currently, the system requires human operators to manually control the drone during flights, which introduces the possibility of human error and limits the operational autonomy of the system. To further optimize the system’s performance and increase its efficiency, future research could focus on enhancing the automation capabilities. One promising direction for optimization is the implementation of autonomous flight paths, where the UAS can use pre-programmed routes or real-time data to navigate the area without requiring continuous human intervention. Advances in machine learning and artificial intelligence (AI) could allow the UAS to automatically detect and prioritize areas of interest, such as pollution hotspots or regions affected by natural disasters, based on sensor data or environmental cues.
On the software side, the increase in the volume of data collected will allow the application of more advanced analytical functions. Using platforms such as backend-as-a-service (BaaS), it will be possible to perform in-depth analyses of contamination patterns, which will enrich the data interpretation.
Expert validation of these systems will be a crucial step in turning this proof of concept into a robust reference system for air quality measurement, with applications in a variety of environmental and geographical contexts.
In addition, future research should focus on the implementation of machine learning algorithms for the analysis of the collected data, as well as on the expansion of the sensor network, which will provide wider geographical coverage. This strategy will enable a proactive approach to air quality management, facilitating not only the detection of pollutants but also the prediction of critical episodes that may affect the health and well-being of the population. In this way, it is expected to contribute significantly to the creation of healthier and more sustainable environments.


