Abstract
This study adopts the “Risk-Association-Driver” framework to construct a sustainable security evaluation framework from the three dimensions of ecosystem service value, ecological risk, and drivers, with the aim of providing recommendations for regional ecosystem function enhancement and ecological risk prevention and control and promoting regional sustainable development. Google Earth Engine was used to extract Panjin City’s land use change data from 2010 to 2023. Furthermore, this paper combines the Equivalent Factor Approach and the Ecological Risk Model to analyze the dynamic changes of ecosystem service value and ecological risk. The spatial and temporal correlations, spatial clustering patterns, and driving variables of ecological risks and ecosystem service values in the research area were explored using GeoDa tools and Geo-detectors. The investigation shows that (1) The ecological risk index showed a gradual declining trend, with an overall decrease of 8.44%, indicating that the regional ecological security issue had improved. From 2010 to 2023, the total value of ecosystem services in Panjin City continued to rise, increasing from 27.923 billion CNY to 30.488 billion CNY; (2) The value of ecosystem services per unit area and the ecological risk index has strong positive hierarchical correlations and some positive spatial correlations; and (3) Land use types and anthropogenic impact indices are important drivers of spatial variation in ecosystem service values and ecological risks in the study area. The framework and methodology of this paper help to understand ecosystem dynamics and identify potential risks, which is significant for promoting sustainable regional development.
1. Introduction
With rapid urbanization and the expansion of built-up land, various human activities are continuing to change the structure and function of ecosystems. This will lead to a number of problems, such as pollution of resources such as air, water, and soil, and the degradation of ecosystems [1,2,3]. In addition, it reduces ecosystem services value (ESV) and habitat quality, thereby contributing to the spread of non-point source pollution [4,5]. For the sustainable development of society, the issue of ecological security also deserves more of our attention. Effective assessment of the value of ecosystem services is essential for a comprehensive understanding of the security of ecosystems and the identification of factors affecting ecosystem stability, and it also contributes to the consolidation of the sustainability of ecosystems and the secure development of regions. As a typical estuary city within the Liaohekou National Nature Reserve in Liaoning Province, China, Panjin has been continuously exploring and improving its wetland protection and management system. It has established a multi-departmental cooperation mechanism for wetland and biodiversity conservation and is actively working towards the establishment of the Liaohekou National Park. These efforts aim to protect the wetland ecosystems of typical estuaries and to build a harmonious home where humans and nature can coexist [6,7,8]. Ecological risk index (ERI) assessment, regional ecosystem security, and ecological quality have also become hot research topics in recent years [9,10]. Therefore, effective assessment of the value of ecosystem services can provide a scientific basis for the formulation of rational ecological protection policies and the enhancement of ecosystem functions. This is essential for promoting the sustainable development of regional ecology and economy.
The ESV and assessment of ERI are closely associated with ecological security and are key components of ecological assessment, which serves a crucial function in supporting sustainable progress and safeguarding the environment [11]. Assessing the value of ecosystem services makes it possible to measure the importance of ecosystem services to human society and to provide a scientific basis for the formulation of ecological protection and sustainable development strategies [12]. Ecological risk assessment focuses on the various risks that ecosystems may face and anticipates the future development of ecological conditions, through which high-risk areas and key ecologically sensitive areas can be identified [13,14,15]. This study constructs a sustainable security evaluation framework from the three dimensions of ecosystem service value, ecological risk, and drivers, aiming at identifying high-value, high-risk areas and prioritizing the protection of these key areas, which can make the protection work more targeted, avoid the ecological optimization of the areas with impaired ecosystem services, and provide support for sustainable development. At the same time, the driving factors behind them are explored, and risk factors such as land use change and human interference in high-value, high-risk areas are controlled to prevent further ecosystem degradation.
Currently, there is a growing body of research that links ESV with landscape ERI, focusing on two key aspects. On the one hand, it is committed to incorporating ecosystem service value assessment into the landscape ERI assessment methodology to improve the scientific nature of ERI assessment. Cao Qiwen et al. [16] used the degradation of ecosystem services as a loss characterization and constructed a probabilistic characterization index system from multiple dimensions to apply the ESRISK framework for the appraisal of ecological risk in a landscape and made an outlook on the research of geography ecological risk. Brander, LM et al. [17] examined the economic value of ecosystem services provided by 15 terrestrial and marine biomes around the globe, aiming to illustrate their magnitude, trends, and regional differences. On the other hand, research focuses on the connection between ERI in the area and ESV. According to Guo et al. [18], hotspot examination predicated on the Getis-Ord Gi* method showed that the LER evaluation method was improved and coupled with ESV to characterize the landscape vulnerability, and the coupled and coordinated growth of the two revealed different levels of differences. At the same time, the study by Nolander C. et al. [19] highlighted the importance of ESV in quantifying the non-market benefits of forests. This approach offers a more holistic understanding of the true costs and benefits of forest management. The study of the intrinsic mechanisms affecting the interactions between ESV and ERI is crucial, and these insights are essential for promoting the enduring development of regional socio-economic systems and ecosystems, thus ensuring a harmonious balance between human activities and environmental administration [20,21,22].
ESV and ERI are important factors affecting economic and ecological sustainability. Numerous studies on ESV and ERI have been conducted by academics both domestically and internationally [23,24]. Numerous researchers [25,26] analyzed the trend of overall ecological risk change and ecosystem services and proposed ecological risk zoning control. However, traditional ecosystem assessment typically focuses on a single dimension, often overlooking the intrinsic connections between ecosystem services and ecological risks, as well as the underlying driving factors. In contrast, this study constructs a multi-dimensional assessment framework by integrating ESV and ERI, enabling a comprehensive evaluation of the ecosystem. In addition, most of the studies lack the correction of the ESV equivalent factor and the test of the value coefficient in correlation research. Many studies have not explored the drivers affecting the spatial differentiation of ESV and ERI in sufficient depth and comprehensiveness. In view of the previous research results [27,28], this paper is based on the perspective of system theory and adopts the framework of “Risk-Association-Driver”, which provides a multi-level analytical perspective and can provide a more comprehensive understanding of the dynamics of ecosystem services and their influencing factors. The “Risk-Association-Driver” framework identifies potential risk areas, reveals the correlation between ESV and other factors, and identifies the main drivers to help develop a risk warning mechanism and take timely management measures to prevent further degradation of the ecosystem.
The study period of 2010–2023 is chosen to encompass the key stages of Panjin City’s “ecological city” policy implementation, thereby facilitating an assessment of the policy’s effects and impacts. We selected the years 2010, 2015, 2019, and 2023 to generate four-phase data, which can correspond to the implementation stages of China’s strategic ecological civilization construction policies [29]. By analyzing data from this period, changes in ecosystem service functions and the drivers behind them can be identified [30,31]. Land use data forms the bedrock for the accounting of ESV and ERI. The emergence of Google Earth Engine (GEE), with its robust computational capabilities and vast repository of geospatial data, has opened the possibility of extracting land use information with remarkable accuracy and high efficiency [32,33,34]. In view of the above factors, using GEE as a relying platform, this article collects data on the land application of Panjin from 2010 to 2023 and uses the Random Forest Classification (RF) algorithm to analyze and evaluate ERI and ESV accounting in Panjin. Its purpose is to offer insights that will be helpful in improving Panjin City’s environment, as well as contribute to the sustainable use of land resources, urban development, and ecological protection.
2. Materials and Methods
2.1. Overview of the Study Area
Panjin is located at latitude 40°39′–41°27′ N and longitude 121°25′–122°31′ E (Figure 1), with one county and three districts under the jurisdiction of the city, a household population of 1,285,000 and a whole land area of 4062.34 km2. Situated at the heart of the Liaohe Delta, southwest of the Liaoning Province, and at the mouth of Liaohe River, it is the northernmost coastline of China. The city’s geomorphology is characterized by flat terrain, water and no mountains, a temperate monsoon climate, 500–800 mm of precipitation on average, and an average yearly temperature of 10 °C.
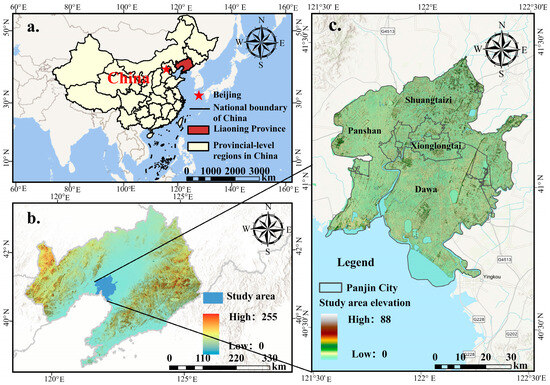
Figure 1.
Location Map of Panjin City (a) China (b) China, Liaoning Province (c) Study area, Panjin.
The population of Panjin City mainly resides in the main urban area in the central part of the city. With the rapid economic development and population growth, some areas have been reclaimed from forests, meadows, and wetlands as farmland in order to increase the area of cultivated land, which has further compressed the ecological space. Additionally, Panjin City prioritizes the petrochemical industry as its pillar industry. To meet the demands of its development, large areas of land in the city’s outskirts and suburbs have been expropriated for the construction of factories, pipelines, and other infrastructure. This has led to potential conflicts between the expansion of industrial land and agricultural and ecological land, resulting in an irrational land use structure that affects the overall planning and sustainable development of the region.
2.2. Data Sources
The remote sensing data used in this study were obtained from the Google Earth Engine platform, and the remote sensing image data for each year were synthesized using January–December averages (Table 1). The DEM data is acquired via the Geospatial Data Cloud and is processed with the help of ArcGIS 10.8 (Esri, Redlands, CA, USA) for splicing, cropping, and puddling. Annual precipitation, temperature, the normalized difference vegetation index (NDVI), slope, population density, GDP per unit area, urbanization rate, and road data were sourced from the Resource and Environment Science Data Center of the Chinese Academy of Sciences (https://www.resdc.cn/Default.aspx (accessed on 1 March 2024)). The Human Impact Index (HAI) was calculated with reference to the method of Yan Enping [35]. The research analysis flowchart is as follows (Figure 2):

Table 1.
Information sheet on data sources.
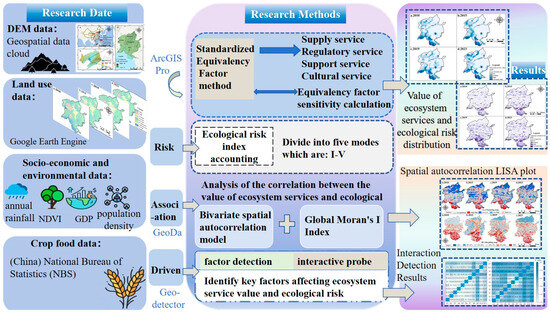
Figure 2.
Flow chart of analysis.
2.3. Ecosystem Service Assessment Methods
This work uses the grid as a fundamental research unit to more effectively achieve the spatial representation of ESV and ERI assessment outcomes. When the size of the landscape samples is from two to five times larger than the zone of the research region’s landscape patches [36], the relevant information in the grid cell can be effectively characterized [37]. The paper concludes that 1 km is the optimal scale for grid selection in this study area, so it adopts the equally spaced grid method to grid resampling of the landscape pattern type of Panjin City, divides it into the cell grid of 1 km × 1 km, and ultimately forms 4105 evaluation plots and assigns the values to the evaluation plots. Assigned to the center point of the evaluation plot, spatial interpolation was performed to analyze the distribution characteristics of ESV and ERI spatial patterns.
2.3.1. Random Forest Classification
Random Forest (RF) is a unified instruction technique that builds several decision trees to carry out classification or regression [38]. A supervised learning algorithm based on multiple decision trees relying on independently sampled random vector values and combining the simplicity of decision trees and the powerful performance of integrated learning, with good generalization and overfitting resistance, was proposed by Breiman [39] in 2001, combining decision trees, stochastic subspace theory, and the Bagging method. Using the bootstrap method to extract multiple samples to construct multiple decision trees [40,41], through multiple decision trees on the study area, samples for training ultimately rely on the training model to analyze the sample category prediction through the vote to produce the following result equation [42]:
In the equation, C(x) denotes the random forest model; bi denotes the i-th decision tree; aj is the category labeling.
Given the state of the research region and the applicable classification of land usage standards as of right now (GB/T21010-2017 [43]) [44], paired with Panjin City’s unique natural environment and land use features, the research was split into nine landscape types, including arable land, forest land, grassland, waters, mudflat wetland, reed wetland, aquaculture ponds, construction land, and unutilized land. Google Earth Pro 7.3.6 software was used to visually interpret the feature types of Panjin City from 2010 to 2023, and the study area’s sample points had to adhere to the uniform distribution principle [45,46]. The RF algorithm was used to categorize land use according to a ratio of 7:3 for training sample points and validation sample points [47]. The overall accuracy of the classification in Panjin City in each year was higher than 80% and the kappa coefficient was higher than 0.8. The experimental results showed that the classification results were good and the land classification data could satisfy the needs of subsequent research.
2.3.2. Calculation of Standard Equivalents
Costanza [48] suggests that fully evaluating ESV is related to human well-being and its close, and Millennium Ecosystem Assessment [49] in the classification of common ecosystem services, including the four categories of supply, regulatory, support, and cultural. Supply services refer to the various products provided by ecosystems for human beings, such as food and fresh water. These products are the material basis for human survival and development and directly meet the needs of human production and life. Regulatory service are the functions of ecosystems to regulate climate, conduct water conservation, purify air and water, and others. Support services are the basis for the normal operation of the ecosystem and for the continuous supply of other ecosystem services. Finally, cultural services are a series of cultural, spiritual, and aesthetic values that ecosystems provide for humans [50]. Xie Gao Di et al. sought opinions from Chinese ecological experts through a questionnaire survey and expert consultation to develop and revise the value equivalence scale and obtain the ESV assessment system in line with the characteristics of China. In this paper, derived from Xie Gao Di et al.’s ecosystem service value estimation technique [51,52], the new ecosystem service value standards were computed to account for the ESV of the research region. For a 1 hectare of farmland with a national average yield, one-seventh of the yearly net profit from food production is equivalent to one criterion section of the ecosystem service value equivalent element. Considering the real circumstances in the research zone, rice, wheat, corn, and soybean were selected as major food crops in the study zone, and the sown area, output, and cost of the primary food crops in the study zone in each year were obtained by reviewing the Panjin City Numerical Yearbook and the National Summary of Charges and Gains of Agricultural Merchandise between 2010 and 2023. The formula for calculating the standardized equivalent within the study area for each year is shown below [53]:
in the equation, E is the equivalence element of one standard section (CNY·hm−2); S is the entire surface sown with food crops (hm2); i is the primary species of food crop in research region; Si is the i-th food crop’s area (hectare, hm2); pi is the converted ordinary price i of the food crop. (CNY·kg−1); qi is the current year’s crop yield from the i-th agricultural crop (kg/hm2).
Because of the differences in price levels in different years in the study area, the price level of 2016 was used as the baseline, and the Consumer Price Index (CPI) was applied to correct the value of ecosystem services for the standardized equivalent factor in different years [54]. The formula is as follows [55]:
in the equation, Ki is the adjustment factor for year i; CPIb is the Consumer Price Index for the base year; CPIi is the Consumer Price Index for year i; Va is the adjusted standardized value equivalent factor for year i; Vi is the unadjusted standardized value equivalent factor for year i.
The average value of the standardized value equivalent factor in Panjin City from 2010 to 2023 was 1735.26 CNY/hm2. Based on the authentic circumstances in Panjin City, the research findings of Xie Gao Di et al. [56] were taken into consideration when adjusting the service value coefficients for each ecosystem. Land under cultivation was determined by taking the average value of paddy fields and dry land as coefficients. Broad-leaved forests matched forest land to grassland in accordance with the following ratio: meadow 3:3:4; water corresponded to the water system; wetland equaled the wetland; unutilized land was calculated according to the ratio of bare land and meadow, 1:3, and, in Panjin City, the ESV per unit area of the Panjin ecosystem is shown in Table 2.
Table 2.
ESV per unit area of Panjin ecosystem, 2010–2023 (108 CNY/hm2).
2.3.3. Ecosystem Services Value Accounting Models
The value per unit area that has been accounted for (Table 2) is utilized to calculate the value for the entire region, improving the accuracy of the ESV. Differences in the degree of plant luxuriance on vegetated site types such as farmland, woodland, and grassland can result in the same site type providing significantly different ESV levels. Therefore, referring to the revision method of Liu Zhitao et al. [57], employing the normalized vegetation index (NDVI) to represent the flora condition in the zone and utilizing the NDVI once again to update the ESV of the study component cell, we finally determined the Panjin ESV of Panjin City. The following is the formula:
in the equation, Nik denotes the NDVI revision factor for land use species class i in the k-th estimate unit. NDVIik is the NDVI value of the i-th land use type in the kth cell. is the mean value of land use type i; ESVi is the ecosystem service value of land use sort i (CNY); Bik is the region of land use type i in evaluation unit k (hm2); VCi is the modified ecosystem service value coefficient per area of land used for type i; ESV stands for ecosystem services’ total value (CNY).
Combined with the authentic condition kind in the examination field, by calculating the ESV per each unit section region of the appraisal plot and assigning the value to the appraisal plot’s central point, based on the ArcGIS Pro 3.1.6 platform through the Kriging interpolation method, the ESV in the study unit was classified by geometric intervals and divided into extremely low [0, 7300), low [7300, 12,000), medium [12,000, 18,000), high [18,000, 45,000), and extremely high [45,000, +∞) (ten thousand CNY), a total of five levels.
2.3.4. Sensitivity Calculations of Ecosystem Service Value Equivalent Coefficients
To validate the accuracy of the modified ESV coefficients of diverse land use species in Panjin City and reduce the uncertainty of the research results, referring to the related study [58], the sensitivity index (CS) was introduced to contemplate the dependence of ESV on the ESV coefficients, and whether the ESV was sensitive to the change of the equivalent coefficients was measured by adjusting the coefficients up and down by 50%. The formula is as follows [59]:
In the equation, CS is the ecological service sensitivity index value; ESVj and ESVi are the total values both prior to and following the modification of the environmental value ratio, respectively; VCi, and VCj denote the ecological value coefficients before and after alterations, respectively; k is a definite sort of land use; CS is the variation in ESV brought about by a 1% shift in VC. If CS > 1, the results are less credible if they indicate that the ESV is flexible with respect to VC, i.e., a 1% change in the independent variable will cause a greater than 1% change in the response variable. The results are plausible if CS < 1, demonstrating the inelasticity of the ESV with regard to VC.
The sensitivity index (CS) values of the coefficients were calculated after accounting for the important role of ecosystem services for every kind of natural resource usage, and the CS values for each category were much less than 1 for different time periods. The complete ESV in the study region exhibited limited resilience with respect to changes in the equivalent coefficient type of the worth of anthropogenic ecosystem services (VC). Therefore, the equivalent factors adopted in this study have a certain degree of reliability.
2.4. Ecological Risk Index Accounting
The level of ERI in the region depends on the spatial combination of diverse classes of land and their proportions in the study zone. On the subject of the research results of predecessors [60,61], the ERI of the landscape was reconstructed considering area proportions of different diverse land classifications utilization and proportion of area of each one land utilization in the grid unit were accounted for, as were the corresponding risk weight coefficients, which provided the following quantitative description of the assessment risk to the environment in the computation of the following equation [62]:
in the equation: ERIk is the ecosystem risk indicator for the landscape in the k-th research unit, and Bki is the entire region of the i-category landscape within the research component; A represents the grid cell’s whole area, and Pi is the classification i landscape loss level index; Ei is the interference index; Fi is the fragility index; Ci is the fragmentation index; Ni is the separation index; Di is the dominance index indicator; a, b, and c are calculated landscape disturbance indices; The indicator weights of Ei, concerning the previous research [63],were received as the numbers 0.5, 0.3, and 0.2, in that order. Landscape vulnerability refers to the degree of resistance of landscape types to external disturbances, ranked according to the turnout attitude of each type. To determine the vulnerability ranking of landscape types in the study area, this study will rank Panjin City landscape types in order of vulnerability from high to low as follows: unutilized land > forestland > waters > breeding ponds > wetlands > grasslands > cropland > constructed land and then derive the vulnerability index for any kind of landscape, Fi, through the process of normalization.
This essay makes use of Kriging spatial interpolation to interpolate the research zone’s grid to determine the dispersion of ecological risk, and in accordance with the equal interval classification method (equal interval), the ecological risk of Panjin City in the period of 2010–2023 is divided into five modes: extremely low [0.023, 0.134), low [0.134, 0.184), medium [0.184, 0.244), high [0.244, 0.251), extremely high [0.251, +∞) five levels. 0.251), and extremely high [0.251, +∞) in five classes.
2.5. Spatial Autocorrelation Model in Bivariate Setting
The level of agglomeration could be reflected in the geographic autocorrelation model, randomness, and other correlations of a certain factor in space; it can be separated into two distinct groups: local spatial layout self-correlation and global spatial layout autocorrelation [64]. The Geoda tool is helpful in identifying spatial clusters, trends, and correlations, and it serves as an important method for researching spatial relationships in geographical data [65]. In this paper, a bivariate spatial analysis model was adopted by GeoDa software (v1.20), and Moran’s I index was employed to illustrate the way various land use groups are spatially correlated. Moran’s I < 0 reveals that there is a lower degree of geographical connection, Moran’s I = 0 denotes an uncorrelated degree of relationship between spaces, and the degree that is a positive correlation between spatial variables is indicated by Moran’s I > 0, which is computed using the subsequent math equation that follows [66,67]:
In the equation, Imr is the bivariate global autocorrelation coefficient of the ecosystem service value per unit area m and the ecological risk index r; yi,m and yi,r are the ith assessments unit’s ERI and service value for each area of unit; and are the variances.
To provide a thorough depiction of geographical association among the elements of the research region, local spatial characteristic function investigation was carried out, utilizing LISA to express the local clustering and discrete consequences. Considering the link between distribution and space, it was divided into five agglomeration-type zones, namely, high and high agglomeration (H-H), high and low agglomeration (H-L), low and high agglomeration (L-H), low and low agglomeration (L-L), and non-significant (NS).
2.6. Driver Analysis Based on Geo-Detectors
Geo-detector is a method applied to examine spatial layout associations between volatiles, and the four detectors are a factor detector, an interaction detector, a risk zone detector, and an ecological detector. The method is extensively leveraged for driver analysis and factor investigation [68].In this study, our main focus was to investigate the drivers affecting ESV and ERI using factor probes and interaction probes.
- (1)
- Factor detection
The consequence of a solitary driver X (the response metric) on ESV and ERI is assessed by q-value using the following formula [69]:
in the equation, q signifies the explanatory strength of the driver on the spatial heterogeneity of elements; L is the number of classifications of the impacting factors; and are the intra-stratum and total variance of the elements, respectively; N and h correspond to the number of strata and samples collected in the study area, respectively.
All the drivers influencing the spatial divergence of the ERI and ESV in the study zone had p-values less than 0.05 and exceeded the significance threshold.
- (2)
- Interaction detectors
The interaction detection mechanism aids in identifying the effects of two-way relationships between different factors on ESV. By examining the q-value of a standalone factor with the adjusted q-value of its interaction, the nature of the interaction between these factors could be determined.
3. Results
3.1. Variations in Panjin City’s Land Use Categories
The variations in Panjin’s use of land of various kinds between 2010 and 2023 are displayed in the figure (Figure 3), and the majority of Panjin’s farmland is used for crops. By 2023, 37.73% of the entirety of the city’s expanse was comprised of agricultural land, followed by urban, industrial, mining, and residential land use and reed wetlands, which accounted for 14.56% and 15.56%, respectively; every form of land use in Panjin City had changes in area over this study period, with the area of cultivated land decreasing by 2482 hm2 as of year 2023; among them, the urban industrial, mining, and residential land with the greatest changes expanded rapidly from 2010 to 2019, with an increase of 7080 hm2, and then indicated a significant downward trend in land area from 2019 to 2023, with a decrease of 10,350 hm2. The water area decreased by 1243 hm2; reed wetlands and mudflat wetlands demonstrated a declining propensity from 2010 to 2019 and a rising trend from 2019 to 2023.
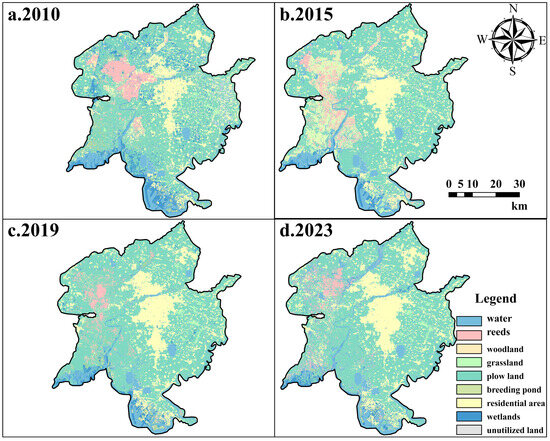
Figure 3.
Land use change map of Panjin City (a) 2010; (b) 2015; (c) 2019; (d) 2023.
Forest land and grassland increased by 3220 hm2 and 3587 hm2 respectively, while breeding ponds and unutilized land increased slightly. Due to the influence of climate change and human activities, each land use type in Panjin City changed significantly from 2010 to 2023. Overall, the broadening in the space that can be used for agriculture, aquaculture ponds, and urban, industrial, mining, and residential land reflects the frequency and intensity of human activities and is showing an upward trend.
3.2. Spatial and Temporal Characteristics of Ecosystem Service Values
From 2010 to 2023, the annual total ESV in Panjin City showed an overall ascending trend from CNY 27.923 billion to CNY 30.488 billion, a rise of CNY 2.565 billion, and the growth rate of the ESV accelerated yearly, with an increase of about 8.2% from 2010 to 2023 (Figure 4a). The period of most dramatic change was 2019–2023, with a yearly decline of CNY 625-million at median, reflecting the intensification of conflicts between biodiversity conservation and economic growth. During economic development, there is a need to find a more effective balance between economic modernization and environmental conservation; from the perspective of land use structure in the study area, the proportion of the value of various types of ecosystem services is as follows: water > wetland > forestland > cultivated land > grassland > unutilized land. The main suppliers of the ESV of varieties of utilization of land in the study region include watersheds, wetlands, and forests, with the total percentage of the three accounting for more than 92.12%. This suggests that ecosystem services in the region are highly dependent on these three land use types. This highly concentrated structure may expose ecosystems to greater risks; the ESV in the study zone has generally increased, reflecting the efforts and effectiveness of ecological safeguarding and rejuvenation in recent years. The ESV of wetland and unutilized land continued to decrease, with annual average charges of change of −0.90% and −3.07%. The reduction of wetlands may be related to factors such as wetland degradation, pollution, over-exploitation, etc., while the reduction of the value of unused land services is associated with the reduction of the area or quality of unoccupied land on account of land development, fast-paced urbanization, and so on. Meanwhile, the ESV of forest land, grassland, and water continued to increase, with annual typical adjustments to percentages of 0.61%, 0.98%, and 0.1%, respectively, and on the whole, the ESV of the land use types had a gradually diminishing rate of increase or decrease, and the growth tended to flatten out.
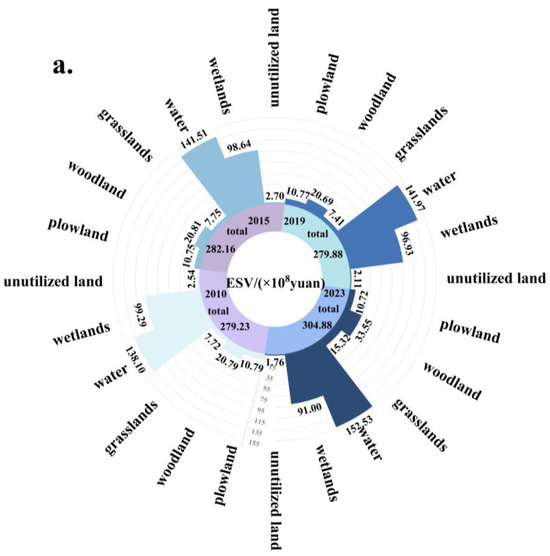
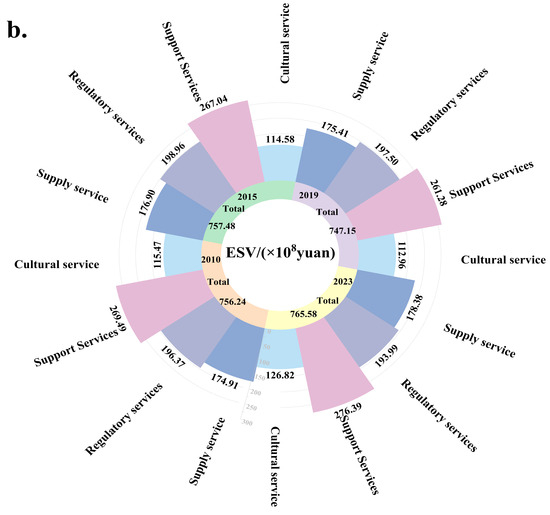
Figure 4.
Ecosystem service value of land use types/each service in Panjin (a) ESV of each land use type in Panjin City, 2010–2023; (b) ESV of services in Panjin, 2010–2023.
In terms of the ecosystem services in the study area (Figure 4b), the value of each ecosystem service type generally increased from 2010 to 2023, with the ratio of supporting services > regulating services > providing services > cultural services in descending order, and the frequency at which each service changed was 2.56%, −1.21%, 1.98%, and 1.17%. Supporting services had the highest share among the services, and the growth rate was 2.56%, signifying that the study zone is performing better in maintaining ecological processes and biodiversity. There was a negative growth in regulating services, which may indicate a weakening of functions in climate regulation and water purification and may be pertinent to factors such as land use changes and environmental pollution. The opposite growth trends of supporting and regulating services indicate that there is an imbalance between the different functions of the ecosystem in the study zone.
High-value areas showed a concentrated point-like distribution, mainly distributed in high-value areas around the Liaohekou National Nature Reserve and the Daling River and Liaohe River, etc (Figure 5). The predominant categories of land utilization in such regions were dominated by watersheds, wetlands, and farm pond land. The maximum change in the extremely high ESV zone between 2010 and 2023 was 7572.30 hm2, and the percentage of change was 1.83% (Figure 6). During a specific period of the research timeframe, the proportion of this type of area revealed an upward trend because this type of area has a good ecological background, is less distressed by human beings, and is supported by relevant conservation of the earth policies, so it maintains a relatively high level of natural system service offering in this area. The overall trend in size over the study period was upward, and the protection and management of the area still needs to be maintained and strengthened.
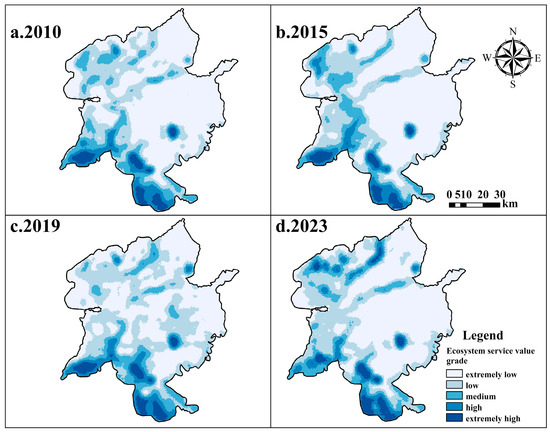
Figure 5.
Spatial distribution of ESV in the study area 2010–2023 (a) 2010; (b) 2015; (c) 2019; (d) 2023.
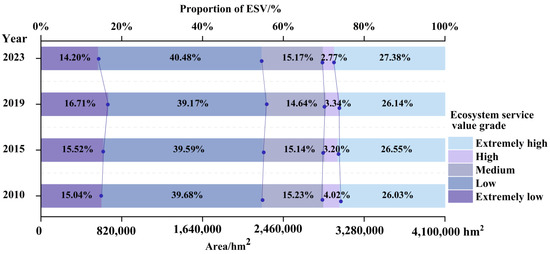
Figure 6.
ESV zoning area and its proportion by class in Panjin, 2010–2023.
3.3. Ecological Risk Characterization
During the study period, the ERI of Panjin City showed a slow decrease, and the values of the ecological risk index were 0.184, 0.179, 0.182 and 0.171 in 2010, 2015, 2019 and 2023, respectively, with a decrease of ecological risk by 8.44%, and the overall ecological safety situation of Panjin City was improved. From the prospective land use species, the ERI of cultured land and unutilized land gradually decreased by a total of 18.71% and 34.11% throughout the time spent studying, which shared a certain degree of improvement in biodiversity preservation in the study zone. The ERI of construction land, forest land, watersheds, and wetlands exhibited a gradually expanding trend, but the rate of increase slowed down, with watersheds and wetlands showing the highest increase in ERI values at 38.30 percent and forest land the lowest increase at 16.83 percent.
The results of the ERI assessment of Panjin City are demonstrated in Figure 7, which makes it evident that the ecological level of risk in the southern part of Panjin City is substantially higher than that in the northern part. The ecological risk of water and wetland areas is significantly higher than that of urban, industrial, mining, and residential land. As can be seen from Figure 8, extremely low-risk and low-risk areas are the primary categories of ecological risk in landscapes in Panjin. Medium-risk areas are chiefly waters, woodlands, and other areas; most of the medium-risk areas are concentrated in Rongxing Reservoir, near the mouth of the Shuangtai River, and the west side of the Panjin Panshan County area; the distribution is more dispersed. The proportion during the study period decreased by 0.32%; the total area reduction of 1323.58 hm2 was mainly converted from the low-risk areas, indicating that the Rongxing Reservoir, the vicinity of the mouth of the Shuangtai River, and other areas face the ecological risk of conversion and should be focused on in order to prevent major ecological risks from occurring; extremely high-risk and high-risk zones are concentrated in the southern zone of the study region and sporadically distributed in the southern part of Panshan County, with the area decreasing and increasing by 293.01 hm2 and 8236.9 hm2, respectively, during the study period, and the proportion decreasing and increasing by 0.07% and 1.99%, respectively. Among them, the high-risk and extremely high-risk zones in Panjin account for 23.81 percent of the complete area of the city, and there is a need to bolster the safeguard and supervision of the bionomic environment in this area.
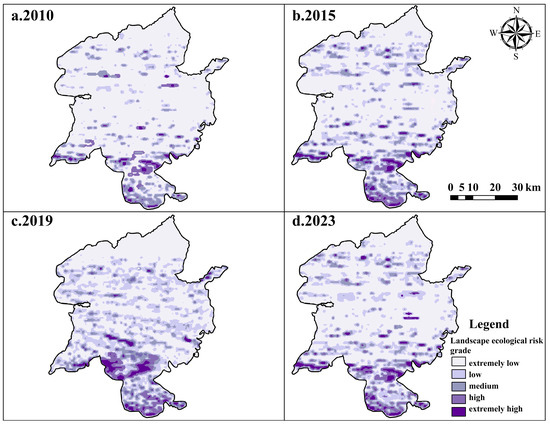
Figure 7.
Spatial distribution pattern of ecological risks in Panjin, 2010–2023 (a) 2010; (b) 2015; (c) 2019; (d) 2023.
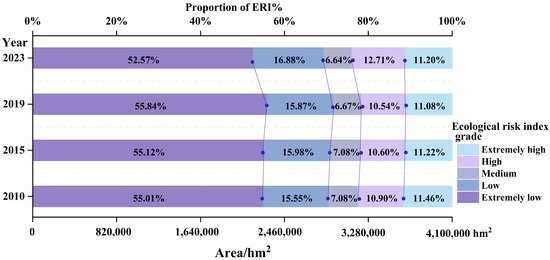
Figure 8.
Areas and their proportions of ecological risk zones of various classes in Panjin City, 2010–2022.
The enlargement evaluation of the region of extremely high-risk areas in the study area slowed down after 2015, and the sum of the areas of extremely high-risk areas showed a declining tendency after 2019, demonstrating that the environment is gradually recovering. The decreasing trend of the area of very high-grade risk areas may demonstrate that the environment in the experimental site is incrementally recovering. The decrease in the area of very high-grade risk areas may reflect the enhancement of the land use composition and the control of urban expansion. The study site may have taken measures to control urban expansion and reduce the development of ecologically sensitive areas.
3.4. Correlation Analysis Between Ecosystem Services and Ecological Risk
In this paper, a multidimensional spatial autocorrelation model was utilized to scrutinize the dimensional correspondence characteristics of the ESV and ERI in Panjin City. The findings demonstrate that the global Moran’s I index (p < 0.05) was 0.255, 0.201, 0.225, and 0.138 in 2010, 2015, 2019, and 2023, respectively, indicating that there was a definite positive spatial correspondence between the ESV and ERI, i.e., when the complete ESV in the research region was enhanced, the regional ecological risk tended to increase. The H-H zone is mainly situated in the Liaohekou National Nature Reserve and Daling River in the south of Panjin City (Figure 9). Compared with other areas, this area is dominated by watersheds and wetlands, which provide a higher ESV, but it is prone to be converted into other types of land under the impact of natural and anthropogenic components and therefore faces high ecological risks of fragmentation of patches and reduced connectivity; forest, grassland, and water are the primary categories of use for land in L-H geographical regions, and the ESV is higher than other land use classes, and the region is not readily agitated by human activity under the influence of low population density and relevant ecological protection policies; H-L is dominated by urban and rural construction land, arable land, and grassland, which provide a low ESV and are subject to strong anthropogenic disturbances; therefore, the potential ecological risk is high. During the period 2010–2023, the area of the region increased and then decreased, with the overall quantity remaining relatively stable; The L-L area is mainly located in Panshan County and Xinglongtai, and the spatial distribution is more aggregated. This type of area is dominated by areas where woodland meets grassland. This area provides a small ESV while being disturbed by human activities over a long period of time, forming a solid ecological structure, and, therefore, the ecological risk associated with this area’s terrain is lower than that in other areas.
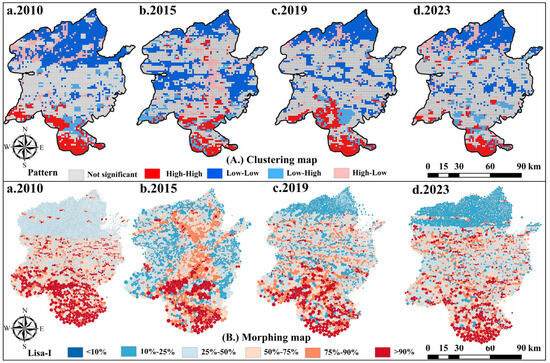
Figure 9.
Spatial autocorrelation LISA of ESV per unit area and ecological risk index in Panjin City, 2010–2023. (A) Clustering Map; (B) Morphing map; (a) 2010; (b) 2015; (c) 2019; (d) 2023.
The results show that the growth in the ESV is usually accompanied by an increase in ecological risk, and that high-high agglomeration areas provide a higher ESV but also face higher ecological risks. Low-high agglomeration areas can be prioritized for ecological protection to further enhance their ecosystem services. Low-low concentration areas need to take into account the stability of their ecological structure and avoid over-exploitation.
3.5. Factor Detection
As shown in Figure 7, land use type is the paramount factor contributing to the spatial heterogeneity of landscape ecological risk, with an explanatory magnitude of 62%. In addition, the anthropogenic activity index, elevation, and slope also showed strong explanatory power, with elevation and slope significantly influencing the anthropogenic activity index and together dominating the landscape ecological risk. For the spatial differentiation of the ESV, land use type was again the primary influencing factor, with an explanatory power of 54%. Meanwhile, the human activity index and urbanization rate also show strong explanatory power, indicating that socio-economic factors have a profound effect on ESV.
3.6. Interaction Detection
As shown in Figure 10, the interaction of the influencing factors demonstrates a two-factor synergistic effect and a nonlinear escalation, validating the rationality of the choice of these factors. The spatial heterogeneity of the ERI and ESV across the study region indicates that the interdependence of any two drivers had a more profound influence than the effect of a singular factor, suggesting that the ecosystem is conditioned by a combination of numerous factors and that there are synergies among the drivers which together affect the configuration and operational dynamics of the ecosystem. The interaction analysis revealed that annual precipitation exhibits a nonlinear amplifying relationship with certain factors, while all the remaining factors showed a two-way enhancement with each other. The results show that the interactions between climate factors and other ecological and socio-economic parameters are complex and variable, that there are significant synergies between different environmental and socio-economic imperatives, and that a single factor cannot effectively explain the changes in the ERI and ESV.
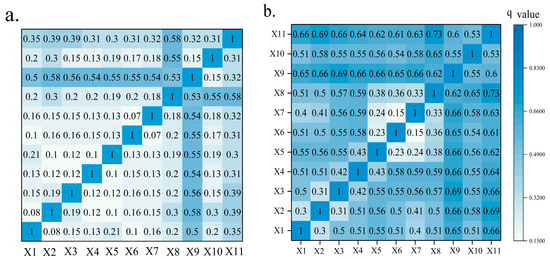
Figure 10.
Results of Interaction Detection in the Study Area (a) Spatial divergence results for ESV; (b) Spatial divergence results for ERI; labels X1 to X11 represent temperature, annual precipitation, normalized vegetation index (NVDI), elevation, slope, population density, land-averaged GDP, urbanization rate, land use type, ecosystem service value, landscape ecological risk, and anthropogenic impact index.
Among all factor interaction combinations, the intricate interactions among heterogeneous land use types and the anthropogenic impact index had the highest explanatory power for landscape ecological risk and ESV spatial differentiation: 0.58 and 0.73, respectively. The synergistic effect between these two factors is shown to be significant. The repercussions of human activities and land use transformations on ecosystems and ESV are integrated, and such impacts have a decisive influence concerning the spatial distribution of the ERI and ESV; among the interaction combinations of other drivers, the interaction of the anthropogenic influence index with the Normalized Vegetation Index (NVI) and the interaction of land use type showed superior explanatory force for the spatial divergence of ERI, with 0.58 and 0.55, respectively. This demonstrates that human activities play a crucial role in shaping vegetation cover, which in turn critically determines landscape ecological risk, and that excessive human activities may cause a reduction in vegetation cover and thus increase ecological risk; for the spatial differentiation of the ESV, the interplay between different land use types and the NVI, and the interaction between the ERI and land use type, the explanatory power is strong. The results illustrate that when the factors interacted with land use type, the q-value was greater than 0.6, indicating that land use type was the key driver; various types of land use offer distinct ecosystem services—forests and grasslands, for example, typically provide higher soil and water conservation and biodiversity services, while urban land provides fewer services. When they interacted with the anthropogenic impact index, the q-values were all greater than 0.6, and changes in land use type amplified or suppressed the ramification of anthropogenic activities on the ESV. The detection of spatial dissimilarity in the ESV showed that the q-value of each factor was greater than 0.53 when it interacted with land use type. Changes in land use type, which operate as a link between other factors and the ESV, can affect the impact of other factors on the ESV. For example, excessive anthropogenic disturbance (e.g., urbanization) in areas rich in natural vegetation can lead to a sharp decline in the ESV, and in already degraded areas, appropriate land use changes (e.g., fallowed land) may increase the ESV. In summary, the spatial differentiation of the ESV and ERI is jointly influenced by many factors. Among them, the anthropogenic influence index and land use type have a more substantial effect on the spatial distribution of the two.
4. Discussion
As the location of the Liaohekou National Ecological Park, Panjin City is an area of national focus for ecological protection and construction and occupies an extremely important position in China’s ecological protection pattern. From 2010 to 2023, the ESV in the southern part of Panjin City was considerably higher than that in the northern part, and the ERI faced by the southern region significantly surpassed the levels in the northern region; a pronounced positive correlation and a positive spatial interdependence were observed between the ESV in landscapes and the ERI in the study zone, which is in accordance with previous work [70,71]. Analyzing the interactions of land use type, population density, economic development level, and other factors in clustered areas can clarify their effects on the ESV and ERI and provide a basis for ecological protection strategies. Future research should focus on the driving factors of spatial clustering and utilize complex methods combined with multi-source data to accurately analyze the relationship between spatial clustering and the ESV and ERI, so as to provide theoretical support for ecological management.
As urbanization accelerates, settlements in have Panjin expanded into surrounding forests, grassland, and wetland areas, leading to the conversion of substantial amounts of natural land into construction land. This transformation has disrupted the ecological landscape and hindered ecological connectivity. The expansion of industrial land use, furthermore, has encroached upon large areas of farmland and wetlands, thus exacerbating ecological pressure. Meanwhile, the increased investment in transportation infrastructure, having promoted population and industrial agglomeration, has indirectly intensified ecological pressure. The construction of transportation routes has fragmented the ecological landscape and compromised ecosystem integrity. Furthermore, under the influence of global climate change, rising temperatures and sea levels in Panjin have led to the shrinkage of wetland areas in the southern lowlands, squeezing the habitat of wetland flora and fauna and posing a serious threat to the Liaohe Estuary’s wetland ecosystem. This, in turn, has affected the ecosystem service value and ecological risk to varying degrees. For the future development of Panjin City, a key concern should be growth in the area of high-grade ecological risk areas. Land use efficiency should be improved to reduce ecological risks and shrink the area of high-risk areas in order to achieve high-quality sustainable development. Different cities share commonalities in ecosystem services and ecological risks, and the research results of Panjin City in this paper can provide a reference for the sustainable development of cities in various regions and provide new development ideas for large and medium-sized cities with similar environmental backgrounds.
The ESV is an important aspect of assessing environmental quality, and different land use types have significant effects on the ESV. Woodlands, grasslands, and wetlands are typically associated with key ecological services such as carbon sequestration and water purification, and, consequently, they possess higher ESVs [72,73,74]. In contrast, urbanized areas tend to have lower ESVs due to the conversion of natural landscapes into built environments and the consequent degradation of biodiversity and ecosystem functions. The ESV is also an important director of environmental protection. There is an imbalance between supporting and regulating services in the study area, leading to a decline in climate regulation and water purification functions. The main reasons for this are the transformation of land use, such as the conversion of some forest and grassland to construction land, the encroachment or pollution of wetlands, industrial, agricultural, and domestic pollution affecting the ecology, and the imbalance in ecosystem management. This will lead to problems such as reduced ecosystem stability, limited economic development, and damage to biodiversity. Therefore, effective measures such as optimizing land use planning, protecting ecological land use, strengthening pollution control, emphasizing regulating services, and strengthening monitoring and assessment should be taken to prevent and control risks. Panjin should focus on the ecological conservation of the Liaohekou National Nature Reserve and the Red Beach National Scenic Corridor and strengthen the protection and management of coastal wetlands. Through our exploration of the drivers of spatial differentiation, we found that land use types and anthropogenic impact indices have a dominant role in the spatial differentiation of both the ERI and ESV, and, therefore, high-value areas susceptible to anthropogenic disturbances, such as watersheds, wetlands, and forests, can be protected through the protection of these areas [75,76].
Based on the framework of “Risk-Association-Driver,” the sustainable safety evaluation framework constructed in this study integrates the value of ecosystem services and ecological risks and drivers and provides new ideas and methods for urban sustainability. By analyzing the dynamic changes of the ESV and ERI, we can more accurately assess the status of urban ecological security and provide a strong basis for the city to formulate scientific and reasonable sustainable development strategies. At the same time, the temporal and spatial characteristics and correlation of the ESV and ERI are analyzed to deepen the cognition of the relationship between ecology and development and to provide theoretical support for the benign interaction between ecology and economy in the sustainable development of cities. The drivers of ecological risk and ecosystem service value in the study area are analyzed in depth, which expands the perspective of urban sustainability theory in the field of spatial analysis [77]. Urban planning theories can be further improved according to the framework of this study, and ecological service functions and risk prevention and control can be fully considered in land use planning to optimize urban spatial layout to enhance urban ecological resilience and sustainability. Although this study has achieved some results in exploring the value of ecosystem services and ecological risks in Panjin City, there are still some potential limitations, which may affect the credibility of the results and need to be explored. Firstly, since both the ecosystem service value and ecological risk index accounting conducted were based on the regional land use type structure, which was an interaction analysis between the two results, they could not well describe and reflect the direct intrinsic linkage between ecosystem services and ecological risk assessment. Secondly, future studies should incorporate a variety of estimation methods, such as modeling methods and energy value methods, in the physical quality assessment method, etc., to ecosystem service provisioning in the study area. Finally, the effects of single provisioning, regulating, supporting, and cultural ecosystem services on regional ecological services and risks should be the focus and direction of the next research.
5. Conclusions
This study evaluates the ESV in Panjin City using an enhanced equivalent factor approach, ERI calculation, bivariate spatial autocorrelation modeling, and geo-detectors. It investigates the correlation between the ESV and ERI. The findings reveal significant variations in both the ESV and ERI across spatial and temporal dimensions from 2010 to 2023. These fluctuations are primarily driven by climatic factors, anthropogenic impact indices, and land use patterns. The study’s results demonstrate the following:
- (1)
- From 2010 to 2023, the ESV in Panjin maintained a growing tendency, from 279.23 × 10⁸ CNY to 304.88 × 10⁸ CNY, but the growth rate gradually decreased and tended to level off, having a yearly growth rate of an average of 0.71%. This indicates that growth in the ESV may be negatively affected by environmental pressures or human activities and that attention needs to be paid to the sustainability of the ESV; wetlands and watersheds contribute most to the value of ecosystem services and play an indispensable role in the provision of ecological services. The ecosystems of Panjin hold a vital position in sustaining ecological balance and supporting human activities.
- (2)
- The ESV was notably elevated in the southern region of the research area in parallel with the northern part, reflecting the uneven distribution of ecological resources among regions. The southern part of the study zone faces certain ecological threats; the value of the ERI continued to decrease by a total of 8.44 percent during the research period, and the general ecological risk level gradually stabilized, with the overall ecological security situation in the region improving. The ESV and the landscape ERI in Panjin City showed a significant positive correlation, as well as a significant positive correlation in the spatial relationship. The ERI has a certain predictive influence on the transformation of the ESV, and the ecological vulnerabilities inherent within the landscape should be controlled in the future while improving the ESV of Panjin City.
- (3)
- The findings from the factor analysis reveal that the spatial differentiation of the ESV and landscape ERI was jointly influenced by a variety of factors. Land use type and anthropogenic impact index are the dominant elements influencing the spatial heterogeneity of the ERI and ESV in Panjin. The impact of land use practices on the ESV is critical, and disturbance of ecosystems by human activities is a major source of ecological risk. However, it should be noted that the driving mechanism of spatial differentiation is complex, not only related to natural geographic conditions but also closely related to land use regulations and human-induced impacts, requiring differentiated ecological protection and management strategies.
Author Contributions
Conceptualization, P.D. and L.W.; methodology, Q.W. (Qiaoyu Wang); software, Q.W. (Qiang Wu); validation, Q.W. (Qiaoyu Wang), L.W., and P.D.; formal analysis, P.D.; investigation, Q.W. (Qiaoyu Wang); resources, Q.W. (Qiaoyu Wang); data curation, Q.W. (Qiang Wu); writing—original draft preparation, Q.W. (Qiaoyu Wang); writing—review and editing, Q.W. (Qiaoyu Wang); visualization, Q.W. (Qiang Wu); supervision, P.D. and L.W.; project administration, Q.W. (Qiaoyu Wang); funding acquisition, P.D. All authors have read and agreed to the published version of the manuscript.
Funding
This research was funded by the National Natural Science Foundation of China, grant number 41701123.
Institutional Review Board Statement
Not applicable.
Informed Consent Statement
Not applicable.
Data Availability Statement
Scripts and data supporting the results of this study are available from the corresponding authors upon reasonable request.
Acknowledgments
The authors thank the anonymous reviewers for the helpful comments that improved this manuscript.
Conflicts of Interest
The authors declare no conflict of interest.
References
- Feng, L. Analysis on impact of land cover change on environmental security. Energy Environ. Prot. 2022, 44, 83–88. [Google Scholar]
- Song, X.; Wen, M.; Shen, Y.; Feng, Q.; Xiang, J.; Zhang, W.; Zhao, G.; Wu, Z. Urban vacant land in growing urbanization: An international review. J. Geogr. Sci. 2020, 30, 669–687. [Google Scholar] [CrossRef]
- Ming, H.; Gang, L.; Changyou, C.; Liutao, L. A Coupling Relationship between New-Type Urbanization and Tourism Resource Conversion Efficiency: A Case Study of the Yellow River Basin in China. Sustainability 2022, 14, 14007. [Google Scholar] [CrossRef]
- Maron, M.; Mitchell, M.G.E.; Runting, R.K.; Rhodes, J.R.; Mace, G.M.; Keith, D.A.; Watson, J.E.M. Towards a threat assessment framework for ecosystem services. Trends Ecol. Evol. 2016, 32, 240–248. [Google Scholar] [CrossRef]
- Gao, W.; Song, Q.; Zhang, H.; Wang, S. Analysis of spatial and temporal changes and driving factors of ecological vulnerability in Sanjiangyuan Region. Ecol. Environ. Sci. 2024, 33, 1648–1660. [Google Scholar] [CrossRef]
- Ma, Y.; Pan, J.; Cai, S.; Chen, M.; Chen, Y. Trade-offs and synergies between social value and ecological value of ecosystem services:A case study of the Potatso National Park. Sci. Geogr. Sin. 2022, 42, 1283–1294. [Google Scholar] [CrossRef]
- Zhibo, L.; Qian, S.; Jianyun, Z.; Shiru, W. Prediction and Evaluation of Ecosystem Service Value Based on Land Use of the Yellow River Source Area. Sustainability 2022, 15, 687. [Google Scholar] [CrossRef]
- Wu, Q.; Wang, L.; Wang, T.; Ruan, Z.; Du, P. Spatial–temporal evolution analysis of multi-scenario land use and carbon storage based on PLUS-InVEST model: A case study in Dalian, China. Ecol. Indic. 2024, 166, 112448. [Google Scholar] [CrossRef]
- Nan, H.; Dong, X.; Ning, Z.; Shuxin, F.; Peiyan, W.; Yunyuan, L. Multi-Scenario Simulations of Land Use and Habitat Quality Based on a PLUS-InVEST Model: A Case Study of Baoding, China. Sustainability 2022, 15, 557. [Google Scholar] [CrossRef]
- Juan, T.; Yudi, F.; Ziyan, T.; Yinghua, G.; Liang, Y. Ecosystem Services Research in Green Sustainable Science and Technology Field: Trends, Issues, and Future Directions. Sustainability 2022, 15, 658. [Google Scholar] [CrossRef]
- Anzaldua, G.; Gerner, N.V.; Lago, M.; Abhold, K.; Hinzmann, M.; Beyer, S.; Winking, C.; Riegels, N.; Jensen, J.K.; Termes, M.; et al. Getting into the water with the Ecosystem Services Approach: The DESSIN ESS evaluation framework. Ecosyst. Serv. 2018, 30, 318–326. [Google Scholar] [CrossRef]
- Jin, T.; Zhang, Y.; Zhu, Y.; Gong, J.; Yan, L. Spatiotemporal variations of ecosystem service values and landscape ecological risk and their correlation in forest area of Loess Plateau, China: A case study of Ziwuling region. Chin. J. Appl. Ecol. 2021, 32, 1623–1632. [Google Scholar] [CrossRef]
- Shifaw, E.; Sha, J.; Li, X.; Bao, Z.; Ji, J.; Ji, Z.; Kassaye, A.Y.; Lai, S.; Yang, Y. Ecosystem services dynamics and their influencing factors: Synergies/tradeoffs interactions and implications, the case of upper Blue Nile basin, Ethiopia. Sci. Total Environ. 2024, 938, 173524. [Google Scholar] [CrossRef]
- Biliyitorb, L.S.; Appiah, T.S.; Osei, A.M.; Owusu, A. Sustainable functional roles of ecologically sensitive areas in the Greater Kumasi Metropolis of Ghana: Exploring local perceptions and attitudes from a socio-economic purview. Urban Ecosyst. 2023, 27, 85–99. [Google Scholar] [CrossRef]
- Shrestha, S.; Poudyal, K.N.; Bhattarai, N.; Dangi, M.B.; Boland, J.J. An Assessment of the Impact of Land Use and Land Cover Change on the Degradation of Ecosystem Service Values in Kathmandu Valley Using Remote Sensing and GIS. Sustainability 2022, 14, 15739. [Google Scholar] [CrossRef]
- Cao, Q.; Zhang, X.; Ma, H.; Wu, J. Review of landscape ecological risk and an assessment framework based on ecological services: ESRISK. Acta Geogr. Sin. 2018, 73, 843–855. [Google Scholar] [CrossRef]
- Brander, L.M.; Groot, R.d.; Schägner, J.P.; Goñi, V.G.; Hoff, V.v.t.; Solomonides, S.; McVittie, A.; Eppink, F.; Sposato, M.; Do, L.; et al. Economic values for ecosystem services: A global synthesis and way forward. Ecosyst. Serv. 2024, 66, 101606. [Google Scholar] [CrossRef]
- Hongjiang, G.; Yanpeng, C.; Bowen, L.; Hang, W.; Zhifeng, Y. An improved approach for evaluating landscape ecological risks and exploring its coupling coordination with ecosystem services. J. Environ. Manag. 2023, 348, 119277. [Google Scholar] [CrossRef]
- Nolander, C.; Lundmark, R. A Review of Forest Ecosystem Services and Their Spatial Value Characteristics. Forests 2024, 15, 919. [Google Scholar] [CrossRef]
- Ma, Z.; Gao, J.; Liang, T.; He, Z.; Feng, S.; Zhang, X.; Zhang, D. Comprehensive Ecological Risk Changes and Their Relationship with Ecosystem Services of Alpine Grassland in Gannan Prefecture from 2000–2020. Remote Sens. 2024, 16, 2242. [Google Scholar] [CrossRef]
- Ronnie, F.; Pedro, C. Ocean ecosystem services: Modeling a factor development process to create sustainable value for decisions. Sustain. Account. Manag. Policy J. 2024, 15, 833–860. [Google Scholar] [CrossRef]
- Xiaozhen, Z.; Qianfeng, W.; Rongrong, Z.; Binyu, R.; Xiaoping, W.; Yue, W.; Jiakui, T. A Spatiotemporal Analysis of Hainan Island’s 2010–2020 Gross Ecosystem Product Accounting. Sustainability 2022, 14, 15624. [Google Scholar] [CrossRef]
- Liang, J.; Li, S.; Li, X.; Li, X.; Liu, Q.; Meng, Q.; Lin, A.; Li, J. Trade-off analyses and optimization of water-related ecosystem services (WRESs) based on land use change in a typical agricultural watershed, southern China. J. Clean. Prod. 2021, 279, 123851. [Google Scholar] [CrossRef]
- Matthies, B.D.; D’Amato, D.; Berghäll, S.; Ekholm, T.; Hoen, H.F.; Holopainen, J.; Korhonen, J.E.; Lähtinen, K.; Mattila, O.; Toppinen, A.; et al. An ecosystem service-dominant logic?—Integrating the ecosystem service approach and the service-dominant logic. J. Clean. Prod. 2016, 124, 51–64. [Google Scholar] [CrossRef]
- Jiang, L.; Du, M. Landscape ecological risk assessment based on ecosystem services of Nong’an County. Environ. Ecol. 2019, 1, 39–45. [Google Scholar]
- Jianwen, Z.; Jipeng, X.; Wenyu, L.; Xiaoai, D.; Jiayun, Z.; Yunfeng, S.; Junjun, Z.; Weile, L.; Heng, L.; Yakang, Y.; et al. Evaluating Trade-Off and Synergies of Ecosystem Services Values of a Representative Resources-Based Urban Ecosystem: A Coupled Modeling Framework Applied to Panzhihua City, China. Remote Sens. 2022, 14, 5282. [Google Scholar] [CrossRef]
- Zhu, Q.; Cai, Y. Assessment framework and simulation prediction for ecological security based on “risk-health-services”: A case study of the Huaihe River Basin. J. Nat. Resour. 2024, 39, 2676–2690. [Google Scholar] [CrossRef]
- Qiao, E.; Reheman, R.; Zhou, Z.; Tao, S. Evaluation of landscape ecological security pattern via the “pattern-function-stability” framework in the Guanzhong Plain Urban Agglomeration of China. Ecol. Indic. 2024, 166, 112325. [Google Scholar] [CrossRef]
- Zhang, J.; Qian, Z.; Xu, W.; Zhang, H.; Wang, Z. Ecosystem pattern variation from 2000 to 2010 in national nature reserves of China. Acta Ecol. Sin. 2017, 37, 8067–8076. [Google Scholar] [CrossRef]
- He, X.; Zhang, L. Research on the Path of Vocational Students’ Innovation and Entrepreneurship Ability under the Background of Carbon Neutral and Carbon Peak. Adv. Vocat. Tech. Educ. 2023, 5, 801. [Google Scholar]
- Zhang, J.; Ge, C.; Duan, X.; Wang, K.; Zhou, Q.; Hao, C. Integrating SDGs into China’s ecological civilization construction: Practical indicators and progress assessment. Ecol. Indic. 2024, 169, 112921. [Google Scholar] [CrossRef]
- Ahoton, D.H.; Bacharou, T.; Bossa, A.Y.; Sintondji, L.O.; Bonkoungou, B.; Alofa, V.M. Dynamics of Irrigated Land Expansion in the Ouémé River Basin Using Field and Remote Sensing Data in the Google Earth Engine. Land 2024, 13, 1926. [Google Scholar] [CrossRef]
- Tabunshchik, V.; Nikiforova, A.; Lineva, N.; Drygval, P.; Gorbunov, R.; Gorbunova, T.; Kerimov, I.; Pham, C.N.; Bratanov, N.; Kiseleva, M. The Dynamics of Air Pollution in the Southwestern Part of the Caspian Sea Basin (Based on the Analysis of Sentinel-5 Satellite Data Utilizing the Google Earth Engine Cloud-Computing Platform). Atmosphere 2024, 15, 1371. [Google Scholar] [CrossRef]
- Muhammad, Z.; Ambrina, K.; Abid, G.A.; Hina, F.; Zafeer, S.; Atif, B.S.; Abouel, N.E.; Shafiq, A.; Muhammad, S. Assessing Spatial-Temporal Changes in Monetary Values of Urban Ecosystem Services through Remotely Sensed Data. Sustainability 2022, 14, 15136. [Google Scholar] [CrossRef]
- Yan, E.; Lin, H.; Wang, G.; Xia, C. Analysis of evolution and driving force of ecosystem service values in the Three Gorges Reservoir region during 1990-2011. Acta Ecol. Sin. 2014, 34, 5962–5973. [Google Scholar] [CrossRef]
- Lv, L.; Yi, W.; Cui, D.; Wang, N.; Zhang, D.; Xie, Z. Fine classification of saltmarsh vegetation based on Google Earth Engine in Yancheng. China Mar. Sci. Bull. 2024, 43, 114–126. [Google Scholar]
- Mohammad, K.G.; Fatemeh, H.; Mahsa, T.; Amin, S.; Reyhaneh, A.; Narges, K. Spatiotemporal monitoring of climate change impacts on water resources using an integrated approach of remote sensing and Google Earth Engine. Sci. Rep. 2024, 14, 5469. [Google Scholar] [CrossRef]
- Wan, H.; Wang, Y.; Wang, L.; Chen, Y. Land resource utilization based on remote sensing monitoring of national land changes:a case study of Tongren in Guizhou Province Beijing. Beijing Surv. Mapp. 2024, 38, 374–380. [Google Scholar] [CrossRef]
- Breiman, L. Random Forests. Mach. Learn. 2001, 45, 5–32. [Google Scholar] [CrossRef]
- Albertini, C.; Gioia, A.; Iacobellis, V.; Petropoulos, G.P.; Manfreda, S. Assessing multi-source random forest classification and robustness of predictor variables in flooded areas mapping. Remote Sens. Appl. Soc. Environ. 2024, 35, 101239. [Google Scholar] [CrossRef]
- Edward, S. On the distributions of bootstrap support and posterior distributions for a star tree. Syst. Biol. 2008, 57, 602–612. [Google Scholar] [CrossRef]
- Pu, D.; Wang, G.; Zhang, Z.; Niu, X.; He, G.; Long, T.; Yin, R.; Jiang, W.; Shun, J. Urban Area Extraction based on Independent Component Analysis and Random Forest Algorithm. J. Geo-Inf. Sci. 2020, 22, 1597–1606. [Google Scholar] [CrossRef]
- GB/T 21010-2017; Current Land Use Classification. Chinese Standard: Beijing, China, 2017.
- Wen, R.; Wu, Y. An investigation on influences of implementing new code of land use classificationon land administration in China. Resour. Sci. 2010, 32, 731–736. [Google Scholar]
- Feng, W.; Sui, H.; Tu, J.; Sun, K.; Huang, W. Change detection method for high resolution remote sensing images using random forest. Acta Geod. Cartogr. Sin. 2017, 46, 1880–1890. [Google Scholar] [CrossRef]
- Liao, J.; Cui, Y.; Di, C.; Tan, Y. An analysis of the adjustment of the current land use status classification standard in China. In Proceedings of the 2017 China Land Society Annual Conference, Ningbo, China, 2 December 2017. [Google Scholar]
- Liang, J.; Chen, C.; Shun, W.; Yang, G.; Liu, Z.; Zhang, Z. Spatio-temporal land use/cover change dynamics in Hangzhou Bay, China, using long-term Landsat time series and GEE platform. Natl. Remote Sens. Bull. 2023, 27, 1480–1495. [Google Scholar] [CrossRef]
- Costanza, R. Misconceptions about the valuation of ecosystem services. Ecosyst. Serv. 2024, 70, 101667. [Google Scholar] [CrossRef]
- Ahmed, M.T. Millennium Ecosystem Assessment. Glob. Change Hum. Health 2001, 2, 118. [Google Scholar] [CrossRef]
- Du, X.; Huang, Z. Ecological and environmental effects of land use change in rapid urbanization: The case of Hangzhou, China. Ecol. Indic. 2017, 81, 243–251. [Google Scholar] [CrossRef]
- Xie, G.; Zhen, L.; Lu, C.; Cao, S.; Xiao, Y. Supply, consumption and valuation of ecosystem services in China. Resour. Sci. 2008, 30, 93–99. [Google Scholar] [CrossRef]
- Xie, G.; Zhen, L.; Lu, C.; Xiao, Y.; Li, W. Applying Value Transfer Method for Eco-Service Valuation in China. J. Res. Ecol. 2010, 1, 51–59. [Google Scholar] [CrossRef]
- Xie, G.; Lu, C.; Leng, R.; Cheng, D.; Li, S. Ecological assets valuation of the Tibetan Plateau. Nat. Resour. 2003, 18, 189–196. [Google Scholar] [CrossRef]
- Wang, R.; Pan, H.; Liu, Y.; Tang, Y.; Zhang, Z.; Ma, H. Evolution and driving force of ecosystem service value based on dynamicequivalent in Leshan City. Acta Ecol. Sin. 2022, 42, 76–90. [Google Scholar] [CrossRef]
- Gui, W.; Han, Z. The Inflation Control and Relation between CPI and PPI in China. Stat. Res. 2011, 28, 49–56. [Google Scholar] [CrossRef]
- Xie, G.; Zhang, C.; Zhang, L.; Chen, W.; Chen, S. Improvement of the evaluation method for ecosystem service value based on per unit area. J. Nat. Resour. 2015, 30, 1243–1254. [Google Scholar] [CrossRef]
- Liu, Z.; Wang, S.; Fang, C. Spatiotemporal evolution and influencing mechanism of ecosystem service value in the Guangdong-Hong Kong-Macao Greater Bay Area. J. Geogr. Sci. 2023, 6, 1226–1244. [Google Scholar] [CrossRef]
- Liu, Q.; Li, G.; Zhang, C.; Zhao, L.; Zhu, Y. Study on dynamic changes in ecosystem service values in Qinglong County based on coefficient correction. Chin. J. Eco-Agric. 2019, 27, 971–980. [Google Scholar] [CrossRef]
- Kreuter, U.P.; Harris, H.G.; Matlock, M.D.; Lacey, R.E. Change in ecosystem service values in the San Antonio area, Texas. Ecol. Econ. 2001, 39, 333–346. [Google Scholar] [CrossRef]
- Xie, Y.; Zhu, Q.; Bai, H.; He, H. Combining ecosystem service value and landscape ecological risk to subdivide the riparian buffer zone of the Weihe River in Shaanxi. Ecol. Indic. 2024, 166, 112424. [Google Scholar] [CrossRef]
- Shi, H.L.; Wen, L.; Yu, G.; Bao, Z.L. Correlations between ecosystem service value and landscape ecological risk and its spatial heterogeneity in Jilin Province, China. J. Appl. Ecol. 2024, 35, 769–779. [Google Scholar] [CrossRef]
- Xu, F.; LÜ, X. Ecological risk pattern based on land use changes in Jiangsu coastal areas. Acta Ecol. Sin. 2018, 38, 7312–7325. [Google Scholar] [CrossRef]
- Li, W.; Wang, Y.; Xie, S.; Sun, R.; Cheng, X. Impacts of landscape multifunctionality change on landscape ecological risk in a megacity, China: A case study of Beijing. Ecol. Indic. 2020, 117, 106681. [Google Scholar] [CrossRef]
- Lin, J.; Duo, L.; Zou, Z. Dynamic evolution and spatial autocorrelation analysis of landscape fragmentation under the background of urban expansion: A case study of nanchang city. Res. Soil Water Conserv. 2022, 29, 362–369. [Google Scholar] [CrossRef]
- Zhang, J.; Gong, J.; Ma, X.; Liu, D. GeoDA-based spatial correlation analysis of landscape fragmentation in Bailongjiang Watershed of Gansu. Chin. J. Ecol. 2018, 37, 1476–1483. [Google Scholar] [CrossRef]
- Cheng, Z. The spatial correlation and interaction between manufacturing agglomeration and environmental pollution. Ecol. Indic. 2016, 61, 1024–1032. [Google Scholar] [CrossRef]
- Souris, M.; Bichaud, L. Statistical methods for bivariate spatial analysis in marked points. Examples in spatial epidemiology. Spat. Spatio-Temporal Epidemiol. 2011, 2, 227–234. [Google Scholar] [CrossRef] [PubMed]
- Wang, J.; Xu, C. Geodetector: Principle and prospective. Acta Geogr. Sin. 2017, 72, 116–134. [Google Scholar] [CrossRef]
- Wang, X.; Xi, J.; Yang, D.; Chen, T. Spatial Differentiation of Rural Touristization and Its Determinants in China: A Geo-Detector-Based Case Study of Yesanpo Scenic Area. J. Resour. Ecol. 2016, 7, 464–471. [Google Scholar] [CrossRef]
- Li, J.; Gao, M. Spatiotemporal evolution and correlation analysis of ecosystem service values andecological risk in Binzhou. Acta Ecol. Sin. 2019, 39, 7815–7828. [Google Scholar] [CrossRef]
- Du, J.; Shrestha, R.P.; Nitivattananon, V.; Nguyen, T.P.L.; Razzaq, A. Unveiling the Value of Nature: A Comprehensive Analysis of the Ecosystem Services and Ecological Compensation in Wuhan City’s Urban Lake Wetlands. Water 2023, 15, 2257. [Google Scholar] [CrossRef]
- Zhang, X.; Yin, Q.; Zheng, Z.-k.; Sun, S.; Huang, J. Dynamic changes and key drivers of ecosystem service values in populous zones on the Tibetan Plateau: A 35-Year analysis. Ecol. Indic. 2024, 167, 112620. [Google Scholar] [CrossRef]
- Akbar, A.; Abulizi, A.; Abliz, A.; Abliz, A.; Jiang, J.; Yu, T.; Ou, B. Land Use and Land Cover Change Effects on the Value of Ecosystem Services in the Konqi River Basin, China, under Ecological Water Conveyance Conditions. Forests 2023, 14, 1028. [Google Scholar] [CrossRef]
- Liu, J.; Qin, K.; Xiao, Y.; Xie, G. Multi-Criteria Decision-Making Scenario Insights into Spatial Responses and Promotion Under Ecosystem Services. Land 2024, 13, 1964. [Google Scholar] [CrossRef]
- Huan, L.; Ruizhen, W.; Haoyu, S.; Weijia, C.; Jie, S.; Xuefeng, Z.; Lu, W.; Yi, Z.; Lixin, W.; Tiejun, L. Spatiotemporal evolution and driving forces of ecosystem service value and ecological risk in the Ulan Buh Desert. Front. Environ. Sci. 2023, 10, 2022. [Google Scholar] [CrossRef]
- Martinez-Morata, I.; Bostick, B.C.; Conroy-Ben, O. Nationwide geospatial analysis of county racial and ethnic composition and public drinking water arsenic and uranium. Nat. Commun. 2024, 13, 7461. [Google Scholar] [CrossRef]
- Zhou, Y.; Chen, T.; Wang, J.; Xu, X. Analyzing the Factors Driving the Changes of Ecosystem Service Value in the Liangzi Lake Basin—A GeoDetector-Based Application. Sustainability 2023, 15, 15763. [Google Scholar] [CrossRef]


Disclaimer/Publisher’s Note: The statements, opinions and data contained in all publications are solely those of the individual author(s) and contributor(s) and not of MDPI and/or the editor(s). MDPI and/or the editor(s) disclaim responsibility for any injury to people or property resulting from any ideas, methods, instructions or products referred to in the content. |
© 2025 by the authors. Licensee MDPI, Basel, Switzerland. This article is an open access article distributed under the terms and conditions of the Creative Commons Attribution (CC BY) license (https://creativecommons.org/licenses/by/4.0/).