Article

Evaluation of Public Transportation System through Social Network Analysis Approach

1
Department of Urban Planning, Hongik University, Seoul 04066, Republic of Korea
2
Department of Urban Design & Planning, Hongik University, Seoul 04066, Republic of Korea
*
Author to whom correspondence should be addressed.
Sustainability 2024, 16(16), 7212; https://doi.org/10.3390/su16167212
Submission received: 13 June 2024 / Revised: 5 August 2024 / Accepted: 20 August 2024 / Published: 22 August 2024

Abstract

:
In response to the phenomenon of global warming, the transportation sector aims to mitigate carbon emissions by promoting the use of public transportation. This study employs social network analysis to propose effective improvements to the public transportation system, focusing on bus stop locations and route networks in Hwaseong City, South Korea. Two networks were constructed based on existing public transportation routes and usage data at each bus stop. The findings and implications are as follows: Analyzing the public transportation network from a network perspective can effectively contribute to improving the public transportation network route system. By evaluating centrality and brokerage for the existing routes, it is possible to identify inefficient routes and develop efficient route modification plans. Based on actual usage patterns, excessive bus supply and unnecessary bus stop locations can be identified, allowing for the establishment of appropriate operational plans. This can lead to improved operational efficiency and cost savings. Rational route design and operational planning can enhance public transportation services and promote increased use of public transportation. Ultimately, this contributes to sustainable development through carbon reduction in the transportation sector.

1. Introduction

Global warming has become an increasingly severe issue worldwide. During a UN headquarters speech on 27 July 2023, it was emphasized that “the era of global warming has ended” and “the era of global boiling has arrived” [1]. This alarming statement underscores the significance of environmental concerns as an ongoing global challenge. In the transportation sector, a primary strategy for mitigating environmental pollution is to reduce carbon emissions. Traditional methods to achieve this goal have included promoting the use of public transportation, and recent technological advancements have led to efforts to introduce eco-friendly transportation means such as electric vehicles. Unlike traditional internal combustion engine vehicles, electric vehicles do not emit carbon during operation. Environmentally conscious individuals have begun purchasing electric vehicles to protect the environment. Globally, the number of electric vehicles increased from 6.5 million in 2021 to 13.7 million in 2023, more than doubling. However, the market share of electric vehicles in the overall automobile market remains relatively low at about 18% [2]. Despite the rapid increase in the adoption of electric vehicles, their penetration rate remains low due to long charging times and relatively few charging facilities. In particular, South Korea has about three charging stations per electric vehicle, significantly lower than the global average of eleven [3]. Additionally, fossil fuels are used to produce electricity, which ultimately pollutes the environment. To achieve sustainable development through the reduction in environmental pollution, it is crucial to reduce the use of private cars and promote the use of public transportation. Public transportation serves as a mass transit system, contributing to the reduction of carbon emissions, such as CO2 [4].
Promoting the use of public transportation entails two key approaches: increasing the supply of public transportation services and enhancing operational efficiency. However, augmenting the supply of public transportation faces cost-related challenges due to expenses associated with bus purchases and operational costs. To address this economic burden, recent efforts have focused on enhancing public transportation services through efficient operations based on the existing supply. A representative method for improving the efficiency of public transportation operations, based on limited resources such as bus stop locations and the maximum number of buses that can be operated, is the design of rational routes. To design rational routes, public transportation routes are mainly based on passenger demand between origins and destinations [5,6]. Are public transportation routes built on demand truly being utilized rationally? Demand-based public transportation routes may not reflect rational usage patterns due to differences between the operational methods of the constructed routes and the travel times calculated in the models used for route construction, compared to the actual travel times during operation. To examine this, an evaluation of the operational routes must be performed.
A network-level review is necessary to evaluate the routes. However, when examining the indicators used to evaluate existing public transportation services, operational aspects such as the number of operations, fares, punctuality, and safety are mainly utilized [7,8,9]. Therefore, this study aims to conduct a social network analysis (SNA) by considering the public transportation route system as a network. The network seeks to evaluate public transportation routes from two major perspectives. First, it assesses whether each bus stop within the network established by the public transportation routes is performing its appropriate role. Next, it examines the attributes and roles of the bus stops included in a single route to evaluate whether the role of the route is appropriate. To perform the evaluation, we aim to compare the roles of bus stops in two networks: the network established by public transportation route planning and the network constructed from actual passenger usage data. The evaluation of public transportation services from a network perspective will enable the design of rational routes based on actual usage data. This is expected to enhance the convenience of movement for public transportation users and increase the share of public transportation. Ultimately, this study aims to contribute to reducing the use of private transportation through increased public transportation use. Furthermore, it seeks to present sustainable development directions in the transportation sector by reducing carbon emissions through the decrease in private transportation use.

2. Literature Review

Public transportation, as a large-scale means of transport, emits fewer pollutants compared to private vehicles. Therefore, encouraging the use of public transportation aligns with the direction of sustainable development in the transport sector [10,11]. Accordingly, the transportation sector is promoting the use of public transportation to achieve sustainable development [12,13,14]. To encourage the use of public transportation, users must be satisfied with its services. To achieve this, it is necessary to understand which indicators can improve user satisfaction with public transportation. Historically, research related to public transportation has made significant efforts to identify key indicators for improving service quality and to establish priorities for these indicators. Fundamentally, survey-based analytic hierarchy process (AHP) analysis has been used to derive the priority of items [7,15], and some studies have used methodologies that complement the shortcomings of AHP to derive item priorities [8,9,16,17]. Table 1 summarizes the analysis methodologies and indicators used as public transportation service measurement variables in each study. The analysis indicators are divided into three levels of hierarchy, with the top-level (level 1) indicators ranging from one to four. It was found that the sub-indicators used under level 1 were consistent across studies. While there are some differences depending on the analysis method, most studies have identified transport quality as the most important factor [7,9,15]. However, at the lowest level, sub-indicators of service quality, such as appropriate route design and frequency of operation, were found to be significant [7,9,16].
Public transportation stops at designated stops based on predetermined routes, resulting in the availability of route paths and stop location data. Additionally, since public transportation users generally pay a fare each time they use the service, usage record data are also available. These diverse data can be utilized to measure public transportation services. As mentioned earlier, public transportation service analysis has been conducted using route utilization data such as access time, travel time, and average speed, as well as passenger usage data such as smart card data. The quality of public transportation services has been evaluated based on travel time and average waiting time derived from bus operation records and congestion levels based on passenger performance [18,19]. Studies have also been conducted to evaluate public transportation services by aggregating data at the operator level, such as the number of operating buses and the number of employees of the operating company [20]. Additionally, accessibility has been assessed based on bus routes established for specific facilities, such as medical facilities and tourist attractions [21,22].
When people travel, origins and destinations arise, and in the field of transportation, an origin/destination (OD) matrix is constructed based on these data. Since the OD matrix links origins and destinations as pairs, it can be represented as a single network. Similarly, road networks or public transportation networks also have origins and destinations, and since two areas are connected by roads or public transportation routes, they can be viewed as networks. Based on this network perspective, the transportation field conducts SNA to analyze connectivity and centrality. Analyses have been conducted on various modes of transportation, such as public transportation and aviation [23,24,25,26], as well as on specific purposes such as commuting [27]. Despite having relatively similar urban characteristics, unique structural features of each city’s public transportation system have been identified [23]. Even within the same area, differences in travel patterns have shown that the connectivity of public transportation users varies by time of day [24]. Similarly, centrality results analyzed from a national network perspective differed from those analyzed from a regional network perspective within the same area [27]. In the aviation network, 49.55% of degree centrality and 46.99% of betweenness centrality were occupied by airports located in the United States and China, and the busiest airport was found to be located in the United States [25,26].
A comprehensive review of previous studies indicates that various indicators have been examined as measures for public transportation services. Specifically, variables such as appropriate route design and frequency of bus operations have been identified as key indicators. Studies that evaluated public transportation services based on actual data primarily used public transportation route information and usage performance data. When evaluating public transportation services, the planned routes and the corresponding stop locations are crucial factors. However, most current studies only examine behavior at individual stops without considering the connectivity of public transportation routes. Although there are numerous studies in the transportation field that adopt a network perspective, these analyses are often based solely on usage volumes and simply assess the centrality and connectivity of specific points. Therefore, this study aims to analyze public transportation routes and stops by considering overall network connectivity. We intend to evaluate the public transportation network by constructing networks using actual public transportation usage data and current operating route information, and comparing the characteristics of stops in the two networks. By considering the characteristics of individual stops from a network perspective, we aim to assess whether the characteristics of the stops are appropriate and further examine the suitability of the routes that include these stops.

3. Methodology

Public transportation refers to publicly operated transportation systems, such as buses and subways, that run on fixed routes at regular intervals. The public transportation system includes various modes of transportation that offer services along predetermined routes. Consequently, the public transportation system can be seen as a unified network composed of nodes (bus stops or subway stations) and links (routes). From this perspective, the public transportation network can be analyzed using social network analysis.

3.1. Social Network Analysis

Social network analysis (SNA) is a social science technique first introduced by Branes in 1954 [28]. It explores the interactionsbetween actors (individuals or entities) by analyzing the structural and attribute characteristics of a social network through the relationships among the actors [29]. In SNA, actors are represented as nodes, and their relationships are represented as links, which allows for the analysis of how structural regulations influence actor behavior [30]. To perform this analysis, SNA utilizes abstract mathematical concepts from graph theory [30]. Recently, this network analysis approach has gained attention in various fields [31]. In particular, the use of SNA in other disciplines has become more prominent since Lee et al. [32] demonstrated that SNA can be effectively applied not only in social studies but also in other fields. For example, El-adaway et al. [33] utilized SNA to identify high-traffic areas in the field of transportation, and Zhou and Irizarry [34] constructed a subway collapse network and predicted secondary accidents through SNA based on the constructed network.

3.1.1. Centrality

Centrality refers to the measurement used to identify crucial elements in a network. Nonetheless, there is no universally accepted definition for the term “centrality” [35,36]. Various types of centralities exist, including degree centrality, closeness centrality, betweenness centrality, eigenvector centrality, and beta centrality. In this study, we conducted an analysis focusing on degree centrality and betweenness centrality.
Degree centrality refers to the number of connections that a node has with other nodes in the network. It allows for us to determine how many nodes are directly linked to a particular node. The mathematical formula for calculating degree centrality is shown in Equation (1).
C D i = j m i j
where C D i denotes the degree centrality of node i. If node i and node j are connected, m i j takes the value of 1; otherwise, it takes the value of 0 [30]. Degree centrality is influenced by the size of the network. To eliminate the influence of network size, a standardized degree centrality measure is calculated. Standardized degree centrality is obtained by dividing the degree centrality of a node by the total number of nodes in the network, g, minus one. This can be expressed in Equation (2).
C D i = C D i ( g 1 )
Betweenness centrality measures the extent to which a node controls or mediates relationships between nodes that are not directly connected. Consequently, the calculation of betweenness centrality encompasses the entire network. It quantifies the extent to which a node is positioned on the shortest paths between other actor pairs in the network, excluding itself. The formula for calculating betweenness centrality is shown in Equation (3).
C B i = j , k g j k ( i ) g j k
where C B i represents the betweenness centrality of node i, g j k denotes the number of shortest paths from node j to node k (j, k   i), and g j k ( i ) indicates the number of shortest paths from node j to node k that pass through node i [30]. Similar to degree centrality, betweenness centrality is also influenced by the size of the network. Therefore, the standardized betweenness centrality is calculated as shown in Equation (4).
C B i = C B ( i ) M a x   C B ( i )

3.1.2. Broker

A broker refers to a node that mediates relationships within or between groups. The concept of brokerage pertains to the node’s role as an intermediary, facilitating relationships between the node and its neighbors within or between groups. Brokers can be classified into five types: coordinator, consultant, representative, gatekeeper, and liaison [37]. The characteristics of brokers can be summarized as shown in Figure 1.
To explain the classification of brokers, let us assume there are three nodes, A, B, and C, and that we are constructing a network where A is connected to B and B is connected to C. In this scenario, B is referred to as a broker, and the designation given to broker B is distinguished based on which group each node belongs to. When the node responsible for the broker role and the two nodes connected by the broker are all part of the same group, the broker is referred to as a coordinator. Within a single company, the person responsible for coordinating tasks between employees A and C can be referred to as a coordinator. A consultant is a broker connecting two nodes that belong to different groups. This role is similar to that of a stockbroker. Assuming both the seller and the buyer are considered customers within the same group, the stockbroker intermediates transactions between them as a different group.
When connecting nodes belonging to different groups, if the originating node and the broker are in the same group, it is termed a representative; if the destination node is in the same group, it is called a gatekeeper. An example of a representative could be a company spokesperson, while a gatekeeper could be a statistical office collecting information from citizens and passing it on to government agencies. When all nodes belong to different groups, the node performing the role of a broker is referred to as a liaison. For instance, when a farmer sells products to a large mart, the company handling distribution can be called a liaison. From the perspective of stops, the roles of each broker can be described as follows: The coordinator acts as a major transfer stop within the region. The consultant represents situations where travel within the same region necessitates passing through other regions, making it an inefficient stop from the standpoint of the public transportation network. The representative and gatekeeper are transfer stops located at the boundary of the region when the departure and arrival points belong to different groups. The liaison is a hub transfer stop for long-distance travel, occurring when the departure, arrival, and transfer points all belong to different regions.
The brokerage score is categorized into five types based on the broker’s role. When considering nodes i, j, and k, if two endpoints belong to the same group, they are denoted as W; if they belong to different groups, they are denoted as B. If a broker is in the same group as another node, it is denoted with a subscript I; if it is in a different group, it is denoted with a subscript O. Thus, the five types of brokers are represented as W I , W O , B I O , B O I , and B O . This classification of brokers is formalized in Equation (5), where the explanation is based on W I (coordinator).
W I j = i N K N W I i k ,    ( i j k )
W I j refers to the brokerage score of node j. Here, n represents the total number of nodes, and W I j (ik) takes the value of 1 if ijk is true and 0 if false. In Equation (5), the score for the coordinator is calculated, meaning that ijk implies m i = m j = m k . Here, m i denotes the group to which node i belongs. If the score for the consultant is to be calculated, then ijk would mean m i = m j m k . For detailed mathematical equations for each type of broker, see Gould and Femandez [37].

4. Study Area

To assess the role performance of public transportation stops from a network perspective, data on the locations of public transportation stops and route information are required. Additionally, to compare the actual travel patterns with the current operational public transportation network, real passenger data at the stop level must be used. The data used in this study are provided by the Ministry of Land, Infrastructure, and Transport of South Korea. The ministry provides smart card data, including public transportation stop locations, route details, and boarding and alighting counts at each stop. To construct the public transportation origin/destination (O/D) matrix based on smart card data, information on both the departure and destination points is required. In some areas outside major cities, passengers are not required to tag-off when using the bus, resulting in no records of alighting stops. Although there are methods to estimate alighting stops based on boarding tag records [38], to avoid errors resulting from estimation, we designated one of the major cities where alighting tagging is mandatory as our setting. Among several cities, we selected Hwaseong City in Gyeonggi Province, South Korea. Hwaseong City represents a mix of urban and rural characteristics. Globally, there has been a significant change in transportation patterns due to the coronavirus disease 2019 (COVID-19) outbreak at the end of 2019. By examining the public transportation usage changes in Hwaseong City using transportation card data, it was found that the number of trips decreased by approximately 25.7% from 52,540,287 trips in 2019 to 39,038,373 trips in 2020. The most recent data in 2022 showed that the number of trips was 49,885,284, still slightly lower than in 2019, before the COVID-19 outbreak. To exclude the COVID-19 effects, all data used in the analysis were collected based on the 2019 period.
Hwaseong City is one of the cities in the metropolitan area of South Korea, with a population of approximately 0.82 million residents as of 2019 [39]. The city is divided into four eup, nine myeon, and fifteen dong as administrative divisions. Because of the relatively smaller area of the fifteen dong compared to the eup and myeon, they were grouped together as one region for analysis in this study. Hwaseong City has only one subway station, making intracity travel via subway infeasible. Consequently, as this study focuses on the city, only the bus network was selected for analysis, excluding the subway network.
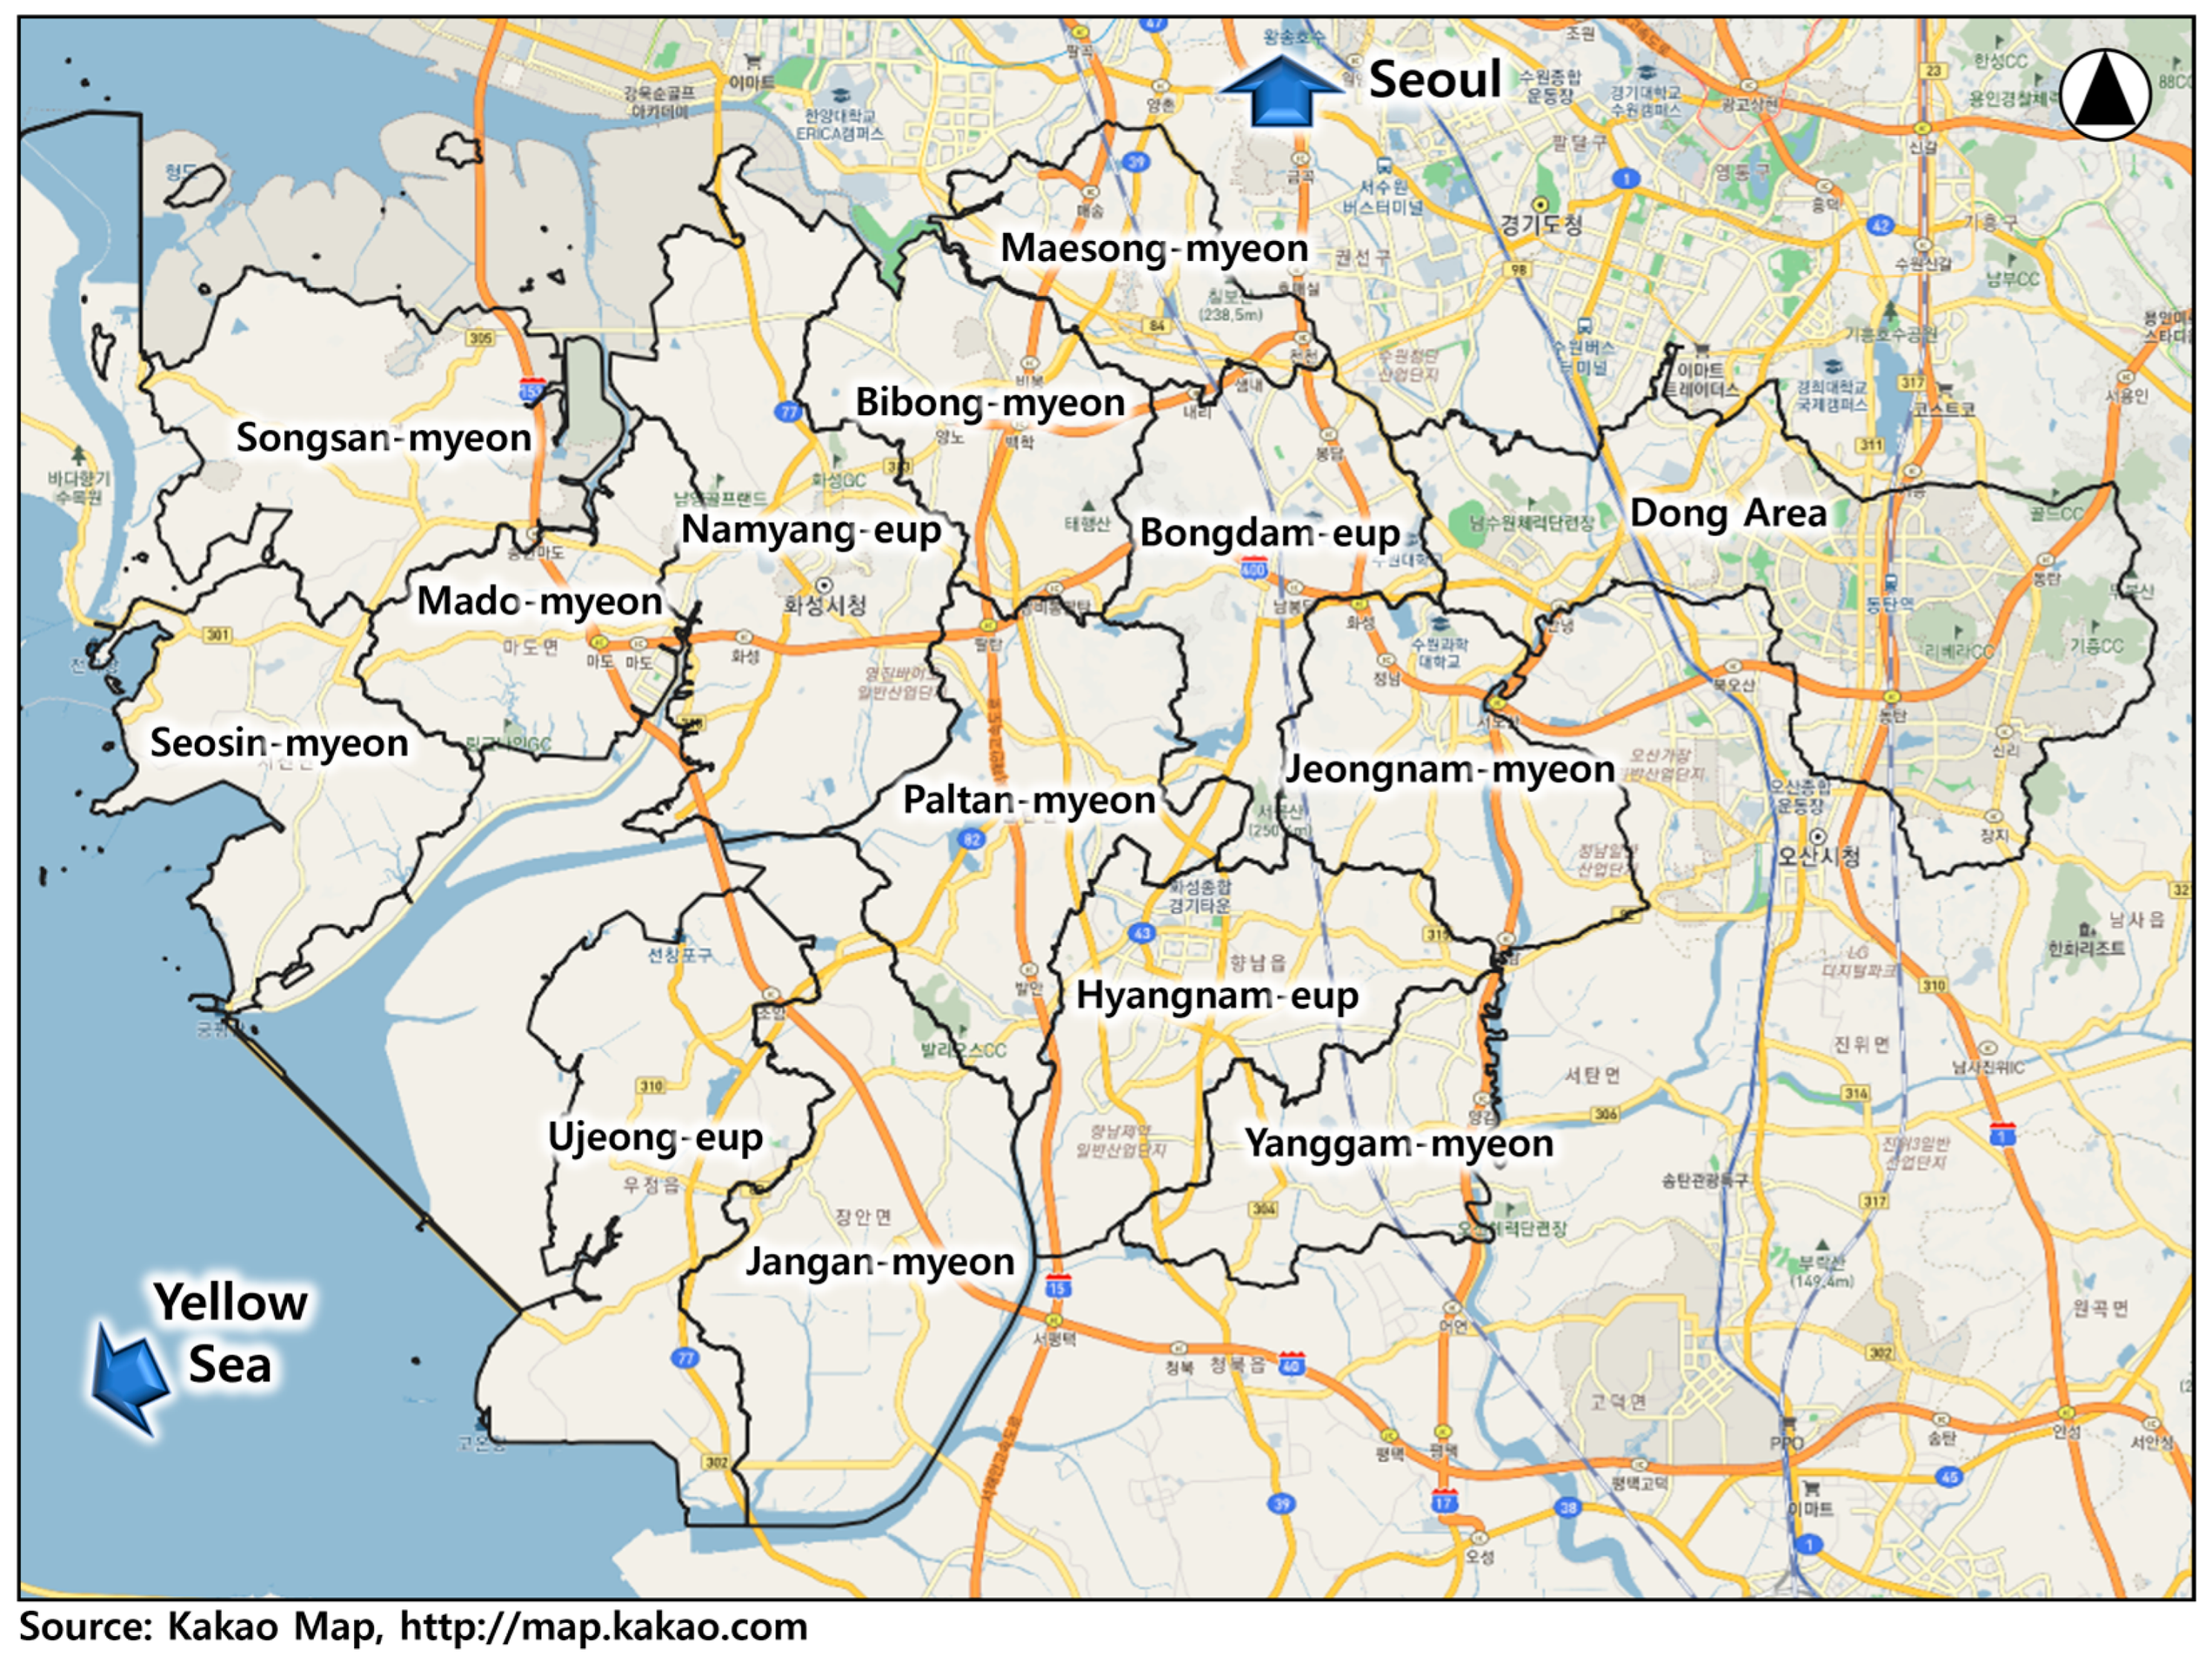
Hwaseong City is located south of Seoul, the capital of South Korea, and the Yellow Sea lies to the west of Hwaseong City. The location of this city and its internal administrative districts are shown in Figure 2.

4.1. Population Distribution

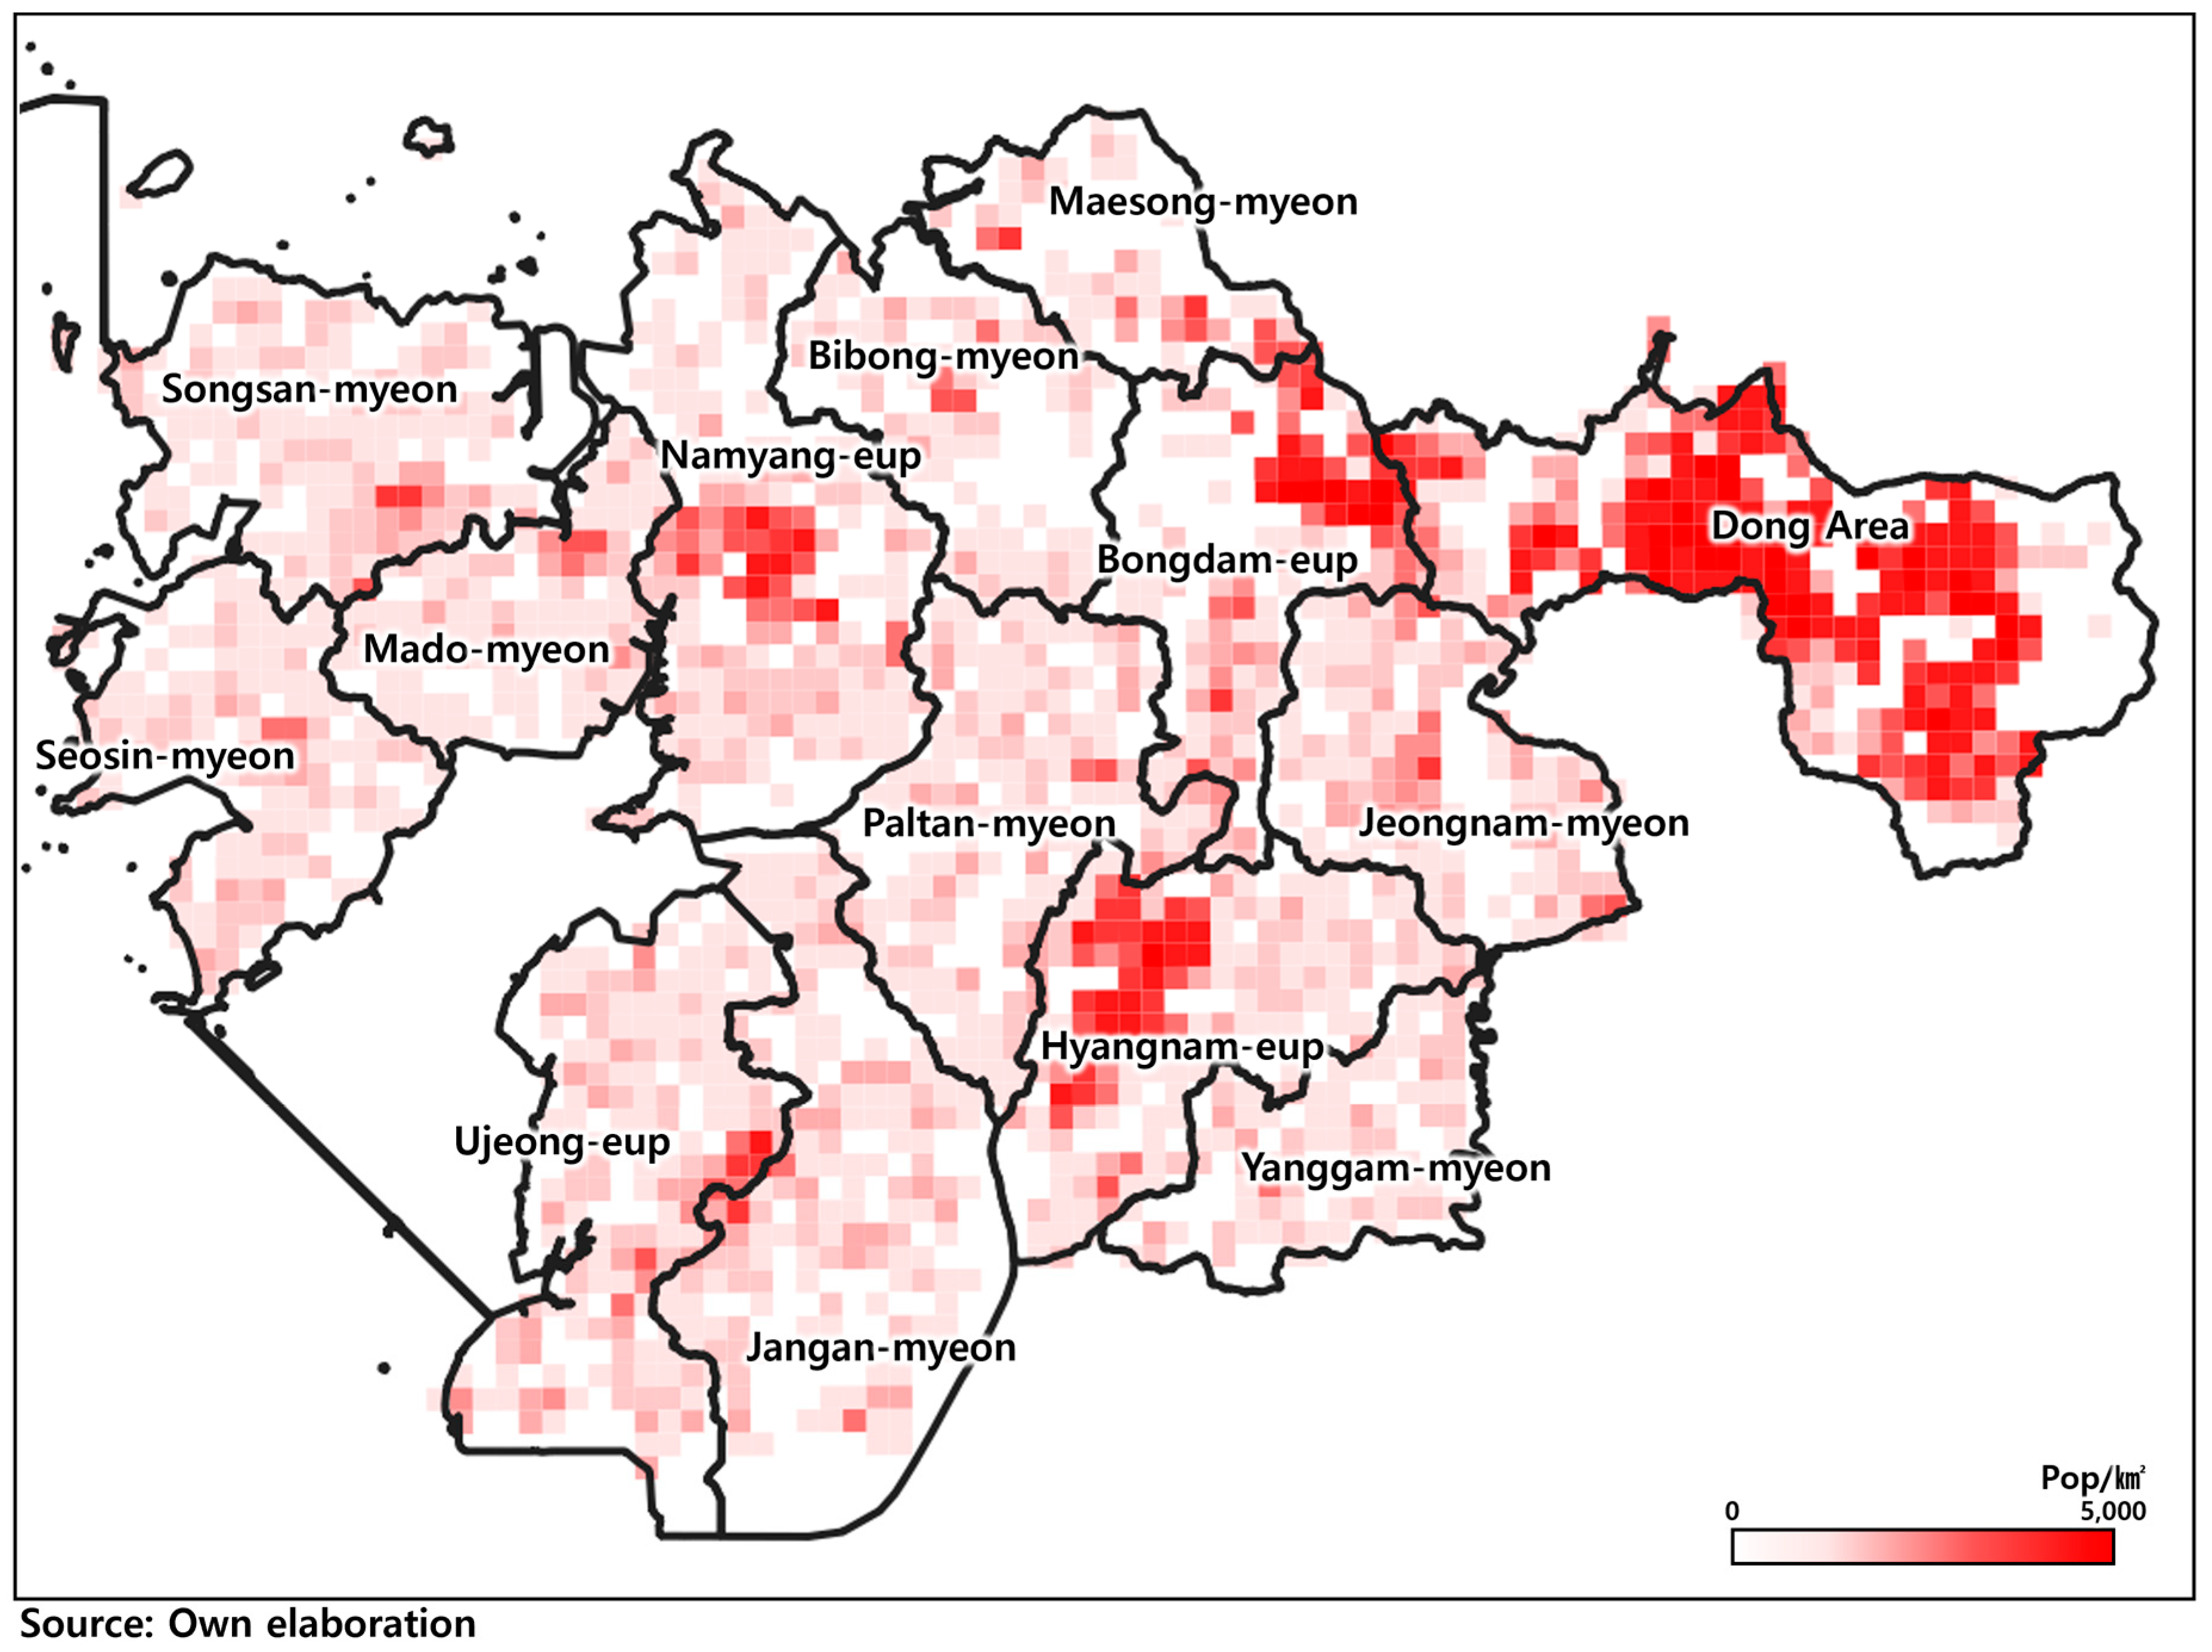
The results of calculating the population density for each 500 m grid in Hwaseong City are shown in Figure 3. The figure was created using QGIS 3.16, a software program commonly used for visualizing spatial data. Subsequent tasks, such as marking the locations of bus stops and displaying the analysis results, were also performed using the same software. It is evident that certain areas have a higher concentration of residents. There are a total of four areas with a population density of over 1000 persons per square kilometer (Namyang-eup, Bongdam-eup, Hyangnam-eup, and the Dong area). The central part of Namyang-eup shows a relatively high population density, which can be attributed to the presence of the city hall in that area. Similarly, Hyangnam-eup exhibits a high population density as it served as the initial central district of Hwaseong City. In the case of Bongdam-eup, higher population densities are observed in the neighboring areas, which can be explained by the presence of three universities (Jangan University, Hyupsung University, and Suwon University) in that region. Lastly, the Dong area shows the highest population density. This is mainly due to various new town developments in the area, leading to an increase in the residential population. In particular, the establishment of large-scale residential areas as part of the new town developments has significantly contributed to the urban nature of this region compared to other areas.

4.2. Public Transportation Stations

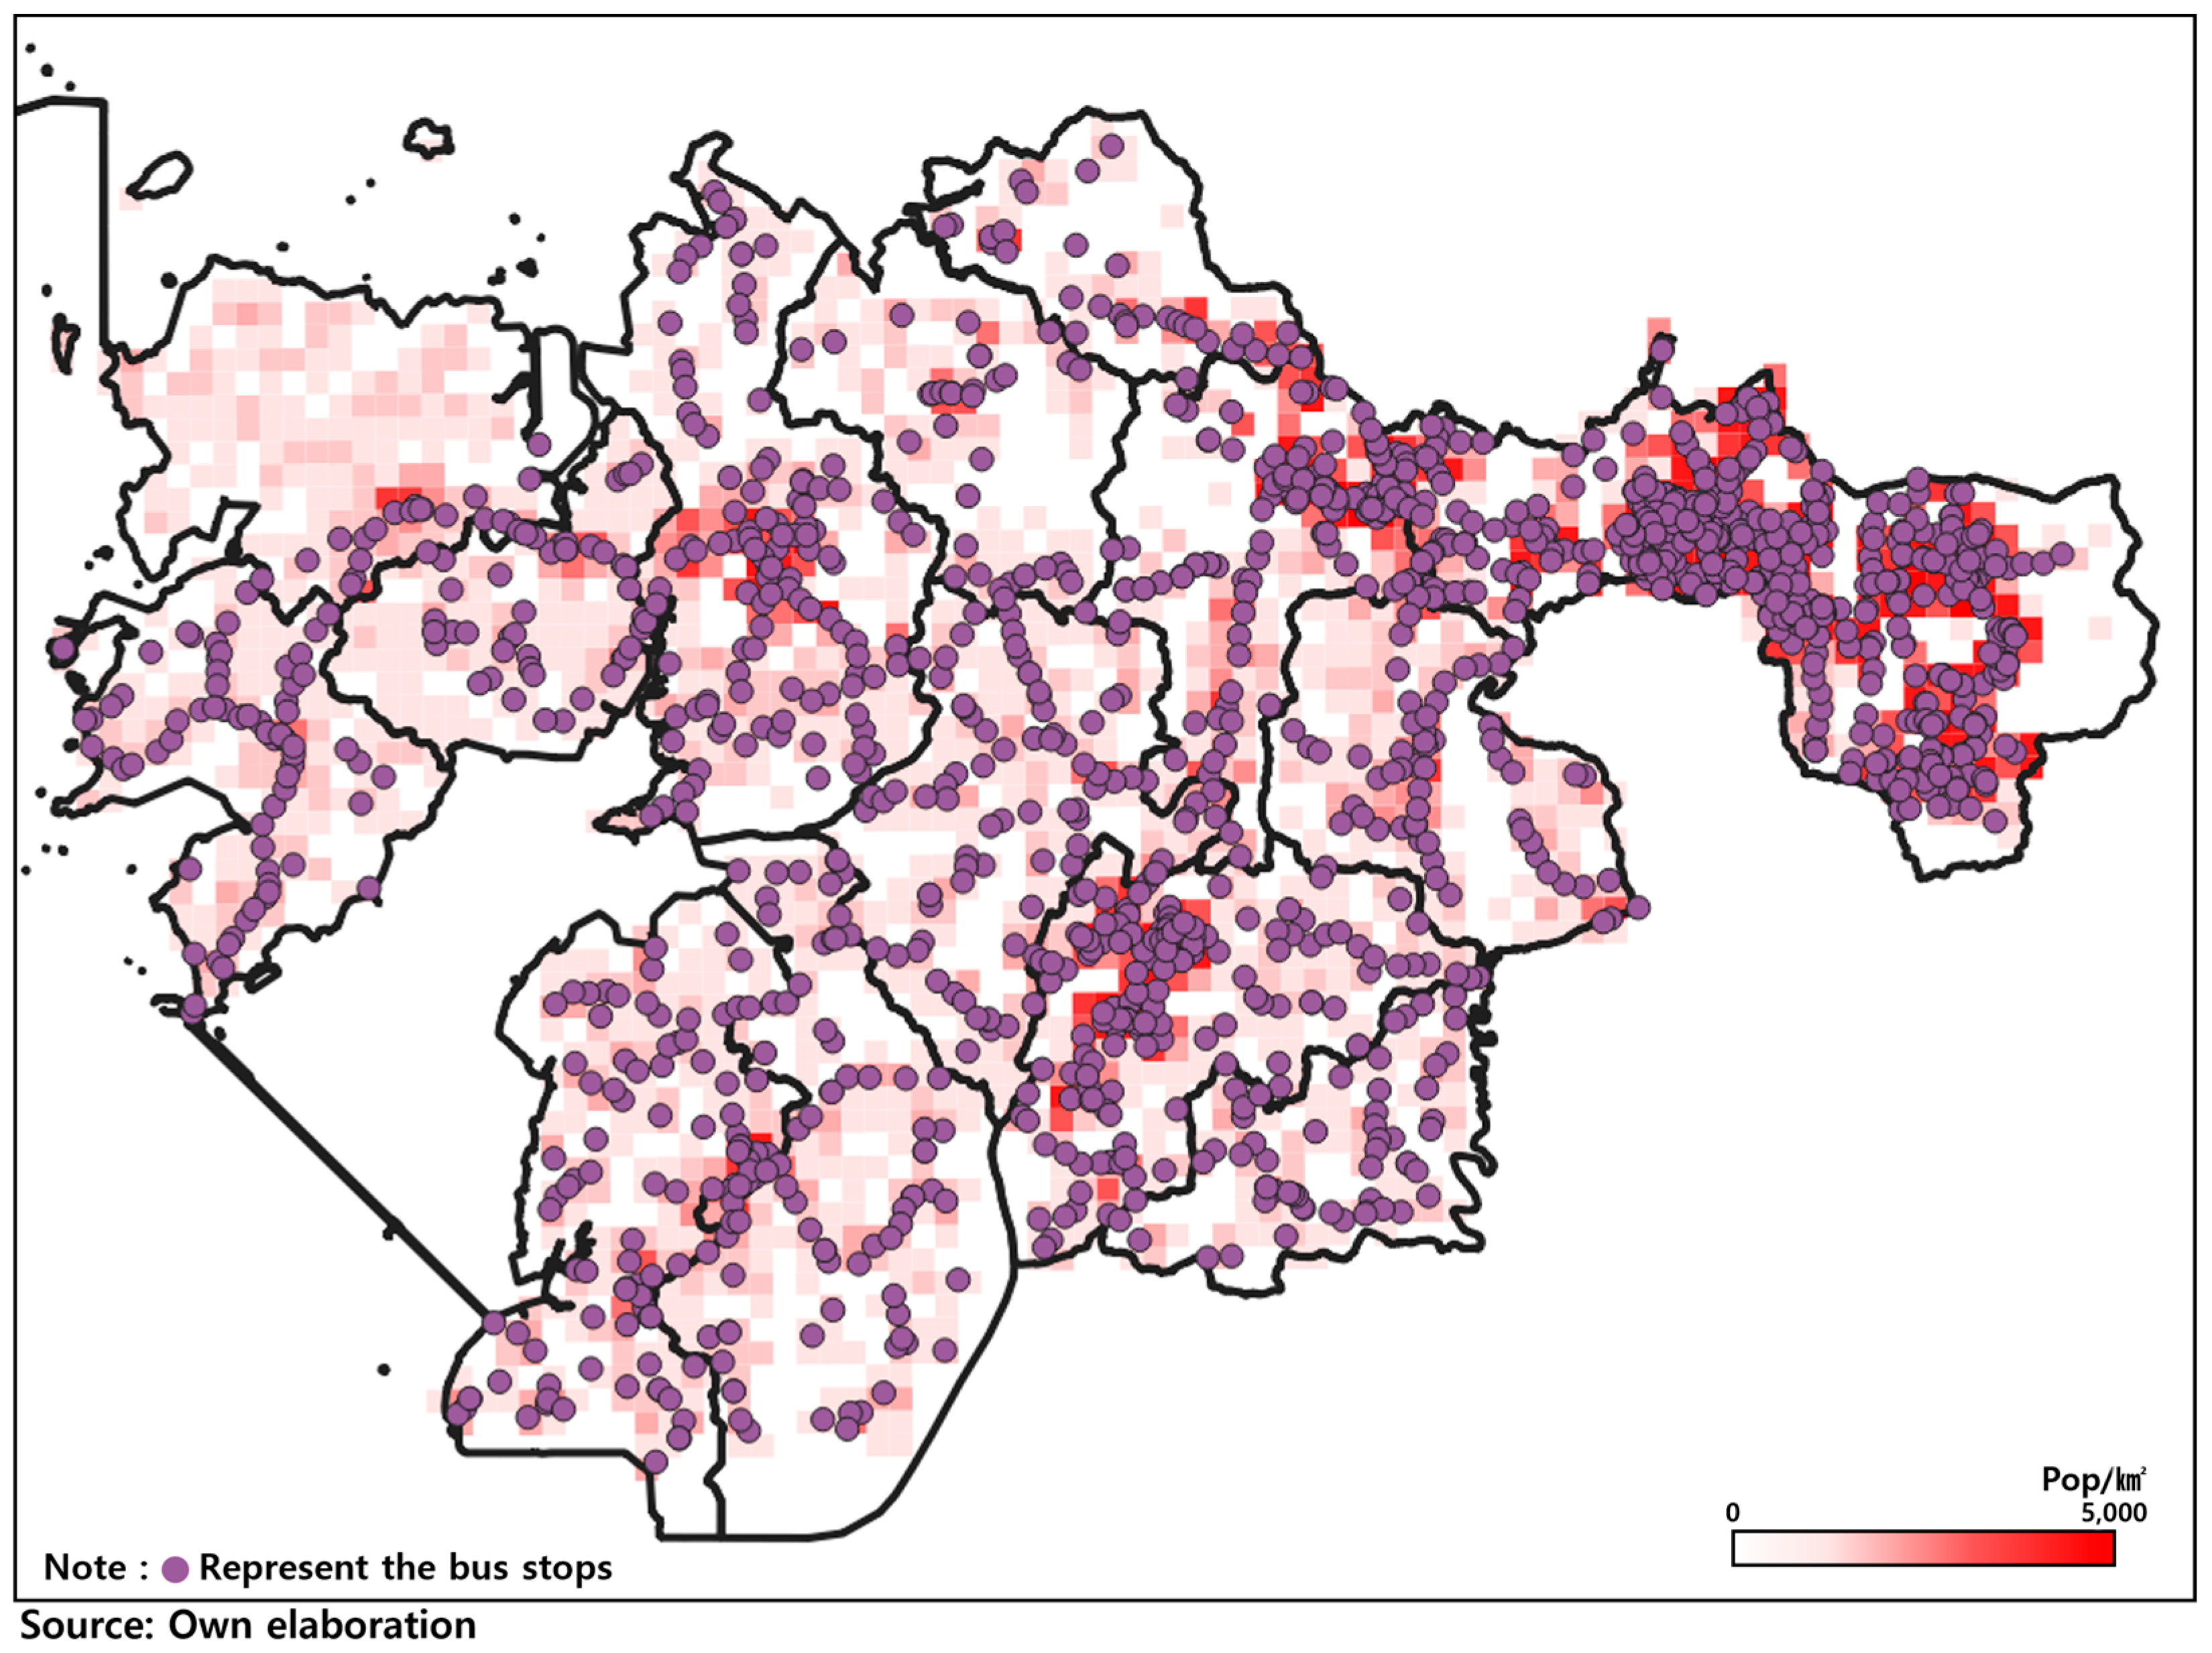
In Hwaseong City, there is a total of 2482 bus stops and 1 subway station. Typically, bus stops are located with one stop for the inbound direction and one stop for the outbound direction. To evaluate the connectivity of public transportation routes, the inbound and outbound stops should be considered as a single stop. Therefore, a total of 1396 bus stops were selected as the analysis targets after combining the inbound and outbound stops. Since there is only one subway station located within Hwaseong City, it was excluded from this study since examining its connectivity based on subway routes was not feasible.
The distribution of bus stops in Hwaseong City is depicted in Figure 4, showing a similar pattern to the population density distribution. However, in the case of Songsan-myeon, some areas do not have bus stops, which is likely due to data omissions. Consequently, Songsan-myeon was excluded from the analysis. However, to consider the overall route connectivity, the available bus stop information in Songsan-myeon was still included in the analysis.
Examining the number of stops in each region, the Dong area has 436 stops, accounting for approximately 31.2% of all stops. The number of stops in eup regions ranges from 96 to 144, while the myeon regions have between 31 and 88 stops.

4.3. Public Transportation Ridership

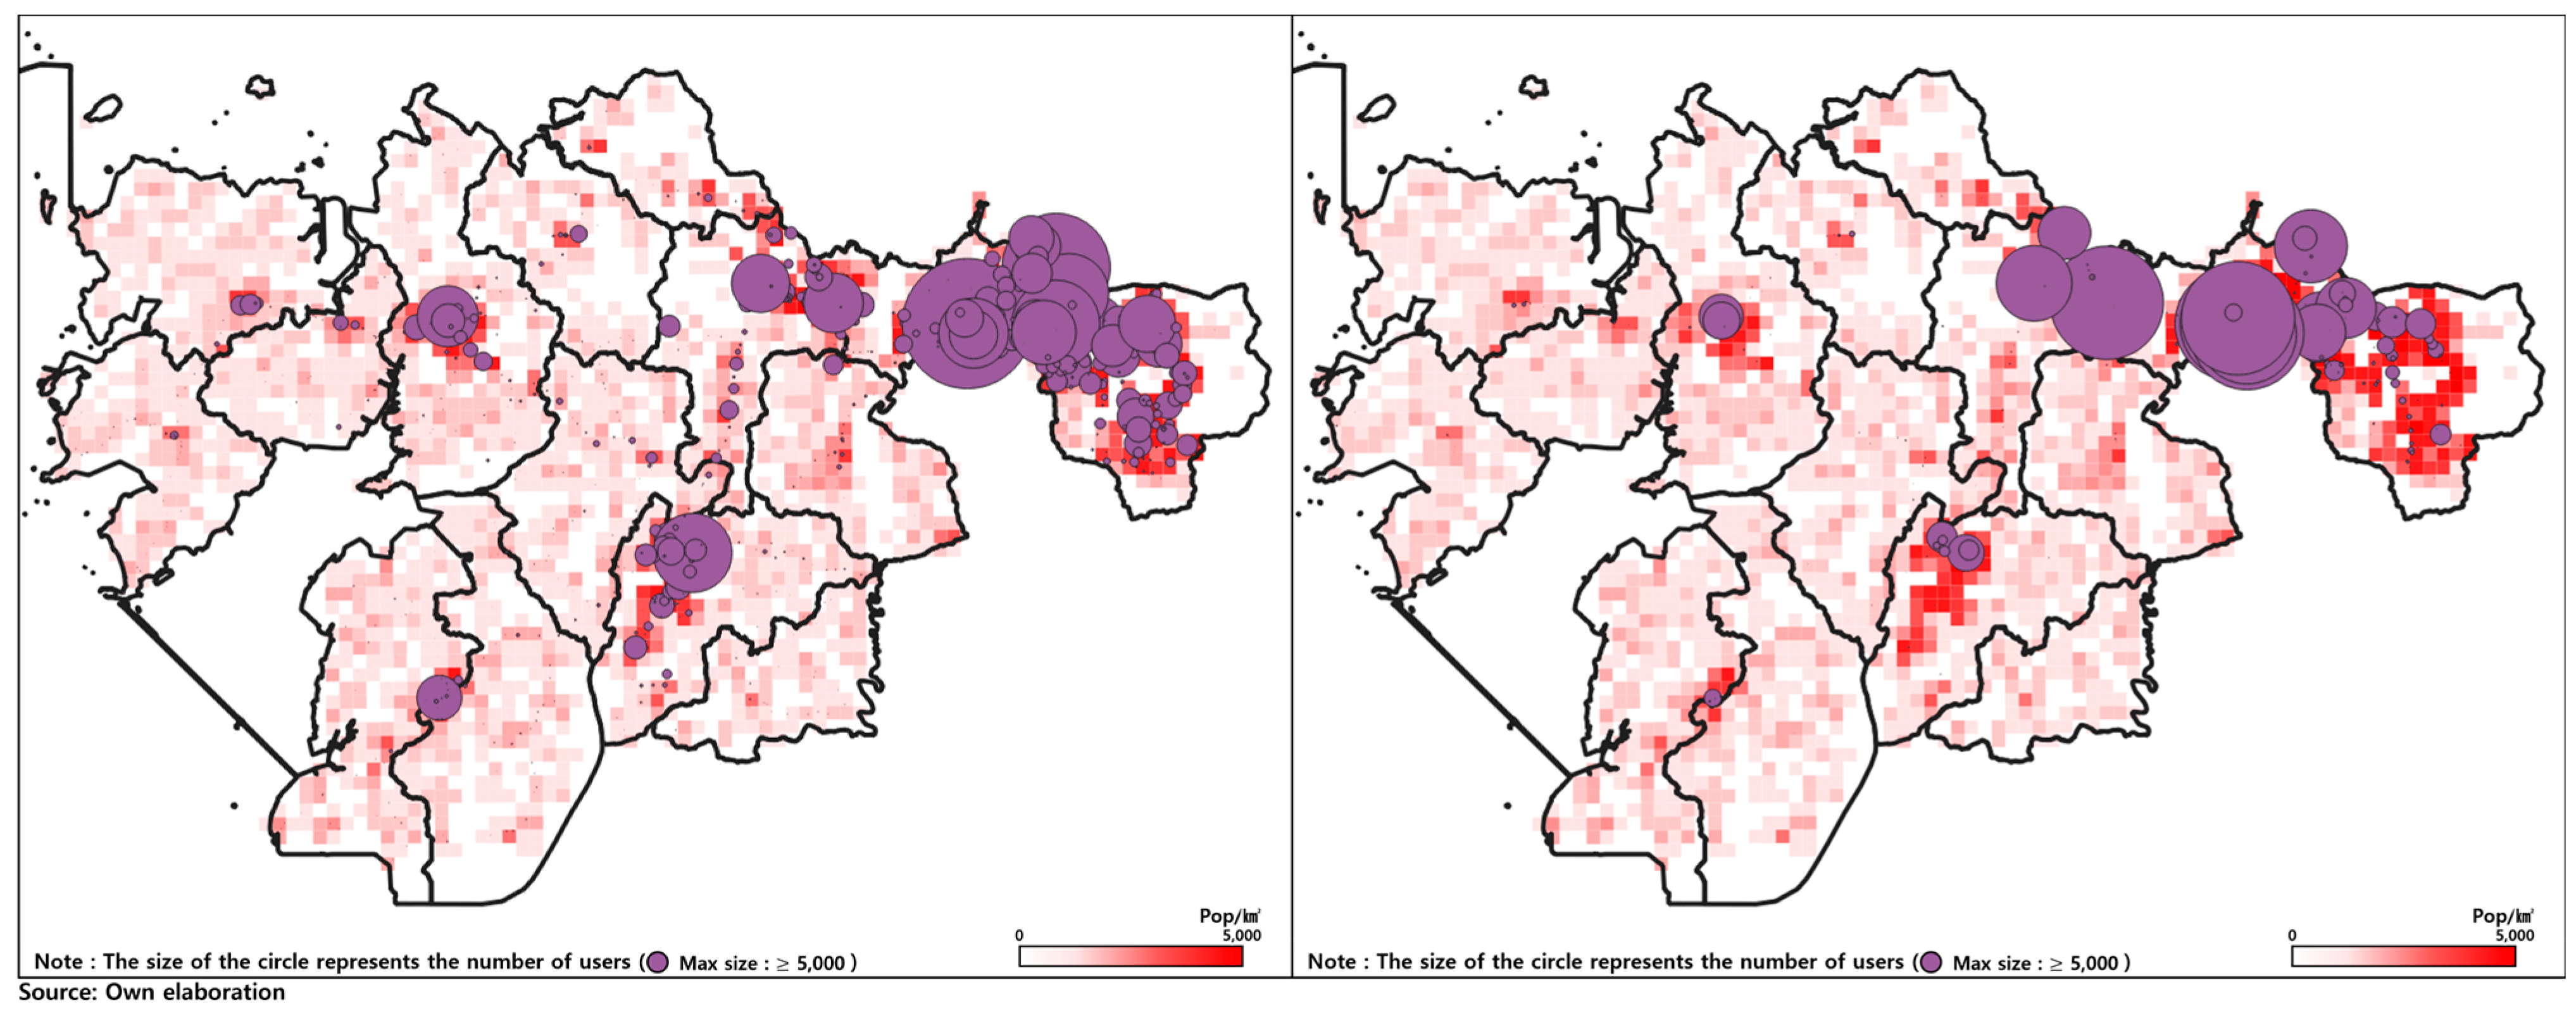
The boarding and transfer volumes at each bus stop are shown in Figure 5. As expected, the boarding volume at each bus stop is significantly higher in areas with higher population density. Transfers between buses are mainly observed at the periphery of areas with high population density. This can be attributed to the fact that densely populated urban centers often require transfers due to the operation of multiple public transportation routes. A noteworthy observation is that the top five bus stops with the highest transfer volumes are located within a 500 m radius. According to Table 2, these five bus stops account for approximately 40.9% of the total transfer volume in Hwaseong City. The reason for the high transfer volumes is likely the presence of a subway station (Byeongjeom Station) near these bus stops.

5. Evaluation of the Public Transportation Network

For conducting the SNA, we utilized UciNet, an SNA tool, to perform an analysis of bus stop locations considering the public transportation network system. We compared the suitability of bus stop locations from a network perspective by analyzing the results of two networks: one based on the operated bus routes and the other based on actual passenger volume at each bus stop. The public transportation usage data used for analysis was from 17 October 2019, to exclude the impact of COVID-19. The SNA focused on three aspects: degree centrality, betweenness centrality, and brokerage role analysis. In a network based on bus routes, stops included in the same route are all connected to each other. For example, if a single route includes stops 1, 2, 3, and 4, connections between nodes 1 and 2, 1 and 3, 1 and 4, 2 and 3, 2 and 4, and 3 and 4 are created. In a network based on passenger volumes, each trip represents a connection between nodes. Smart card data only contain information on the user’s first boarding stop and final alighting stop, without data on transfer stops. Therefore, the network based on actual passengers is constructed using the initial boarding and final alighting stops of the passengers. For instance, if a passenger boards at stop 1 on route A, transfers at the same stop to route B, and then alights at stop 3, a connection between nodes 1 and 3 is created. The two constructed networks thus have a structurally identical form.
Network analysis was performed on the two networks using the same methodology described in Section 3. Passenger boarding and alighting points cannot exist at locations without bus stops. However, bus stops may exist without any passengers. This difference can lead to a size discrepancy between the two networks. To eliminate the impact of size differences on the results, all calculated outcomes were standardized. Therefore, the results presented in this analysis are all standardized values.

5.1. Degree Centrality

According to the analysis of degree centrality based on bus routes, the average degree centrality of the network was 2.67%, with Balansamgeori bus stop in Hyangnam-eup having the highest degree centrality at 3.09%. In contrast, in the network based on bus stop passenger volume, the average degree centrality was 0.04%, with the highest degree centrality observed at Byeongjeom-sageori bus stop in the Dong area, reaching 0.83%. The degree centrality was generally lower in the passenger volume network, which can be attributed to the presence of many OD pairs between bus stops with no actual passenger volume.
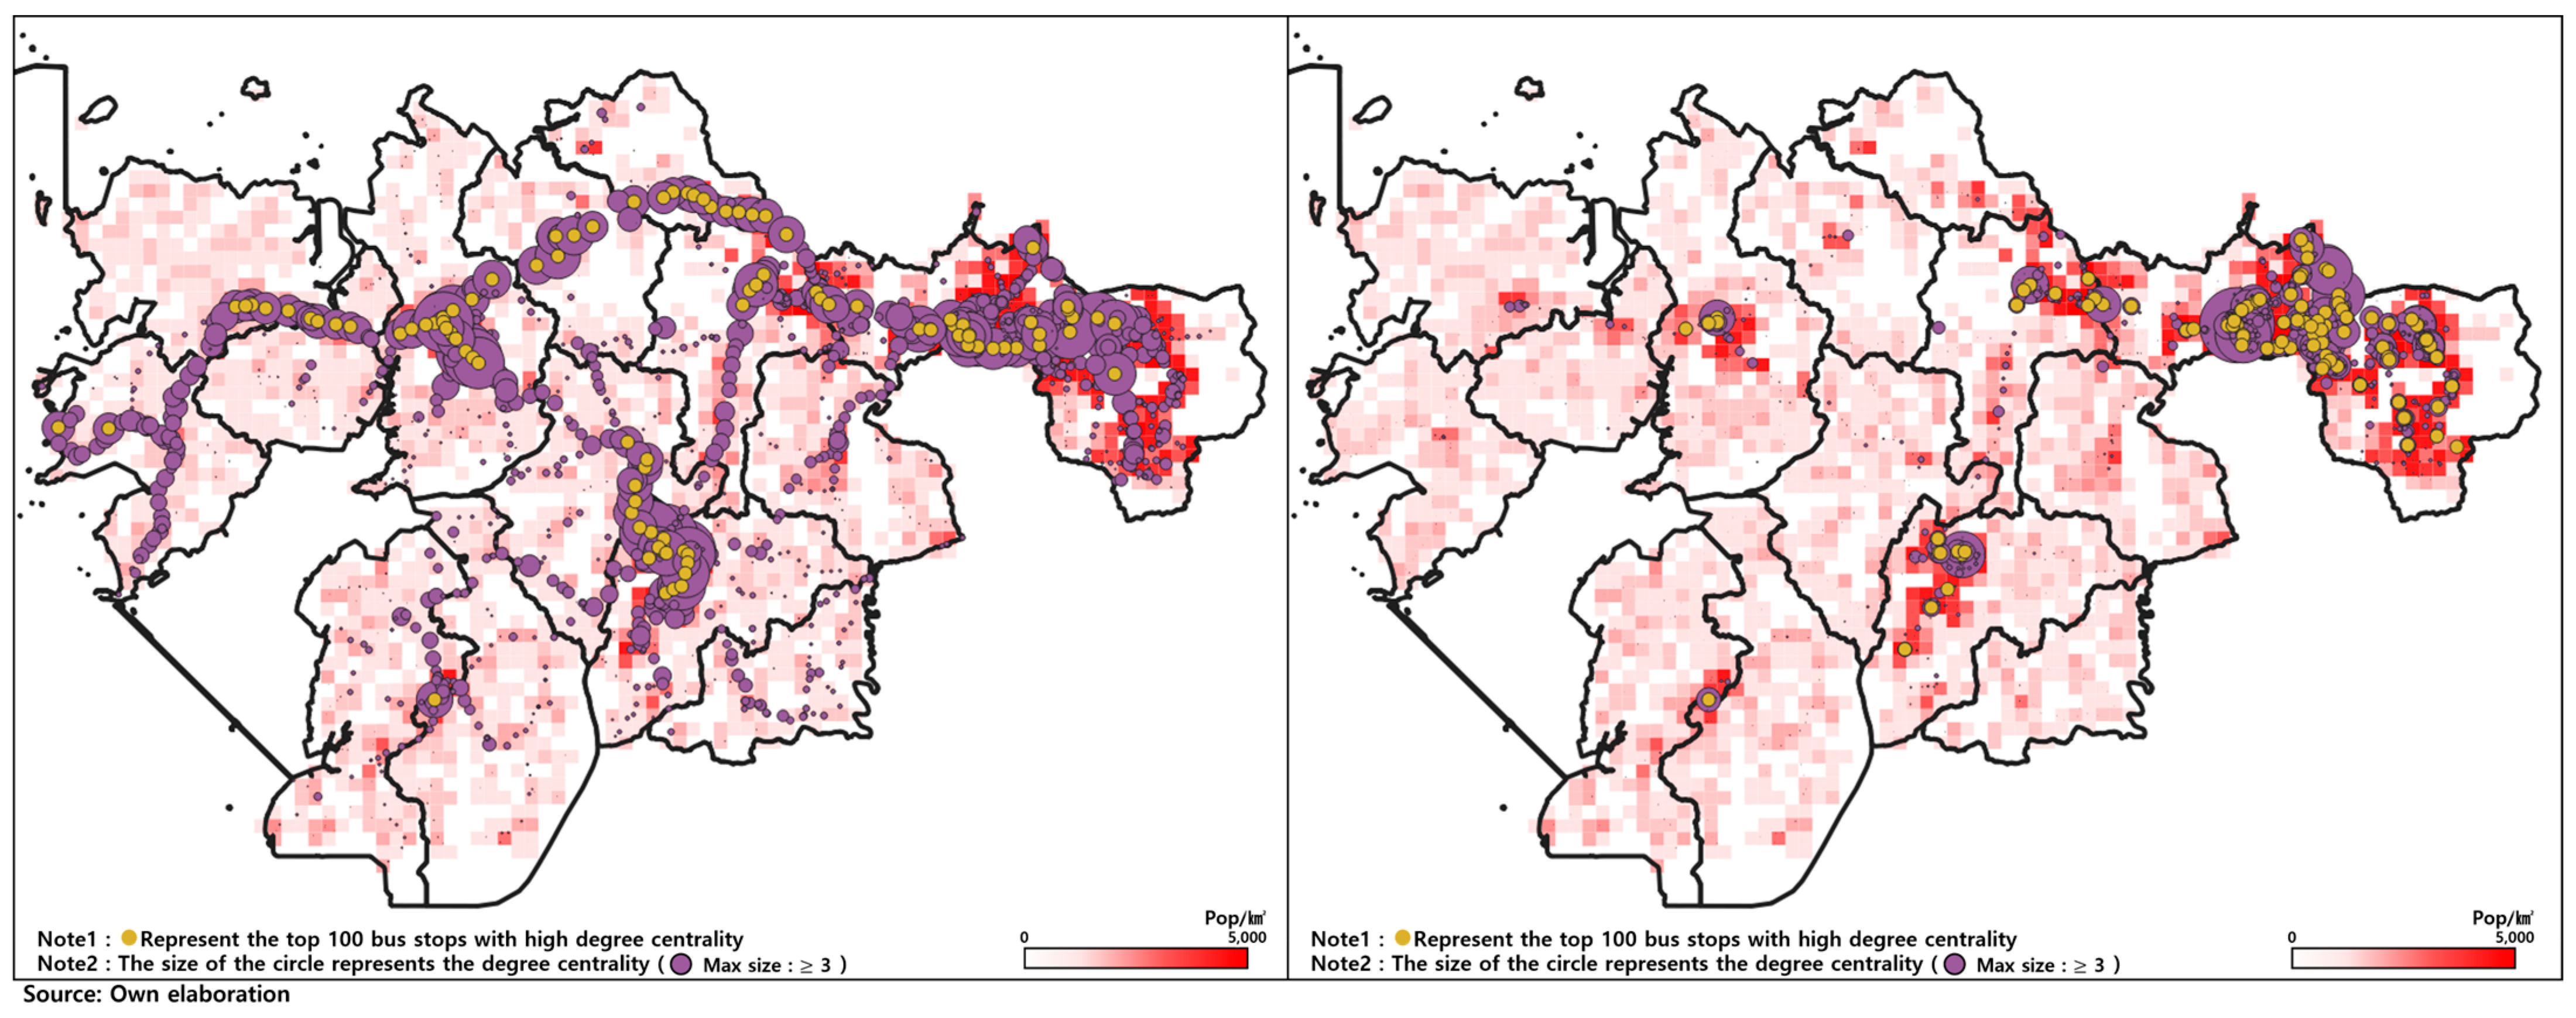
The degree centrality for each bus stop and the top 100 bus stop locations based on degree centrality are shown in Figure 6. When examining the bus stops with high degree centrality in the route network, they form the major backbone following the shape of Hwaseong City. Moreover, there is a considerable concentration of bus stops with high centrality in densely populated areas. In the southern part, the bus stops leading to Ujeong-eup and Jangan-myeon show lower degree centrality compared to other areas. This indicates relatively lower connectivity of Ujeong-eup and Jangan-myeon with other regions. On the other hand, when considering the degree centrality in the network based on bus stop passenger volume, the bus stops with high centrality are found to be clustered in areas with high population density. Naturally, this is due to the higher passenger usage in areas with a larger population.
When comparing the top 100 bus stops with high degree centrality in each network, only 37 bus stops are common to both networks. In the route network, the top 100 bus stops are distributed in a linear pattern, similar to the shape of Hwaseong City. This distribution suggests that the public transportation routes in Hwaseong City are primarily designed to connect different regions. On the other hand, in the passenger volume network, the top 100 bus stops are densely concentrated in areas with high population density. This indicates that actual passenger patterns occur within each region.
The bus stops with high degree centrality in areas such as Dong area, Bongdam-eup, Hyangnam-eup, and Namyang-eup, which include regions with high population density, are primarily concentrated in those high-density areas. On the other hand, in areas like Seosin-myeon, Jeongnam-myeon, and Yanggam-myeon, where the population density is generally low, the bus stops with high degree centrality are distributed in a linear pattern, similar to the route-based analysis results. This suggests that in densely populated urban areas, the bus stops mainly serve to connect movements within the region, while in sparsely populated rural areas, the bus stops play a significant role in connecting movements between regions.

5.2. Betweenness Centrality

The sizes of betweenness centrality and the locations of the top 100 bus stops with high betweenness centrality are shown in Figure 7. Bus stops with high betweenness centrality are concentrated in specific areas in both the route network and the passenger volume network, but there are differences in their locations. In the route network, the bus terminal at Joam in Ujeong-eup has the highest betweenness centrality value of 9.398. Considering the second highest betweenness centrality value of 2.957, the betweenness centrality of Joam terminal is relatively high. This can be attributed to Joam terminal being a major terminal for intracity buses in Hwaseong City. In the passenger volume network, bus stops with high betweenness centrality are found in Ujeong-eup, Namyang-eup, Hyangnam-eup, Bongdam-eup, and Dong-area. Given Hwaseong City’s geographical shape, these locations represent points where bus routes converge, resulting in higher betweenness centrality values.
In contrast to the degree centrality analysis results, the betweenness centrality analysis results showed relatively similar outcomes between the route network analysis and the passenger volume network analysis. It was found that 61 bus stops were included in the top 100 rankings in both networks. This implies that bus stops designed as major transfer points from a route planning perspective also experience a significant amount of actual transfer activity. To further investigate the relationship between high betweenness centrality and actual transfer activities, we compared the list of the top 100 bus stops with high betweenness centrality to the list of bus stops with a high number of transfer passengers (refer to Figure 4). As a result, 67 bus stops were found to be present in the top 100 rankings in both analyses.
Betweenness centrality was generally higher in the passenger volume network analysis compared to the route network analysis. This indicates that actual bus users tend to heavily utilize certain routes that pass through bus stops with higher betweenness centrality. In the route network analysis, all routes are weighted equally when calculating betweenness centrality. However, in the passenger volume network analysis, weights are applied based on the actual passenger usage. As a result of these weights, betweenness centrality calculated based on passenger volume tends to yield larger values.

5.3. Broker

For the brokerage analysis, Hwaseong City was divided into 14 groups based on the administrative divisions of “eup-myeon-dong”, and the 15 individual dong regions were merged into one group. To assess the efficiency of each node in performing the brokerage role, the relative brokerage score is calculated by dividing the brokerage score by the expected value. The nodes with brokerage scores greater than 1 indicate that they are effectively performing the brokerage role in the network. Therefore, an analysis was conducted on bus stop locations with relative brokerage scores equal to or greater than 1.

5.3.1. Coordinator

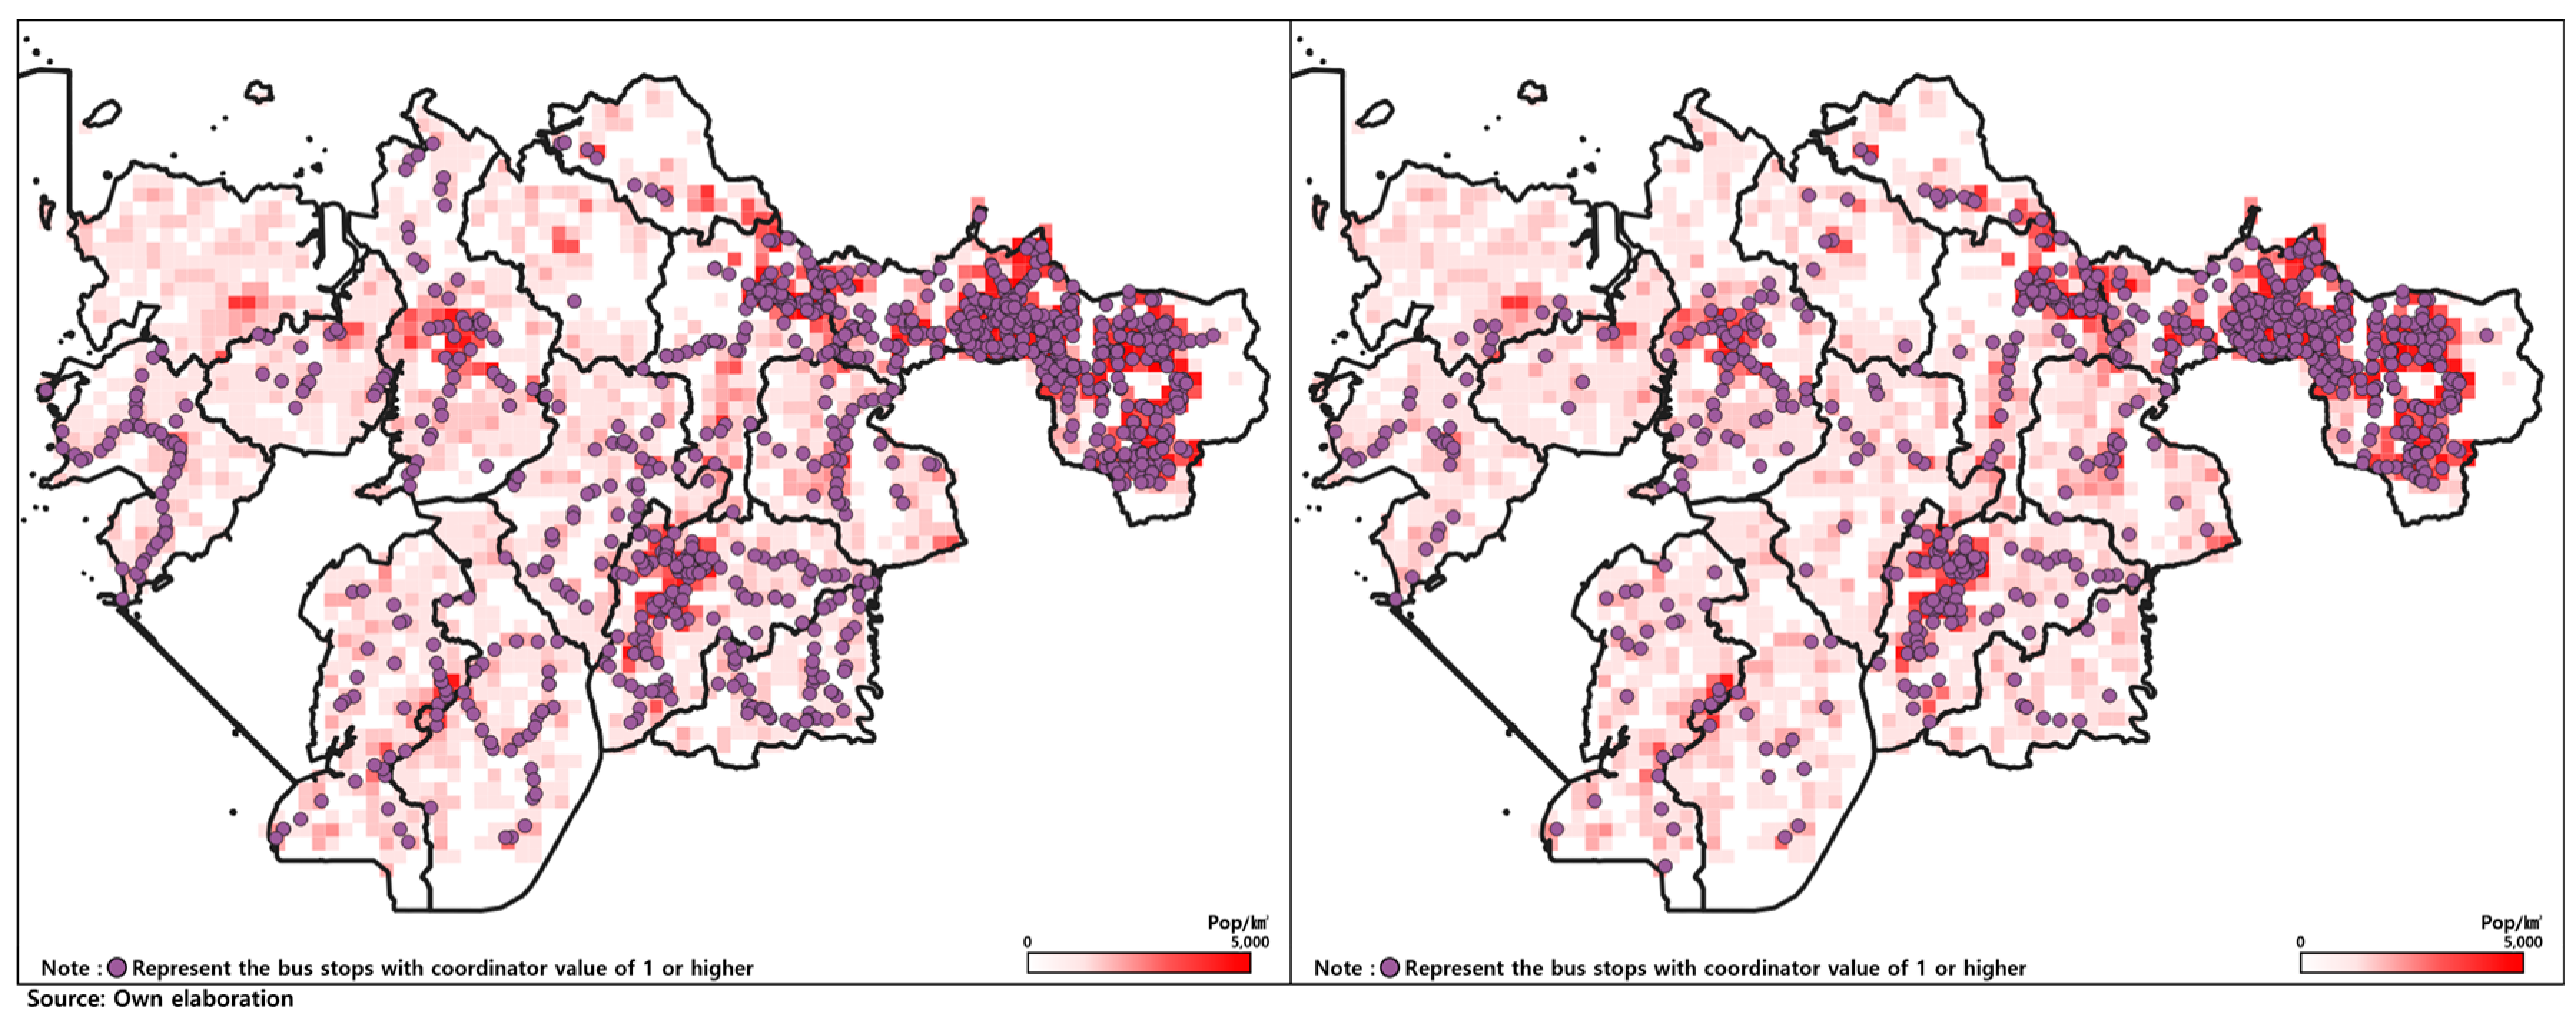
The bus stop locations performing the coordinator role are shown in Figure 8. Bus stops with high coordinator brokerage scores indicate well-connected bus routes. Therefore, when the bus stops with high coordinator relative scores are evenly distributed within a group, it suggests that the bus routes within that group are uniformly constructed. In most groups, coordinator bus stops are concentrated in high-density areas, forming a road network pattern. When examining the distribution of coordinator bus stops based on passenger volume network analysis, the results are generally similar to the route network analysis; however, some groups show differences. For example, in Group Bibong-myeon, only one coordinator bus stop is identified based on the route network analysis, but six coordinator bus stops are identified based on the passenger volume network analysis. The absence of a coordinator within a group means that there is no need to transfer to another bus stop when moving within the group. In other words, when moving within the group, there is no need to transfer to another route.
However, the analysis based on actual passenger volume shows the existence of coordinator bus stops. This could imply that although the routes exist, passengers face difficulties in using them due to operational issues such as limited frequency of service, possibly operating only once a day. The discrepancy between route-based coordinator bus stops and the passenger volume-based coordinator bus stops may also indicate an issue with route planning. If a bus stop is considered a transfer point within the group based on the route network analysis, it should also be identified as a coordinator bus stop in the passenger volume network analysis as well. The fact that this is not the case suggests that the bus stop is not functioning effectively as a transfer point. Such occurrences can arise in cases where the passenger volume is disproportionately concentrated in just one or two routes.

5.3.2. Consultant

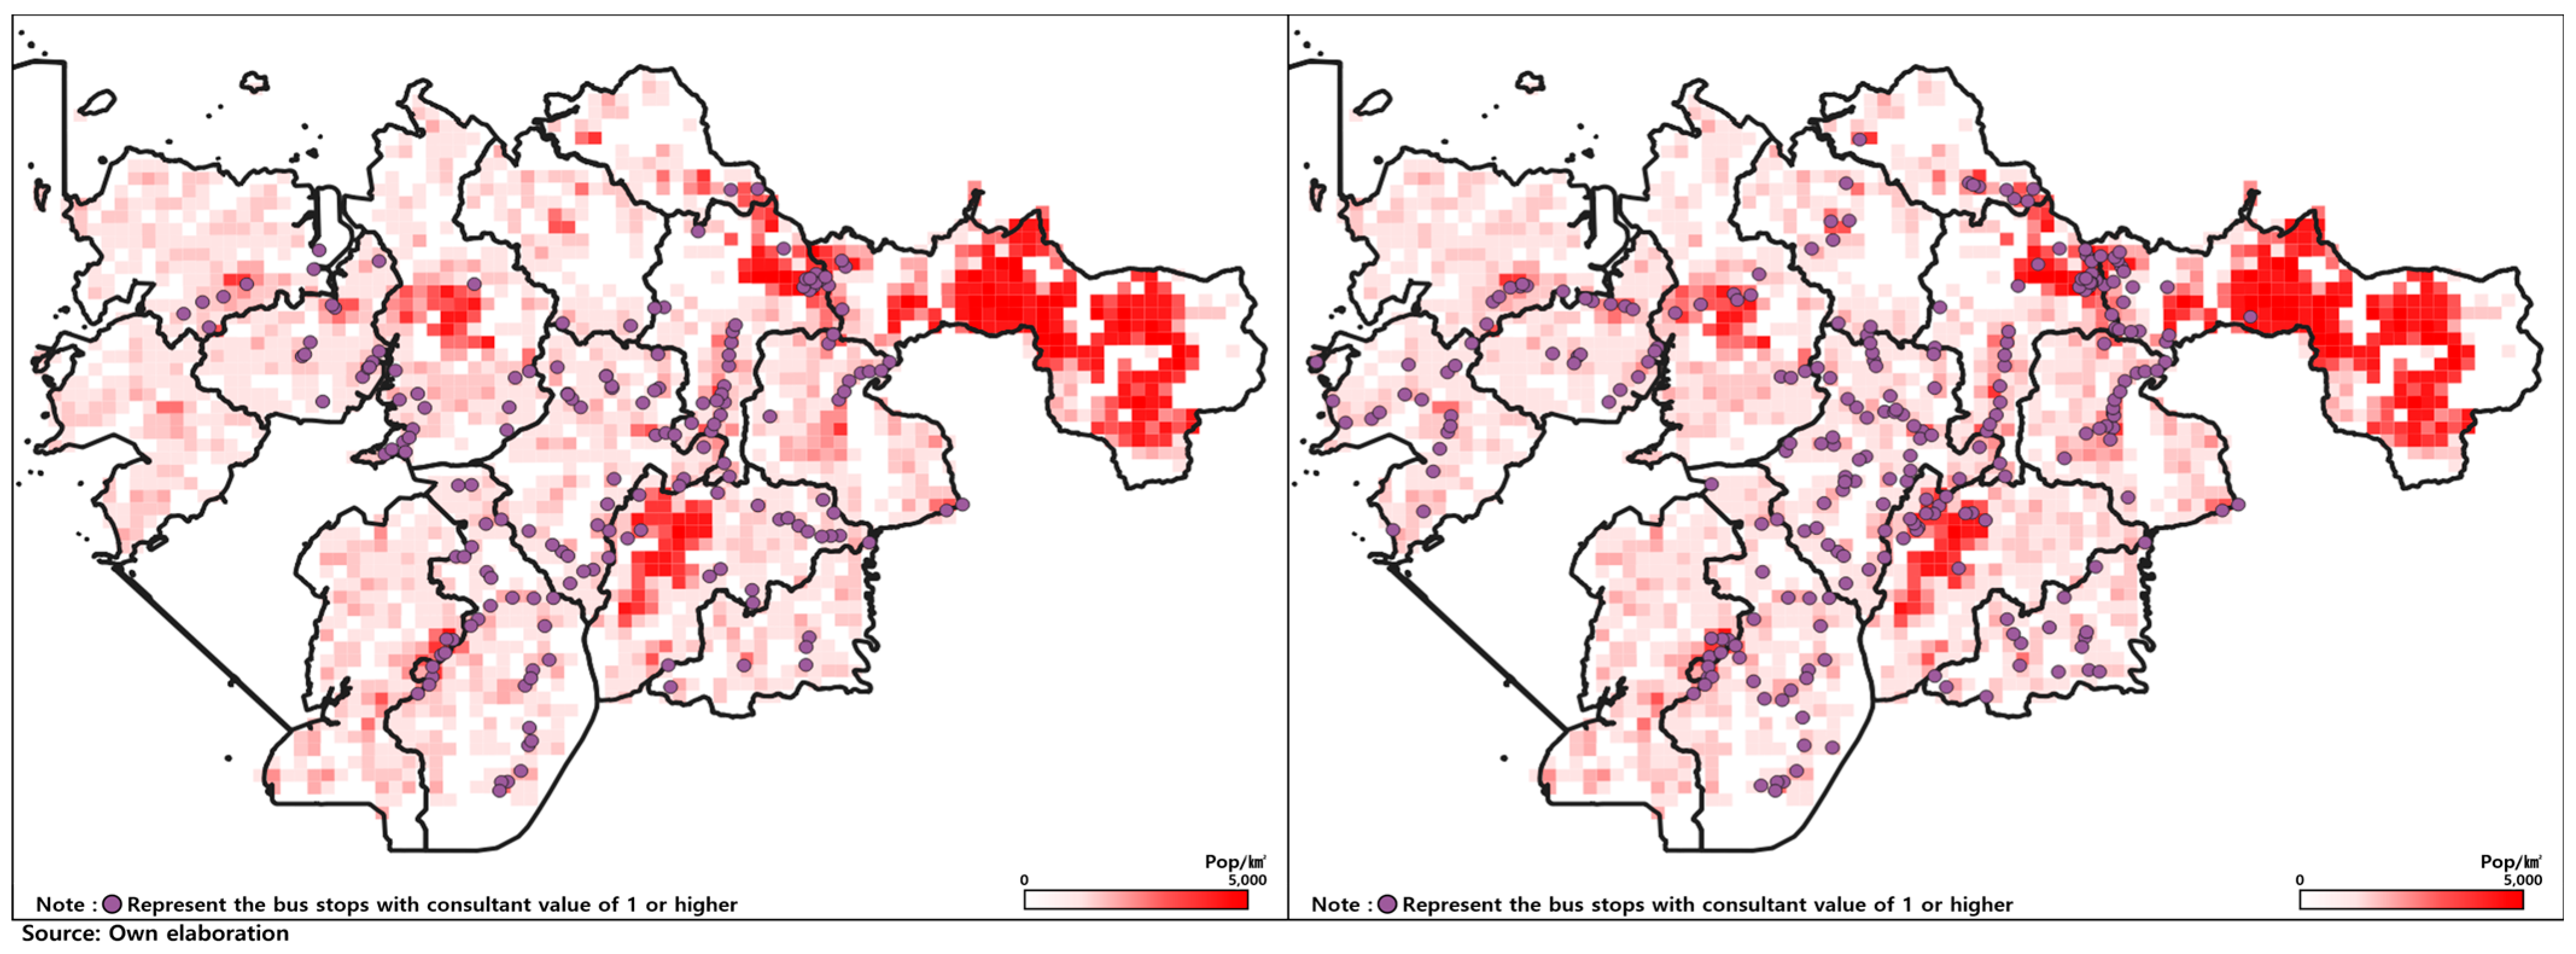
The locations of the consultant bus stops are shown in Figure 9. In a general travel route, moving from one bus stop to another within the same group does not require passing through bus stops located in other groups. From this perspective, a high number of consultant bus stops indicates inefficiency in the bus route system. In most brokerage analysis results, the overall connectivity was higher in the route network compared to the passenger volume network. However, the number of consultant bus stops was higher in the passenger volume network, with 248 consultant bus stops identified, compared to 175 in the route network. The higher number of consultant bus stops in the analysis based on the passenger volume network compared to the route network suggests that the route planning is relatively efficient. Nevertheless, the fact that consultant bus stops in the passenger volume network are relatively centrally located within the groups and show inefficient usage patterns despite an efficient route system indicates the need for adjustments to the operation plan.

5.3.3. Representative and Gatekeeper

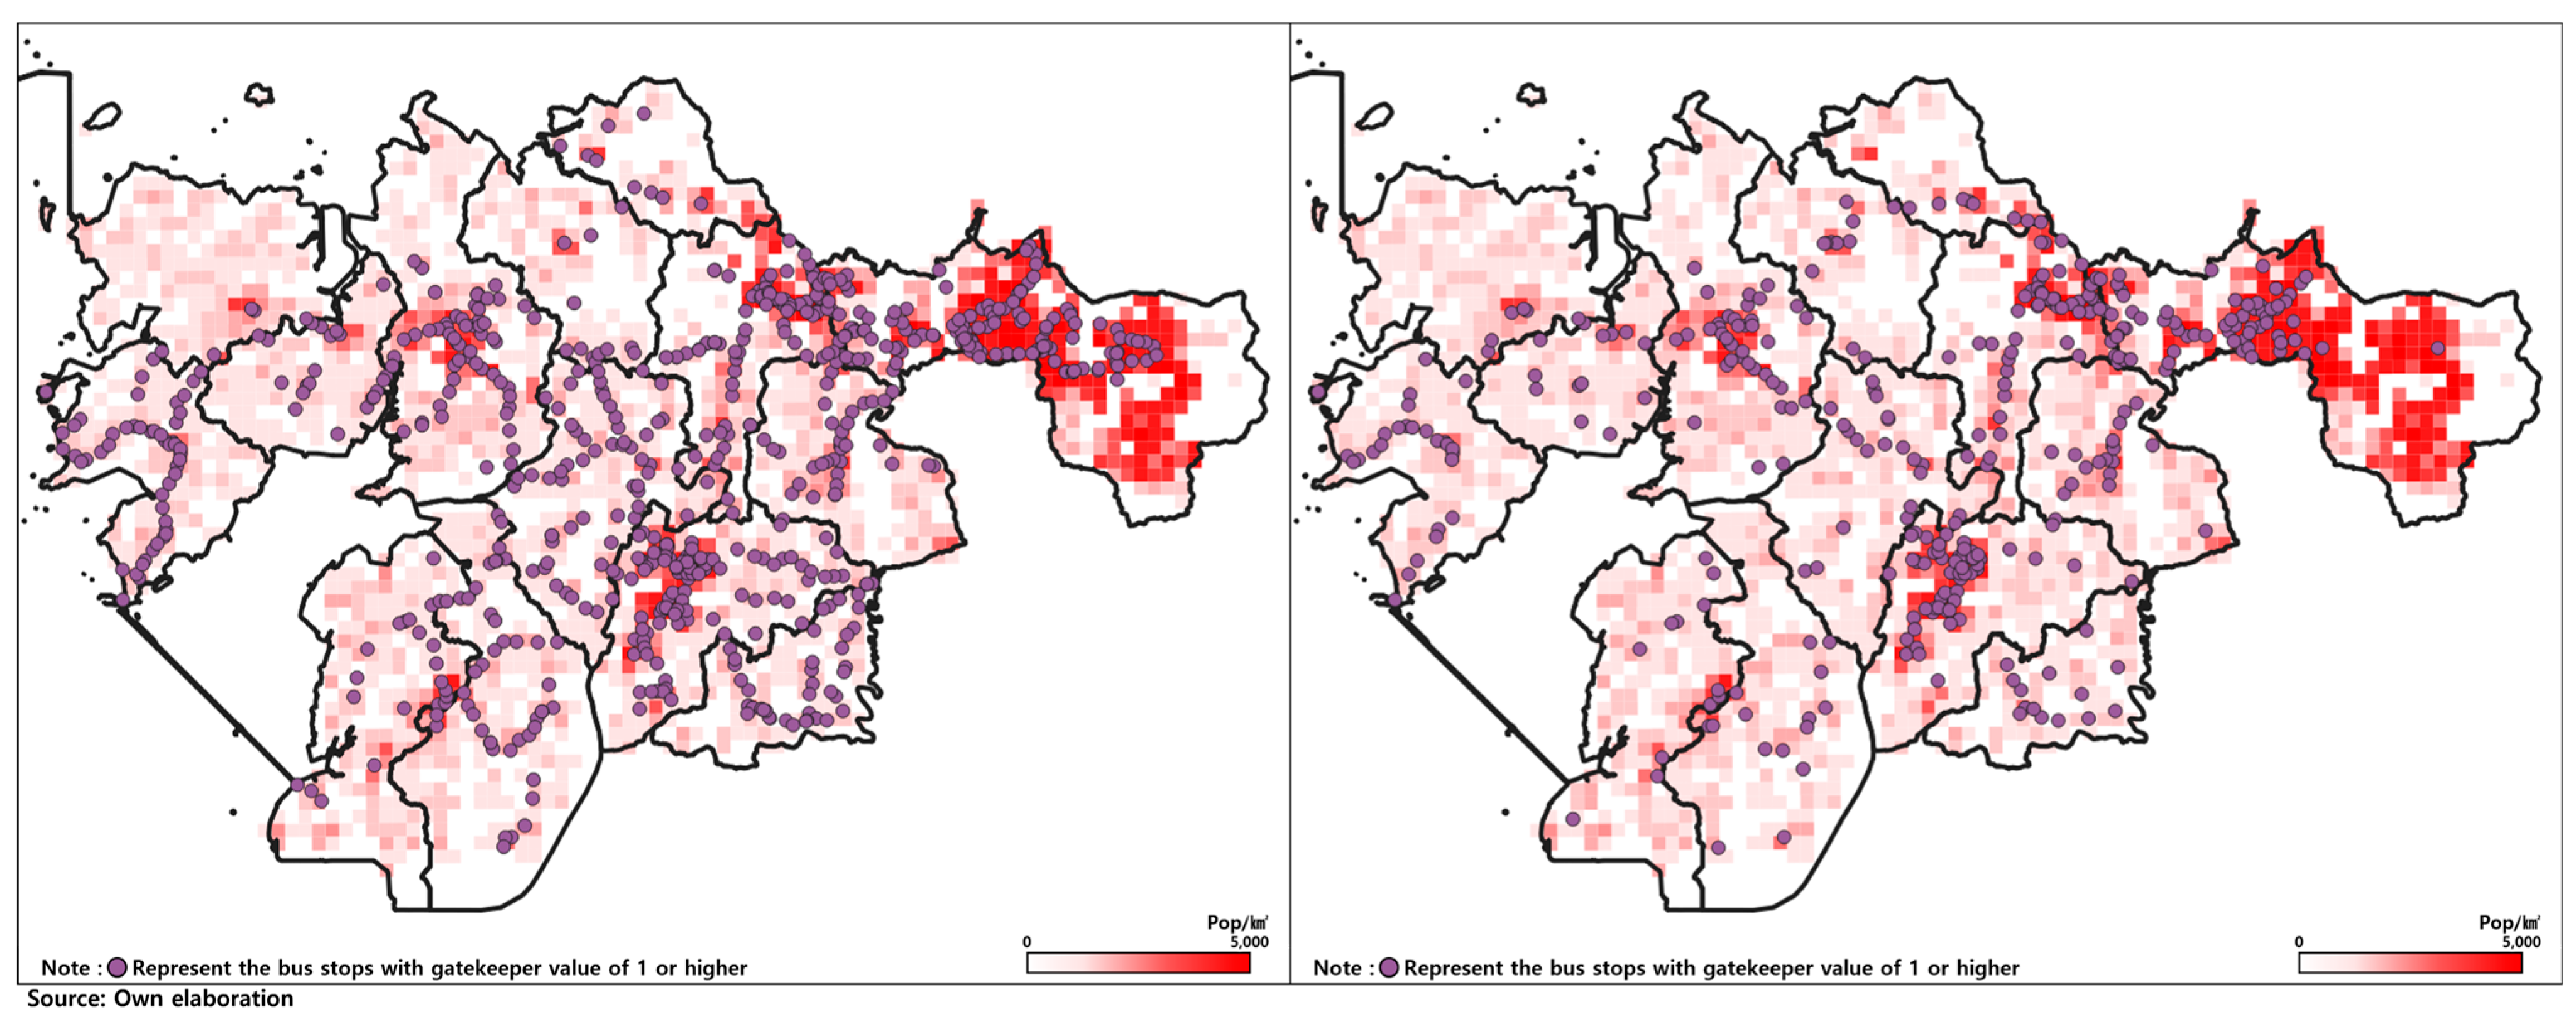
The bus stop locations performing the representative role are shown in Figure 10, and the locations of bus stops performing the gatekeeper role are shown in Figure 11. Representatives and gatekeepers play a crucial role in connecting movements between different groups. When a bus stop under analysis belongs to the same group as the departure location, it serves as a representative; if it belongs to the same group as the destination location, it serves as a gatekeeper. Considering the characteristics of representatives and gatekeepers, these bus stops should ideally be located at the boundaries between groups. However, as seen in Figure 10 and Figure 11, they are more prevalent in densely populated areas within the groups rather than at the group boundaries. This can be attributed to the bus operation system, which distinguishes between local buses and city buses. Local buses typically operate within a single group, while city buses connect two or more groups. Particularly, city buses, which generally have higher passenger volumes compared to local buses, often connect the central areas (high population density areas) of two regions, leading to the occurrence of representatives and gatekeepers in these central areas.

5.3.4. Liaison

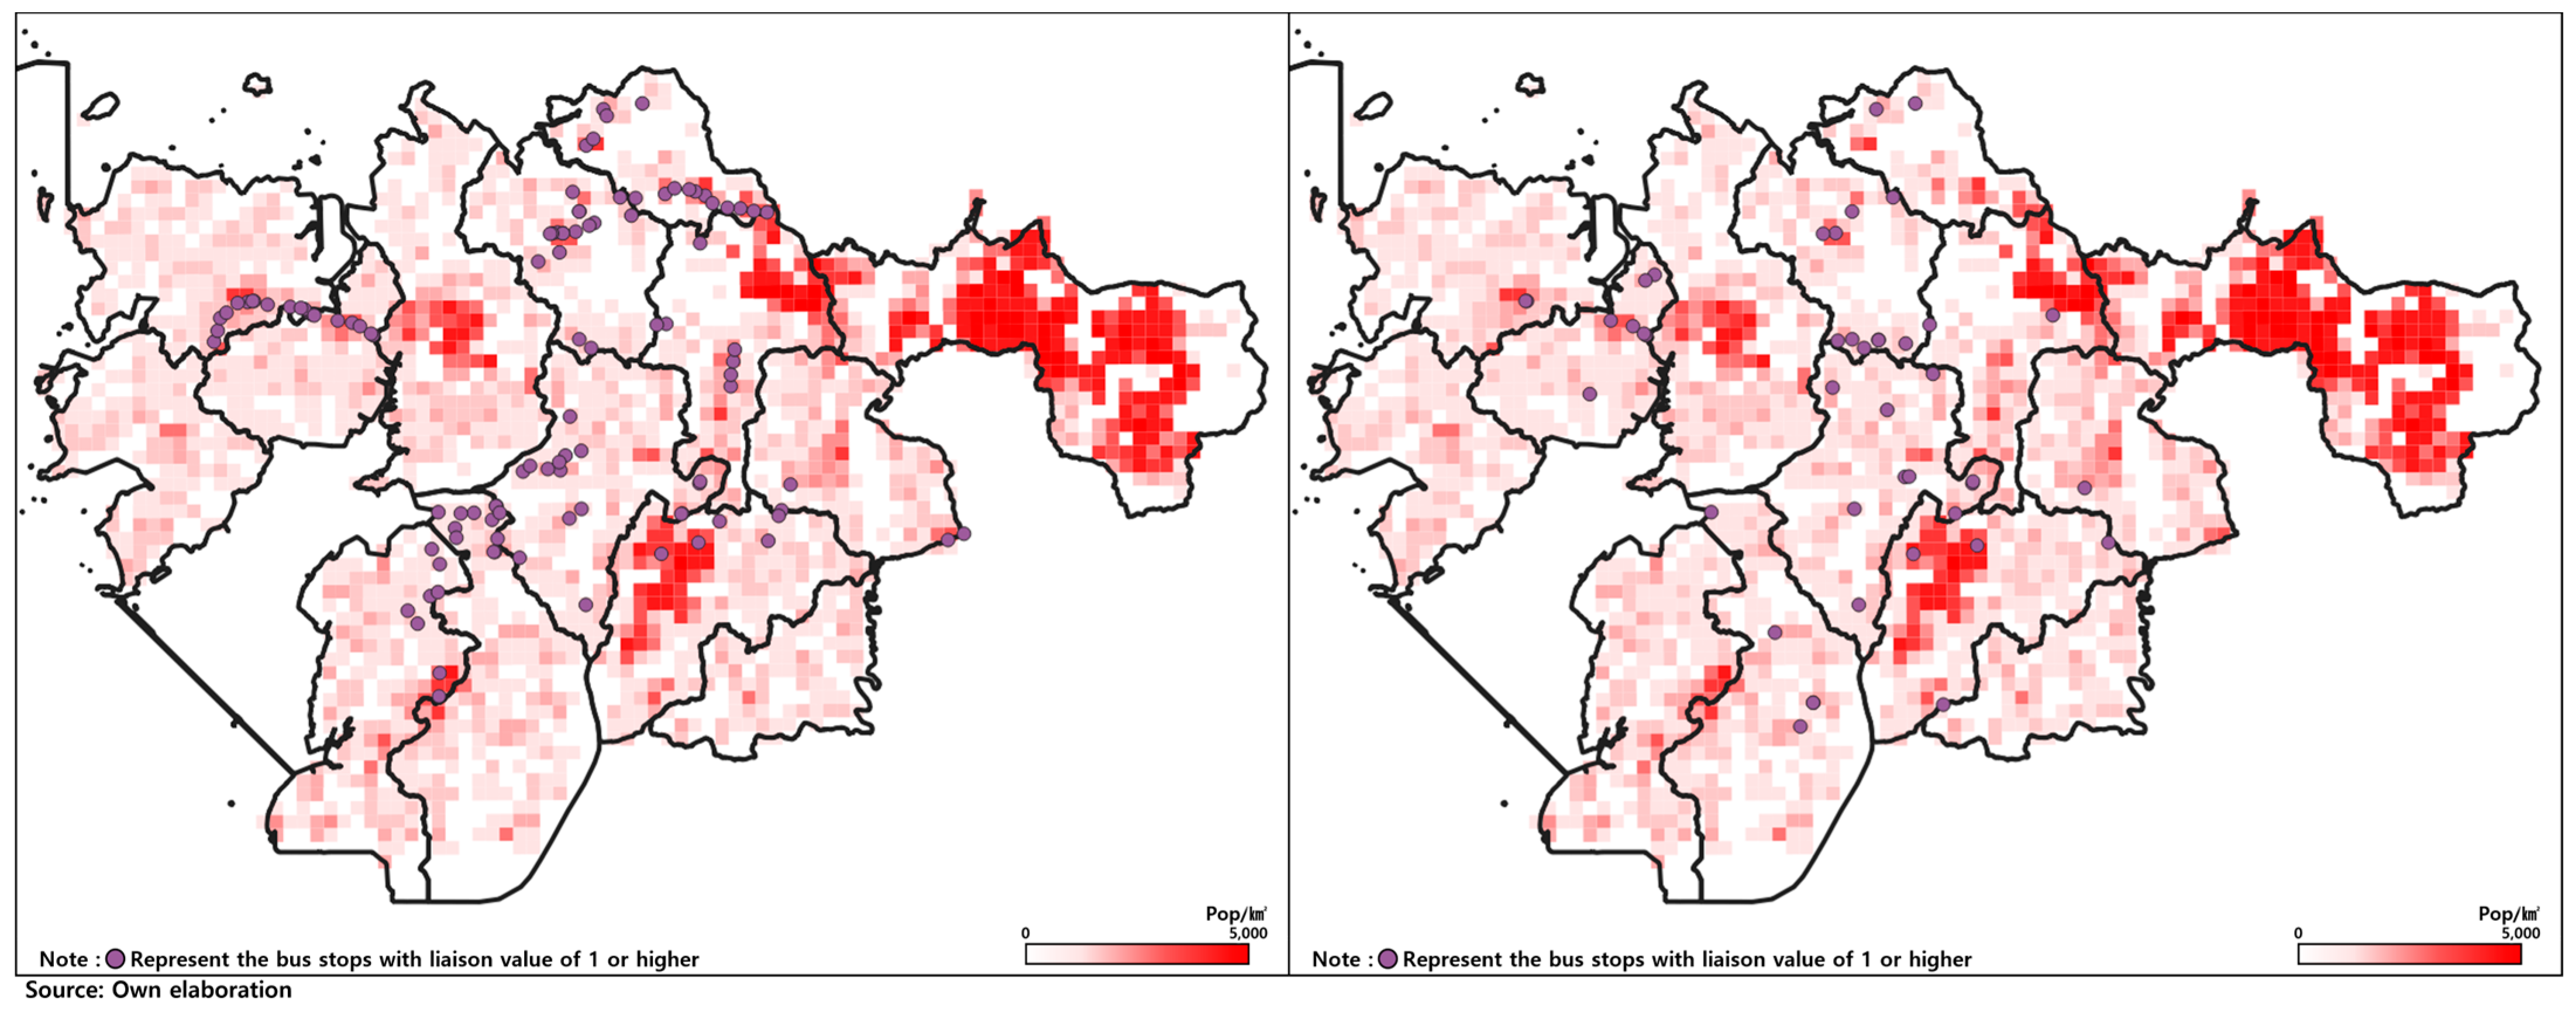
The locations of the liaison bus stops are shown in Figure 12. Liaison bus stops perform the role of facilitating movements between different groups and can be considered as regional transfer hubs for long-distance travel, similar to intercity bus terminals. However, in this study, as the analysis was limited to the area of Hwaseong City, bus stops serving as intercity terminals were not identified as liaisons. When examining the locations of bus stops selected as liaisons based on the route network, it is evident that they mostly represent routes that connect two areas. Moreover, considering the entirety of Hwaseong City, these liaisons form a pattern that connects the city horizontally or vertically. On the other hand, the analysis of the passenger volume network revealed that only 43 bus stops in Hwaseong City serve as liaisons. This indicates that most internal movements within Hwaseong City involve short-distance travels that do not require the passage of all three groups.

6. Application

When evaluating public transportation services, routes and stops have traditionally been assessed separately. However, utilizing the broker analysis presented in this study based on SNA, it becomes possible to evaluate both route and stop characteristics simultaneously. This enables more efficient route design based on the broker characteristics of the stops. For example, we aim to analyze the broker characteristics of selected routes and areas, and thereby evaluate and propose improvement strategies for the actual routes.
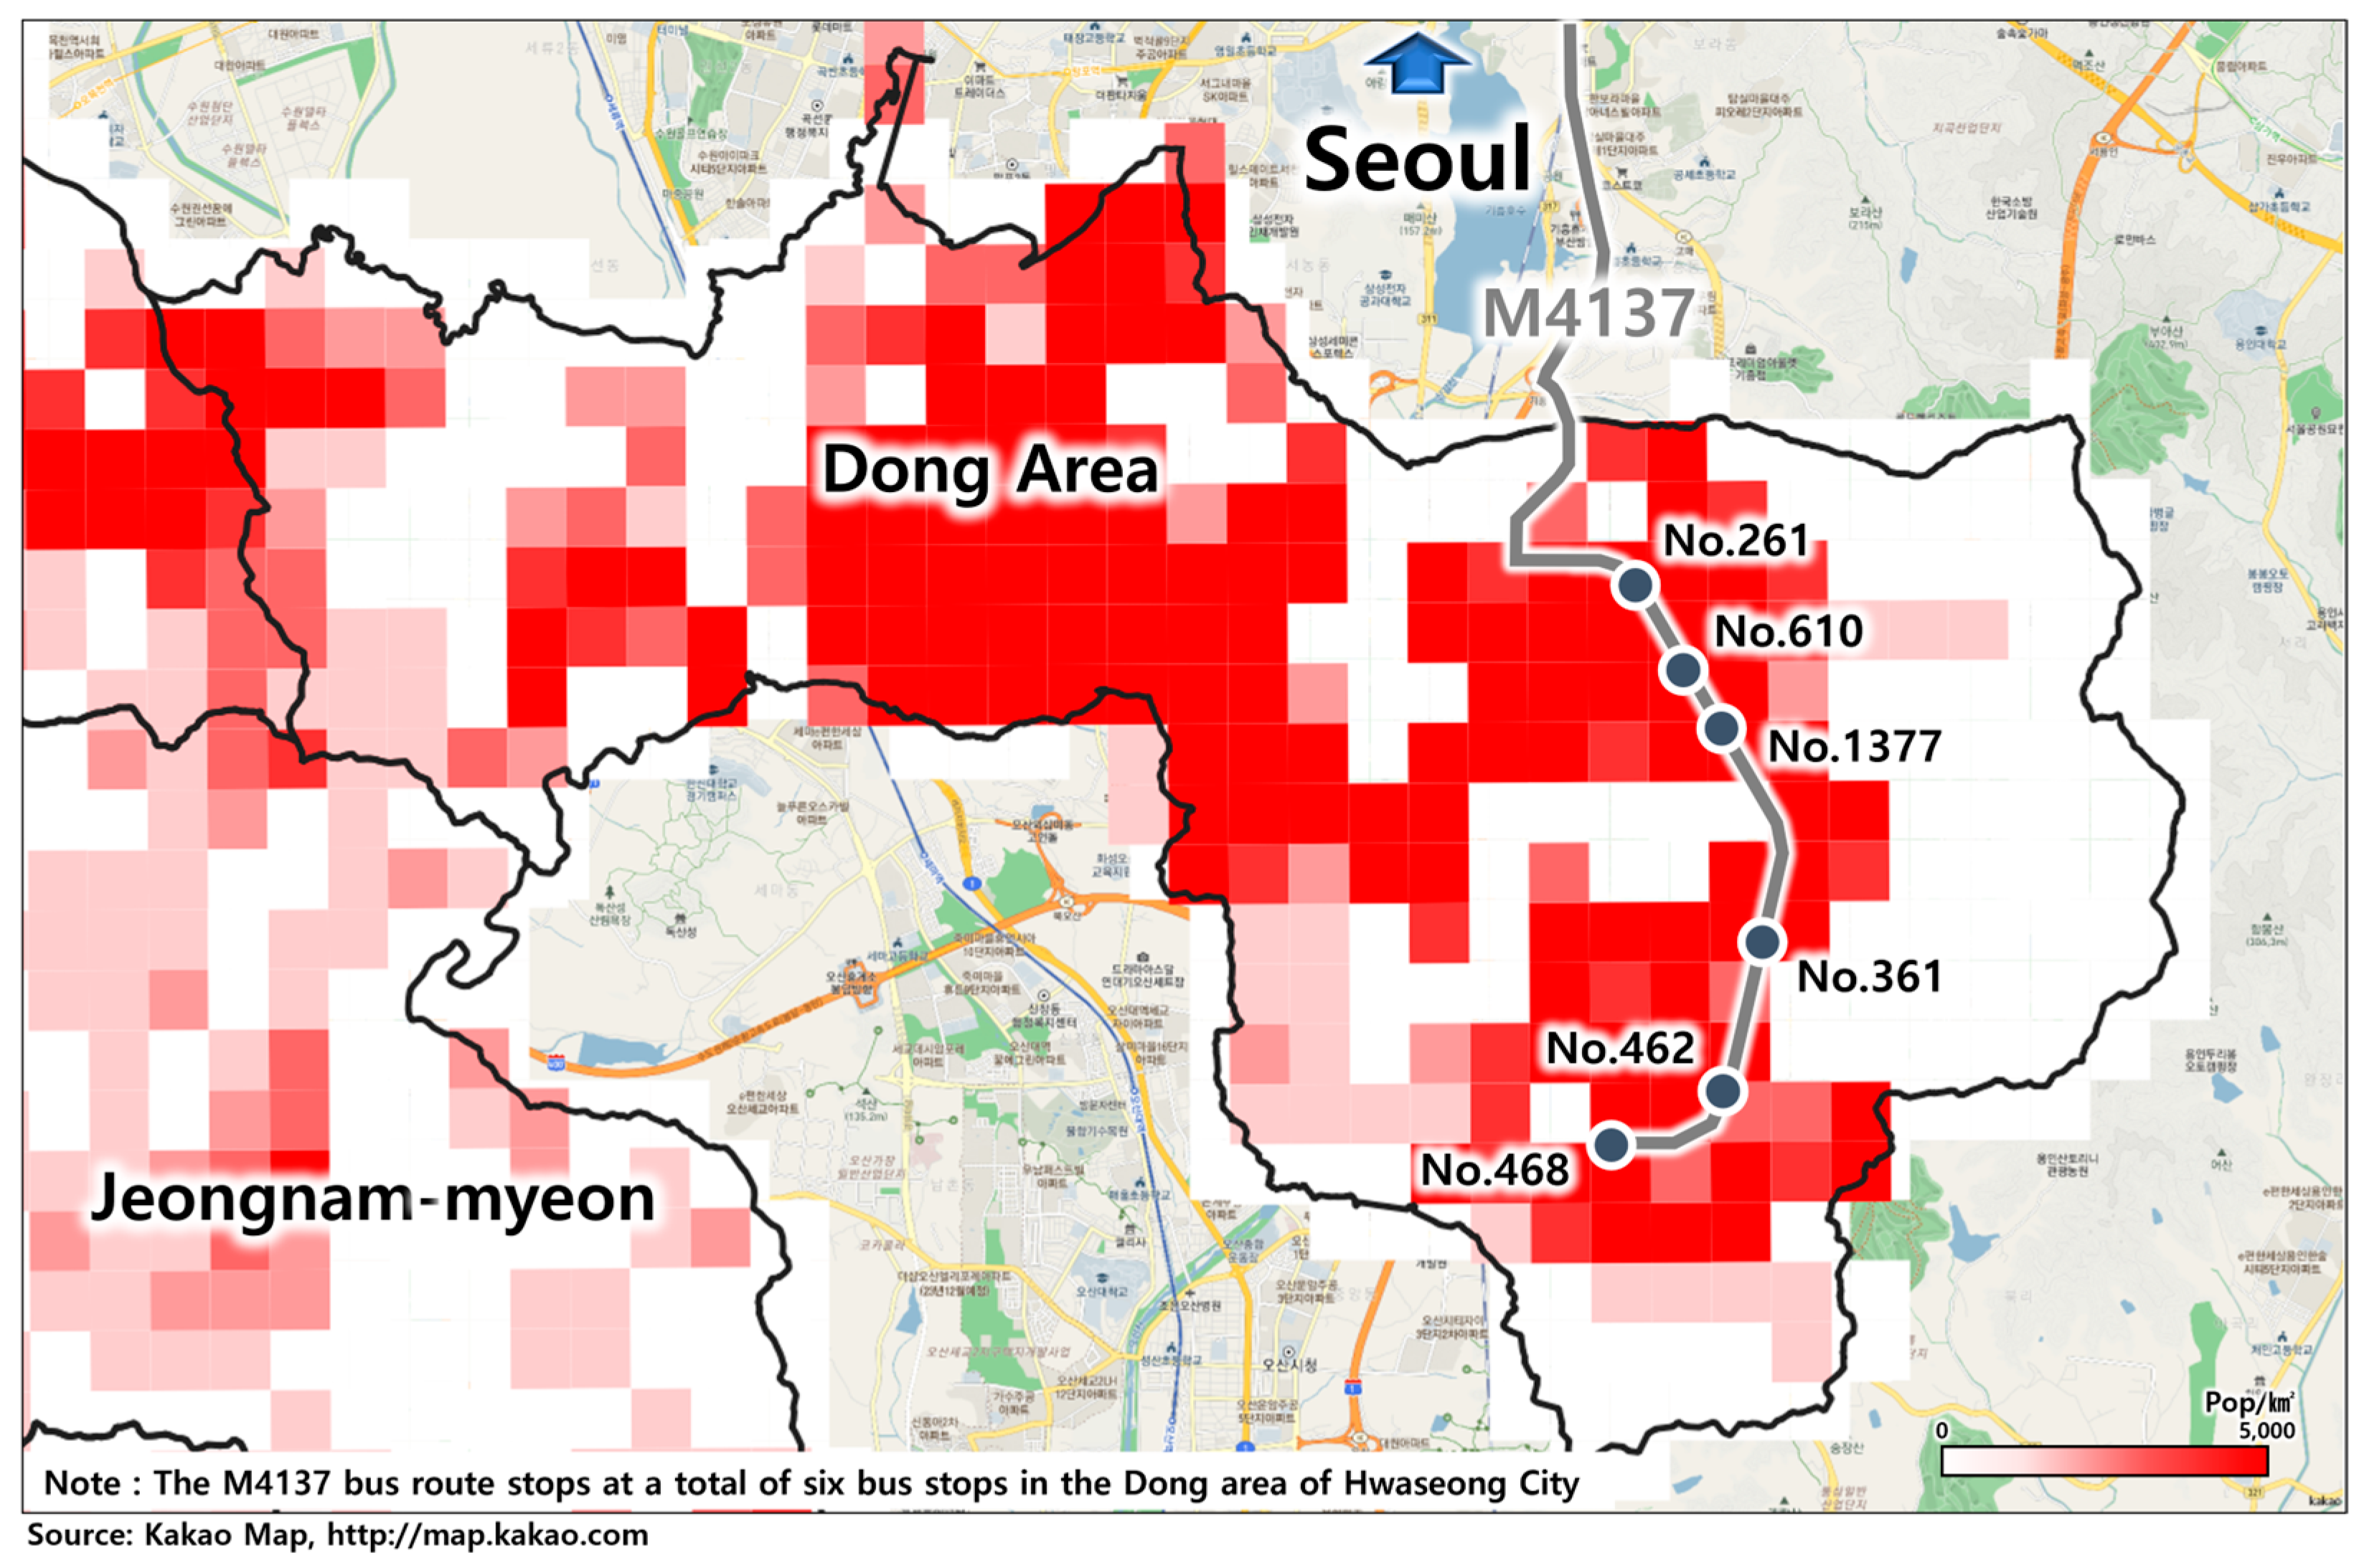
In South Korea, to achieve efficient transit speed, especially in inter-regional bus services, the operation of M buses, which limits the number of stops within a region to six, has been implemented. Due to the limited number of stops within the region, it is efficient to select stops with high accessibility as stops for the route. Performing broker analysis of the six stops of bus route M4137, operated in Hwaseong City, yields the results shown in Table 3, while the route and stops of this line are illustrated in Figure 13. Based on the broker analysis results in terms of ridership, the mediator scores for all stops were relatively high, each exceeding 25. Similarly, in the broker analysis results based on the route, most stops had mediator scores exceeding 20, except for one stop (610), where the mediator score was relatively low at 18.227. Although the mediator score for stop 610 was slightly lower, the representative score was 3.562, higher than that of other stops. This suggests that while the stop may have a somewhat limited effect in connecting movements within the zone, it plays a significant role in connecting movements to other zones. Through the broker analysis based on ridership and route connectivity, it can be concluded that the six stops of bus route M4137 exhibit relatively high connectivity with surrounding areas, indicating that the stops of route M4137 are reasonably planned.
In Bibong-myeon, there are a total of 33 bus stops. As shown in Figure 8, when examining bus stops with consultant values greater than 1, only two stops are observed in the route-based analysis, whereas there are seven stops observed in the ridership-based analysis. This difference in analysis results is attributed to the bus routes serving Namyang-eup. Namyang-eup has a long north–south axis, with a dense population in its central area. Particularly, with Hwaseong City Hall located in the densely populated central area of Namyang-eup, most bus routes from other areas connect to this central area. Due to this characteristic, there are no bus routes connecting the northern part of Namyang-eup with its central or southern parts. Consequently, to travel from the northern part of Namyang-eup to the central area, one must pass through Bibong-myeon. This ultimately increases the consultant value of bus stops located in Bibong-myeon and leads to inefficiency in travel. Therefore, through the analysis of the consultant values of bus stop locations, the necessity of bus routes connecting the northern part of Namyang-eup with its central area can be inferred.
When gatekeeper and representative bus stops serve as transfer points for movement to different groups, it is appropriate for them to be located at the boundaries between groups. Examining the northern area of the Dong area in Figure 9 and Figure 10, it is observed that there are few representative and gatekeeper stops based on ridership analysis results, while there are relatively more based on route analysis results. The presence of representative and gatekeeper stops in the eastern part of the Dong area in route-based analysis results implies the existence of bus routes connecting the eastern part to other areas. However, the actual usage pattern shows movement from the northern to the western part of the Dong area, followed by transfers to other areas. This indicates that running routes from the eastern part of the Dong area to connect with other areas is inefficient. To operate public transportation routes more efficiently, it would be beneficial to shorten the routes to only the western or central parts of the Dong area from other areas, rather than extending them to the eastern part, and to utilize the remaining buses to reduce frequency or design new routes.
Liaisons occur when the origin, intermediary, and destination are all located in different areas. Therefore, as depicted in Figure 11, the distribution of liaisons resembles routes that pass through multiple areas. Comparing the route-based analysis results with the ridership-based analysis results, liaisons are found to be fewer in the ridership-based analysis. This indicates that on long-distance routes, buses stop at more stops than those actually used. Thus, adjusting the route planning to omit liaison stops that receive high scores in route-based analysis but low scores in ridership-based analysis could improve the quality of public transportation services by reducing travel time on long-distance routes.

7. Conclusions

7.1. Discussion and Implications

To derive the role of bus stops in both the route network and passenger volume network, SNA was conducted. Based on the results obtained, an examination of the locations of bus stops and routes in the network was performed. The analysis focused on Hwaseong City, which includes both high-density urban areas and low-density rural areas. The public transportation data used for the analysis were from the year 2019 in order to exclude the effects of COVID-19. The implications of this study are as follows:
First, this study highlights the importance of considering connectivity within the public transportation network, an aspect previously overlooked, offering a new perspective for enhancing public transportation services. In most existing studies related to the evaluation of bus stop locations, the focus has been on individual stops, considering factors such as the surrounding environment and service coverage. However, this approach overlooks the connectivity of routes, leading to limitations in its use as an indicator for the efficient establishment of a public transportation system. Public transportation stops ultimately serve as nodes that connect routes. Therefore, we validated whether each stop plays an appropriate role within the overall public transportation network. This method will enable more rational route design when making future changes and additions to public transportation routes. As a result, the public transportation service measurement approach presented in this study is expected to contribute to more effective revisions of the public transportation route system in the future.
Second, the design of routes should consider the distinct characteristics of urban areas, which have diverse destinations and shorter travel distances, as well as rural areas with fewer destinations and longer travel distances. In urban areas, nodes with high degree centrality were primarily derived from stops that serve as central points within specific regions, whereas in rural areas, these nodes were mainly derived from stops along inter-regional travel paths. This indicates that bus users in urban areas primarily engage in short-distance travel within the region, whereas in rural areas, travel is predominantly for long distances between regions. Therefore, in urban areas, it is feasible to introduce numerous routes with shorter lengths to facilitate short-distance travel, whereas in rural areas, relatively fewer routes with longer lengths can be introduced to facilitate long-distance travel.
Third, developing appropriate operational plans for each route is essential, taking into account the specific demand for each route. In the betweenness centrality analysis, higher betweenness centrality was observed in the passenger volume network compared to that obtained from the route network. Additionally, in some groups, the passenger volume network analysis resulted in a higher number of coordinator bus stops compared to the route network analysis. The location of consultant bus stops in the route network was relatively close to the group boundaries, whereas in the passenger volume network, consultant bus stops were predominantly located at the group centers. These findings indicate a phenomenon where certain routes are more heavily used by passengers. Therefore, to provide a comfortable public transportation service, it is essential to consider not only the route paths but also the appropriate operational frequency and intervals for each route.
Fourth, route planning should also consider urban spatial structures, such as central hubs or polycentric cities. People’s travel patterns vary depending on the structure of the region. In a region with a single center, movement tends to concentrate towards that center. If there are multiple centers in the region, travel may be segmented toward each center, resulting in relatively fewer movements between these centers. Hwaseong City exhibits a polycentric urban form with population density concentrated in certain areas. Consequently, long-distance travels that pass through three or more groups occur relatively infrequently. Therefore, introducing short-distance routes rather than long-distance routes would be more efficient. By incorporating public transportation route designs that consider the unique characteristics of each region, a more effective public transportation system is expected to be developed.
Fifth, when designing public transportation routes and selecting bus stop locations, it is vital to consider both their roles at the network level and their geographical positioning. Currently, only the number of routes passing through and the expected passenger volume are considered in bus stop design. However, from a network perspective, bus stops can be classified based on various attributes. The characteristics of bus stops should vary depending on their geographical locations. For instance, if a bus stop is located at the center of a group, it may serve as a coordinator, whereas if it is situated at the boundary of a group, it may function as a representative or a gatekeeper. Conversely, if a bus stop located at the center of a group functions as a representative or a gatekeeper, it indicates that the bus route is inefficiently designed. When designing public transportation routes, reflecting appropriate bus stop characteristics based on their geographical positions can lead to the establishment of an efficient transportation network. This can reduce unnecessary route connections and decrease passenger travel distances. Additionally, excluding redundant routes and reducing route overlap can result in cost savings. Overall, the efficient construction of the public transportation route network can enhance the effectiveness of public transportation services.
Sixth, it can contribute to the rational operation of public transportation. Public transportation operations, such as bus companies or the government, strive to minimize operating costs and maximize profits. Evaluating existing bus routes based on usage performance can lead to benefits such as reducing inefficient routes or discovering profitable routes that were previously overlooked. Additionally, when the government provides subsidies to public transportation operators, as in quasi-public systems, establishing a rational public transportation route system can prevent financial losses.
Seventh, it contributes to sustainable development by promoting public transportation. Public transportation is an eco-friendly mode of transportation, and the transportation sector aims to increase the share of public transportation to achieve sustainable development by reducing carbon emissions. The results of this study help improve existing public transportation routes more efficiently from a network perspective based on user performance. This ultimately enhances the quality of public transportation services and encourage increased use of public transportation. Although buses emit less carbon compared to private vehicles, they still produce emissions as they rely on fossil fuels. This study aims to improve inefficient routes by identifying excessively operated routes or unnecessary stops relative to actual passenger usage. This is expected to further contribute to eco-friendly development by reducing unnecessary bus operations.

7.2. Limitations and Future Research

In this study, we introduced a new approach to determine the location of bus stops and plan public transportation routes based on the properties of bus stops derived from SNA. The limitations of this study are as follows: We conducted the analysis based on the actual operating public transportation network and the corresponding usage performance data. Therefore, big data, such as public transportation network data, bus stop location data, and smart card data are required to perform the analysis. Although this study focused on Hwaseong City, there are no spatial constraints regarding the analytical methodology or the data applied. However, interpreting the analysis results necessitates considering the characteristics of the analyzed area (e.g., population density, topography).
In future research, incorporating the following aspects is expected to yield more improved outcomes: Firstly, considering various variables related to urban form would enhance the study. Public transportation usage patterns are significantly influenced by urban form. Therefore, by incorporating factors such as surrounding building utilization and road hierarchy, more comprehensive research outcomes can be achieved. Secondly, it is necessary to examine the analysis results in greater detail. Although the data used in the analysis were at the level of individual bus stops, the results were presented at the group level. Since the study area, Hwaseong City, comprises 1396 bus stops, there are limitations in interpreting individual bus stop characteristics. In future research, reducing the analysis unit or conducting specific analyses for groups can be anticipated. Thirdly, an analysis of the entire public transportation network, including the subway network, can be expected. Hwaseong City, the area set for this study, does not have a subway network; therefore, the analysis was performed only with bus routes. However, when analyzing areas with a subway network, research considering both bus and subway networks can be conducted.

Author Contributions

Conceptualization, J.K. and S.C.; methodology, J.K. and G.L.; software, S.K.; validation, J.K., G.L. and S.K.; formal analysis, J.K.; data curation, G.L.; writing—original draft preparation, J.K. and S.K.; writing—review and editing, J.K. and S.C.; visualization, G.L. and S.K.; supervision, S.C.; project administration, S.C. All authors have read and agreed to the published version of the manuscript.

Funding

This research was supported by Basic Science Research Program through the National Research Foundation of Korea (NRF) funded by the Ministry of Science and ICT (RS-2024-00357929).

Institutional Review Board Statement

Not applicable.

Informed Consent Statement

Not applicable.

Data Availability Statement

The datasets presented in this article are raw data, which can be accessed upon additional request. Requests to access the datasets should be directed to the Ministry of Land, Infrastructure, and Transport of Korea.

Conflicts of Interest

The authors declare no conflicts of interest.

References

  1. United Nations (UN). Available online: http://news.un.org/en/story/2023/07/1139162 (accessed on 30 July 2023).
  2. International Energy Agency (IEA). Available online: https://www.iea.org/energy-system/transport/electric-vehicles (accessed on 1 August 2024).
  3. International Energy Agency (IEA). Global EV Outlook 2024; IEA: Paris, France, 2024. [Google Scholar]
  4. Chen, W.; Lei, Y. Path Analysis of Factors in Energy-related CO2 Emissions from Beijing’s Transportation Sector. Transp. Res. Part D 2017, 50, 473–487. [Google Scholar] [CrossRef]
  5. Nes, R.V.; Hamerslag, R.; Immers, B.H. Design of Public Transport Networks. Transp. Res. Rec. 1988, 1202, 74–83. [Google Scholar]
  6. Manser, P.; Becker, H.; Horl, S.; Axhausen, K.W. Designing a Large-scale Public Transport Network Using Agent-based Microsimulation. Transp. Res. Part A 2020, 137, 1–15. [Google Scholar] [CrossRef]
  7. Alkharabsheh, A.; Moslem, S.; Duleba, Z. Evaluating Passenger Demand for Development of the Urban Transport System by an AHP Model with the Real-world Application of Amman. Appl. Sci. 2019, 9, 4759. [Google Scholar] [CrossRef]
  8. Moslem, S.; Alkharabsheh, A.; Ismael, K.; Duleba, S. An Integrated Decision Support Model for Evaluating Public Transport Quality. Appl. Sci. 2020, 10, 4158. [Google Scholar] [CrossRef]
  9. Alkharabsheh, A.; Moslem, S.; Oubahman, L.; Duleba, S. An Integrated Approach of Multi-criteria Decision-making and Grey Theory for Evaluating Urban Public Transportiaon System. Sustainability 2021, 13, 2740. [Google Scholar] [CrossRef]
  10. Betterbury, S. Environmental Activism and Social Networks: Campaigning for Bicycles and Alternative Transport in West London. Ann. Am. Acad. Political Soc. Sci. 2003, 590, 150–169. [Google Scholar] [CrossRef]
  11. Errampalli, M.; Patil, K.S.; Parsad, C.S.R.K. Evaluation of Integration Between Public Transportation Modes by Developing Sustainability Index for Indian Cities. Case Stud. Transp. Policy 2020, 8, 180–187. [Google Scholar] [CrossRef]
  12. Ortego, A.; Valero, A.; Abadias, A. Environmental Impacts of Promoting New Public Transport Systems in Urban Mobility: A Case Study. J. Sustain. Dev. Energy Water Environ. Syst. 2017, 5, 377–395. [Google Scholar] [CrossRef]
  13. Alkheder, S. Promoting Public Transport as a Strategy to Reduce GHG Emissions from Private Vehicles in Kuwait. Environ. Chall. 2021, 3, 100075. [Google Scholar] [CrossRef]
  14. Jing, Q.L.; Liu, H.Z.; Yu, W.Q.; He, X. The Impact of Public Transportation on Carbon Emissions-From the Perspective of Energy Consumption. Sustainability 2022, 14, 6248. [Google Scholar] [CrossRef]
  15. Duleba, S.; Moslem, S. Examining Pareto Optimality in Analytic Hierarchy Process on Real Data: An Application in Public Transport Service Development. Expert Syst. Appl. 2019, 116, 21–30. [Google Scholar] [CrossRef]
  16. Moslem, S.; Duleba, S. Sustainable Urban Transport Development by Applying a Fuzzy-AHP Model: A Case Study from Mersin, Turkey. Urban Sci. 2019, 3, 55. [Google Scholar] [CrossRef]
  17. Moslem, S.; Celikbilek, Y. An Integrated Grey AHP-MOORA Model for Ameliorating Public Transport Service Quality. Eur. Transp. Res. Rev. 2020, 12, 68. [Google Scholar] [CrossRef]
  18. Li, J.; Chen, X.; Li, X.; Guo, X. Evaluation of Public Transportation Operation Based on Data Envelopment Analysis. Procedia-Soc. Behav. Sci. 2013, 69, 148–155. [Google Scholar] [CrossRef]
  19. Yap, M.; Cats, O.; Arem, B. Crowding Valuation in Urban Tram and Bus Transportation Based on Smart Card Data. Transp. A Transp. Sci. 2020, 16, 23–42. [Google Scholar] [CrossRef]
  20. Zhang, C.; Juan, Z.; Luo, Q.; Xiao, G. Performance Evaluation of Public Transit Systems Using a Combined Evaluation Method. Transp. Policy 2016, 45, 156–167. [Google Scholar] [CrossRef]
  21. Tomej, K.; Liburd, J.J. Sustainable Accessibility in Rural Destinations: A Public Transport Network Approach. J. Sustain. Tour. 2020, 28, 222–239. [Google Scholar] [CrossRef]
  22. Zhang, Y.; Li, W.; Deng, H.; Li, Y. Evaluation of Public Transport-Based Accessibility to Health Facilities Considering Spatial Heterogeneity. J. Adv. Transp. 2020, 1, 7645153. [Google Scholar] [CrossRef]
  23. Haznagy, A.; Fi, I.; London, A.; Nemeth, T. Complex Network Analysis of Public Transportation Networks: A Comprehensive Study. In Proceedings of the 2015 International Conference on Models and Technologies for Intelligent Transportation Systems (MT-ITS), Budapest, Hungary, 3–5 June 2015; IEEE: New York, NY, USA, 2015; pp. 371–378. [Google Scholar]
  24. Cheng, Y.Y.; Lee, R.K.W.; Lim, E.P.; Zhu, F. Measuring Centralities for Transportation Networks Beyond Structures. In Applications of Social Media and Social Network Analysis; Springer: Berlin/Heidelberg, Germany, 2015; pp. 23–39. [Google Scholar]
  25. Song, M.G.; Yeo, G.T. Analysis of the Air Transport Network Characteristics of Major Airports. Asian J. Shipp. Logist. 2017, 33, 117–125. [Google Scholar] [CrossRef]
  26. Prabhakar, N.; Anbarasi, L.J. Exploration of the Global Air Transport Network Using Social Network. Soc. Netw. Anal. Min. 2021, 11, 1–12. [Google Scholar] [CrossRef]
  27. Lee, J.; Seo, D. Accuracy of Regional Centrality Using Social Network Analysis: Evidence from Commuter Flow in South Korea. Int. J. Geo-Inf. 2021, 10, 642. [Google Scholar] [CrossRef]
  28. Barnes, J. Class and Committees in a Norwegian Island Parish. Hum. Relat. 1954, 7, 39–58. [Google Scholar] [CrossRef]
  29. Yang, G.; Yang, Y.; Gong, G.; Gui, Q. The Spatial Network Structure of Tourism Efficiency and Its Influencing Factors in China: A Social Network Analysis. Sustainability 2022, 14, 9921. [Google Scholar] [CrossRef]
  30. Otte, E.; Rousseau, R. Social Network Analysis: A Powerful Strategy, also for the Information Sciences. J. Inf. Sci. 2002, 28, 441–453. [Google Scholar] [CrossRef]
  31. Assaad, R.; El-adaway, I.H. Enhancing the Knowledge of Construction Business Failure: A Social Network Analysis Approach. J. Constr. Eng. Manag. 2020, 146, 04020052. [Google Scholar] [CrossRef]
  32. Lee, C.; Chong, H.; Liao, P.; Wang, X. Critical Review of Social Network Analysis Applications in Complex Project Management. J. Manag. Eng. 2018, 34, 04017061. [Google Scholar] [CrossRef]
  33. El-adaway, I.H.; Ibrahim, S.A.; Eric, V. Social Network Analysis Approach for Improved Transportation Planning. J. Infrastruct. Syst. 2017, 23, 05016004. [Google Scholar] [CrossRef]
  34. Zhou, Z.; Irizarry, J. Integrated Framework of Modified Accident Energy Release Model and Network Theory to Explore the Full Complexity of the Hangzhou Subway Construction Collapse. J. Manag. Eng. 2016, 32, 05016013. [Google Scholar] [CrossRef]
  35. Freeman, L.C.; Roeder, D.; Mulholland, R.B. Centrality in Social Networks: II. Experimental results. Soc. Netw. 1979, 2, 119–141. [Google Scholar] [CrossRef]
  36. Grando, F.; Noble, D.; Lamb, L.C. An Analysis of Centrality Measures for Complex and Social Networks. In Proceedings of the IEEE Global Communications Conference, Washington, DC, USA, 4–8 December 2016; pp. 1–6. [Google Scholar]
  37. Gould, R.V.; Fernandez, R.M. Structures of Mediation: A Formal Approach to Brokerage in Transaction Networks. Sociol. Methodol. 1989, 19, 89–126. [Google Scholar] [CrossRef]
  38. Ali, A.A.; Eliasson, J. The Value of Additional Data for Public Transport Origin-destination Matrix Estimation. Public Transp. 2022, 14, 419–439. [Google Scholar] [CrossRef]
  39. Korean Statistical Information Service (KOSIS). Available online: https://kosis.kr/index/index.do (accessed on 1 July 2023).
Figure 1. Graphic representation of the five types of brokerage relation.
Sustainability 16 07212 g001
Figure 2. The location of Hwaseong City.
Sustainability 16 07212 g002
Figure 3. Population density by 500 m grid.
Sustainability 16 07212 g003
Figure 4. Locations of bus stops.
Sustainability 16 07212 g004
Figure 5. The distribution of boarding volume (left) and transfer volume (right).
Sustainability 16 07212 g005
Figure 6. Degree centrality results based on route (left) and passenger volume (right).
Sustainability 16 07212 g006
Figure 7. Betweenness centrality results based on route (left) and passenger volume (right).
Sustainability 16 07212 g007
Figure 8. Coordinator bus stop locations based on route (left) and passenger volume (right).
Sustainability 16 07212 g008
Figure 9. Consultant bus stop locations based on route (left) and passenger volume (right).
Sustainability 16 07212 g009
Figure 10. Representative bus stop locations based on route (left) and passenger volume (right).
Sustainability 16 07212 g010
Figure 11. Gatekeeper bus stop locations based on route (left) and passenger volume (right).
Sustainability 16 07212 g011
Figure 12. Liaison bus stop locations based on route (left) and passenger volume (right).
Sustainability 16 07212 g012
Figure 13. The route and bus stop locations of the M4137 bus.
Sustainability 16 07212 g013
Table 1. Summary of previous studies on public transportation service evaluation indicators.
AuthorMethodContent
Moslem and Celikbilek
(2020) [17]
Grey-AHP
-
Indicators related to service quality:
Distance to stops, safety of stops, comfort in stops, need for transfer, fit connection, frequency of lines, limited time of use, travel time, awaiting time, reaching time
Duleba and Moslem
(2019) [15]
AHP
-
Indicators related to service quality:
Distance to stops, safety of stops, comfort in stops, need for transfer, fit connection, frequency of lines, limited time of use, travel time, awaiting time, reaching time
-
Indicators related to transport quality:
Physical comfort, mental comfort, safety of travel
-
Indicators related to tractability:
Perspicuity, information before travel, information during travel
Moslem and Duleba
(2019) [16]
Fuzzy-AHP
Alkharabsheh et al.
(2019) [7]
AHP-BWM
-
Indicators related to service quality:
Distance to stops, safety of stops, comfort in stops, need for transfer, fit connection, frequency of lines, limited time of use, travel time, awaiting time, reaching time
-
Indicators related to transport quality:
Physical comfort, mental comfort, safety of travel
-
Indicators related to tractability:
Perspicuity, information before travel, information during travel
-
Indicators related to fare:
Price of one-way tickets, price of weekly/monthly tickets, discounted tickets for pensioners or students
Moslem et al.
(2020) [8]
AHP-MOORA
Alkharabsheh et al. (2021) [9]Grey-AHP
Note1: BWM means best–worst method. Note2: MOORA means multi-objective optimization method by ratio analysis. Source: Own elaboration.
Table 2. Top 10 bus stop transfer volume.
Station NameBoardings (Number of People)Ratio (%)
Byeongjeom station intersection522516.4
The rear gate of Byeongjeom station30099.5
Sinchang mission hill16995.3
Byeongjeom station15414.8
Eastern branch office15344.8
Suwon university10082.1
Homeplus; Beolmal elementary school8710.6
Bongdam-eup administrative welfare center6690.6
Banwolri keungogae6460.5
Umi jeil. Jeonhari church5360.5
Total31,804100.0
Source: Own elaboration.
Table 3. The broker analysis results for the six bus stops of M4137.
Station No.Based on RouteBased on Passenger Volume
CoordinatorRepresentativeCoordinatorRepresentative
26129.1870.16529.2580.143
36128.4870.18929.0030.222
46228.5250.18429.7190.000
46829.1120.18829.7190.000
61018.2273.56226.6970.937
137729.2420.14829.0970.193
Source: Own elaboration.
Disclaimer/Publisher’s Note: The statements, opinions and data contained in all publications are solely those of the individual author(s) and contributor(s) and not of MDPI and/or the editor(s). MDPI and/or the editor(s) disclaim responsibility for any injury to people or property resulting from any ideas, methods, instructions or products referred to in the content.