Article

Stay Two-Meters Apart: Assessing the Impact of COVID-19 Social Distancing Protocols on Subway Station Walkway Performance

1
School of Civil and Transportation Engineering, Ningbo University of Technology, Ningbo 315211, China
2
College of Transportation Engineering, Tongji University, Shanghai 201804, China
*
Author to whom correspondence should be addressed.
Sustainability 2024, 16(16), 6858; https://doi.org/10.3390/su16166858
Submission received: 2 April 2024 / Revised: 19 June 2024 / Accepted: 7 August 2024 / Published: 9 August 2024

Abstract

:
Ensuring passenger safety in public transportation systems is a critical challenge, especially under pandemic conditions that necessitate adherence to social distancing measures, such as maintaining a two-meter distance between individuals. This research focuses on evaluating the performance of subway station walkways when subjected to these distancing requirements. To conduct this analysis, a discrete-event simulation (DES) approach was implemented. This technique models the movement and interaction of passengers within station walkways as discrete events, allowing for a detailed assessment of system performance under various conditions. Key performance indicators, including the average area occupied by each passenger, the time spent on the walkway (dwell time), and the likelihood of congestion (blocking probability), were evaluated. The DES considered varying passenger arrival patterns by utilizing phase-type (PH) distribution and walkway dimensions to reflect a range of real-world scenarios. The operational outcomes under normal conditions were compared with those observed under pandemic-induced social distancing protocols. Through this comparison, insights were provided into how enforced distancing impacts walkway efficiency, and we identified potential bottlenecks.

1. Introduction

A subway station operates as a multifaceted system, comprising an integrated assemblage of infrastructure, facilities, and personnel dedicated to delivering passenger services efficiently. These stations serve as crucial transit nodes where passengers transition from entry points to boarding trains. To handle the flow of passengers smoothly, it is important to have well-designed walkways and stairs. The efficiency of these components significantly impacts the overall functionality of the station and the passenger experience.
The COVID-19 pandemic introduced additional complexity to the management of passenger circulation, emphasizing the necessity of adhering to social distancing measures, such as maintaining a two-meter separation between individuals [1,2]. This health directive necessitated a reevaluation of the circulation infrastructure to accommodate these distancing requirements without compromising the throughput and functionality of the station. The integration of social distancing protocols into the design and operation of walkways and staircases required a recalibration of spatial allocations and flow directions to prevent overcrowding and to ensure public safety. Achieving this balance between maintaining efficient passenger movement and adhering to health guidelines is critical for sustaining operational integrity and ensuring public health within the subway station environment during pandemic periods [3,4].
Efficiently managing passenger flow in subway stations is critical, especially with the added complexity of COVID-19 social distancing measures. Congestion and bottlenecks at entry points, ticket counters, and transfer corridors can cause significant delays and discomfort, exacerbated during peak hours. Adapting infrastructure to maintain a two-meter distance between individuals requires reconfiguring walkways, seating arrangements, and platform areas, which reduces capacity and necessitates careful spatial planning. Operational adjustments are also vital, including managing entry and exit points to avoid bottlenecks, implementing directional flow patterns to streamline movement, and enhancing signage and floor markings to guide passengers. Increased staffing may be necessary to monitor compliance with health guidelines and assist passengers, ensuring a balance between safety and operational efficiency.
This study addresses these challenges by employing a discrete-event simulation (DES) approach to evaluate the performance of subway station walkways under the constraints of COVID-19 social distancing measures. The data used in this study were obtained from real conditions observed at a subway station in the city of Ningbo, China. This case study highlights the practical implications and applicability of the proposed model in a real-world setting, providing context-specific insights that are essential for effective subway station management during pandemic conditions. By modeling various scenarios with different passenger arrival patterns and walkway dimensions, the study provides detailed insights into how reconfigured walkways can be managed to maintain efficient passenger flow while adhering to social distancing guidelines. The study evaluates key performance metrics, such as the average area occupied by each passenger, dwell time, and blocking probability, under both normal and pandemic conditions. These metrics provide a comprehensive understanding of how social distancing impacts walkway efficiency and helps to identify optimal configurations and operational adjustments.

2. Literature Review

Efficient management of passenger movement in subway stations is a crucial aspect of urban transportation [5,6,7]. The application of queuing analytical models and simulations is increasingly acknowledged as essential for comprehending passenger arrival pattern and evaluating the capacity of subway stations [8,9,10]. Recent studies have employed different approaches to address the challenges of managing passenger flow in subway systems. One notable study utilized a multi-agent simulation tool to investigate optimal departure times for commuters during peak hours in subway stations [11]. This approach provided a dynamic and detailed understanding of passenger flow management during rush hours. Additionally, another study introduced an approach for the real-time calculation of subway station distribution capacity using automatic fare collection data and transit time metrics, analyzing both spatial and temporal dimensions of passenger flow, including cross-sectional passenger flow and hourly inbound traffic [12]. Another research initiative focused on developing a discrete-event simulation (DES) model specifically for controlling peak passenger flows in subway stations. The primary aim of this model was to reduce passenger delays by effectively managing congestion spread in high-traffic stations [13]. An analytical study centered on the Beijing subway network provided insightful findings regarding network capacity during peak hours, emphasizing different service level requirements [14]. This study highlighted the significance of transfer stations as congestion nodes and their impact on the overall capacity of the subway network, particularly in high-traffic scenarios. Another study proposed an event-driven simulation approach to assess the impact of interruptions on passengers’ path choice behavior, calculating passenger flow distribution under interruption events [15].
While existing models effectively assess passenger flow and station capacity, they often overlook the randomness inherent in passenger arrival patterns at stations. The Transit Capacity and Quality of Service Manual (TCQSM) [16] provides guidelines for designing and planning subway station service facilities, treating passenger arrival and service times as deterministic to achieve a specified level of service (LOS). However, this approach, categorized under D/D/C/C queuing systems, fails to accommodate variations in arrival rates and service times, limiting realism [17]. To address these limitations, researchers have focused on incorporating randomness in passenger arrivals and service times. The adoption of a phase-type (PH) distribution accurately models passenger arrival intervals, capturing the stochastic nature of passenger flow [18]. Another study introduced an advanced framework for analyzing subway station walkways by conceptualizing them as a G/G(n)/C/C state-dependent queuing system. This model accounted for the variability in both the arrival intervals of passengers and the service times, which vary depending on the current state, offering a more accurate depiction of the real-world situation [19]. Furthermore, researchers also integrated a simulation-optimization framework that considers fluctuations in passenger flow to determine optimal service facility layouts in subway stations [20]. These advancements aim to improve the accuracy and realism of models used in subway station planning and design.
In adapting public transit systems to COVID-19 pandemic challenges, recent research has centered on developing strategies for passenger flow management and safety assurance. A notable study included a mathematical optimization model employing the Fisher optimal division method to adjust the train scheduling and control the passenger flow, effectively minimizing COVID-19 transmission risk [21]. This strategy significantly lowered train load rates through strategic additions and flow control, proving to be a robust method for enhancing public transport safety during the pandemic. Furthermore, a study examining the Guangzhou subway revealed that health screening protocols impacted passenger flow and station congestion, resulting in increased waiting times and crowding. To mitigate these issues and boost operational efficiency, the deployment of automatic infrared thermometers and the reorganization of health screening processes were recommended, aiming to alleviate delays and diminish congestion [22]. Additionally, research at Moscow railway stations highlighted the influence of entrance flow management on passenger satisfaction. By using predictive modeling and conducting passenger surveys, this study accentuated the importance of accurate flow predictions and strategic control measures in improving safety and satisfaction level [21]. Another study introduced an STL-LSTM model, which integrates long short-term memory neural networks with seasonal-trend decomposition in order to predict daily bus passenger flows during the pandemic [23]. A separate study also assessed COVID-19 related behaviors in public transport systems, focusing on preventive actions, like physical distancing and mask-wearing, among passengers in taxis and buses. The findings revealed the importance of such preventive behaviors in mitigating virus transmission, with significant observations on gender and socioeconomic status differences in adherence to these measure [24]. In a comparative analysis focused on assessing behavioral shifts toward public transportation usage during the COVID-19 pandemic in Bangkok and Jakarta, substantial dips in bus patronage were observed. The study deployed structural equation modeling to dissect the multifaceted influence exerted by specific determinants on the propensity towards employing public transit services. It was deduced that concrete quality attributes of the service and the enactment of health-related protocols substantially bolster passengers’ trust and their predisposition to opt for public transportation during pandemic conditions [25]. A study conducted in Nashville and Chattanooga, Tennessee, USA, revealed that COVID-19 caused significant initial ridership drops of 66% in Nashville and 65% in Chattanooga. Foot traffic recovery outpaced transit ridership in Chattanooga from mid-April to late June 2020. Education level significantly impacted changes in fixed-line bus transit, with similar demand patterns observed for paratransit services [26]. Similarly, a discrete choice analysis with 961 pre-pandemic London Underground users revealed that travel time valuation increases by 73% in crowded conditions. Mandatory face masks significantly boost demand recovery, though 30% of users have a negative response. Preferences vary, with younger males earning below GBP 10,000 showing fewer positive effects from face mask mandates [27]. In another study related to the London Underground, a data-driven agent-based simulation framework was introduced to improve safe mobility and reduce COVID-19 contagion on urban transit networks. Focusing on the Victoria line of the London Underground, the model assesses interventions, like train headway and dwell time adjustments. Results showed performance improvements between 12.3% and 195.7% when compared to pandemic operations [28].
While existing models effectively assess passenger flow and station capacity, they often overlook the randomness inherent in passenger arrival patterns at stations. Previous studies have utilized deterministic approaches, treating passenger arrival and service times as fixed values to achieve a specified level of service (LOS). This approach fails to accommodate variations in arrival rates and service times, limiting realism and the ability to capture the stochastic nature of passenger flow. Furthermore, although recent research has developed strategies for managing passenger flow and ensuring safety during the COVID-19 pandemic, these studies have not specifically explored the performance of subway station walkways under the enforced 2 m social distancing protocol. This gap in the research underlines the necessity for a dedicated investigation into how social distancing measures impact passenger flow and station capacity in the context of pandemic conditions.
This research aims to fill this void by employing a discrete-event simulation (DES) model to scrutinize the dynamics of walkways in subway stations, considering the 2 m distancing guideline. The main achievements of this study include the following:
  • Development of a DES model to evaluate the performance of subway station walkways.
  • Assessment of key performance metrics under both normal and pandemic conditions.
  • Insights into the impact of social distancing measures on walkway efficiency and congestion.
To consider variability in the passenger flow, PH distribution will be utilized to accurately model the arrival process and state-dependent service times of passengers [20,29,30]. By simulating a range of scenarios, including varying walkway dimensions and passenger arrival patterns, the research intends to unearth insights into best practices for walkway management that facilitate efficient passenger movement while complying with health safety protocols. This approach will enrich existing transportation research and introduce innovative solutions to bolster the safety and reliability of subway systems during pandemic conditions.

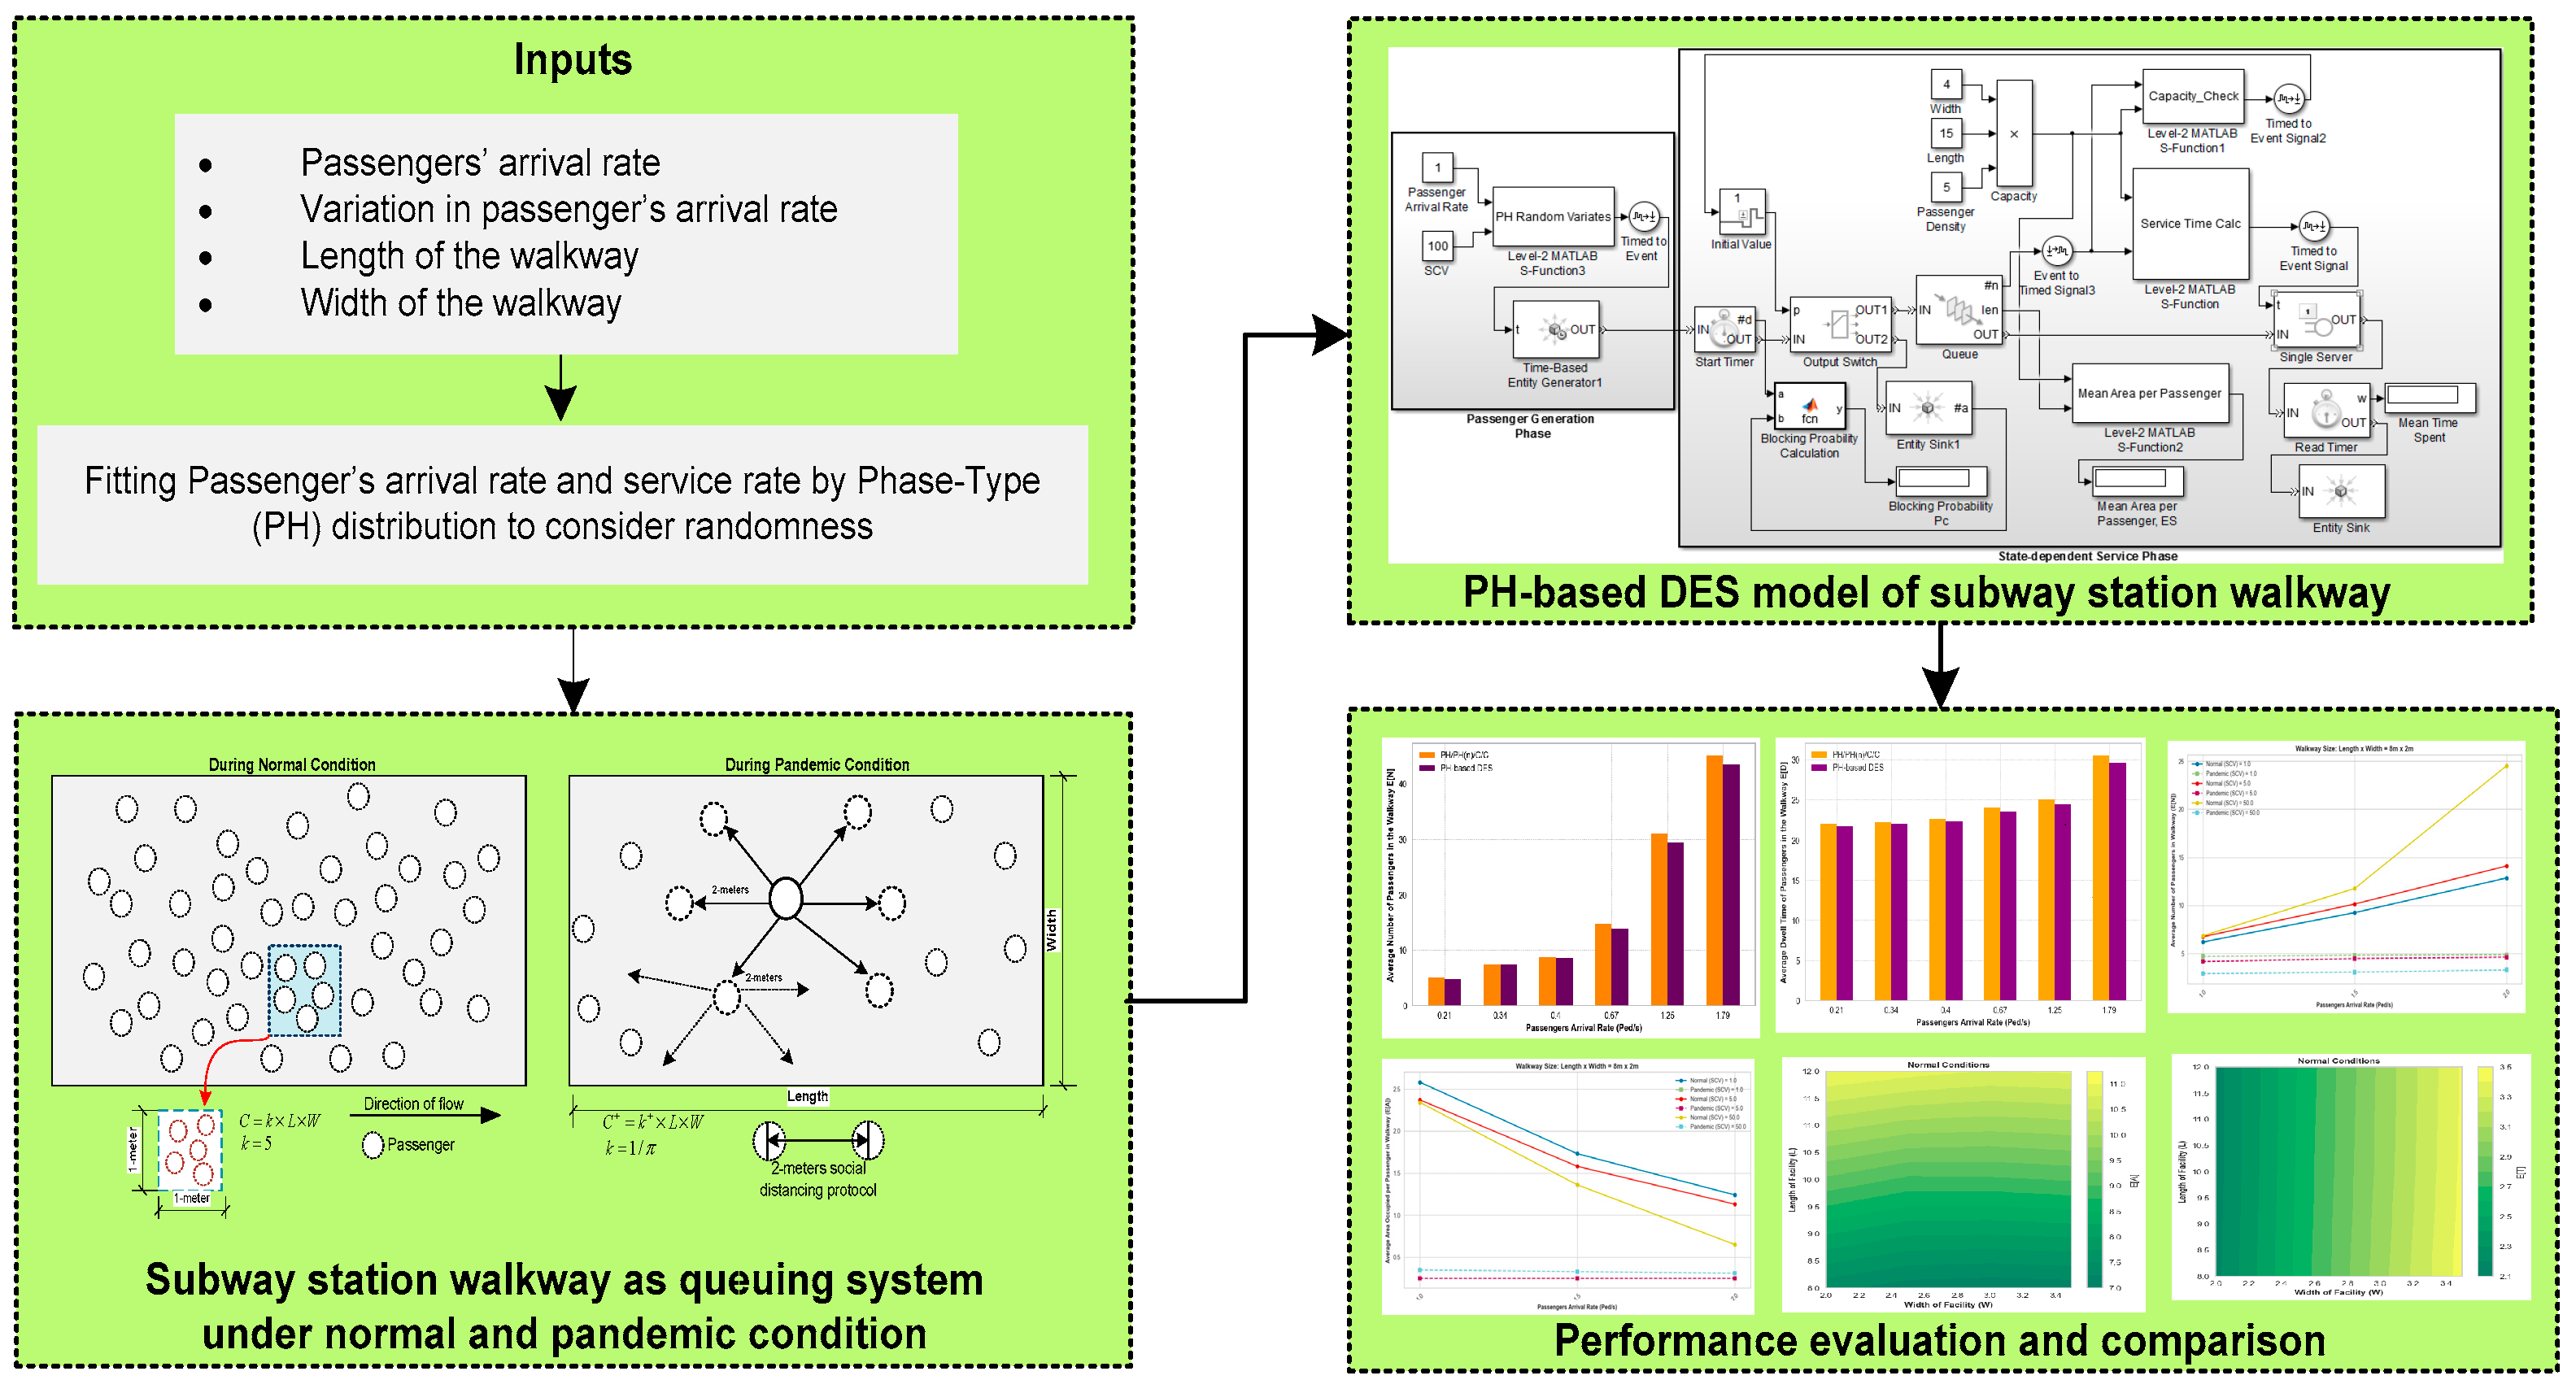
3. Materials and Methods

To comprehensively assess the simultaneous impact of COVID-19 social distancing protocols on subway station walkway performance and the variability in passenger flow, a PH-based discrete-event simulation (DES) model was developed. The model is depicted in Figure 1 and forms the foundation for evaluating key performance metrics under varying conditions. The following sections describe the detailed methodology, including the conceptualization of the walkway as a queuing system, the architecture of the PH-based DES model, and the validation process with an existing mathematical queuing model.

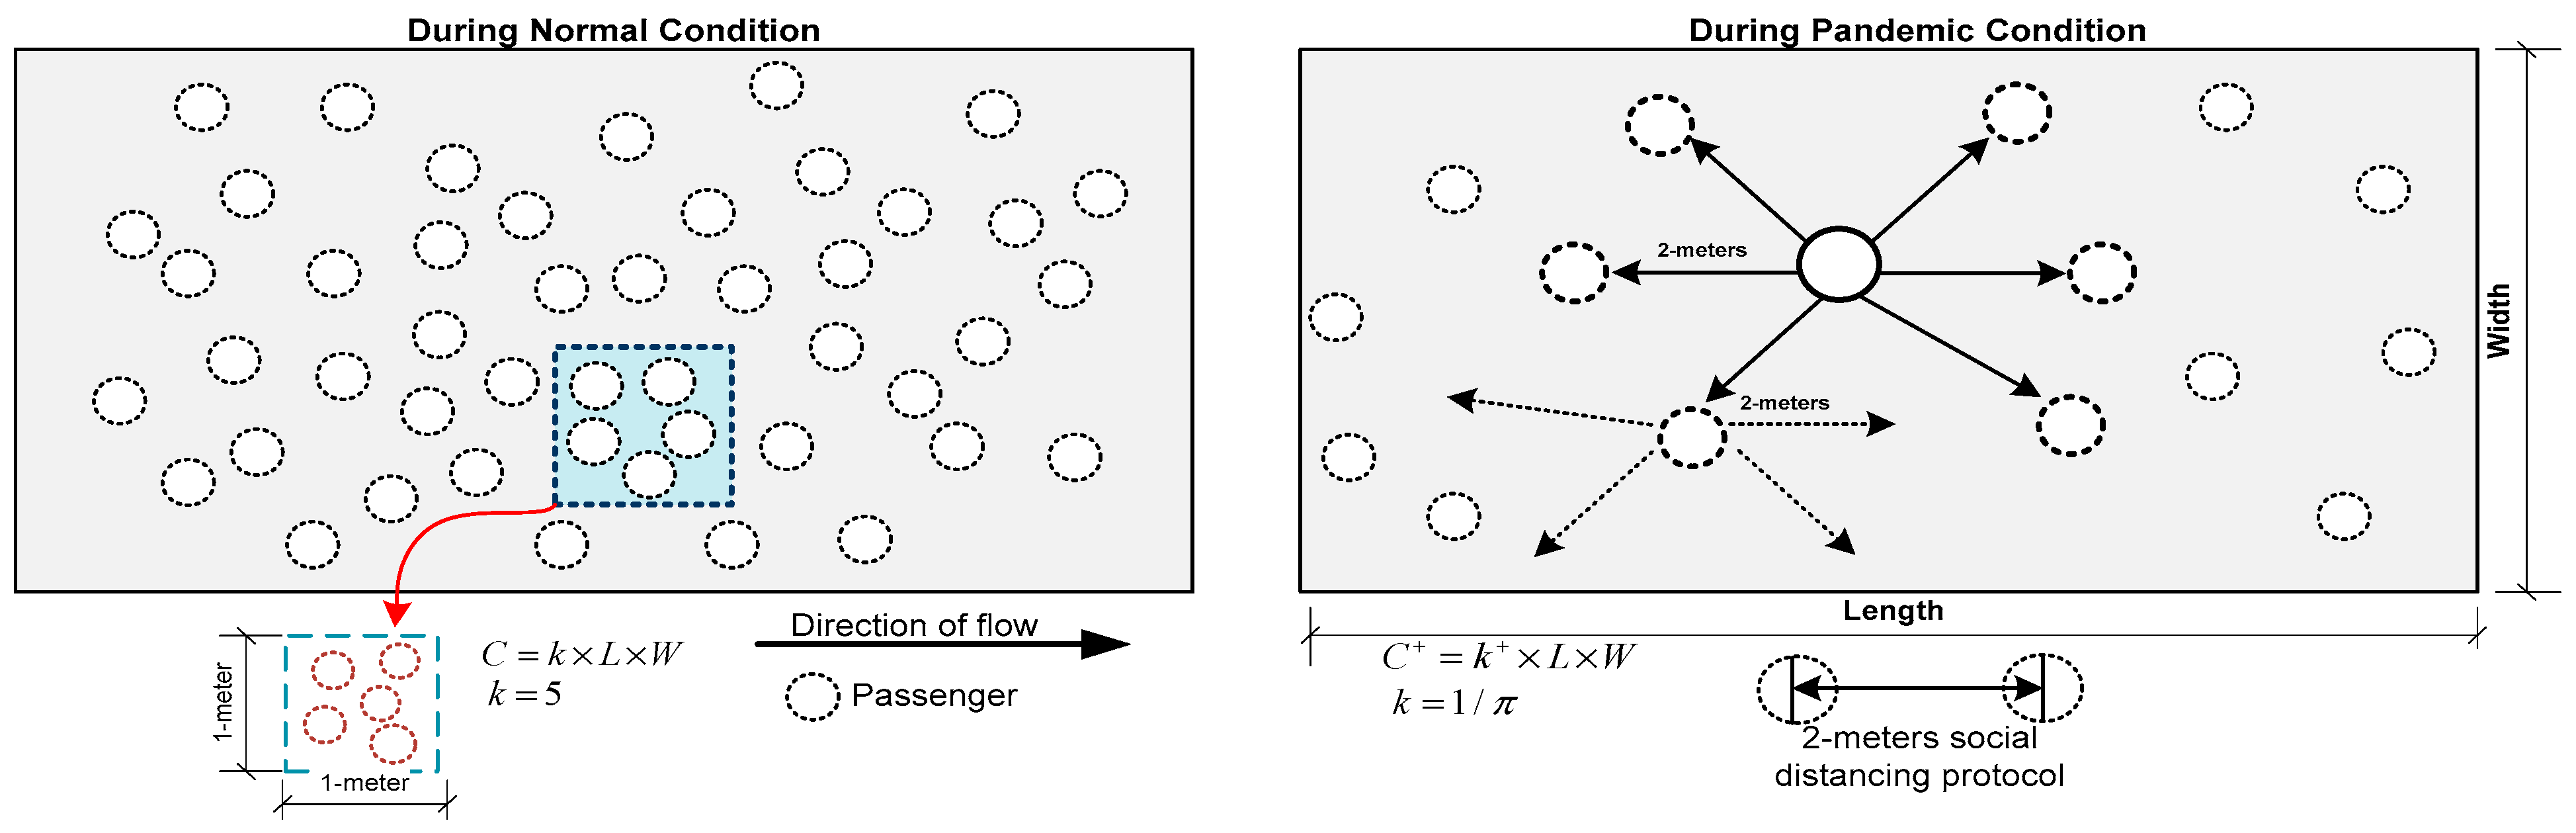
3.1. Illustration of Subway Station Walkways as a Queuing System

Inspired from the idea of [13], to understand the capacity and operation of a rectangular walkway facility at a subway station, several factors are considered, including the area of the walkway, the density of passengers, and the walking speed of passengers under different conditions. The capacity of the walkway, C, is a function of the area of the walkway and the density of passengers per square meter [31,32], as defined by the following Equation (1):
C = k × L × W
where
  • C is the capacity of the walkway in terms of the number of passengers it can accommodate.
  • k is the density of passengers per square meter (passengers/m2).
  • L is the length of the walkway in meters.
  • W is the width of the walkway in meters.
Under normal conditions, the maximum value of k is five passengers per square meter [33]. This value represents a high-density situation where passengers are close to each other without any enforced social distancing as shown in Figure 2. However, during a pandemic, social distancing protocols may require each passenger to maintain a distance of 2 m from others. This changes the effective density of passengers, k + , on the walkway. Assuming that each passenger occupies a circular space with a radius of 1 m (to maintain a 2 m distance from all directions), the area occupied by each passenger is given by the following Equation (2):
A r e a p e r   p a s s e n g e r = π × 1 m 2 = π m 2
Thus, the revised density of passengers, k + , under pandemic conditions is given by the following Equation (3):
k + = 1 π passengers / m 2
Substituting k + into the original capacity equation, the adjusted capacity, C + , is shown by the following Equation (4):
C + = L × W π
In viewing the walkway as a queuing system, where each available spot that a passenger occupies is akin to a server, the total number of servers in this system is equal to the walkway’s capacity C . As more passengers fill these vacant spots, the walking speed of each passenger decreases, making the walking speed dependent on the current state V n , or in other words, the number of passengers on the walkway at any given time is given by Equation (5), as follows:
V n = V 1 C + n 1 / n
where
  • V1 is the walking speed of the lone passenger.
  • n is the current number of passengers on the walkway.
Equation (5) signifies that as the walkway becomes more crowded, the efficiency of movement through it decreases, reflecting the dynamic and state-dependent nature of walking speed among the passengers [34]. The service time, t n , which is the time taken for a passenger to walk through the walkway, also become state-dependent and is given by Equation (6), as follows:
t n = L / V n
By incorporating Equation (5) into Equation (6), the following Equation (7) is produced:
t n = n × L C + n 1
To capture the randomness and variability inherent in the passengers’ arrival process, a phase-type (PH) distribution is employed to model the arrival rates of passengers [35,36]. The PH distribution is characterized by its structure, which is composed of an initial distribution vector (α) and a sub-generator matrix (T). This setup effectively models a Markov chain, where each state represents a “phase” in the arrival process, and transitions between states occur according to the rates specified in T, until the process reaches an absorbing state, signifying an arrival event.
  • α: A probability vector that defines the initial distribution across the phases. It determines the likelihood of starting in any given phase when the arrival process begins.
  • T: A sub-generator matrix that contains the transition rates between the phases. The off-diagonal elements represent the rates of transitioning from one phase to another, while the diagonal elements are negative values indicating the rate of leaving a particular phase.
Therefore, subway station walkway can be represented as a PH/PH(n)/C/C queuing model that incorporates phase-type distributions to represent both the arrival process of passengers and their service times, within a walkway defined by a specific capacity and number of servers.

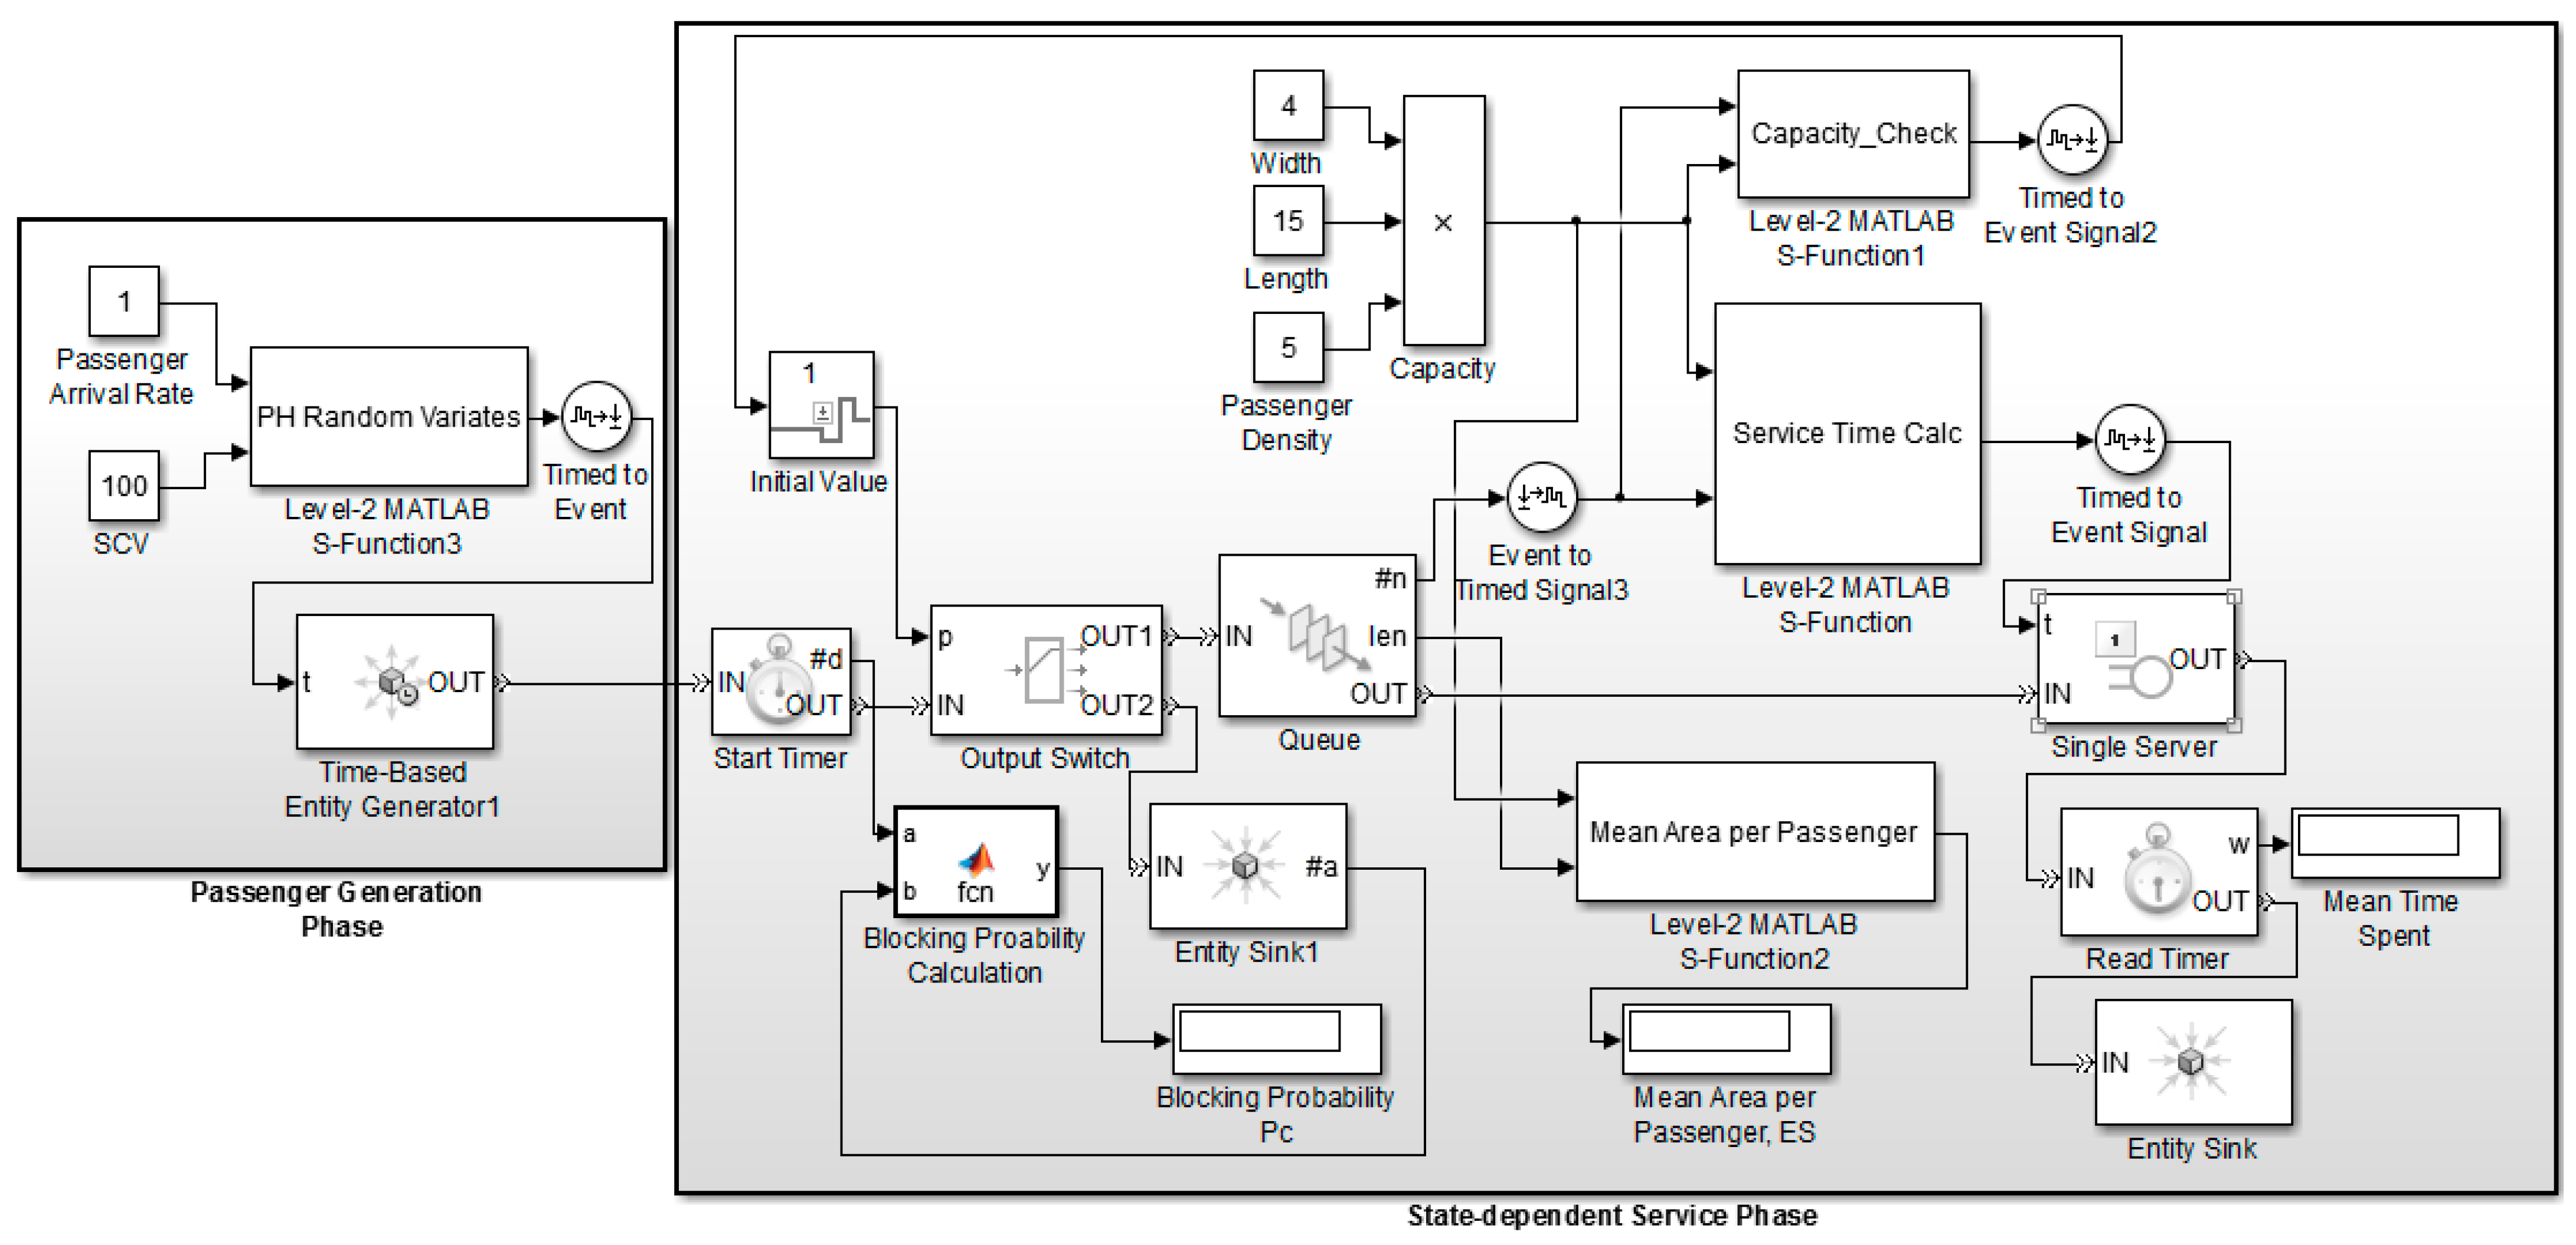
3.2. PH-Based DES Model Architecture of Subway Station Walkway

The PH-based DES model for a subway station walkway is depicted in Figure 3, developed using the SimEvents module of MATLAB 2013b. The SimEvents module is highly suitable for DES modeling due to its robust integration with the MATLAB programming environment. This integration allows for extensive customization, making it an excellent choice for complex scenarios, like our evaluation of COVID-19 impacts on subway station walkways. By utilizing SimEvents, custom DES models can be implemented that incorporate specific features, such as phase-type (PH) distributions for passenger arrivals and state-dependent service times, tailored to pandemic-related requirements.
The proposed DES model consists of two phases: the passenger arrival phase and the service phase. Both the arrival and service processes are driven by random variates generated from the phase-type (PH) distribution. For a more detailed discussion on the generation of PH-based random variates using various techniques, including the matrix exponential method, interested readers may refer to [37]. The key blocks used in the development of PH-based DES model in SimEvents module are Level-2 S-Function blocks, the MATLAB Function block, the FIFO-Queue block, and the Server block. The Level-2 S-Function blocks allow us to define custom DES states using MATLAB S-function APIs. It enables us to incorporate MATLAB algorithms into models that can be simulated in SimEvents and provides a way to create our own blocks with custom behaviors that can interact with other SimEvents blocks in the model. The MATLAB Function block is used for executing MATLAB code in the SimEvents DES model. It is useful for implementing user-defined logic that affects the behavior of entities in the simulation, such as routing logic or complex decision-making processes. The FIFO-Queue block is used to store entities when they cannot be processed immediately. Entities enter the queue and are stored until the downstream components are ready to process them. They are then released in the order that they entered, adhering to the first-in, first-out principle. The Server block represents a service station where entities are processed one at a time or in batches. It is a fundamental block for modeling service time within a system (a subway station walkway in our case).

3.2.1. Passengers’ Arrival Phase

The passengers’ arrival process with the randomness in the flow to the circulation facility is described by the mean passengers’ arrival rate ( Γ ) , which is the squared coefficient of variation (SCV) of their inter-arrival time. These descriptors of arrival process are obtained by using the field data, including the peak-hour volume of passengers ( q ) and peak-hour factor Δ , as shown in the following Equation (8):
Γ = q Δ
In the passengers’ arrival phase architecture of the DES model, a Level-2 S-function block is used to generate random variates from a PH distribution using input from Equation (8).

3.2.2. State-Dependent Service Phase

After the generation of passengers in the first phase, the passengers traverse the walkway facility. The dwell time of passengers on the walkway is actually the service time of the walkway facility, as shown by Equation (7). To integrate this aspect into the DES model architecture and to ensure that the number of incoming passengers does not exceed the total capacity of the walkway, passengers’ arrivals from the upstream side are accumulated in the FIFO_Queue block before proceeding to the Server block. The MATLAB Function blocks within this phase serve the following purposes:
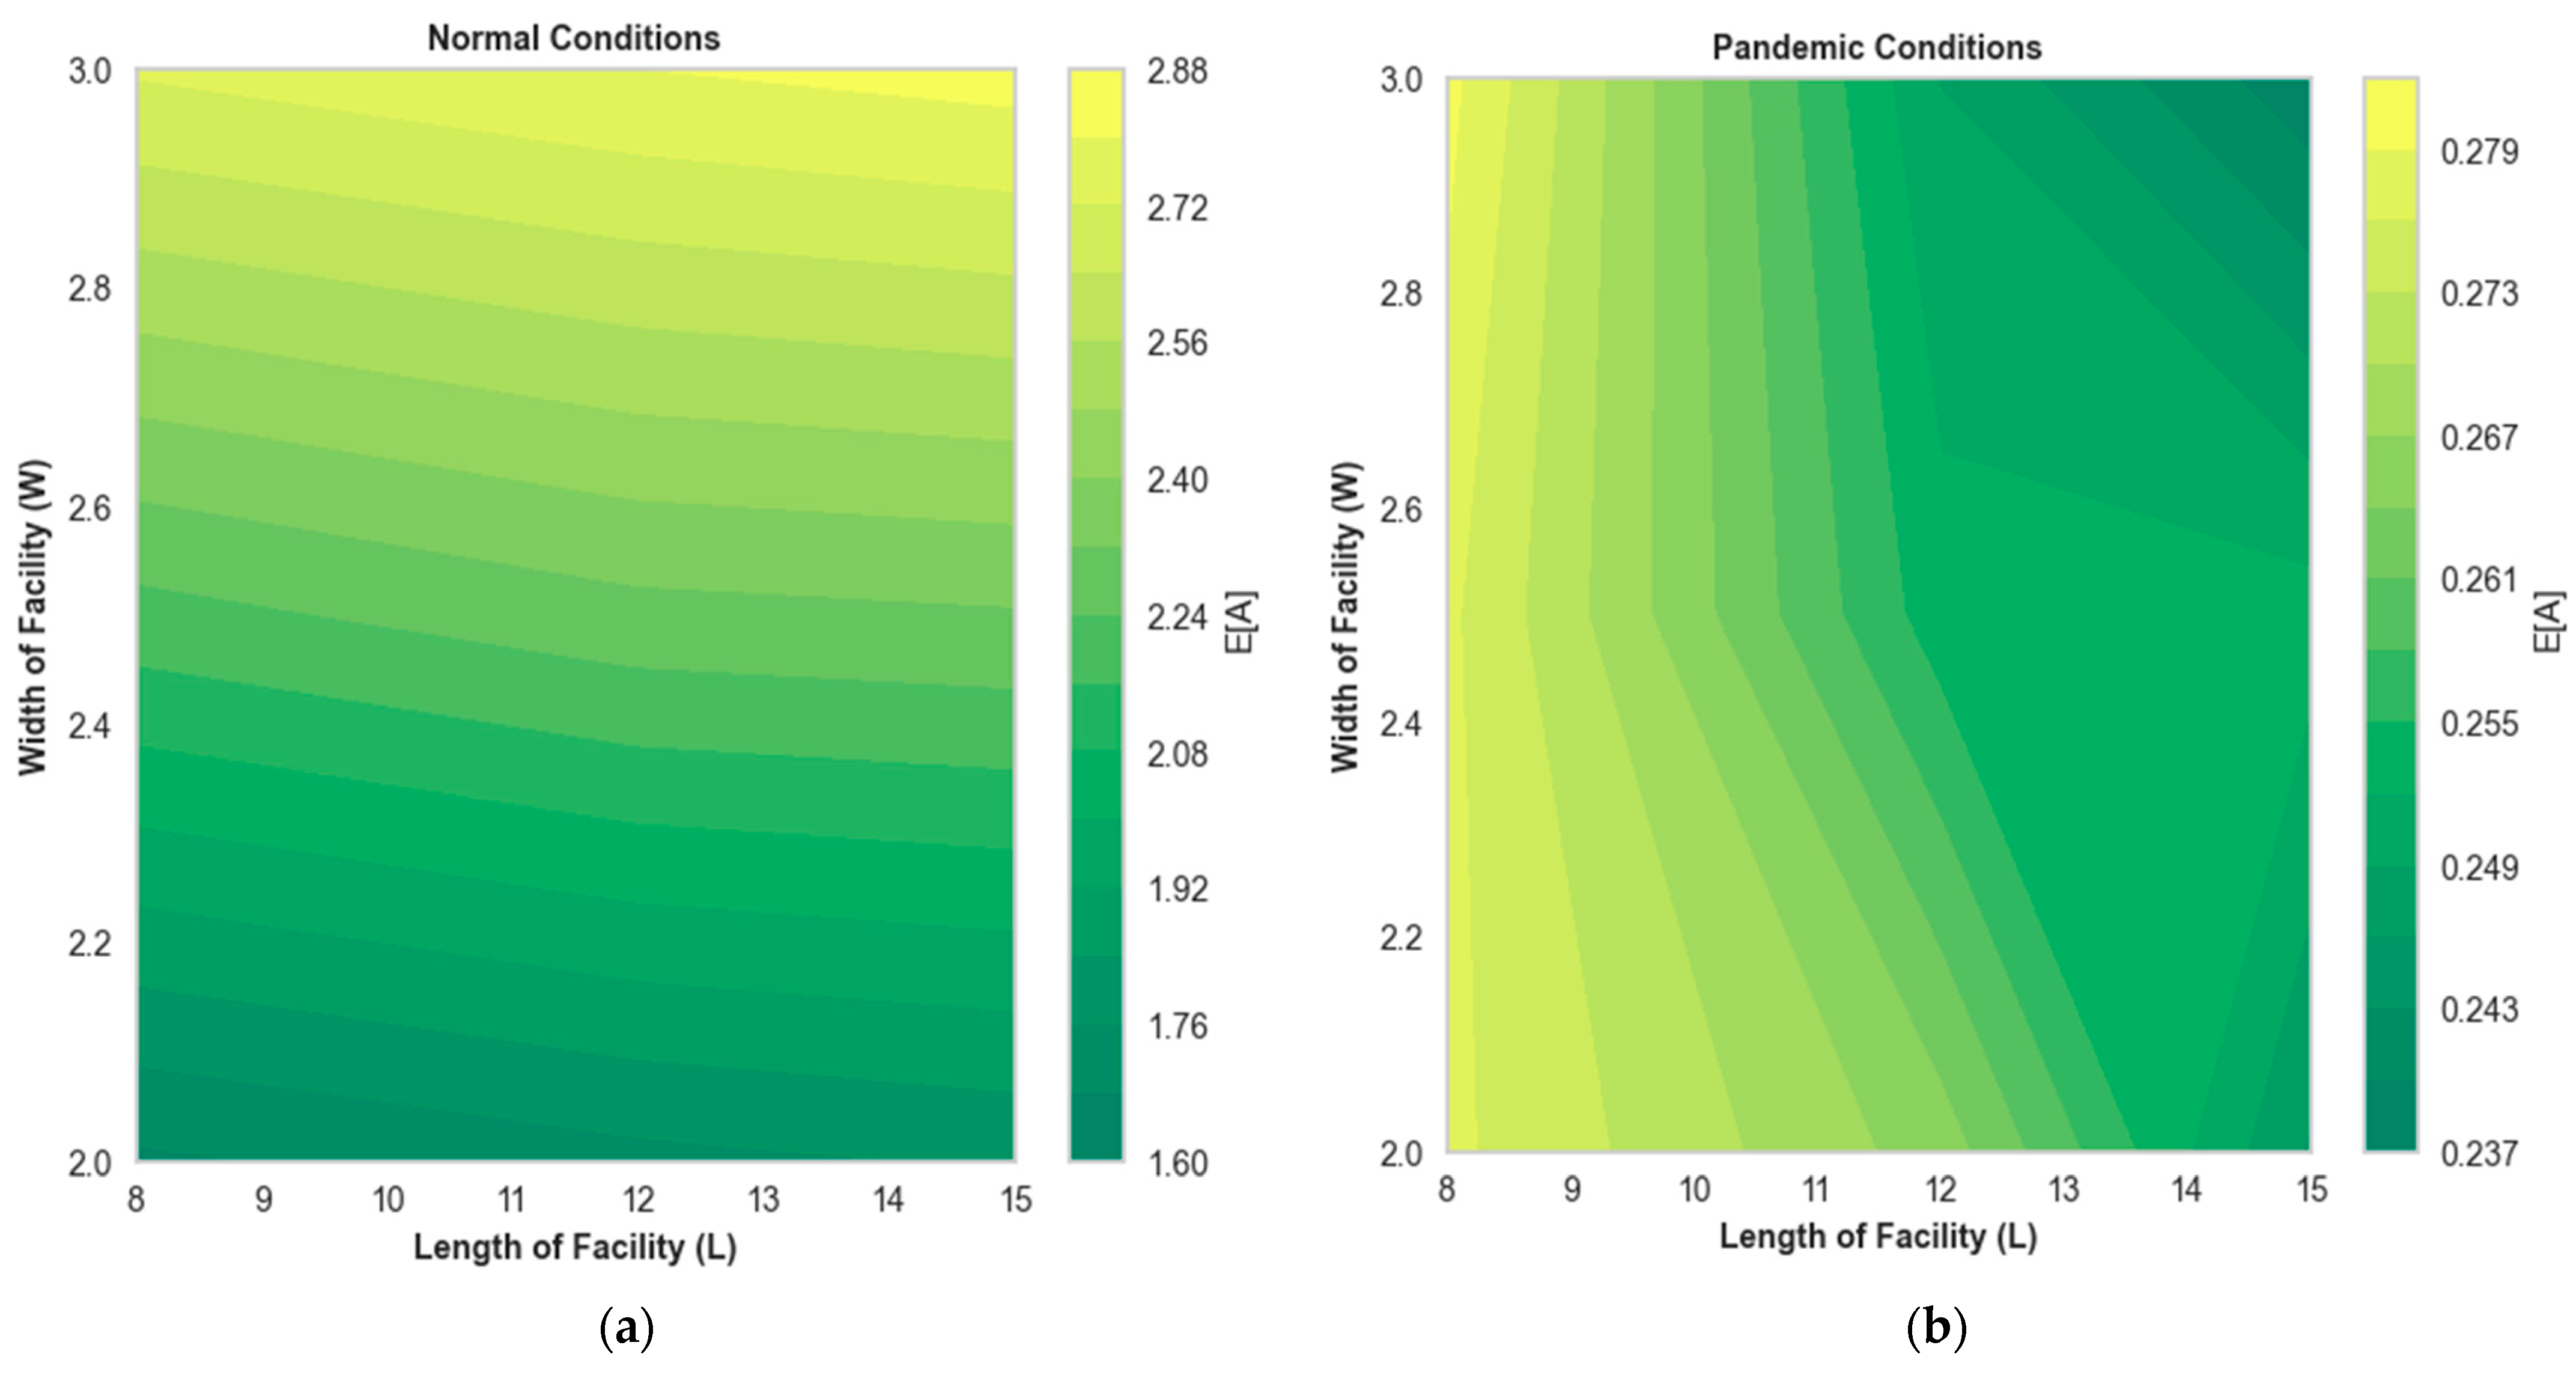
  • They calculate the average area occupied per passenger, E[A], which equals the facility’s area divided by the average number of passengers in the facility, E[N]. The E[N] value is directly sourced from the FIFO_Queue block.
  • The Function blocks also monitor the number of passengers, checking if it reaches or surpasses the facility’s capacity. Passengers normally pass through the first entity port of the Output Switch block. However, if they exceed the facility’s capacity, the Function block blocks their entry and triggers the second entity port of the Output Switch block to redirect the excess passengers.
  • The blocking probability is then determined as the ratio of the number of passengers exiting through the second entity port of the Output Switch block to the total number of arriving passengers.

3.3. Performance Metrics

In order to assess walkways under both normal and pandemic conditions and to validate the proposed PH-based DES model, various performance metrics were utilized. These metrics include the following.

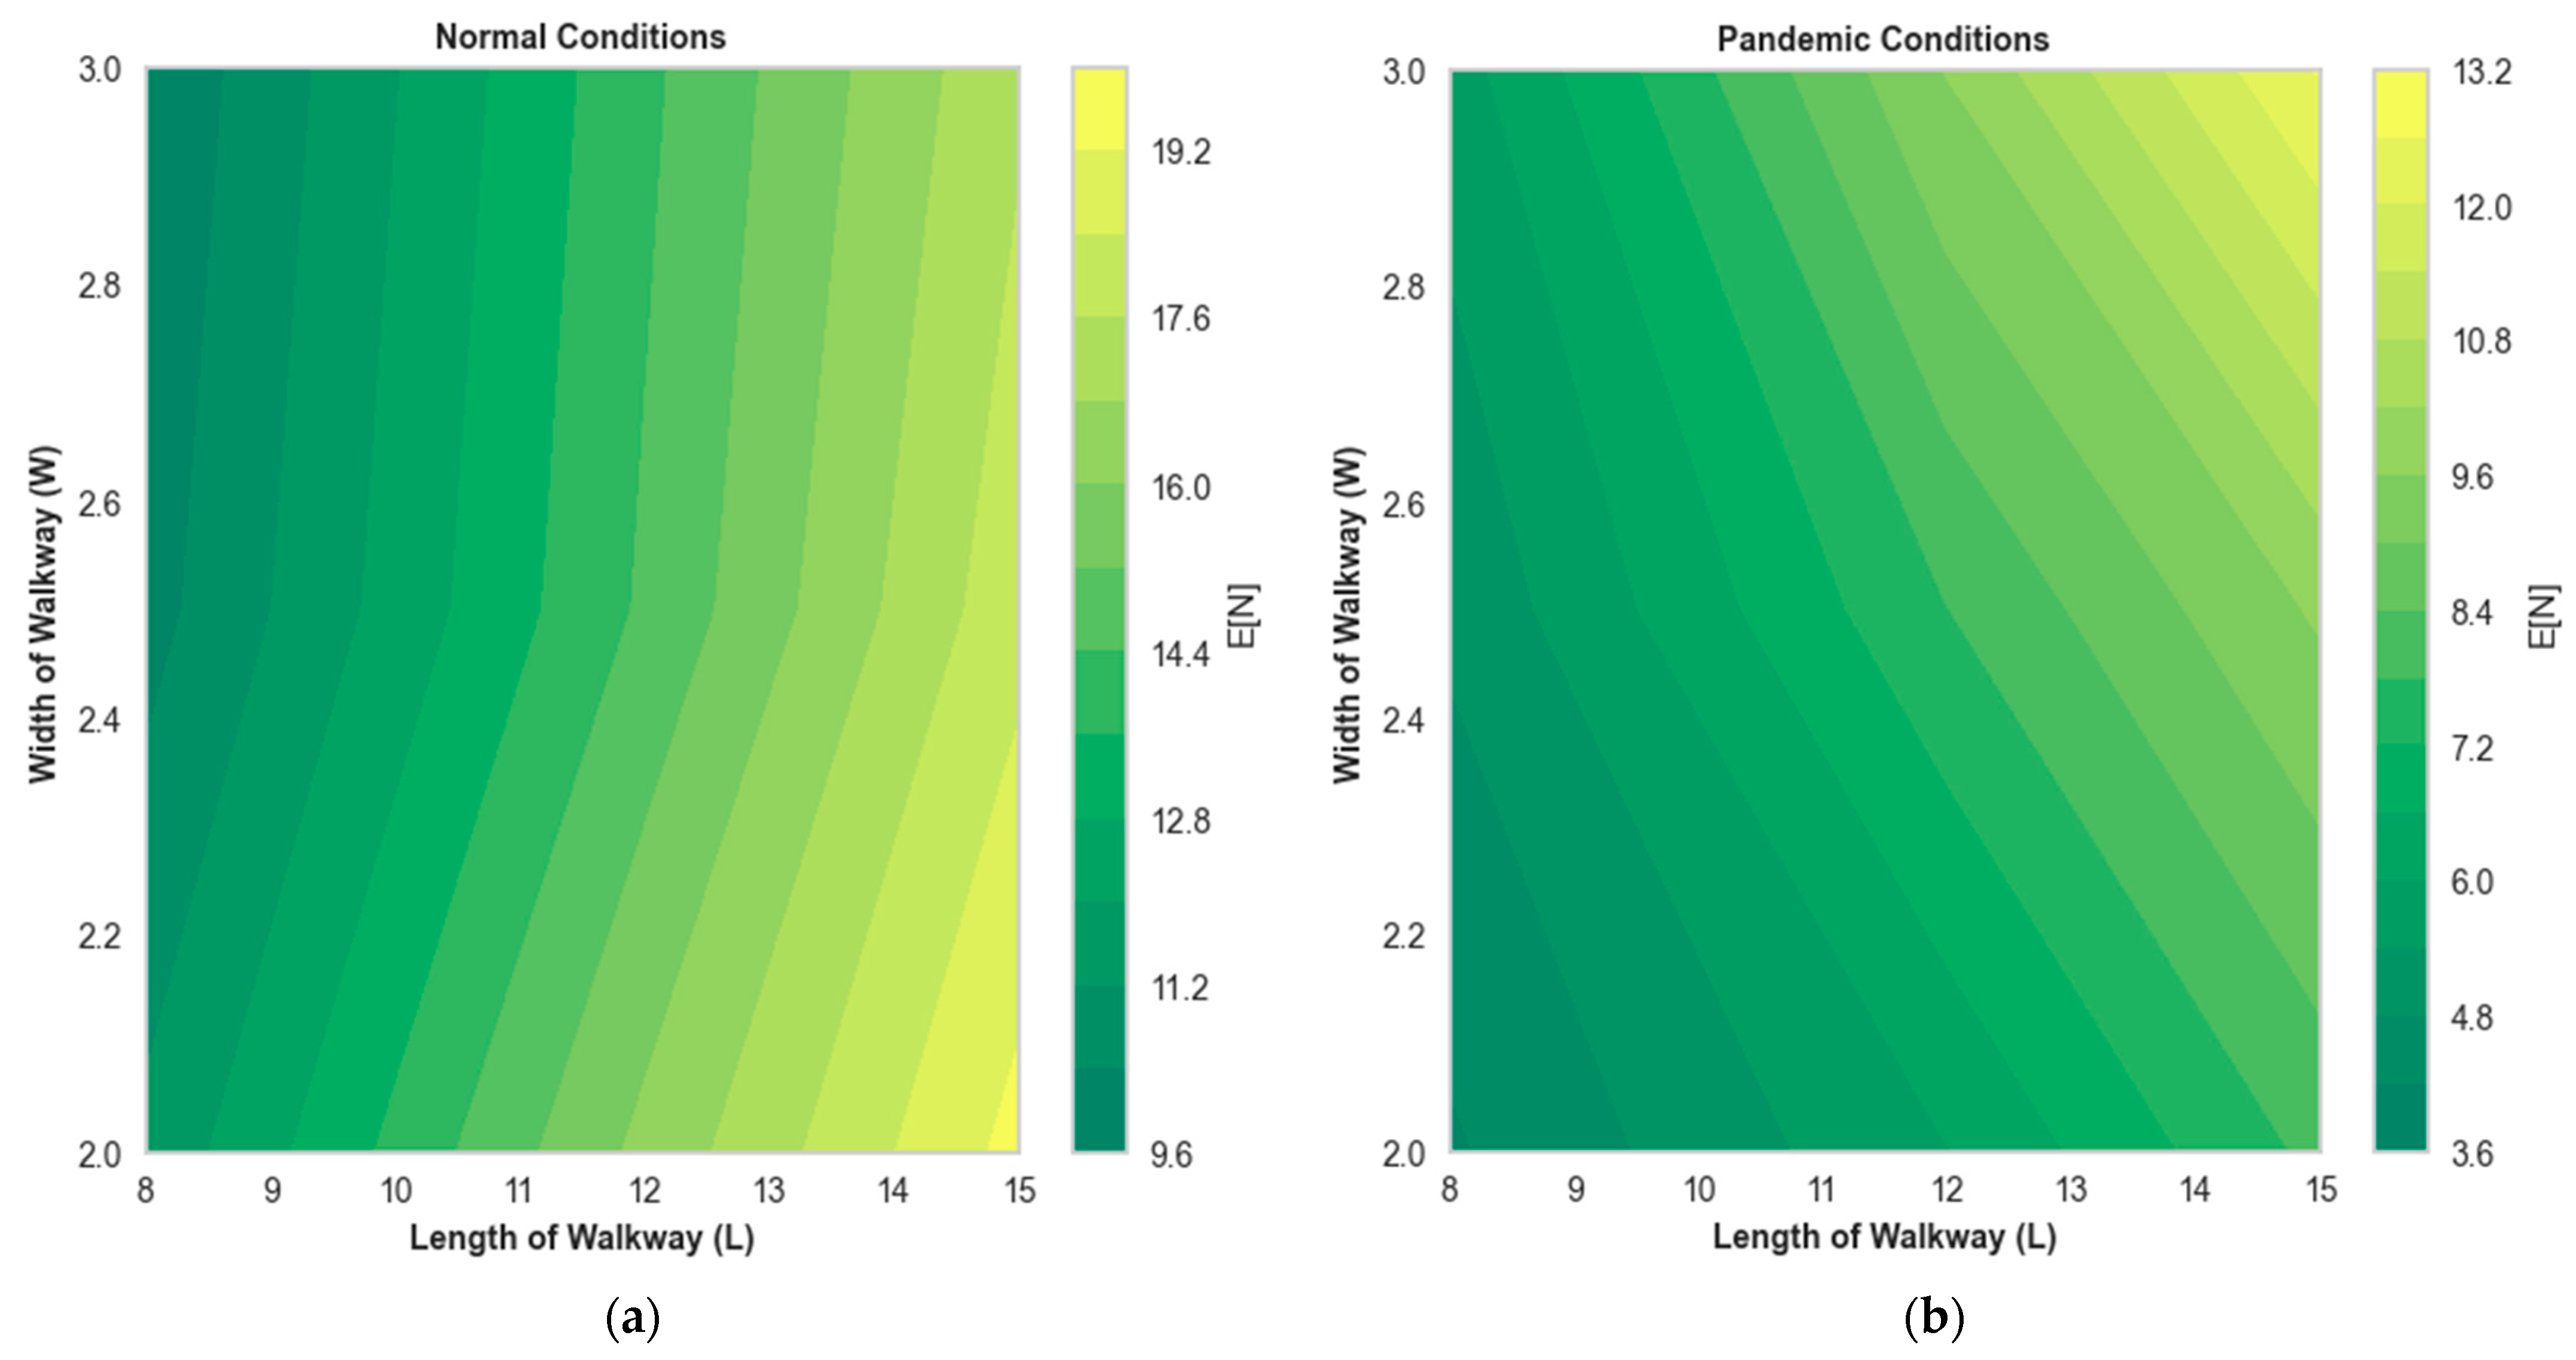
3.3.1. Average Number of Passengers on the Walkway (E[N])

This metric measures the average number of passengers present on the walkway at any given time. It helps assess the congestion levels and the capacity utilization of the walkway.

3.3.2. Average Dwell Time (E[T])

Dwell time refers to the average time passengers spend on the walkway. This metric is crucial for understanding the efficiency of passenger movement through the walkway and identifying potential delays.

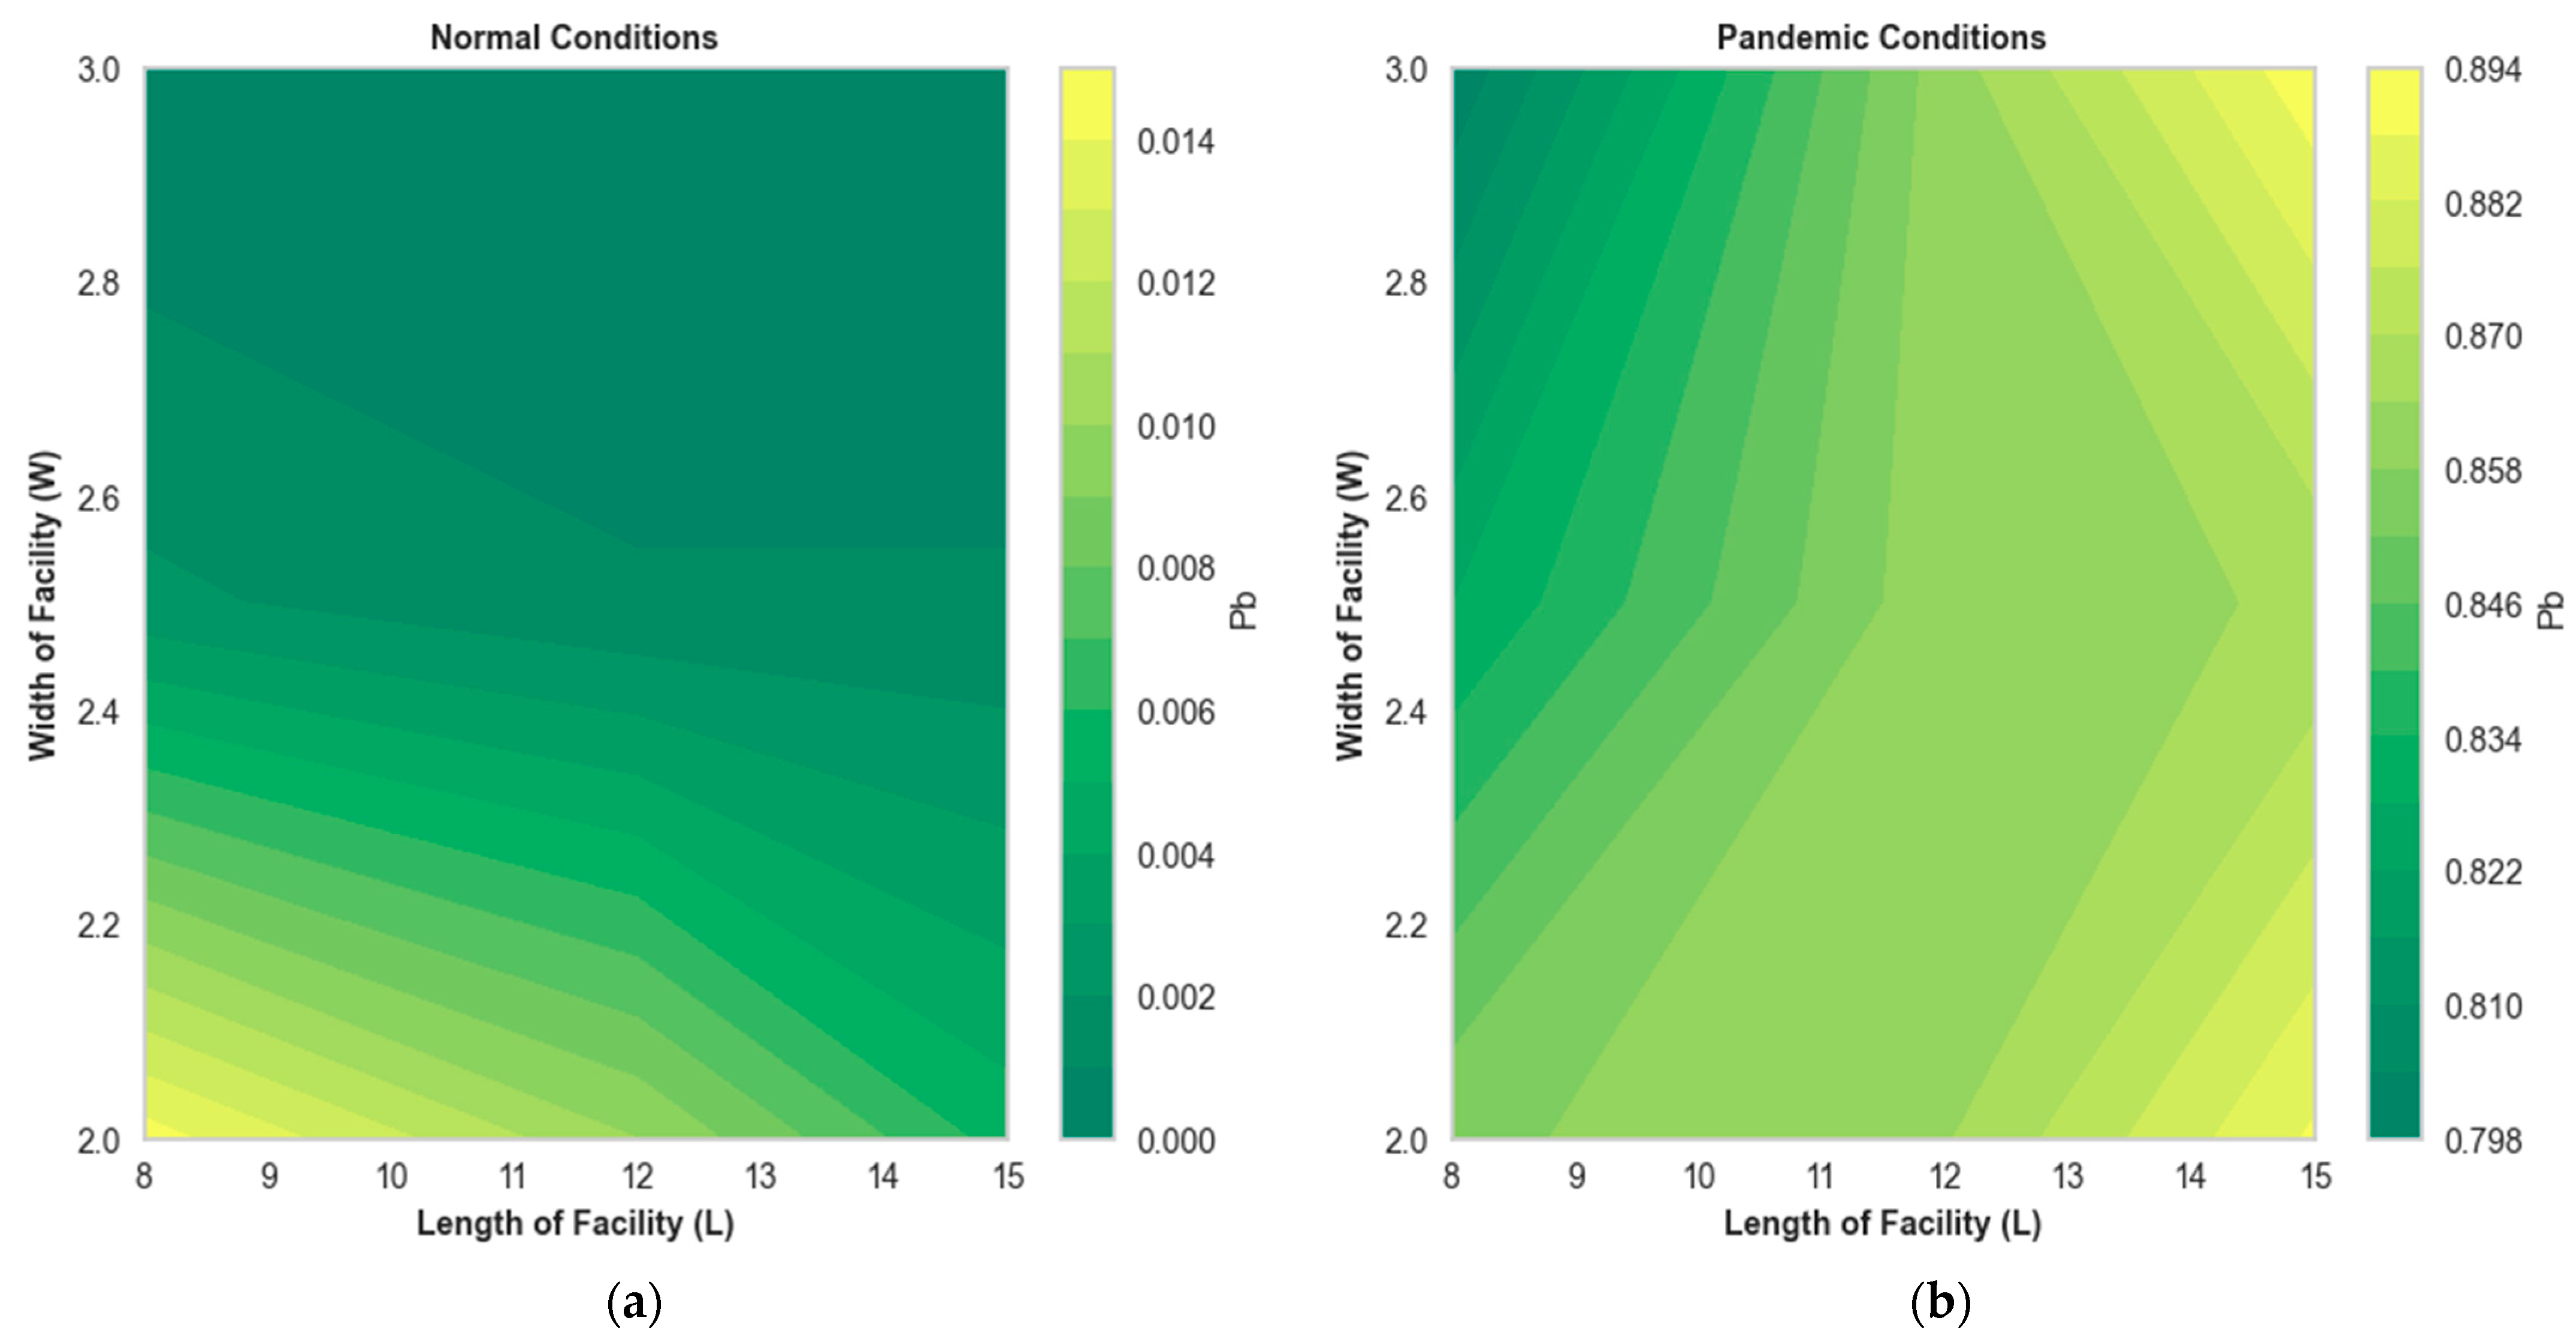
3.3.3. Blocking Probability (Pb)

Blocking probability indicates the likelihood of passengers being unable to enter the walkway due to congestion. This metric helps evaluate the impact of social distancing measures on walkway accessibility and overall congestion management.

3.3.4. Average Area Occupied per Passenger (E[A])

This metric measures the average space available to each passenger on the walkway. It is essential for assessing compliance with social distancing protocols and ensuring passenger comfort and safety.

4. Results and Discussion

In this section, experiments were conducted using the developed PH-based DES model to evaluate a subway station walkway under both normal and pandemic conditions. The PH-based DES model was employed to assess crucial performance metrics, providing a comprehensive understanding of the operational efficiency of the subway station walkway. This assessment is essential for evaluating the system’s current state and identifying potential bottlenecks or inefficiencies.

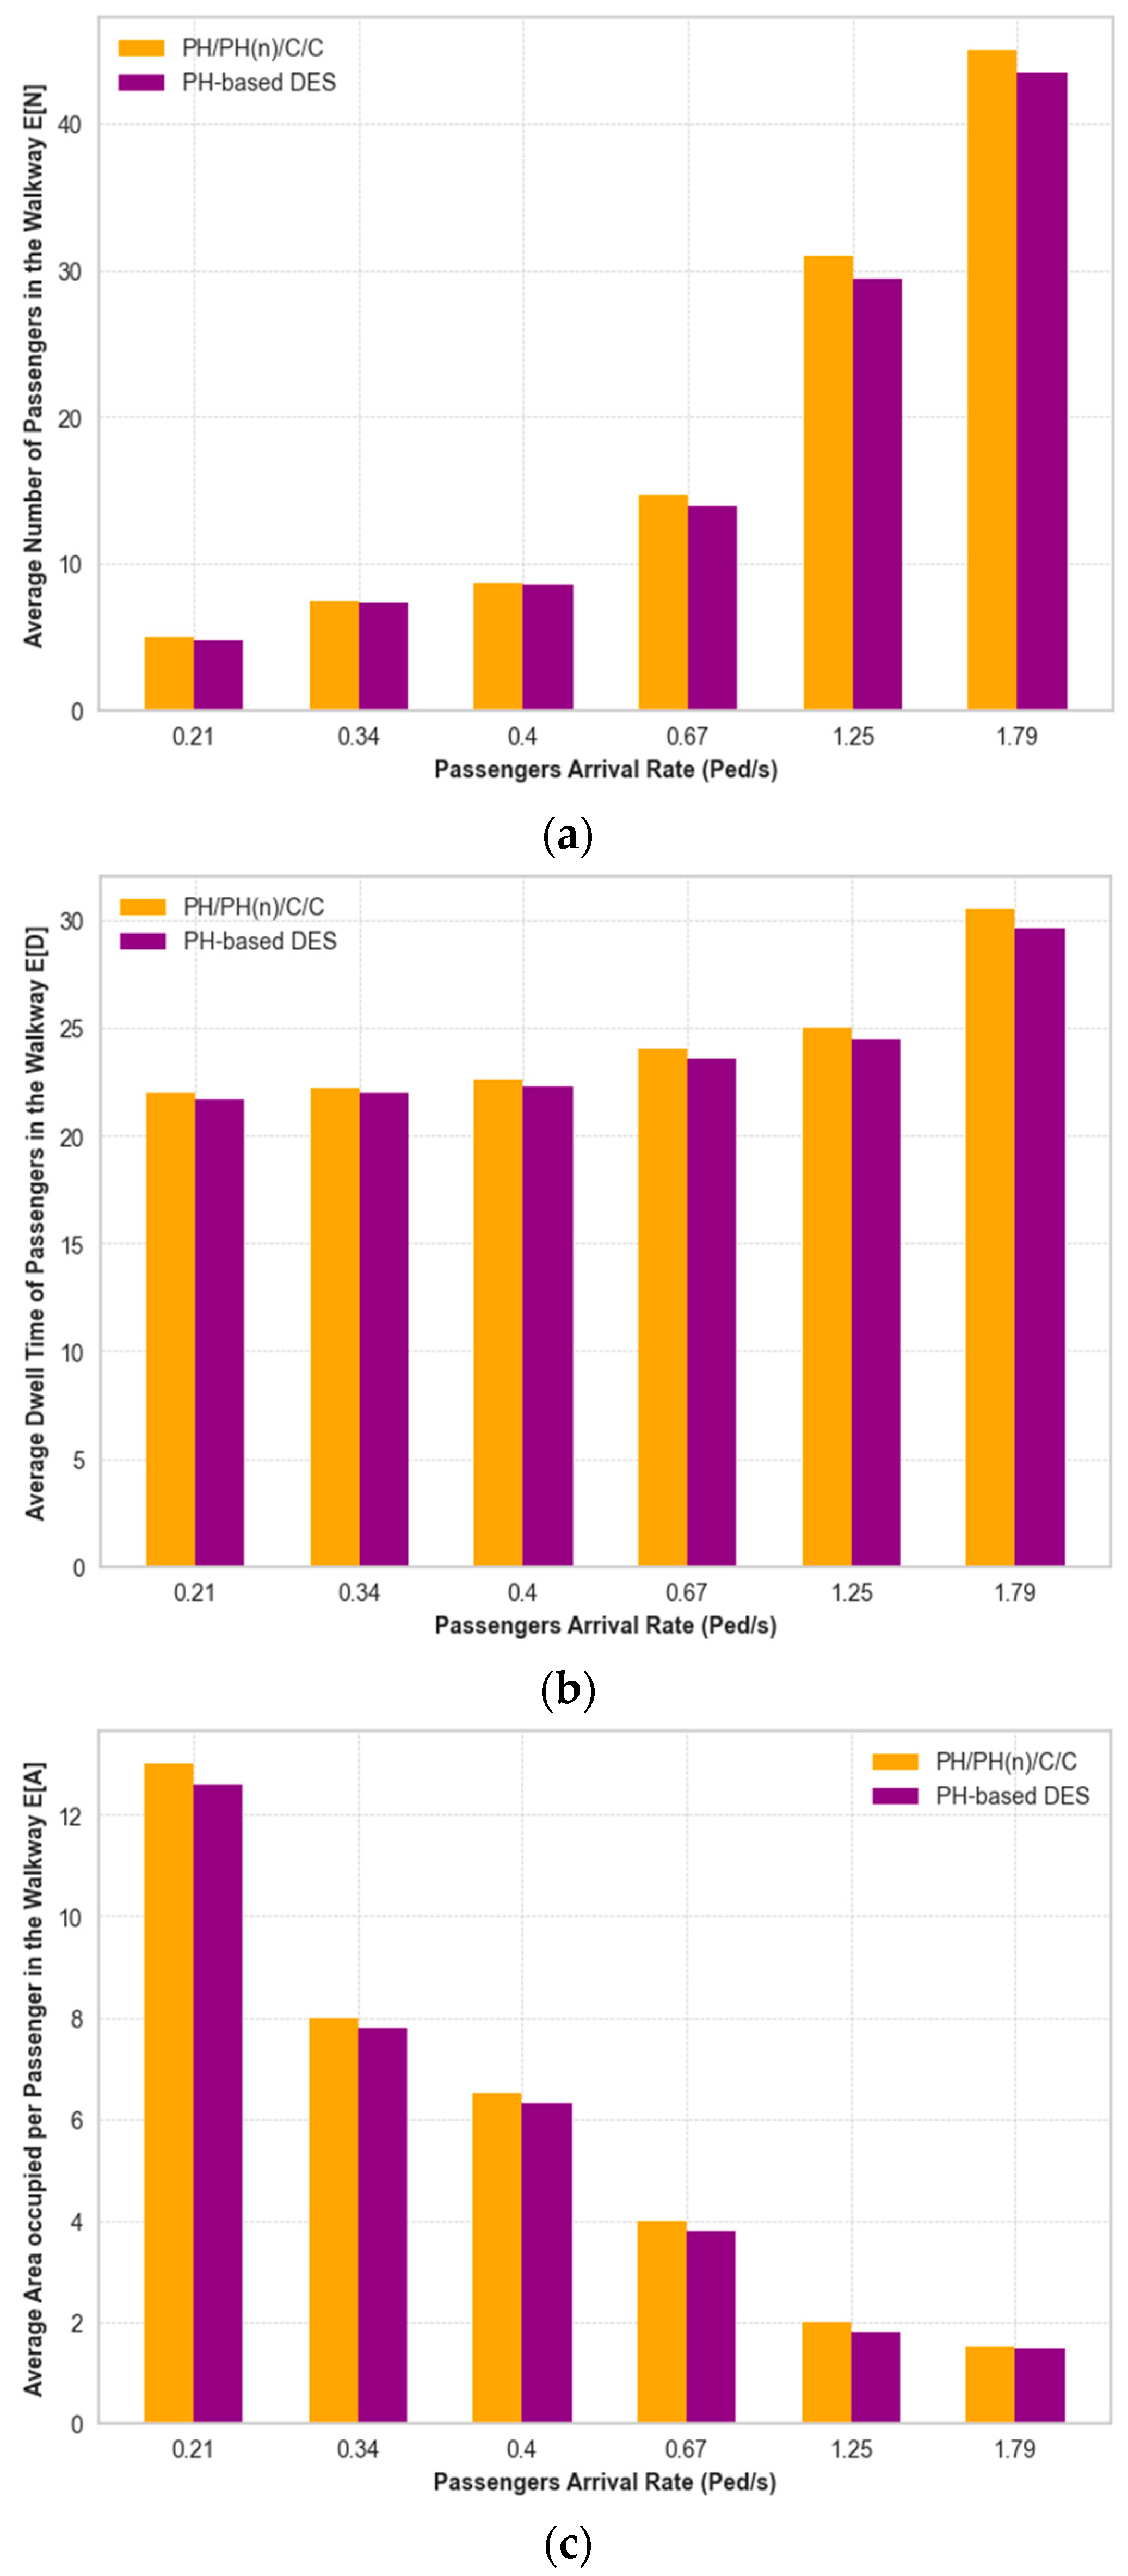
4.1. Validation of Proposed PH-Based DES Model

4.1.1. Initial Experiments and Setup

Initial experiments were conducted to validate the accuracy of the proposed PH-based DES model. These tests centered on a horizontal walkway within a subway station, measuring 30 × 2 square meters. It is important to note that the actual width includes an additional meter, accounting for a 0.5 m buffer on each side, as recommended by the TCQSM. Performance metrics, such as the average number of passengers, average dwell time of passengers, and average area occupied per passenger in the walkway facility, as estimated by the proposed PH-based DES model, were compared with those derived from the mathematical PH/PH(n)/C/C queuing model of a subway station walkway facility [33]. This model is a sophisticated queuing model used for analyzing the performance of subway station walkways. This model conceptualizes the walkway as a queuing system where both the arrival and service processes of passengers are modeled using PH distributions. This allows for a detailed and realistic representation of the variability and randomness in passenger flows.

4.1.2. Testing Procedure

The proposed PH-based DES model was tested using straightforward, unidirectional peak flows at rates of 0.21, 0.34, 0.4, 0.67, 1.25, and 1.79 pedestrians per second (ped/sec). These flow rates correspond to the real conditions observed at a subway station in the city of Ningbo, China. They were chosen with squared coefficient of variation (SCV) values for the passengers’ arrival process at 3.24, 4.29, 2.36, 1.82, 2.05, and 2.91, respectively, as shown in Figure 4. The average results from the PH-based DES models were derived from 10 separate runs, each with a simulation duration of 20,000 time units, to ensure reliability and accuracy in the findings. The comparison between the PH-based DES model and the PH/PH(n)/C/C model demonstrated a high degree of consistency across all performance metrics. The average number of passengers (E[N]), average dwell time (E[T]), and average area occupied per passenger (E[A]) showed similar trends and values in both models, indicating that the DES model accurately captures the dynamics of passenger flow and congestion.

4.2. Effect of Normal and Pandemic Conditions on Performance Metrics

To evaluate the performance of a subway station walkway measuring 8 m in length and 2 m in width, the impact of varying arrival rates and SCV on key performance metrics can be analyzed. In Figure 5a–d, the line graphs depict performance measurement values against passengers’ arrival rates under both normal and pandemic conditions. Each condition is further categorized based on SCV values of 1.0, 5.0, and 50.0. Each line represents the trend of the performance metrics for a given SCV under the two conditions, with color-coding to differentiate between normal and pandemic conditions.
Figure 5a illustrates that as passengers’ arrival rates increase, the average number of passengers on the walkway, E[N], generally increases for all SCV levels under both conditions, indicating that higher arrival rates lead to more congestion. The lines with SCV = 1.0 under both normal and pandemic conditions are relatively flat, suggesting that the variation in arrival rate does not significantly impact E[N] when the SCV is low. At SCV = 5.0, there is a noticeable increase in E[N] as the arrival rate rises. The rate of increase is more pronounced under normal conditions than in pandemic conditions, implying that the pandemic condition might have regulations or behaviors in place that reduce walkway congestion. SCV = 50.0 shows a dramatic increase in E[N] with increasing arrival rates, especially under normal conditions, illustrating that a higher SCV greatly affects congestion.
Figure 5b presents E[T] under both normal and pandemic conditions as a function of passenger arrival rates and different levels of SCV. With an SCV of 1.0, E[T] remains consistent across increasing arrival rates for both normal (blue solid line) and pandemic (green dashed line) conditions, showing that the system handles the flow of passengers without delays, even as more people arrive. For SCV = 5.0, there is a slight increase in dwell time with rising arrival rates in normal conditions (red solid line), hinting at a modest impact on the system due to an increased variability in arrival rates. The pandemic scenario (purple dashed line) displays a similar pattern to the normal conditions, indicating that moderate fluctuations in arrival rates have a comparable impact on dwell time, even with pandemic restrictions in place. For SCV = 50.0, in normal conditions (yellow solid line), the graph shows a steep climb in E[T] with increasing passenger arrival rates, indicating that high variability in arrival rates can lead to significant delays and congestion. The pandemic condition (cyan dashed line) also exhibits an increase in dwell time, but this is less pronounced than in normal conditions, suggesting that pandemic measures may help reduce the effects of high variability on passenger flow.
Figure 5c illustrates the blocking probability, Pb, under normal and pandemic conditions. It is observed that the blocking probabilities in pandemic conditions are consistently higher than those in normal conditions, demonstrating the impact of the pandemic on the likelihood of congestion. These consistently high values indicate that regardless of the SCV, pandemic conditions are associated with a high blocking probability, likely due to social distancing protocols that limit walkway capacity. Similarly, Figure 5d shows that under normal conditions with SCV = 1.0 (solid blue line), E[A] starts just above 2.5 square meters and decreases linearly as the arrival rate increases. This suggests that as more passengers enter the walkway, the individual space each occupies is reduced, but the reduction is gradual and predictable given the low variability in arrival rates. Under pandemic conditions with SCV = 1.0 (dashed cyan line), the E[A] appears to remain constant across different arrival rates, which may indicate a policy of fixed distancing measures during the pandemic, maintaining constant space per person despite varying arrival rates. Under normal conditions with SCV = 5.0, the line shows a more pronounced decrease in E[A] from 2.3 square meters, dropping closer to 1.3 square meters at higher arrival rates, indicating that moderate variability in arrival rates can lead to a more substantial decrease in personal space on the walkway. Under pandemic conditions with SCV = 5.0, the line remains constant across different arrival rates. In the case of normal conditions with SCV = 50, there is a significant reduction in E[A] with increasing arrival rates, illustrating that a higher variability in arrival rates greatly affects the available space per passenger, potentially leading to overcrowding. However, for the pandemic, the graph is still a straight line, showing no significant effect on E[A].

4.3. Sensitivity Analysis

The contour plots (Figure 6a,b) illustrate the relationship between the width and length of a walkway and the average number of passengers (E[N]) present under both pandemic and normal conditions. In the normal conditions plot, the change from green to yellow becomes more pronounced as the width increases, indicating a stronger relationship between width and E[N]. The E[N] values begin at approximately 9.6 and extend up to 19.2. The wider the walkway, the greater the increase in E[N], showing that under normal conditions, without pandemic restrictions, the walkway can hold a significantly higher number of passengers.
In the pandemic conditions plot, the colors transition from a dark green to a lighter yellow as the width (W) of the walkway increases from 2 to 15 m, with the length (L) ranging from 2 to 3 m. The E[N] values start at the lower end of the scale, around 3.6, and increase to just over 13.2. This gradient illustrates that E[N] grows as the walkway becomes wider, indicating that a wider walkway can accommodate more passengers while still adhering to pandemic protocols, which may limit the overall capacity.
For E[T], in the normal conditions (Figure 7a), the color gradient shifts from dark green to yellow as the length of the walkway facility extends from 2 to 15 m, indicating an increase E[T]. The width of the walkway facility seems to have a minor effect on E[T], as shown by the relatively straight contour lines running parallel to the width axis. The E[T] values remain within a more confined range from approximately 7 to 14 s, showing a relatively uniform and lower dwell time in normal conditions. The gentle slope of the color gradient indicates that changes in the facility size have a predictable and moderate effect on E[T], with longer facilities marginally increasing dwell time. In the case of pandemic conditions (Figure 7b), the gradient change is more drastic, with E[T] values ranging significantly from about 20 up to 90 s, which is considerably higher than in normal conditions. This plot also displays an increase in E[T] as the walkway facility lengthens, but the impact is much more pronounced, likely due to social distancing, which can significantly slow passenger flow. The contour lines, while still showing a consistent trend of increasing E[T] with walkway length, appear to show that the width of the walkway has a more noticeable effect on E[T] under pandemic conditions compared to normal conditions.
In the case of normal conditions, the values of Pb are very low, starting from 0 and reaching up to just over 0.014, indicating a low probability of blocking under normal operational circumstances (Figure 8a). As the length increases, there is a gradual transition to slightly higher Pb values, although the overall change remains minimal. The width does not have a substantial impact on Pb. This shows that, under normal conditions, changes in the width do not significantly affect the likelihood of blockages. The low Pb values illustrate the efficient passenger flow through the walkway without significant delays or congestion. For pandemic condition, the plot shows that Pb increases with the length, starting from a low of around 0.798 and rising to approximately 0.894 (Figure 8b). This upward trend demonstrates that the probability of blockages becomes greater as the length increases. The color gradient transitions smoothly from dark to light, indicating that the relationship between facility size and Pb is gradual and continuous under pandemic conditions. The width does not show a substantial impact on Pb. Compared to normal conditions, the overall range of Pb is much higher, reflecting the stricter regulations or changed behaviors during a pandemic, such as social distancing, which can increase the likelihood of blockages.
For E[A], in the case of normal conditions, Figure 9a illustrates that as the walkway becomes longer (from 2 to 15 m), the average area available to each passenger increases from approximately 1.60 to about 2.88 square meters. The gradient of color change from dark green to yellow indicates that E[A] is sensitive to the length of the facility, growing as the length increases. There is a uniform increase in E[A] across the width of the walkway, which shows that that width has a less pronounced effect on the space available per passenger compared to the length. The contour lines are relatively horizontal, which typically indicates that changes in width do not greatly alter E[A].
Figure 9b shows that the E[A] ranges from approximately 0.237 to 0.279 square meters across the plot, indicating the available space per passenger during pandemic conditions. There is a noticeable gradient of E[A] from lighter to darker as the length of the walkway increases, showing that the longer the walkway, the less area there is available per passenger. The 3 m width of the walkway correlates with the highest E[A] values, indicating more space per passenger, likely due to social distancing measures limiting the number of passengers. The contour lines exhibit a slight curve, which may suggest that both the length and width of the walkway interact in complex ways to affect the space available per passenger. Compared to normal conditions, the range of E[A] is more constrained under pandemic conditions, consistent with the implementation of social distancing measures that reduce the passenger carrying capacity.

5. Conclusions and Future Recommendations

Ensuring the efficiency and safety of subway station walkways has become increasingly critical in light of the COVID-19 pandemic, which necessitates social distancing measures. This study presents a comprehensive analysis of passenger dynamics within a subway station walkway under both normal and pandemic conditions, emphasizing the significant impact of social distancing on operational performance. By employing a discrete-event simulation (DES) model based on phase-type (PH) distribution, the stochastic behavior of passenger flow was accurately modeled, and the effects of social distancing measures on the capacity and efficiency of subway station walkways were assessed. The robustness of the proposed PH-based DES model was confirmed through validation against the PH/PH(n)/C/C model, demonstrating its efficacy in simulating passenger dynamics under various operational conditions.
The research findings, based on data from a subway station in the city of Ningbo, China, revealed substantial operational differences between normal and pandemic scenarios. The implementation of the 2 m social distancing protocol resulted in a significant reduction in walkway capacity by up to 60%. This reduction led to increased congestion and reduced throughput. Specifically, the average number of passengers (E[N]) on the walkway increased with higher arrival rates, indicating potential congestion issues. Under pandemic conditions, the average dwell time (E[T]) was significantly higher, reaching up to 90 s, compared to 14 s under normal conditions. Additionally, the blocking probability (Pb) rose dramatically under pandemic conditions, from near 0 to approximately 0.894. The average area per passenger (E[A]) decreased markedly, highlighting the challenge of maintaining personal space during peak times.
Based on these findings, several recommendations can be made to improve walkway efficiency and safety during pandemic conditions. Implementing staggered timings and directional flows can help alleviate congestion. By controlling the influx of passengers, the average number of passengers on the walkway can be reduced, decreasing the likelihood of blockages. Strategies, such as limiting entry and enforcing strict social distancing guidelines, are crucial to maintain a higher average area per passenger. This ensures compliance with health and safety protocols and enhances passenger comfort and safety. Deploying real-time monitoring systems to track passenger flow and density can help manage congestion dynamically. Technologies, such as automated sensors and crowd management software, can provide timely data to adjust operations as needed.
Future research should explore dynamic control measures that can adapt to real-time variations in pedestrian flow. Developing algorithms and simulation models that can adjust parameters based on current conditions will optimize walkway efficiency under both normal and pandemic scenarios. These recommendations aim to enhance the operational efficiency and safety of subway station walkways, ensuring they can effectively handle passenger flow while adhering to necessary health guidelines. Further research in these areas will contribute to more resilient and adaptable public transportation systems.

Author Contributions

Conceptualization, S.D.; Formal analysis, F.C.; Methodology, A.K.; Project administration, A.K. and F.C.; Resources, S.D. and F.X.; Software, A.K. and F.C.; Supervision, F.C.; Visualization, F.C.; Writing—original draft, S.D.; Writing—review and editing, A.K. All authors have read and agreed to the published version of the manuscript.

Funding

The study was supported by the Philosophy and Social Science Foundation of Zhejiang Province (No. 22NDJC166YB).

Institutional Review Board Statement

Not applicable.

Informed Consent Statement

Not applicable.

Data Availability Statement

The datasets analyzed during the current study are not publicly available. However, they are available from the corresponding author on reasonable request.

Conflicts of Interest

The authors declare no conflicts of interest.

References

  1. Cohen, A. Considerations for Social Distancing on Public Transportation during the COVID-19 Recovery; Mineta Transportation Institute: San Jose, CA, USA, 2020. [Google Scholar]
  2. Kokkola, M.; Nikolaeva, A.; Brömmelstroet, M.T. Missed connections? Everyday mobility experiences and the sociability of public transport in Amsterdam during COVID-19. Soc. Cult. Geogr. 2023, 24, 1693–1712. [Google Scholar] [CrossRef]
  3. Dzisi, E.K.J.; Dei, O.A. Adherence to social distancing and wearing of masks within public transportation during the COVID-19 pandemic. Transp. Res. Interdiscip. Perspect. 2020, 7, 100191. [Google Scholar] [CrossRef] [PubMed]
  4. De Vos, J. The effect of COVID-19 and subsequent social distancing on travel behavior. Transp. Res. Interdiscip. Perspect. 2020, 5, 100121. [Google Scholar] [CrossRef] [PubMed]
  5. Seriani, S.; Fernandez, R. Pedestrian traffic management of boarding and alighting in metro stations. Transp. Res. Part C Emerg. Technol. 2015, 53, 76–92. [Google Scholar] [CrossRef]
  6. Zhou, M.; Ge, S.; Liu, J.; Dong, H.; Wang, F.-Y. Field observation and analysis of waiting passengers at subway platform—A case study of Beijing subway stations. Phys. A Stat. Mech. Its Appl. 2020, 556, 124779. [Google Scholar] [CrossRef]
  7. Park, Y.; Choi, Y.; Kim, K.; Yoo, J.K. Machine learning approach for study on subway passenger flow. Sci. Rep. 2022, 12, 2754. [Google Scholar] [CrossRef] [PubMed]
  8. Islam, M.K.; Vandebona, U.; Dixit, V.V.; Sharma, A. A bulk queue model for the evaluation of impact of headway variations and passenger waiting behavior on public transit performance. IEEE Trans. Intell. Transp. Syst. 2014, 15, 2432–2442. [Google Scholar] [CrossRef]
  9. Pu, Y.; Srikukenthiran, S.; Morrow, E.; Shalaby, A.; Klumpenhouwer, W. Capacity analysis of a passenger rail hub using integrated railway and pedestrian simulation. Urban Rail Transit 2022, 8, 1–15. [Google Scholar] [CrossRef]
  10. Aboudina, A.; Itani, A.; Diab, E.; Srikukenthiran, S.; Shalaby, A. Evaluation of bus bridging scenarios for railway service disruption management: A users’ delay modelling tool. Public Transp. 2021, 13, 457–481. [Google Scholar] [CrossRef]
  11. Xi, Y.; Du, Q.; He, B.; Ren, F.; Zhang, Y.; Ye, X. The dynamic optimization of the departure times of metro users during rush hour in an agent-based simulation: A case study in Shenzhen, China. Appl. Sci. 2017, 7, 1102. [Google Scholar] [CrossRef]
  12. Lu, J.; Ren, G.; Xu, L. Analysis of subway station distribution capacity based on automatic fare collection data of Nanjing metro. J. Transp. Eng. Part A Syst. 2020, 146, 04019067. [Google Scholar] [CrossRef]
  13. Liu, J.; Hu, L.; Xu, X.; Wu, J. A queuing network simulation optimization method for coordination control of passenger flow in urban rail transit stations. Neural Comput. Appl. 2021, 33, 10935–10959. [Google Scholar] [CrossRef]
  14. Jia, F.; Jiang, X.; Li, H.; Yu, X.; Xu, X.; Jiang, M. Passenger-oriented subway network capacity calculation and analysis based on simulation. Transp. Lett. 2021, 13, 555–567. [Google Scholar] [CrossRef]
  15. Su, G.; Si, B.; Zhi, K.; Zhao, B.; Zheng, X. Simulation-Based Method for the Calculation of Passenger Flow Distribution in an Urban Rail Transit Network Under Interruption. Urban Rail Transit 2023, 9, 110–126. [Google Scholar] [CrossRef]
  16. Kittelson & Associates Inc.; Federal Transit Administration; Transit Cooperative Research Program; Transit Development Corporation. Transit Capacity and Quality of Service Manual; Transportation Research Board: Washington, DC, USA, 2003; Volume 42. [Google Scholar]
  17. Ding, H.; Di, Y.; Zheng, X.; Liu, K.; Zhang, W.; Zheng, L. Passenger arrival distribution model and riding guidance on an urban rail transit platform. Phys. A Stat. Mech. Its Appl. 2021, 571, 125847. [Google Scholar] [CrossRef]
  18. Jiang, Y.; Hu, L.; Zhu, J.; Chen, Y. PH fitting of the arrival interval distribution of the passenger flow on urban rail transit stations. Appl. Math. Comput. 2013, 225, 158–170. [Google Scholar] [CrossRef]
  19. Jiang, Y.; Zhu, J.; Hu, L.; Lin, X.; Khattak, A. AG/G (n)/C/C state-dependent simulation model for metro station corridor width design. J. Adv. Transp. 2016, 50, 273–295. [Google Scholar] [CrossRef]
  20. Khattak, A.; Yangsheng, J.; Abid, M.M. Optimal configuration of the metro rail transit station service facilities by integrated simulation-optimization method using passengers’ flow fluctuation. Arab. J. Sci. Eng. 2018, 43, 5499–5516. [Google Scholar] [CrossRef]
  21. Sidorchuk, R.; Lukina, A.; Markin, I.; Korobkov, S.; Ivashkova, N.; Mkhitaryan, S.; Skorobogatykh, I. Influence of passenger flow at the station entrances on passenger satisfaction amid COVID-19. J. Open Innov. Technol. Mark. Complex. 2020, 6, 150. [Google Scholar] [CrossRef]
  22. Yu, H.; Li, A. Study on the Impact of Health Condition Registration and Temperature Check on Inbound Passenger Flow and Optimisation Measures in a Metro Station during the COVID-19 Pandemic. Promet-Traffic Transp. 2023, 35, 738–754. [Google Scholar] [CrossRef]
  23. Jiao, F.; Huang, L.; Song, R.; Huang, H. An improved STL-LSTM model for daily bus passenger flow prediction during the COVID-19 pandemic. Sensors 2021, 21, 5950. [Google Scholar] [CrossRef]
  24. Aghdam, F.B.; Sadeghi-Bazargani, H.; Shahsavarinia, K.; Jafari, F.; Jahangiry, L.; Gilani, N. Investigating the COVID-19 related behaviors in the public transport system. Arch. Public Health 2021, 79, 183. [Google Scholar] [CrossRef] [PubMed]
  25. Hidayat, A.M.; Choocharukul, K. Passengers’ Intentions to Use Public Transport during the COVID-19 Pandemic: A Case Study of Bangkok and Jakarta. Sustainability 2023, 15, 5273. [Google Scholar] [CrossRef]
  26. Wilbur, M.; Ayman, A.; Sivagnanam, A.; Ouyang, A.; Poon, V.; Kabir, R.; Vadali, A.; Pugliese, P.; Freudberg, D.; Laszka, A. Impact of COVID-19 on public transit accessibility and ridership. Transp. Res. Rec. 2023, 2677, 531–546. [Google Scholar] [CrossRef] [PubMed]
  27. Bansal, P.; Kessels, R.; Krueger, R.; Graham, D.J. Preferences for using the London Underground during the COVID-19 pandemic. Transp. Res. Part A Policy Pract. 2022, 160, 45–60. [Google Scholar] [CrossRef]
  28. Singh, R.; Hörcher, D.; Graham, D.J. An evaluation framework for operational interventions on urban mass public transport during a pandemic. Sci. Rep. 2023, 13, 5163. [Google Scholar] [CrossRef] [PubMed]
  29. Khattak, A.; Yangsheng, J. Modeling of subway stations circulation facilities as state-dependent queuing network based on phase-type distribution. In Proceedings of the 2016 IEEE International Conference on Intelligent Transportation Engineering (ICITE), Singapore, 6 October 2016; pp. 133–138. [Google Scholar]
  30. Zhu, J.; Hu, L.; Xie, H.; Li, K. A PH (i)/PH (i, n)/C/C Queuing Model in Randomly Changing Environments for Traffic Circulation Systems. J. Adv. Transp. 2022, 2022, 6533567. [Google Scholar] [CrossRef]
  31. Cheah, J.Y.; Smith, J.M. Generalized M/G/C/C state dependent queueing models and pedestrian traffic flows. Queueing Syst. 1994, 15, 365–386. [Google Scholar] [CrossRef]
  32. Smith, J.M.; Smith, J.M. Optimal Routing Problems (ORTE) G (E∗) in TND. In Introduction to Queueing Networks: Theory ∩ Practice; Springer: Berlin/Heidelberg, Germany, 2018; pp. 397–459. [Google Scholar]
  33. Hu, L.; Jiang, Y.; Zhu, J.; Chen, Y. A PH/PH (n)/C/C state-dependent queuing model for metro station corridor width design. Eur. J. Oper. Res. 2015, 240, 109–126. [Google Scholar] [CrossRef]
  34. Smith, J.M.; Li, W.-J. Quadratic assignment problems and M/G/C/C/state dependent network flows. J. Comb. Optim. 2001, 5, 421–443. [Google Scholar] [CrossRef]
  35. Chen, Y.; Yi, B.; Jiang, Y.; Sun, J.; Wahab, M. Inter-arrival time distribution of passengers at service facilities in underground subway stations: A case study of the metropolitan city of Chengdu in China. Transp. Res. Part A Policy Pract. 2018, 111, 227–251. [Google Scholar] [CrossRef]
  36. Khattak, A.; Hussain, A. Hybrid DES-PSO framework for the design of commuters’ circulation space at multimodal transport interchange. Math. Comput. Simul. 2021, 180, 205–229. [Google Scholar] [CrossRef]
  37. Horváth, G.; Telek, M. Acceptance-rejection methods for generating random variates from matrix exponential distributions and rational arrival processes. In Proceedings of the Matrix-Analytic Methods in Stochastic Models; Springer: Berlin/Heidelberg, Germany, 2013; pp. 123–143. [Google Scholar]
Figure 1. Proposed PH-based DES framework for the performance assessment of subway station walkways during normal and pandemic conditions.
Sustainability 16 06858 g001
Figure 2. Passenger flow in a subway station walkway during normal and pandemic conditions.
Sustainability 16 06858 g002
Figure 3. PH-based DES architecture of a subway station walkway.
Sustainability 16 06858 g003
Figure 4. Verification of the proposed PH-based DES model; (a) comparison of the average number of passengers in the walkway facility based on the DES and PH/PH(n)/C/C models; (b) comparison of the average dwell time of passengers in the walkway facility based on the DES and PH/PH(n)/C/C models; (c) comparison of the average area occupied per passenger based on the DES and PH/PH(n)/C/C models.
Sustainability 16 06858 g004
Figure 5. Performance measures for a subway station walkway of size 8 m × 2 m under both normal and pandemic conditions: (a) E[T] plotted against varying arrival rates with different SCVs; (b) E[N] plotted against varying arrival rates with different SCVs; (c) Pb plotted against varying arrival rates with different SCVs; (d) E[A] plotted against varying arrival rates with different SCVs.
Sustainability 16 06858 g005aSustainability 16 06858 g005b
Figure 6. Contour plot of the average number of passengers (E[N]) for varying widths (W) and lengths (L) of a walkway; (a) under normal conditions; (b) under pandemic conditions.
Sustainability 16 06858 g006
Figure 7. Contour plot of the average dwell time of passengers (E[T]) for varying widths (W) and lengths (L) of a walkway; (a) under normal conditions; (b) under pandemic conditions.
Sustainability 16 06858 g007
Figure 8. Contour plot of the blocking probability Pb for varying widths (W) and lengths (L) of a walkway; (a) under normal conditions; (b) under pandemic conditions.
Sustainability 16 06858 g008
Figure 9. Contour plot of the average area occupied per passenger E[A] for varying widths (W) and lengths (L) of a walkway; (a) under normal conditions; (b) under pandemic conditions.
Sustainability 16 06858 g009
Disclaimer/Publisher’s Note: The statements, opinions and data contained in all publications are solely those of the individual author(s) and contributor(s) and not of MDPI and/or the editor(s). MDPI and/or the editor(s) disclaim responsibility for any injury to people or property resulting from any ideas, methods, instructions or products referred to in the content.

