Article

Anticipatory Technoeconomic Evaluation of Kentucky Bluegrass-Based Perennial Groundcover Implementations in Large-Scale Midwestern US Corn Production Systems

by
Cynthia A. Bartel
1,*,
Keri L. Jacobs
2,
Kenneth J. Moore
1 and
D. Raj Raman
3
1
Department of Agronomy, Iowa State University, Ames, IA 50011, USA
2
Department of Agricultural and Applied Economics, University of Missouri-Columbia, Columbia, MO 65211, USA
3
Department of Agricultural and Biosystems Engineering, Iowa State University, Ames, IA 50011, USA
*
Author to whom correspondence should be addressed.
Sustainability 2024, 16(16), 7112; https://doi.org/10.3390/su16167112
Submission received: 18 June 2024 / Revised: 24 July 2024 / Accepted: 8 August 2024 / Published: 19 August 2024

Abstract

:
Perennial groundcover (PGC) has promise as a scalable approach to generating natural resource benefits and sustainable biofuel feedstock while preserving the high yields of annual row crop production. Partnering row crops with temporally and spatially complementary low-growing, shallow-rooted perennials, such as Kentucky bluegrass (KBG) (Poa pratensis L.), is one example of an emerging PGC system. PGC’s ecosystem benefits can only be fully realized if commercial-scale adoption occurs, which hinges on its economic feasibility. This paper utilizes an enterprise budget framework to detail and compare the expected cost and revenue of establishing and maintaining PGC in row crop systems with standard continuous corn (SCC) (Zea mays L.) production, including stover harvest, but excluding economic incentives for ecosystem services. Optimistic and pessimistic assumptions were used, along with Monte Carlo simulation, to characterize the uncertainty in results. In the optimistic stover market scenario, Year 1 net returns for PGC averaged USD 84/ac less than for SCC; Year 2+ net returns averaged USD 83/ac more, meaning that cost parity with SCC occurs by the second PGC system year. Without stover revenue, parity is achieved after five years. These results affirm that PGC’s economic viability is critically impacted by a groundcover’s lifespan, the yield parity with SCC, and the availability of a stover market.

1. Introduction

The increasing productivity of corn (Zea mays L.) farming practices in the Upper Midwestern US have resulted in increased acreage planted to corn [1], with nearly one-third of US cropland planted to corn each year. In corn systems, corn stover is the predominant biological material on fields post-harvest, through the ensuing winter and spring, until the next corn crop emerges [2]. Stover retention maintains soil organic matter [3], sustains long-term crop productivity by bolstering the soil structure [2,4,5], increases the water holding capacity for plant uptake [6], and decreases erosion [7], a process that threatens the global food supply by diminishing long-term soil productivity [7,8]. Conversely, stover removal increases corn grain yield in the short term until soil degradation lessens productivity [9] and is practiced on nearly one-fifth of corn acres [10].
While stover retention is critical for soil health, increased stover removal is expected due to the forecasted demand for sustainable aviation fuel (SAF). This demand necessitates soil conservation practices to facilitate greater stover removal and a low-carbon-intensity (CI) feedstock to ramp up SAF production from 24.5 million gallons consumed in 2023 to 35 billion gallons by 2050, while simultaneously decreasing the CI of SAF by 50% [11]. Corn stover is recognized as the largest single existing source of feedstock for this effort [12]. However, standard field practices influence sustainable stover harvest significantly and limit stover removal [13,14,15].
While cover cropping is an effective practice for natural resource conservation to facilitate stover harvest, annual cover crops comprised only 3.9% of the total US cropland in 2017, increasing to 4.7% in 2022 [16]. The limited deployment of annual cover crops is attributed to adoption cost barriers and risks associated with the practice, which can impede the cash crop [17,18,19,20,21]. Farmers who have adopted and discontinued annual cover crop usage indicate that the practice was not profitable and caused cash crop yield loss [22].
While it is well accepted that cash crop yield losses depend largely on cover crop species, cash crop yield losses average 5.5% for corn and 3.5% for soybean across the US Corn Belt from annual cover crops [23]. Such yield reductions likely result from constrictions in the timing of key field operations and from cover crop competition with the row crop. Although annual cover cropping has been adopted as a USDA Risk Management Agency (RMA) Good Farming Practice for crop insurance [24,25], specific NRCS Cover Crop Termination Guidelines reflect this risk, with termination guidelines to mitigate water competition between the non-irrigated cash crop and annual cover crop, plus general guidance on irrigated acreage [26].
Perennial groundcover approaches (Figure 1) merge soil and water conservation with high-yield row crops [27]. The PGC system involves growing an annual row crop, like corn, with a low-growing, shallow-rooted, ecologically appropriate and compatible PGC, typically coupled with strip tillage [27,28,29,30,31,32,33,34]. The anticipated benefits of PGC are similar to the ubiquitous benefits of other year-round groundcovers: controlled soil erosion and soil health, improved soil structure [35], soil carbon sequestration [36], reduced nitrate leaching [37], and weed suppression [38]. The perennial nature of the groundcover in a PGC system delivers two key advantages: (1) the groundcover ecosystem service benefits are realized for multiple years from one planting event, and (2) the total number of field operations that are necessary to initiate and maintain a PGC system is significantly lower than that of annual cover cropping, meaning that the costs—including risk due to uncertainty—of PGC approaches can be lower.
For the past decade, the PGC approach for corn and soybeans has been tested in small plots and field trials using KBG and, more recently, improved varieties of Poa bulbosa (e.g., Radix Hybrid bulbosa, RHb Radix Evergreen, Aumsville, Oregon) [31]. The corn–KBG chemically suppressed PGC systems can produce corn yields that are equal to controls [32,33], but, at present, they pose a non-trivial yield risk because of potential competition between the row crop and groundcover. Furthermore, challenges of KBG establishment during drought years have been noted [39]. Based on this heightened risk, we assess KBG PGC to be at a Technology Readiness Level (TRL) of 4 [40], which implies that it is not yet ready for widespread adoption. The RHb is at an earlier TRL; thus, this paper focuses on the KBG PGC system.
In an effort to de-risk the KBG-PGC instance, which is highly relevant to the dominant Midwestern US cropping system, multiple dimensions of the challenge are being pursued, including (a) developing best management practices for managing corn in a KBG PGC system, including suppression chemistries and crop–PGC spacing; (b) screening for superior KBG varieties and for maize hybrids that are less sensitive to PGC; (c) examining the impacts of PGC on soil health and nutrient loss; (d) quantifying the ecosystem service potential derived from these systems using modeling approaches; and (e) understanding the socioeconomic and policy implications of PGC systems (https://www.regenpgc.org/ accessed on 13 August 2024). Directly related to the last of these avenues—and critical to the scalability of the corn–KBG PGC instance—is the potential economic performance of the system.
This work seeks to discern and make transparent the costs of implementing a corn–KBG PGC system, enabling comparisons of this emerging system to the dominant existing system. We hypothesize that optimized PGC systems can be cost-competitive with standard continuous corn (SCC). This work tests our hypothesis, elucidating key cost terms to help researchers better understand tradeoffs between different development pathways and identifying the most critical cost-roadblocks for broad system adoption. For that reason, this article provides background and summary information of expected production costs, revenues, and net returns comparing PGC and SCC, using an enterprise budget format.

2. Materials and Methods

2.1. Enterprise Budget and Budgeting Assumptions

We employ an enterprise budget to account for costs and returns for the corn–KBG system with suppressed KBG and SCC. Below, we describe the technical features of the system, highlighting the budgeting assumptions and rationale for the fixed and variable costs, yields, and revenues. We use the term standard row crop systems (e.g., continuous corn-on-corn, corn following soybeans) to describe the systems practiced on the vast majority of the US row crop landscape, which do not use cover cropping. For conservation practices to significantly improve ecosystem services, they must be adopted on large fractions of the working landscape. The values used in this analysis are therefore based on the emerging data and knowledge of the KBG–corn instance of a PGC system for Midwestern US producers, reflecting practices used by large-scale US corn production systems.
The KBG–corn PGC system assumes that corn is planted in alternating 38 cm (15-inch) tilled strips on 76 cm (30-inch) centers. The system has two distinct phases for field operations: (1) Year 1 is an establishment year, when the PGC is typically fall-planted, and (2) Year 2+ includes subsequent years, when the groundcover is established and requires management. The longevity of the perennial cover is uncertain and will likely vary based on species and site-specific factors; however, typical establishment will last at least 5 years and likely much longer until termination.
Corn production budgeting assumptions, as well as costs for field operations, labor, and land, reflect standard practices in the Upper Midwest [41]. The fixed and variable production cost data are primarily taken from the “Corn Following Corn” budget in Estimated Costs of Crop Production in Iowa–2024 (File A1-20) [41]. To supplement these assumptions, Iowa retail agribusinesses representing 50 locations were interviewed to determine the average herbicide costs for PGC and SCC, including both glyphosate- and non-glyphosate-tolerant conventional herbicide plants for the 2024 production year. The perennial groundcover seed cost estimates were provided by companies supplying KBG groundcover varieties specifically for the PGC system for the 2024 production year.
The primary fixed costs of production for both the KBG–corn PGC system and SCC include land cash rent equivalent, labor, and machinery-related ownership expenses such as depreciation, loan interest, and taxes. Variable costs include yearly input purchases that are needed to grow the row crop and machinery operating expenses. The budgeted cost and return estimates and expectations reflect the status of the PGC system development, and the default 204 bushels/acre (bu/ac) (12.8 Mg/ha) corn grain yield is based on the 30-year trend yield [41].
For both systems, the expected net return per acre (NRacre) is the difference between the revenue per acre (Revacre) and the sum of fixed costs and variable costs per acre of production (FCacre + VCacre). The revenue per acre (Revacre) is the product of the expected selling price for corn grain and stover (Pc, Ps) and the expected per-acre yield for corn grain (Buc) and stover (Tonss), respectively. Represented in equation form, these are determined as follows:
NRacre = Revacre − (FCacre + VCacre),
where
Revacre = (Pc × Buc) + (Ps × Tonss)

2.2. Optimistic and Pessimistic PGC Scenarios

The corn–KBG chemically suppressed PGC system has amassed approximately 26 site-years of published data thus far [28,29,30,31,32,33,34,39,42,43,44]. This relatively small data set introduces uncertainty of groundcover establishment success, field operations, and other key variables and, consequently, cost and revenue uncertainty. The KBG–corn enterprise budget therefore presents optimistic and pessimistic cost and revenue profiles utilizing the multiple year format, where expected costs, revenues, and net returns from a SCC system are compared with the same for the KBG–corn system in Year 1 and Year 2+. The enterprise budget consists of four KBG–corn system alternatives: Optimistic, Year 1, Optimistic Year 2+, Pessimistic Year 1, and Pessimistic Year 2+. The optimistic and pessimistic values reflect our best understanding of the potential range in PGC cost and revenue due to establishment success, field operations, and other key variables. The assumptions used to generate enterprise budget values for the PGC optimistic and pessimistic scenarios are summarized in Table 1 (see macro-enabled spreadsheet at www.regenpgc.org).
As is typical in enterprise budgeting, the fixed and variable costs differ for individual farms based on soil quality, location, management practices, and other factors. Thus, the enterprise budget utilizes averages for cost and revenue components to compare net returns for SCC and corn in a PGC system. In practice, the enterprise budget is provided as a starting point, with the ability to adjust cost components that reflect unique production situations.

2.3. Differences in System Operations

2.3.1. Pre-Harvest Activities

The differences between SCC field operations and costs and those in the PGC system are largely concentrated in pre-harvest activities. The SCC budget assumes spring-time pre-harvest machinery expenses of chisel plowing, tandem disking, fertilizer application, field cultivating, planting, and spraying. The machinery requirements of PGC establishment include a no-till drill for groundcover planting in Year 1 and spring strip tillage in Year 2+. The primary cost of PGC establishment and adoption outlay occurs in the first system year with groundcover seeding. All other fieldwork and fertilizer amendments are basic operating costs for field prep prior to row crop planting [41].
Under an optimized system in Year 2+, a single strip tillage pass is sufficient for seed bed preparation and mechanical suppression of the perennial grass in the crop growth zone. An effective, banded herbicide application over the grass will eliminate the perception of light competition by the corn that results in corn yield loss. Mechanical suppression, such as strip tillage, is a companion suppression operation to reduce competition for nutrients and soil water within the crop zone. Under less optimal conditions, such as when rainy weather delays field work, cool season groundcover species may accumulate biomass rapidly, necessitating subsequent suppression with an additional strip tillage pass or herbicide application. The suppression efficacy can also be highly weather-dependent [29].
Several PGC management practices can be coupled with those of SCC systems in the spring, namely chemical suppression of groundcover with herbicides that also control weeds and mechanical suppression of groundcover with strip tillage that also prepares soil for corn planting. An optimized PGC system therefore includes fewer total spring field passes with strip tillage, fertilizer application, planting, and spraying.

2.3.2. Harvest Activities

Harvest activities are equivalent between PGC and SCC. In an optimized PGC system, researchers believe that almost all stover can be harvested within feedstock quality constraints, versus limited stover removal under SCC production, without additional field passes for chopping stalks, raking stalks, and baling stover. Therefore, the percentage of stover that is harvested in a PGC system will only be limited by machine capabilities. Stover operations should thus result in a higher net return under a PGC system versus SCC production.

2.4. Sensitivity Analysis

We completed a sensitivity analysis to compare SCC and corn in a PGC system. As recommended by Nelson et al. (2014) [45], we implemented a Monte Carlo simulation to evaluate the uncertainty in the differences between scenarios (see cost model and VBA Excel code for the Monte Carlo simulation, Appendix A). Using the static model, we determined that the following four terms drove the cost differences between the PGC and SCC scenarios: corn yield, herbicide cost, grass seed cost, and stover price. Using published 15-year historical data for these terms [46], we determined the coefficients of variation for each parameter. Although the corn price does not impact the cost differences between scenarios, we similarly estimated its coefficient of variation, allowing for simulation of these five key variables as normally distributed random variables with mean and standard deviations based on historical data for 1000 iterations in a Monte Carlo simulation.

3. Results

3.1. Costs

These scenarios differ in their seeding rates and field work expectations in the establishment year and in suppression needs in Year 2+ (Table 1). The optimistic scenario in Year 1 assumes that grass is established in the fall with a no-till drill after row crop harvest, assuming stover removal or a soybean crop the prior year, at 20 lb/ac (22 kg/ha) seeding rate and without additional fertilizer. The pessimistic scenario in Year 1 assumes additional soil work (field cultivating, disk, and harrow work) and a 25 lb/ac (28 kg/ha) seeding rate. All other budget factors and costs are the same in Year 1, including the operations and costs for corn planting and harvest. There are no further costs for groundcover seed for at least five years until replanting. In Year 1, the optimistic and pessimistic PGC scenario costs are estimated at USD 1210/ac and USD 1258/ac, respectively.
In Year 2+, grass suppression costs replace grass establishment costs, and the suppression activities include strip tillage for mechanical suppression and herbicide for chemical suppression. The pessimistic scenario in Year 2+ assumes two strip tillage passes and a more expensive chemical suppression program. Herbicide costs include chemical suppression under the optimistic and pessimistic scenarios for USD 0/ac and USD 12/ac more, respectively, than SCC. The optimistic scenario in Year 2+ includes one strip tillage pass for mechanical grass suppression at USD 9/ac, while the pessimistic scenario in Year 2+ includes two strip tillage passes at USD 18/ac. The annual PGC system costs in Year 2+ for the optimistic and pessimistic scenarios are USD 1113/ac and USD 1122/ac, respectively.
Table 2 summarizes the costs for SCC and the KBG–corn system under the optimistic and pessimistic scenarios. The SCC pre-harvest machinery and inputs are USD 556/ac, and harvest operations including stover removal are USD 185/ac. Including cash rent and labor, the total annual production costs in 2024 are estimated at USD 1126/ac. The PGC Year 1 pre-harvest activities and inputs are greater than SCC by USD 81/ac and USD 120/ac for the optimistic and pessimistic scenarios, respectively. In Year 2+, however, the PGC system shows an annual cost advantage, with costs being USD 4/ac to USD 13/ac lower than SCC. Under the optimistic PGC scenario, fewer spring operations produce savings over stover hauling costs. Under the pessimistic PGC scenario, the additional tillage and greater suppression costs are offset by less soil work in the spring and reduced costs in hauling, drying, and handling grain if the grain and stover yields are decreased.

3.2. Revenue and Net Return

To assess how costs balance with returns within the PGC system and across systems, the budget includes assumptions of revenue and net return per acre (Table 3). An expected selling price of USD 5.05/bu of corn and USD 50/T of stover was used to produce a revenue neutral scenario, or net return parity, for SCC. This same corn grain yield, 204 bu/ac, is assumed for the PGC Year 1 optimistic and pessimistic scenarios, since PGC seeding occurs after corn harvest in the fall. It should be noted, however, that compatible groundcover varieties have not been found to impact corn yield in the establishment year when seeded concurrently to spring corn planting [43]. We anticipate that spring groundcover seeding would increase the corn stover availability in the groundcover establishment year, although not as much in subsequent years. For this analysis, assuming fall seeding, we have included the same harvestable stover yield in Year 1 across systems.
Based on the corn and stover yield assumptions for SCC and both the pessimistic and optimistic KBG–corn systems, the per-acre net return for the PGC system in Year 1 is negative, reflecting the PGC establishment investment. However, in Year 2+, the net return expectations under optimistic PGC assumptions surpass those for SCC, largely due to smaller costs and greater harvestable stover yield. The PGC optimistic scenario suggests a one-year net return in Year 2+ of USD 83/ac compared to USD 0/ac in SCC. The advantage gap is expected to remain for the life of the PGC. Despite a higher stover yield for the pessimistic Year 2+ versus SCC, the expected net return in a pessimistic scenario is -USD 98/ac compared with USD 0/ac in SCC. Under the pessimistic PGC scenario, a greater stover harvest than SCC cannot compensate for the reduced corn grain yield from delayed groundcover suppression. Just as with costs, the return profile will differ by farm.
The return in the optimistic scenario for the PGC system in Year 2+ compared to SCC are achieved even with the increased costs of a greater stover harvest in the default scenario. A 0.55 harvest index (HI) is assumed for modern corn hybrids, averaged from the established HI [47] and the HI documented from modern genetic grains [48], which produces 4.7 T/ac of corn stover with 204 bu/ac corn grain. While all stover in a PGC system could theoretically be harvested, the total corn stover harvest is 3.3 T/ac in the PGC Year 2+ optimistic scenario because of harvest machinery limitations at 70% of in-field corn stover. The SCC stover harvest is 1.9 T/ac even with a generous 40% cap on stover removal. The PGC pessimistic scenario in Year 2+ assumes delayed suppression and a 175 bu/ac corn grain yield, resulting in 2.8 T/ac stover removal at the 70% stover harvest cap. It should be noted that insufficient establishment would likely further decrease the harvestable stover quantities within the PGC pessimistic scenario in Year 2+.

3.3. Sensitivity Analysis

Figure 2 shows the average cost and revenue with standard deviations for scenarios. The low variability in cost is reflected in the low cost uncertainty for all scenarios (standard deviation ca. USD 14). In contrast, the relatively high variability in revenue for all scenarios (standard deviation ca. USD 160) is driven by two critical terms that are not present in the cost computations: corn grain yield and corn grain price. Critically, these two terms apply to all modeled scenarios (PGC and SCC) for any particular iteration of the Monte Carlo simulation. We therefore assessed the differences in revenue between each of the four PGC scenarios and the SCC case iteration by iteration and report the summary results in Table 4.
The PGC Year 1 optimistic scenario and PGC Year 1 pessimistic scenario are USD 84/acre/year (ac/yr) and USD 133/ac/yr more expensive, respectively, to implement than SCC, but both scenarios generate a revenue equal to SCC, because the corn yield is the same as under SCC (Table 4). As an optimized system matures, the optimistic PGC Year 2+ scenario costs USD 13/ac/yr less than SCC while generating USD 70/ac/yr revenue more than SCC through increased stover harvest revenue. The pessimistic PGC Year 2+ scenario costs USD 4/ac/yr less than SCC, but because of the decreased corn yield, it grosses USD 101/ac/yr less than SCC. Because an identical corn yield is assumed for the SCC, PGC Year 1 optimistic, PGC Year 1 pessimistic, and PGC Year 2+ optimistic scenarios, the standard deviation of the differences in revenue between scenarios is now quite constrained.
We next assessed differences in net return, focusing on the difference between the most profitable PGC system scenario, the PGC optimistic scenario with stover harvest, and SCC (Table 5). With the initial outlay of USD 84/ac to establish PGC compared to SCC in Year 1, the PGC optimistic scenario’s profitability over the SCC is augmented for each additional year in which the PGC system is deployed.

4. Discussion

4.1. Groundcover Longevity and Suppression

4.1.1. Groundcover Longevity

The enterprise budget comparison shows that most of the anticipated costs of the KBG–corn PGC system are incurred in the first system year when groundcover seeding occurs. An expected reduction in herbicide use, lower groundcover-related costs, and lower spring field preparation costs after the establishment year bring parity between the two production systems in the second system year, assuming that a stover market exists. Because the seeding cost is the largest expense in a PGC system, the groundcover working lifespan (i.e., the time between replanting and recurring Year 1 costs) is critical to the overall system economics. In contrast, the pessimistic PGC case, which reflects the outcomes that may occur if groundcover competition with the corn crop is not successfully managed, loses to SCC on cost and revenue in the first year and in following years, and no groundcover lifespan will result in an acceptable economic performance. However, for the optimistic PGC case, a lifespan >3 years is economically attractive and produces a greater net return than SCC (Table 5). These results show the importance of developing groundcovers for this system with high longevity and a long lifespan, over which seeding costs can be amortized.
Also implicit here is the importance of groundcover establishment, as a failed groundcover establishment recurs Year 1 seeding costs. Not only is replanting costly, it also degrades the timing benefits of the system and decreases stover revenue because of the sustainable limitations on stover harvest without groundcover. The establishment challenges for a perennial groundcover in the PGC system have arisen primarily from drought. It is well established that drought decreases plant seed germination [49]. While smaller perennial seeds are more susceptible to moisture insufficiency, persistent drought conditions in the Midwest US have made the establishment of even larger seeded, annual cover crops challenging [50]. Current research is underway on seed treatments for perennial groundcovers to cost-effectively increase the reliability in groundcover establishment during extreme weather patterns.

4.1.2. Groundcover Suppression

Mitigating the potential yield-penalty or yield uncertainty associated with the system is critical for economic feasibility, specifically by ensuring that suppression of the PGC can be achieved reliably [31]. Corn yield is significantly impacted by unsuppressed or poorly suppressed groundcover [34,44], and corn yield is one of the most sensitive parameters in the cost model. As evidenced by the difference in the optimistic and pessimistic scenario returns, corn yield is a primary driver on net return. To date, multiple suppression herbicides, application dates, and combinations thereof have been trialed in PGC systems [28,29], and more are currently being researched.
Other groundcover species are being trialed that may reduce the need for herbicide suppression through summer dormancy. Recent work has used an improved variety of Poa bulbosa (Radix Hybrid bulbosa—RHb Radix Evergreen, Aumsville, OR, USA), a summer-dormant groundcover that does not require chemical suppression to avoid competing with corn [35]. A corn–RHb PGC system is promising, and RHb has been successfully used in orchard and vineyard systems on the US west coast [51]. It is likely that RHb can be modified to induce dormancy based on a daylength that would correlate to corn planting and emergence to minimize early season competition and promote corn grain yield.

4.2. Machinery Investment and Limitations

In addition to groundcover reliability, another factor that will influence adoption rates is additional on-farm machinery to perform system operations. For PGC, strip tillage machinery is needed for mechanical groundcover suppression in the PGC system. Because of this machinery expense and the land management preferences of some farmers for no-till, PGC with no-till management is also being trialed. Related to this is the optimization of corn–stover removal to maximize the revenue profile from the system while ensuring that ecosystem services are reliably provided. Stover variability, storage and transport costs, and farmer participation all pose challenges to steady supplies of stover as a low-CI feedstock [52]. However, establishing efficient BMPs for harvest [53] and procuring greater stover harvest per acre, specifically in the PGC system, may incentivize farmer participation and biofuel facility construction. More easily obtainable stover plant material can drive additional investment in rural communities.

4.3. Economic and Labor Demands as They Relate to Federal Policy Framework Compatibility

To achieve high adoption rates, the economic and labor demands must be feasible and value-additive for farms with spring operations not excessively divergent from SCC, while satisfying crop safety net requirements. Crop production and cropland have shifted to comparatively larger farms [54], with nearly 60% of US farm production value coming from the largest 5.3% of farms in 2020 [55]. However, the risk attitudes of the farmer and pricing generally discourage technology adoption at a scale that is proportional to the farm [56]. Larger farms, which have the greatest ability to impact the landscape and hence to improve ecosystem services broadly, are often most restricted with spring field operations, with early pay and volume pricing discounts [57] in addition to a compressed planting window.
Because of this compressed planting window and compliance with crop insurance mandates, seasonal labor constraints often require planting cash crops at the earliest possible RMA Initial Planting Dates on comparatively larger operations to both realize the yield potential and comply with RMA Final Planting Dates for cash crops. The primary crop support mechanism that is currently utilized by Midwestern row crop farmers is crop insurance, reauthorized in the 2018 Farm Bill Title XI. Close to 90% of the major crops planted in the US carry crop insurance [58]. Crop insurance planting dates are carefully established by the RMA with agricultural experts for each crop and region. Although acres are still covered for yield or revenue if Good Farming Practices are followed, planting before the RMA Initial Planting Dates disqualifies the acres for replanting payments, while planting after the RMA Final Planting Dates reduces the crop guarantee [59]. The need for scalable conservation practices that are labor- and cost-neutral or -positive and compatible with the federal policy framework is therefore the primary driver for the development of PGC.

4.4. Incentives at the Farm Level

The degree to which the financial feasibility of a corn–KBG PGC system can match SCC depends on other key non-technical factors, including access to the USDA safety net mentioned above for crop production. In order to qualify for crop insurance as the primary crop safety net for Midwestern row crop farmers, farmers must use Good Farming Practices as defined in the Common Crop Insurance Policy [60]. For this reason, developing the BMPs for adopting PGC as a Good Farming Practice is imperative to de-risk adoption for broad deployment of PGC.
To this point, a further disincentive to conservation practice adoption, and specifically annual cover crop adoption, that has not been discussed in the literature involves the difficulty of reconciling the short-term decline in corn grain yield history from cover crop adoption with the long-term benefit of soil regeneration. Specifically, a short-term corn yield reduction not only fails to achieve crop yield potential, impacting the immediate profitability of an operation, but simultaneously penalizes a producer’s future crop insurance safety net. Crop yield reductions decrease the reported Actual Production History (APH) of the farm for USDA crop insurance coverage [58] if APH is revised during yield updates. This reality highlights the importance of both technical improvement and policy incentives to mitigate adoption risk.
De-risking PGC adoption at the farm level can also be accomplished through points of entry in the established farm program framework, including working land conservation incentives [61]. Perennial groundcover can fit well in the suite of practices that are offered in voluntary, incentive-based approaches to ecosystems services delivery that are currently under consideration both in the USDA and the US Congress.
The two primary USDA working land programs into which PGC could be adopted include the Environmental Quality Incentives Program (EQIP) and Conservation Stewardship Program (CSP), as a conservation practice or enhancement, respectively, which were both reauthorized under the Agricultural Improvement Act of 2018 (2018 Farm Bill) Title II [61]. These two programs have a combined reach of ca. 80 million enrolled acres. While EQIP is a foundational, targeted conservation program, CSP builds on existing efforts as a whole-farm conservation program. A working lands entry point does not propose new approaches to land set-aside programs, such as the Conservation Reserve Program, which maintains limited options for productivity such as non-emergency managed haying or grazing or emergency access dependent on the drought severity.
Additionally, the US is striving to lower the CI of SAF and other biofuel production. The Inflation Reduction Act included the 45Z clean fuels production tax credit, a three-year tax credit program beginning in 2025, to provide tax credits to facilities that produce renewable fuel with a 50% lower CI score than conventional petroleum. While the tax credits are awarded directly to the biofuel production facility, it is expected that farmers will benefit to some extent from adopting production practices that improve the CI scores of their crops and resulting biofuel feedstock, namely cover crop adoption, nitrogen efficient fertilizers, and minimum or no tillage.

5. Conclusions

This work evaluated the economic profile of a KBG-PGC instance in standard Midwestern US corn production under optimistic and pessimistic scenarios compared to SCC. The pessimistic PGC scenario loses over USD 100/ac/yr in net return compared to a non-cover-cropped corn system; this level of loss would result in extremely low adoption rates. In contrast, the optimistic PGC scenario revenue in the second system year exceeds SCC by USD 70/ac/yr with a reliable stover market. In the absence of a stover market, the optimistic PGC scenario still achieves cost parity with SCC by Year 5, emphasizing the importance of groundcover longevity. The current PGC technology is arguably somewhere between these two extremes, with critical importance of groundcover cost, longevity, and suppression efficacy on the overall economic performance of the system. Lastly, it is important to note that the enterprise budget cannot incorporate the on- and off-farm value of the environmental and natural resources benefits that an optimized PGC system can deliver over SCC. If those benefits do translate to pecuniary or at least utility value, then the pessimistic scenario may have uncaptured added value, and the optimistic scenario may dominate by even more than what is captured in this exercise.

Author Contributions

Conceptualization, D.R.R., C.A.B., K.L.J. and K.J.M.; methodology, C.A.B., D.R.R. and K.L.J.; formal analysis, C.A.B. and D.R.R.; data curation, C.A.B.; writing—original draft preparation, C.A.B., D.R.R. and K.L.J.; writing—review and editing, D.R.R., K.L.J., K.J.M. and C.A.B.; project administration, D.R.R.; funding acquisition, D.R.R., K.J.M., K.L.J. and C.A.B. All authors have read and agreed to the published version of the manuscript.

Funding

This research was funded by the Agriculture and Food Research Initiative Competitive Grant No. 2021-68012-35923 from the United States Department of Agriculture National Institute for Food and Agriculture.

Institutional Review Board Statement

Not applicable.

Informed Consent Statement

Not applicable.

Data Availability Statement

All data are provided in this article within the format of tables and figures. The cooperative survey data for herbicide pricing are not available due to privacy restrictions and anonymity requirements.

Conflicts of Interest

The authors declare no conflicts of interest. The funders had no role in the design of the study; in the collection, analyses, or interpretation of data; in the writing of the manuscript; or in the decision to publish the results.

Appendix A

Sub MC_Final()
‘ Monte carlo—Code loops through 1000 times w/rand variations
‘ Core model lives on the same primary sheet, starting in cell CA1
‘ This provides room for long lists of output in the readily visible
‘ part of the spreadsheet.
‘ Written by DRR. Last revised by DRR on 14 July 2024
Dim i As Integer ‘ Iteration tracker
Dim x As Double ‘ For holding the randomly generated number
Dim CYBPA(1 To 3) As Double ‘ Corn yield, bu/ac [avg, sd, iteration val],
Dim HERPA(1 To 3) As Double ‘ Ann. Herb. Cost, $/ac [avg, sd, iteration val]
Dim GSCPP(1 To 3) As Double ‘ Grass seed cost, $/lb [avg, sd, iteration val]
Dim CPPB(1 To 3) As Double ‘ Corn price, $/bu [avg, sd, iteration val]
Dim STVPT(1 To 3) As Double ‘ Stover price, $/ton [avg, sd, iteration val]
‘ Populate the core values in the six key variables
‘ Start with the mean values, straight from the original budget
CYBPA(1) = 204 ‘ Avg yield, 204 bu/ac
HERPA(1) = 63.15 ‘ Avg herbicide cost, 63.15 $/ac
GSCPP(1) = 2.75 ‘ Avg grass seed cost, 2.75 $/lb
CPPB(1) = 5.05 ‘ Avg corn grain price, 5.05 $/bu
STVPT(1) = 50# ‘ Avg stover price, 50.00 $/ton
‘ Now provide standard deviation estimates for each variable.
‘ Iowa corn yield 2007–2023 standard deviation from trendline yield is 7.6%
CYBPA(2) = 0.076 * CYBPA(1) ‘ SD yield, bu/ac
‘ For next three variables, use data from Ag Decision Maker File A1-21
‘ Historical Costs of Crop Production "Chemical, Seed, and Fertilizer"
‘ value to determine deviation from trendline over past 15 years
HERPA(2) = 0.145 * HERPA(1) ‘ SD herbicide cost, $/ac
GSCPP(2) = 0.145 * GSCPP(1) ‘ SD grass seed cost, $/lb
CPPB(2) = 0.145 * CPPB(1) ‘ SD corn grain price, $/bu
‘ Based on Zulauf, C. “U.S. Hay Market over the Last 100 Years.”
‘ farmdoc daily (8):174, Department of Agricultural and Consumer Economics,
‘ University of Illinois at Urbana-Champaign, September 19, 2018.
‘ Hay to corn price ratio fluctuates around 0.8 to 1.2, so use same
‘ CV as for corn grain price
STVPT(2) = 0.145 * STVPT(1) ‘ SD stover price, $/ton
For i = 1 To 1000
‘ Compute the iteration values for all key variables
‘ Call the Rnd function here, not in the NormInv function
‘ to avoid errors; note that a new x should be computed
‘ before each variable to avoid false correlations
x = Rnd ‘ Rand val for corn yield, bu/ac
CYBPA(3) = Application.WorksheetFunction.NormInv(x, CYBPA(1), CYBPA(2))
x = Rnd ‘ Rand val for herbicide cost, $/ac
HERPA(3) = Application.WorksheetFunction.NormInv(x, HERPA(1), HERPA(2))
x = Rnd ‘ Rand val for grass seed cost, $/lb
GSCPP(3) = Application.WorksheetFunction.NormInv(x, GSCPP(1), GSCPP(2))
x = Rnd ‘ Rand val for corn grain price, $/bu
CPPB(3) = Application.WorksheetFunction.NormInv(x, CPPB(1), CPPB(2))
x = Rnd ‘ Rand val for stover price, $/ton
STVPT(3) = Application.WorksheetFunction.NormInv(x, STVPT(1), STVPT(2))
‘ Populate the scenario
Range(“CE12”).Value = CYBPA(3)
Range(“CB26”).Value = HERPA(3)
Range(“CB33”).Value = GSCPP(3)
Range(“CB66”).Value = CPPB(3)
Range(“CB67”).Value = STVPT(3)
‘ Read the resultS and write the three core values
Cells(i + 3, 1).Value = i ‘ Track the iteration #
Cells(i + 3, 2).Value = Range(“CF71”).Value ‘ SCC net return per acre
Cells(i + 3, 3).Value = Range(“CI71”).Value ‘ PGC Y1 opt net return per acre
Cells(i + 3, 4).Value = Range(“CO71”).Value ‘ PGC Y2+ opt net return per acre
‘ Ouput check values to clarify what’s driving variability
Cells(i + 1023, 1).Value = i ‘ Track the iteration #
Cells(i + 1023, 2).Value = Range(“CF71”).Value ‘ SCC net return per acre
Cells(i + 1023, 3).Value = Range(“CI71”).Value ‘ PGC Y1 opt net return per acre
Cells(i + 1023, 4).Value = Range(“CO71”).Value ‘ PGC Y2+ opt net return per acre
Cells(i + 1023, 5).Value = CYBPA(3)
Cells(i + 1023, 6).Value = HERPA(3)
Cells(i + 1023, 7).Value = GSCPP(3)
Cells(i + 1023, 8).Value = CPPB(3)
Cells(i + 1023, 9).Value = STVPT(3)
‘ Ouput the total cost and return for all scenarios (for graphing)
Cells(i + 2039, 1).Value = i ‘ Track the iteration #
Cells(i + 2039, 2).Value = Range("CF61").Value ‘ SCC cost per acre
Cells(i + 2039, 3).Value = Range("CF70").Value ‘ SCC return per acre
Cells(i + 2039, 4).Value = Range("CI61").Value ‘ PGC Y1 opt cost per acre
Cells(i + 2039, 5).Value = Range("CI70").Value ‘ PGC Y1 return per acre
Cells(i + 2039, 6).Value = Range("CL61").Value ‘ PGC Y1 pess cost per acre
Cells(i + 2039, 7).Value = Range("CL70").Value ‘ PGC Y1 pess return per acre
Cells(i + 2039, 8).Value = Range("CO61").Value ‘ PGC Y2+ opt cost per acre
Cells(i + 2039, 9).Value = Range("CO70").Value ‘ PGC Y2+ opt return per acre
Cells(i + 2039, 10).Value = Range("CR61").Value ‘ PGC Y2+ pess cost per acre
Cells(i + 2039, 11).Value = Range("CR70").Value ‘ PGC Y2+ pess return per acre
Next i
Cells(2039, 2).Value = “SCC cost”
Cells(2039, 3).Value = “SCC ret”
Cells(2039, 4).Value = “PGC Y1 opt cost”
Cells(2039, 5).Value = “PGC Y1 opt ret”
Cells(2039, 6).Value = “PGC Y1 pes cost”
Cells(2039, 7).Value = “PGC Y1 pes ret”
Cells(2039, 8).Value = “PGC Y2+ opt cost”
Cells(2039, 9).Value = “PGC Y2+ opt ret”
Cells(2039, 10).Value = “PGC Y2+ pes cost”
Cells(2039, 11).Value = “PGC Y2+ pes ret”
MsgBox (“Simulation Complete”)
End Sub

References

  1. Saavoss, M.; Capehart, T.; McBride, W.; Effland, A. Trends in Production Practices and Costs of the U.S. Corn Sector. ERR-294; U.S. Department of Agriculture, Economic Research Service: Washington, DC, USA, 2021. [Google Scholar]
  2. Wilhelm, W.W.; Johnson, J.M.F.; Hatfield, J.L.; Voorhees, W.B.; Linden, D.R. Crop and soil productivity response to maize residue removal: A literature review. Agron. J. 2004, 96, 1–17. [Google Scholar] [CrossRef]
  3. Pribyl, D.W. A critical review of the conventional SOC to SOM conversion factor. Geoderma 2010, 156, 75–83. [Google Scholar] [CrossRef]
  4. Wilhelm, W.W.; Johnson, J.M.F.; Karlen, D.L.; Lightle, D.T. Corn stover to sustain soil organic carbon further constrains biomass supply. Agron. J. 2007, 99, 1665–1667. [Google Scholar] [CrossRef]
  5. Johnson, J.M.F.; Allmaras, R.R.; Reicosky, D.C. Estimating source carbon from crop residues, roots and rhizodeposits using the national grain-yield database. Agron. J. 2006, 98, 622–636. [Google Scholar] [CrossRef]
  6. Carter, M.R. Soil quality for sustainable land management: Organic matter and aggregation interactions that maintain soil function. Agron. J. 2002, 94, 38–47. [Google Scholar] [CrossRef]
  7. Pimentel, D.; Harvey, C.; Resosudarmo, P.; Sinclair, K.; Kurz, D.; McNair, M.; Crist, S.; Shpritz, L.; Fitton, L.; Saffouri, R.; et al. Environmental and economic costs of soil erosion and conservation benefits. Science 1995, 267, 1117–1123. [Google Scholar] [CrossRef] [PubMed]
  8. Montgomery, D.A. Soil erosion and agricultural sustainability. Proc. Natl. Acad. Sci. USA 2007, 104, 13268–13272. [Google Scholar] [CrossRef] [PubMed]
  9. Rogovska, N.; Laird, D.A.; Karlen, D.L. Corn and soil response to biochar application and stover harvest. Field Crops Res. 2016, 187, 96–106. [Google Scholar] [CrossRef]
  10. Claassen, R.; Bowman, M.; McFadden, J.; Smith, D.; Wallander, S. Tillage Intensity and Conservation Cropping in the United States, EIB-197; U.S. Department of Agriculture, Economic Research Service: Washington, DC, USA, 2018. [Google Scholar]
  11. U.S. Department of Energy. Sustainable Aviation Fuel. 2024. Available online: https://afdc.energy.gov/fuels/sustainable-aviation-fuel#:~:text=The%20Sustainable%20Aviation%20Fuel%20Grand,in%20lifecycle%20greenhouse%20gas%20emissions (accessed on 2 May 2024).
  12. Perlack, R.D.; Wright, L.L.; Turhollow, A.F.; Graham, R.L.; Stokes, B.J.; Erbach, D.C. Biomass as Feedstock for a Bioenergy and Bioproducts Industry: The Technical Feasibility of a Billion-Ton Annual Supply; Oak Ridge National Laboratory: Oak Ridge, TN, USA, 2005. [Google Scholar]
  13. Sheehan, J.; Aden, A.; Paustian, K.; Killian, K.; Brenner, J.; Walsh, M.; Nelson, R. Energy and environmental aspects of using maize stover for fuel ethanol. J. Ind. Ecol. 2003, 7, 117–146. [Google Scholar] [CrossRef]
  14. U.S. Department of Energy. 2023 Billion-Ton Report: An Assessment of U.S. Renewable Carbon Resources; Langholtz, M.H., Ed.; ORNL/SPR-2024/3103; Oak Ridge National Laboratory: Oak Ridge, TN, USA, 2024. [Google Scholar] [CrossRef]
  15. McAloon, A.; Taylor, F.; Yee, W.; Ibsen, K.; Wooley, R. Determining the Cost of Producing Ethanol from Cornstarch and Lignocellulosic Feed Stocks; Technical Report NREL/TP-580-28893; National Renewable Energy Laboratory (NREL): Golden, CO, USA, 2000. [Google Scholar]
  16. U.S. Department of Agriculture National Agriculture Statistics Service. Census of Agriculture, 2022. 2024. Available online: https://www.nass.usda.gov/AgCensus/ (accessed on 10 June 2024).
  17. Arbuckle, J.G.; Roesch-McNally, G.J. Cover crop adoption in Iowa: The role of perceived practice characteristics. J. Soil Water Conserv. 2015, 70, 418–419. [Google Scholar] [CrossRef]
  18. Dunn, M.; Ulrich-Schad, J.D.; Prokopy, L.S.; Myers, R.L.; Watts, C.R.; Scanlon, K. Perceptions and use of cover crops among early adopters: Findings from a national survey. J. Soil Water Conserv. 2016, 71, 29–40. [Google Scholar] [CrossRef]
  19. Gonzalez-Ramirez, M.J.; Kling, C.L.; Arbukle, J.G.; Morton, L.W.; McGuire, J.; Ingels, C.; Benning, J. Cover Crop Adoption Decisions in Iowa: Insights from an In-Person Survey; Agriculture Policy Review; Iowa State University: Ames, IA, USA, 2017. [Google Scholar]
  20. Myers, R.L.; Wilson, K.R. Farmer perspectives about cover crops by non-adopters. Front. Sustain. Food Syst. 2023, 7, 1011201. [Google Scholar] [CrossRef]
  21. Ruppert, S.; Coppess, J.; Skidmore, M. A Menace Reconsidered, Part 5: Reviewing Cover Crops. Farmdoc Daily 2024, 14, 84. [Google Scholar]
  22. Mintert, J.; Langemeier, M. Purdue Center for Commercial Agriculture. Purdue/CME Group Ag Economy Barometer September Results. 2023. Available online: https://ag.purdue.edu/commercialag/ageconomybarometer/weakening-crop-prices-and-high-production-costs-weigh-on-farmer-sentiment/ (accessed on 3 May 2024).
  23. Deines, J.M.; Guan, K.; Lopez, B.; Zhou, Q.; White, C.S.; Wang, S.; Lobell, D.B. Recent cover crop adoption is associated with small maize and soybean yield losses in the United States. Glob. Chang. Biol. 2023, 29, 794–807. [Google Scholar] [CrossRef]
  24. Agriculture Improvement Act of 2018, Pub. L. No. 115-334. 2018. Available online: https://www.govinfo.gov/app/details/PLAW-115publ334 (accessed on 3 May 2024).
  25. U.S. Department of Agriculture. Risk Management Agency. Risk Management Agency Fact Sheet Washington National Office—Washington, DC. Revised June 2019. 2019. Available online: https://www.rma.usda.gov/en/Fact-Sheets/National-Fact-Sheets/Cover-Crops-and-Crop-Insurance (accessed on 14 May 2024).
  26. U.S. Department of Agriculture. NRCS Cover Crop Termination Guidelines Version 4: June 2019. 2019. Available online: https://www.nrcs.usda.gov/sites/default/files/2022-09/Termination_Guidelines_Designed_6.28_10.24am_%28002%29.pdf (accessed on 3 May 2024).
  27. Moore, K.J.; Anex, R.P.; Elobeid, A.E.; Fei, S.; Flora, C.B.; Goggi, A.S.; Jacobs, K.L.; Jha, P.; Kaleita, A.L.; Karlen, D.L.; et al. Regenerating Agricultural Landscapes with Perennial Groundcover for Intensive Crop Production. Agronomy 2019, 9, 458. [Google Scholar] [CrossRef]
  28. Bartel, C.A.; Moore, K.J.; Fei, S.; Lenssen, A.W.; Hintz, R.L.; Kling, S.M. Evaluating strip and no-till maintenance of perennial groundcovers for annual grain production. Crops 2022, 2, 268–287. [Google Scholar] [CrossRef]
  29. Bartel, C.A.; Moore, K.J.; Fei, S.; Lenssen, A.W.; Hintz, R.L.; Kling, S.M. Evaluating chemical suppression treatments to alter the red:far-red ratio in perennial groundcovers for maize production. Agronomy 2022, 12, 1854. [Google Scholar] [CrossRef]
  30. Chen, A.; Fei, S.; Lenssen, A.W.; Moore, K.J. Evaluating cool-season grass species as potential perennial groundcover for maize production. Agron. J. 2022, 114, 2415–2429. [Google Scholar] [CrossRef]
  31. Galland, P.; Fei, S.; Moore, K.; Thoms, A. The Effects of Perennial Groundcover on Soil-Water and Nutrient Dynamics in Maize Intercropping Systems. Master’s Thesis, Iowa State University, Ames, IA, USA, 2022. [Google Scholar]
  32. Wiggans, D.R.; Singer, J.W.; Moore, K.J.; Lamkey, K.R. Response of continuous maize with stover removal to living mulches. Agron. J. 2012, 104, 917–925. [Google Scholar] [CrossRef]
  33. Wiggans, D.R.; Singer, J.W.; Moore, K.J.; Lamkey, K.R. Maize water use in living mulch systems with stover removal. Crop Sci. 2012, 52, 327–338. [Google Scholar] [CrossRef]
  34. Flynn, E.S.; Moore, K.J.; Singer, J.W.; Lamkey, K.R. Evaluation of grass and legume species as perennial ground covers in corn production. Crop Sci. 2013, 53, 1–10. [Google Scholar] [CrossRef]
  35. Perfect, E.; Kay, B.D.; van Loon, W.K.P.; Sheard, R.W.; Posajok, T. Rates of change in soil structural stability under forages compared to corn. Soil Sci. Soc. Am. J. 1990, 54, 179–186. [Google Scholar] [CrossRef]
  36. Follett, R.F. Soil management concepts and carbon sequestration in cropland soils. Soil Tillage Res. 2001, 71, 77–92. [Google Scholar] [CrossRef]
  37. Randall, G.W.; Goss, M.J. Chapter 6. Nitrate Losses to Surface Water through Subsurface, Tile Drainage in Nitrogen in the Environment: Sources, Problems, and Management; Hatfield, J.L., Follett, R.F., Eds.; Elsevier Inc.: Amsterdam, The Netherlands, 2008. [Google Scholar]
  38. Hartwig, N.L.; Ammon, H.U. Cover crops and living mulches. Weed Sci. 2002, 50, 688–699. [Google Scholar] [CrossRef]
  39. Myers, G. Analysis and Assessment of Novel Food, Bioenergy, and Cropping Systems: Cultured Meat, Anaerobic Digestion, and Perennial Groundcover Analysis and Assessment of Novel Food, Bioenergy, and Cropping Systems: Cultured Meat, Anaerobic Digestion, and Perennial Groundcover. Doctoral Dissertation, Iowa State University, Ames, IA, USA, 2024. [Google Scholar]
  40. U.S. Department of Agriculture. Crop Technology Readiness Level (TRL). United State Department of Agriculture National Institute of Food and Agriculture Institute of Food Production and Sustainability. 2018. Available online: https://www.nifa.usda.gov/sites/default/files/resources/Crop-Research-Technology-Readiness-Level-2018.pdf (accessed on 14 May 2024).
  41. Plastina, A.; Magwaba, K. Estimated Costs of Crop Production in Iowa—2024 (File A1-20). Iowa State University Extension and Outreach Ag Decision Maker. 2024. Available online: https://www.extension.iastate.edu/agdm/crops/html/a1-20.html (accessed on 10 June 2024).
  42. Bartel, C.A.; Banik, C.; Lenssen, A.W.; Moore, K.J.; Laird, D.A.; Archontoulis, S.V.; Lamkey, K.R. Living mulch for sustainable maize stover biomass harvest. Crop Sci. 2017, 57, 3273–3290. [Google Scholar] [CrossRef]
  43. Bartel, C.A.; Banik, C.; Lenssen, A.W.; Moore, K.J.; Laird, D.A.; Archontoulis, S.V.; Lamkey, K.R. Establishment of perennial groundcovers for maize-based bioenergy production systems. Agron. J. 2017, 109, 822–835. [Google Scholar] [CrossRef]
  44. Bartel, C.A.; Archontoulis, S.V.; Lenssen, A.W.; Moore, K.J.; Huber, I.L.; Laird, D.A.; Dixon, P.M. Modeling perennial groundcover effects on annual maize grain crop growth with APSIM. Agron. J. 2020, 112, 1895–1910. [Google Scholar] [CrossRef]
  45. Nelson, G.C.; van der Mensbrugghe, D.; Ahammad, H.; Blanc, E.; Calvin, K.; Hasegawa, T.; Havlik, P.; Heyhoe, E.; Kyle, P.; Lotze-Campen, H. Agriculture and climate change in global scenarios: Why don’t the models agree. Agric. Econ. 2014, 45, 85–101. [Google Scholar] [CrossRef]
  46. Johanns, A.; Plastina, A. Historical Costs of Crop Production (File A1-21). Iowa State University Extension and Outreach Ag Decision Maker. 2024. Available online: https://www.extension.iastate.edu/agdm/crops/html/a1-21.html (accessed on 10 June 2024).
  47. Abendroth, L.J.; Elmore, R.W.; Boyer, M.J.; Marlay, S.K. Corn Growth and Development; North Dakota University: Grand Forks, ND, USA, 2011. [Google Scholar]
  48. Ruiz, A.; Trifunovic, S.; Eudy, D.M.; Sciarresi, C.S.; SCCm, M.; Danalatos, G.J.N.; Elli, E.F.; Kalogeropoulos, G.; King, K.; dos Santos, C.; et al. Harvest index has increased over the last 50 years of maize breeding. Field Crops Res. 2023, 300, 108991. [Google Scholar] [CrossRef]
  49. Farooq, M.; Hussain, M.; Wahid, A.; Siddique, K.H.M. Drought Stress in Plants: An Overview. In Plant Responses to Drought Stress; Aroca, R., Ed.; Springer: Berlin/Heidelberg, Germany, 2012. [Google Scholar] [CrossRef]
  50. Licht, M. Third Year of Drought Changes Cover Crop Plans. 2 Oct 2023. Ag|Update Iowa Corn Promotion Board. Available online: https://agupdate.com/crops/third-year-of-drought-changes-cover-crop-plans/article_a207a700-5e2e-11ee-a948-cfb4cc551513.html (accessed on 29 May 2024).
  51. Zumkeller, M.; Yu, R.; Torres, N.; Marigliano, L.E.; Zaccaria, D.; Kurtural, S.K. Site characteristics determine the effectiveness of tillage and cover crops on the net ecosystem carbon balance in California vineyard agroecosystems. Front. Plant Sci. 2022, 13, 1024606. [Google Scholar] [CrossRef] [PubMed]
  52. Li, C.; Hayes, D.; Jacobs, K. The “Stover Availability versus Supply” Puzzle and Contracting Options for Cellulosic Biomass. Agricultural Policy Review. Center for Agricultural and Rural Development, Iowa State University. 2018. Available online: https://agpolicyreview.card.iastate.edu/winter-2018/stover-availability-versus-supply-puzzle-and-contracting-options-cellulosic-biomass (accessed on 29 May 2024).
  53. Hoskinson, R.L.; Karlen, D.L.; Birrell, S.J.; Radtke, C.W.; Wilhelm, W.W. Engineering, nutrient removal, and feedstock conversion evaluations of four corn stover harvest scenarios. Biomass Bioenergy 2007, 31, 126–136. [Google Scholar] [CrossRef]
  54. MacDonald, J.M.; Korb, P.; Hoppe, R.A. Farm Size and the Organization of U.S. Crop Farming, ERR-152; U.S. Department of Agriculture, Economic Research Service: Washington, DC, USA, 2013. [Google Scholar]
  55. U.S. Department of Agriculture Economic Research Service. Farm Structure and Organization: Farm Structure and Contracting. 2024. Available online: https://www.ers.usda.gov/topics/farm-economy/farm-structure-and-organization/farm-structure-and-contracting/ (accessed on 14 May 2024).
  56. Marra, M.C.; Carlson, G.A. The Role of Farm Size and Resource Constraints in the Choice between Risky Technologies. West. J. Agric. Econ. 1987, 12, 109–118. Available online: https://www.jstor.org/stable/40987860 (accessed on 14 May 2024).
  57. Fiechter, C.; Ifft, J. Seed Corn Costs: How Large Are the Discounts? Farmdoc Daily 2019, 9, 190. [Google Scholar]
  58. US Department of Agriculture Risk Management Agency, The Risk Management Safety Net: Market Penetration and Market Potential, September 2017. Available online: https://www.rma.usda.gov/about-crop-insurance/highlighted-initiatives-plans/beginners-guide-crop-insurance (accessed on 29 May 2024).
  59. U.S. Department of Agriculture. Federal Crop Insurance Corporation Crop Insurance Handbook: 2023 and Succeeding Years FCIC-18010 (06-2022); United States Department of Agriculture Farm Production and Conservation Risk Management Agency: Kansas City, MO, USA, 2023. [Google Scholar]
  60. U.S. Department of Agriculture Federal Crop Insurance Corporation. Summary of Changes for the Common Crop Insurance Policy Basic Provisions—Reinsured Version (24.1-br) (Released November 2023). Available online: https://www.rma.usda.gov/policy-procedure/general-policies (accessed on 9 May 2024).
  61. Stubbs, M. Agricultural Conservation and the Next Farm Bill. Report R47478. Congressional Research Service 20 March 2023. Available online: https://crsreports.congress.gov (accessed on 29 May 2024).
Figure 1. Profile of corn growing in PGC. Corn is planted in alternating strip-tilled rows between the groundcover, which protects 50% of the soil surface directly and more of it via sediment trapping. Mechanical suppression spatially separates the corn growth zone from the groundcover zone.
Sustainability 16 07112 g001
Figure 2. Average cost and revenue for scenarios; error bars represent 1 standard deviation plus or minus average.
Sustainability 16 07112 g002
Table 1. PGC system pessimistic scenario assumptions relative to the optimistic scenario by year.
Year 1Year 2+
Expected YieldsCorn (bu/ac)Identical assumptions *Approx 15% yield drag
Stover harvest (Ton/acre, T/ac)Identical assumptionsApprox 16% yield drag
Costs: Spring ActivitiesPre-harvest machineryIdentical assumptionsIdentical assumptions
Seed, Chemical, inputs per acreIdentical assumptionsIdentical assumptions
Grass establishment (Year 1)Pessimistic requires more seed and greater seed bed preparation (field operations)-
Grass suppression (Year 2+)-More intense strip tilling and suppressant application
Costs: Fall andPost-Harvest ActivitiesCorn harvestIdentical assumptionsReduced hauling, drying, and handling due to lower yield
Corn stover removal per acreIdentical assumptionsReduced hauling due to lower removal rate
Costs: OtherLand (cash rent equivalent)Identical assumptionsIdentical assumptions
LaborIncreased due to greater spring field operationsIncreased due to greater suppression needs
Revenue (per acre)Corn salesIdentical assumptionsLower due to yield drag
Stover salesIdentical assumptionsLower due to yield drag
USDA paymentsIdentical assumptionsIdentical assumptions
Crop insurance rebateIdentical assumptionsIdentical assumptions
* “Identical assumptions” denotes equivalent fixed and variable costs in the pessimistic and optimistic scenarios.
Table 2. Cost comparison of a PGC system with standard continuous corn (SCC) production in the US Midwest.
SCCPGC—Year 1|OptimisticPGC—Year 1|PessimisticPGC—Year 2+|OptimisticPGC—Year 2+|Pessimistic
Pre-harvest totalUSD 556USD 637USD 676USD 533USD 554
Harvest totalUSD 129USD 129USD 129USD 129USD 117
Stover operations totalUSD 56USD 56USD 56USD 66USD 62
Total costs per acreUSD 1126USD 1210USD 1258USD 1113USD 1122
Cost comparison to SCC USD 84USD 133-USD 13-USD 4
Table 3. Revenue comparison of a PGC system with standard continuous corn (SCC) production in the US Midwest.
SCCPGC—Year 1|OptimisticPGC—Year 1|PessimisticPGC—Year 2+|OptimisticPGC—Year 2+|Pessimistic
Expected corn yield, bu/ac204 204 204 204 175
Expected corn stover harvest, T/ac1.9 1.91.9 3.3 2.8
Return per acre
Expected selling price, corn bu/ac @ USD 5.05/buUSD 1030USD 1030USD 1030USD 1030USD 884
Expected selling price, stover T/ac @ USD 50.00/TUSD 95USD 95USD 95USD 165USD 140
Revenue/acUSD 1125USD 1125USD 1125USD 1195USD 1024
Net return/acUSD 0−USD 84−USD 133USD 83−USD 98
Table 4. Average cost and revenue plus standard deviations of differences between each of the four PGC scenarios and standard continuous corn (SCC).
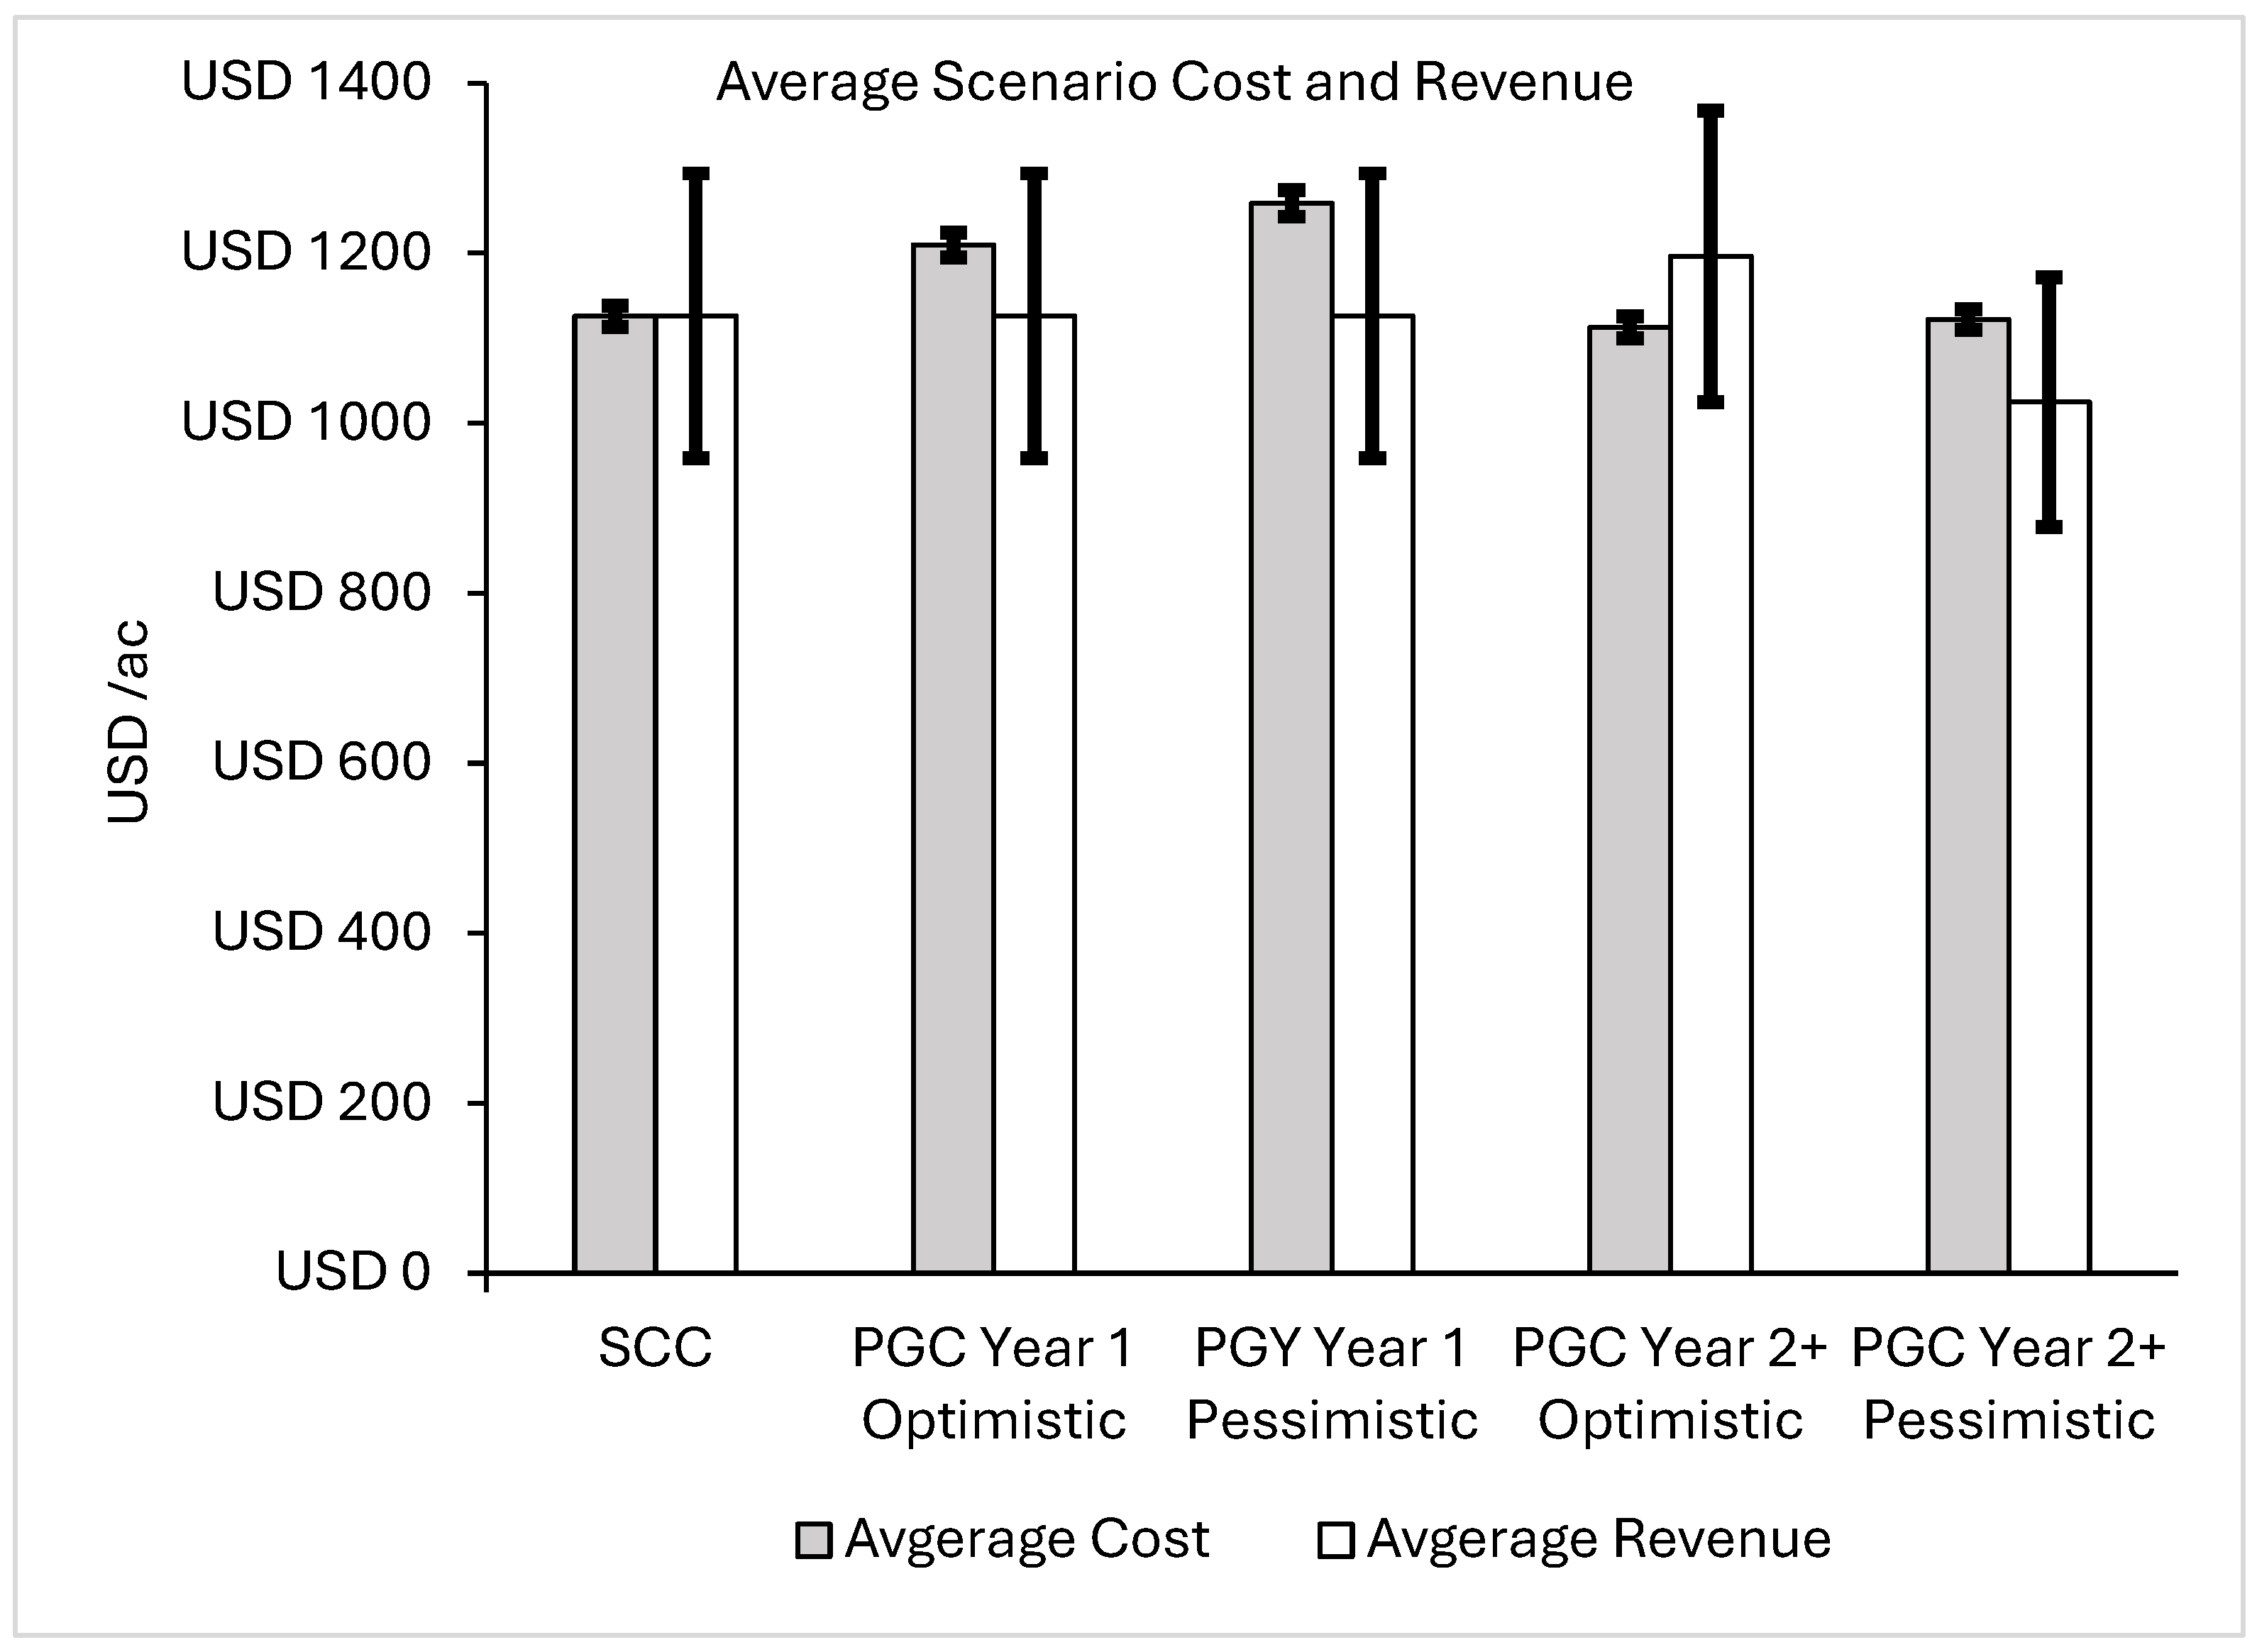
Differences in Costs and Revenue for PGC from SCC (USD /ac/yr)
PGC Year and ScenarioPGC Y1
Optimistic
PGY Y1
Pessimistic
PGC Y2+
Optimistic
PGC Y2+
Pessimistic
Average costUSD 84USD 133−USD 13−USD 4
Standard deviation costUSD 8USD 10USD 1USD 0
Average revenueUSD 0USD 0USD 70−USD 101
Standard deviation revenueUSD 0USD 0USD 11USD 23
Table 5. Differences between stover harvest optimistic scenarios and SCC at different PGC life expectancies.
Differences in Net Return (USD /ac/yr) of PGC and SCC
PGC Life Expectancy1 Year3 Years5 Years7 Years9 Years
Average difference−USD 84USD 28USD 50USD 60USD 65
Standard DeviationUSD 8USD 8USD 9USD 9USD 11
Disclaimer/Publisher’s Note: The statements, opinions and data contained in all publications are solely those of the individual author(s) and contributor(s) and not of MDPI and/or the editor(s). MDPI and/or the editor(s) disclaim responsibility for any injury to people or property resulting from any ideas, methods, instructions or products referred to in the content.

