Article

Environmental Sustainability in OECD Nations: The Moderating Impact of Green Innovation on Urbanization and Green Growth

by
Guanling Chang
1,*,
Iftikhar Yasin
2,3,* and
Syed Muhammad Muddassir Abbas Naqvi
4
1
School of International Economics and Trade, Central University of Finance and Economics, Beijing 102200, China
2
School of Business, INTI International University, Nilai 71800, Malaysia
3
Department of Economics, The University of Lahore, Lahore 54000, Pakistan
4
Department of Economics, Government College University, Faisalabad 37000, Pakistan
*
Authors to whom correspondence should be addressed.
Sustainability 2024, 16(16), 7047; https://doi.org/10.3390/su16167047
Submission received: 8 July 2024 / Revised: 5 August 2024 / Accepted: 9 August 2024 / Published: 16 August 2024

Abstract

:
Rapid urbanization and economic growth in OECD member nations have intensified environmental challenges, notably the rise in carbon dioxide (CO2) emissions. Despite significant research on urbanization and growth, there is little knowledge of how these factors interact with green innovation to affect CO2 emissions. This study addresses this gap by exploring the impacts of urbanization, green innovation, and green growth on CO2 emissions in OECD countries. Using panel data analysis from 1996 to 2022, this study employs a robust econometric approach, including the Breusch–Pagan and Pesaran tests for cross-sectional dependency, the CIPS unit root test, and cointegration tests by Kao and Westerlund. The results confirm the complex interrelations of the variables by revealing notable cross-sectional dependence and heterogeneity among them. Both the Driscoll–Kraay and System GMM estimations demonstrate that green growth (GreG) and green innovation (GrI) significantly reduce CO2 emanations, while urbanization (U) has a notable inverse effect. Renewable energy consumption (REnC) also contributes to lower pollution emanations, whereas energy consumption (EnC) and natural resource dependency (NrD) worsen environmental degradation. The study emphasizes the need for green economic policies and innovations to slow climate change, support sustainable growth, and improve environmental quality.

1. Introduction

Contemporary economies depend on an unstoppable economic growth engine driven by technology breakthroughs and globalization [1,2]. However, this progress casts a long, dark shadow on our environment because as economies rapidly expand, concerns about sustainability, shortages of resources, and overall environmental health rise [3,4]. The main reasons include climate change and the greenhouse gas emanations that are increasing continuously due to our growing energy and resource demands [5,6]. An especially concerning trend is the notable rise in carbon dioxide (CO2) emanations, a significant contributor to environmental deterioration and a threat to the world’s ecosystems [7,8]. The world’s CO2 emanations have increased from 24.25 billion tons in 1996 to an enormous 37.15 billion tons in 2022, a 54% increase (OECD). Hence, this exponential growth severely constrains environmental preservation and sustainable development.
Developed nations’ continuing urbanization and economic activity are worsening environmental issues, often linked to increased energy consumption, environmental damage, and carbon dioxide emanations [9]. The combustion of fossil fuels was the primary source of carbon dioxide (CO2), which accounted for 71.6% of all greenhouse gas emanations in 2022 (EDGAR). Nevertheless, there is potential because of the expanding green innovation and the growth sector, which presents possible fresh strategies for addressing these pressing environmental issues.
The impact of urbanization on the environment is a complex issue. Despite much research investigating it, there has not been agreement on this link [10,11]. Previous research has yielded conflicting results, highlighting the intricate nature of the urban–environment association. Urbanization can have both beneficial and harmful environmental impacts. On the one hand, urbanization can contribute to environmental destruction by instigating the consumption of fossil fuels and rising demand that stems from the need for housing, public infrastructure, and transportation [12].
Yasin, Ahmad and Chaudhary [10] also argue that urbanization leads to higher energy consumption, which can exacerbate environmental problems. Conversely, others contend that urbanization may benefit the environment as well. The sustainable use of land, urban agglomerations, and public infrastructure may all help to improve the environment [13,14]. Urbanization can also reduce private vehicle usage and shorter travel distances, mitigating CO2 emanations [15].
The pressing need to balance economic expansion with environmental sustainability has led to a growing emphasis on green growth and innovation. Green growth aims to minimize ecological effects and resource depletion in the pursuit of economic prosperity. It emphasizes fostering economic growth and development while preventing environmental degradation, loss of biodiversity, and unsustainable use of natural resources [16]. However, green innovation creates new business initiatives, technologies, and procedures that advance environmental sustainability. Green innovation aims to address environmental challenges while driving economic growth and enhancing the quality of life [2].
For many compelling reasons, this research concentrates especially on OECD nations. Even though they comprise just 17.3% of the world’s population, OECD members account for a disproportionate amount of world economic activity. While making up around 46% of the world’s GDP in 2021 (US Department of State), they used about 38.8% of the planet’s primary energy. Moreover, significant sectors of their economies—energy, transportation, and manufacturing—contribute to greenhouse gas emanations. For instance, 34% of the carbon emanations from energy use worldwide are attributed to the OECD countries (BP Statistical Review of World Energy, 2023). Given the concentration of emanations and economic power within a small demographic group, the OECD is an essential region to research regarding green growth and innovation.
By concentrating on OECD nations, we can look at how urbanization, economic development trends, and environmental concerns interact in a context that significantly impacts the world environment. Knowing how these elements interact and affect environmental eminence inside the OECD will help us obtain the necessary knowledge to use in other areas dealing with comparable issues.
Understanding how green innovation can moderate the ecological impact of green growth and urbanization in OECD countries is crucial for several reasons. First, OECD nations carry tremendous economic power over the world. Other countries can learn from their success in decarbonizing their economy while retaining economic development. Second, the complicated interplay between urbanization and environmental results in OECD nations might give valuable insights into areas experiencing fast urbanization.
By examining these objectives, the study seeks to contribute new insights into how green innovation can influence the environmental outcomes of urbanization and green growth in OECD countries. This method offers a more sophisticated view of how these variables interact and how their combined effect affects CO2 emissions, a topic that has not received enough attention in the literature. Hence, this study aims to investigate the moderating role of green innovation on the relationship between urbanization and carbon dioxide emissions. Additionally, the study seeks to explore whether green innovation amplifies the positive environmental effects of green growth by examining the moderating influence of green innovation on the relationship between green growth and carbon dioxide emissions in OECD nations from 1996 to 2022.
While previous research has explored the independent effects of green growth, urbanization, and green innovation on environmental outcomes, the novelty of this study lies in its focus on the interplay between these factors. Limited research investigates how green innovation can concurrently moderate the environmental impact of green growth and urbanization. This study fills the gap by looking at how, in the OECD nations, green innovation could lessen the environmental stresses brought on by urban development and economic growth. Additionally, by focusing on a specific group of economically influential countries, this study can provide insights with broader applicability for regions facing similar challenges of balancing economic growth with environmental sustainability.
The study is structured as follows: Section 2 presents the literature review, followed by the theoretical framework and model specification in Section 3. Section 4 details the data description and methodology, while Section 5 discusses the results and their implications. The concluding section provides the conclusion and policy recommendations.

2. Literature Review

This section discusses how, in various nations and regions over time, multiple factors—including green growth, urbanization, green innovation, energy consumption, renewable energy consumption, and the depletion of natural resources—have either improved or decreased environmental quality.
The emergence of the literature on green growth may be traced back to the global monetary crisis 2008, with a predominant focus on its implementation in developed countries. To date, the fields of jobs, technology, innovation, and commerce are just a few topics covered in the literature on green growth and the basic theoretical and diagnostic types [17]. Sustainable development cannot be attained without green growth, which may tackle economic and environmental sustainability [18]. According to Bank [19], green growth is regarded as economically efficient and crucial for the future of less developed nations. Green growth can yield substantial social and economic benefits [20]. In addition to the advantages of green growth, Jouvet and de Perthuis [21] argue that the benefits of green growth policies encompass resource efficiency, the recognition of natural capital in economic calculations, the transformation of energy systems, and the implementation of pricing mechanisms for externalities related to the environment. While many countries share similar green growth development objectives, it is essential to note that the precise strategies employed by each country for achieving green growth vary [19,22].
The efficacy of green innovation in the growth environment model for mitigating CO2 emanations, conserving energy, and fostering economic growth has been widely acknowledged [2,23,24,25,26]. The literature suggests a positive correlation between financial development and energy consumption, explicitly concerning fossil fuels, which has negative environmental implications [27,28]. Solarin and Bello [29] suggest that advancing energy technology substantially reduces CO2 emanations and promotes environmental sustainability. Saqib, Usman, Ozturk and Sharif [26] examined the top ten countries with the most significant ecological footprint from 1990 to 2019 and discovered that environmental innovations, green growth, and renewable energy positively influence environmental quality, while financial expansion and non-renewable energy use harm the environment.
Sadiq et al. [30] investigated BRICS nations from 2001 to 2020, and by utilizing the cross-sectional autoregressive distributed lag (CS-ARDL) technique, showed that green financing, eco-innovation, renewable energy production, renewable energy consumption, and carbon taxes had a negative influence on CO2 emissions. Huang [31] investigated the influence of natural resources, innovation, globalization, and green development on BRICS nations between 1990 and 2021. Results indicate that globalization harms green growth, even when natural resources, financial development, and R&D support it.
Individuals from various locations are migrating from rural to urban areas to pursue economic prospects and societal well-being, a phenomenon commonly referred to as urbanization. Extensive empirical research has been conducted to examine the effects of urbanization on environmental quality, encompassing many social classes and nations. The findings indicate that urbanization can benefit and harm carbon emanation. A study by Sharma [32] determined that urbanization positively impacts wealth rather than carbon emanations. This conclusion was drawn from an analysis of sixty-nine nations from 1985 to 2005. The results show that energy use, trade openness, and GDP per person positively affect CO2 emanations, but urbanization has a negative impact. The study by Martínez-Zarzoso and Maruotti [33] examines the correlation between urbanization and CO2 emanations and presents an alternative perspective on the threshold. A relationship with an inverted U shape was discovered, indicating that carbon emanations become negative when urbanization reaches a certain degree and remains constant outside that. Hanif [34] demonstrated that the rise in carbon emanations can be attributed to the substantial influence of energy use and urbanization. Between 1996 and 2016, Yasin, Ahmad and Chaudhary [10] investigated the effects of financial development, political institutions, urbanization, and trade openness on CO2 emissions in 59 developing nations. The findings indicate that while commerce and institutions positively affect environmental quality, financial development, urbanization, and energy usage deteriorate it. The report recommends institutional reforms and incorporating environmental concerns into financial policies to reduce pollution and promote long-term growth.
In contrast, Poumanyvong et al. [35] conducted a comprehensive analysis of data from 99 nations spanning the years 1975 to 2005 to examine the impact of urbanization on energy consumption and carbon dioxide emanations. According to the results, various forms of development exhibited distinct effects on energy consumption and CO2 emanations because of urbanization. Urbanization has a favorable influence on carbon emanations across all income groups, but it is most pronounced in middle-income nations. Furthermore, Yasin, Ahmad and Chaudhary [8] studied the impact of financial development, urbanization, trade openness, political systems, and energy use on ecological footprints (EF) in 110 nations between 1996 and 2016. The findings confirm the EKC hypothesis, demonstrating that energy consumption reduces EF, while political institutions, trade openness, and urbanization improve it.
The correlation between carbon dioxide emanations and the utilization of renewable energy sources has been extensively studied. Azam et al. [36] conducted a study examining Sub-Saharan African countries between 1960 and 2017. Evidence of a bidirectional association between renewable energy consumption and economic growth was found in these economies. Saadaoui [37] conducted a study on nineteen industrialized and developing nations and observed a correlation between CO2 emanations and the utilization of renewable energy. Their findings showed that using renewable energy reduced CO2 emanations.
Additionally, in the context of 25 African economies, Abou Houran and Mehmood [38] found that renewable energy harmed CO2 emanations. The study conducted by Das et al. [39] revealed a negative correlation between renewable energy consumption and carbon dioxide emanations in the MINT countries, namely Mexico, Indonesia, Nigeria, and Turkey. Numerous research, such as the study conducted by Sheraz et al. [40], have provided evidence of the adverse consequences of renewable energy consumption.
The degradation of environmental quality is a consequence of high energy use, as conventional energy sources emit greenhouse gas emanations into the atmosphere. Much research has been conducted on the relationship between energy use and carbon dioxide emanations. Omri [41] analyzed the economic expansion, energy consumption, and environmental degradation of the MENA region between 1990 and 2011. The research revealed that energy regulations significantly influence the correlation between the two variables. The research undertaken by Soytas and Sari [42] presents more empirical support for the causal relationship between energy consumption and CO2 emanations in Turkey during the period spanning from 1960 to 2000. In their study examining the correlation between real GDP, energy consumption, and carbon dioxide emanations in 12 MENA countries from 1981 to 2005, Arouri et al. [43] established the existence of a bidirectional causality between carbon emanations and energy consumption. In the same vein, Hilaire et al. [44] have shown that energy consumption and economic growth have a considerable impact on CO2 levels both in the short and long term.
The impact of natural resources on ecological sustainability was investigated by Sun et al. [45]. Empirical findings suggest that using natural resources may contribute to an increase in pollution levels. Bekun et al. [46] used the PMG-ARDL approach to show that natural resources were positively correlated with environmental pollution throughout a lifetime. Adebayo et al. [47] have identified natural resources as an essential factor contributing to the rise in environmental pollution in newly industrialized nations by incorporating MM-QR from 1990 to 2018. In their study, Kwakwa et al. [48] used the STIRPT framework and the ARDL approach to examine the association between natural resources and ecological pollution in Ghana from 1971 to 2013. Based on their research, natural resources can elevate pollutant levels. Joshua and Bekun [49] have also shown that natural resources substantially exacerbate environmental contamination.
These findings support two specific hypotheses. H1: Green innovation moderates the relationship between urbanization and carbon dioxide emissions, reducing the adverse environmental impact. H2: Green innovation moderates the relationship between green growth and carbon dioxide emissions, increasing the beneficial environmental impact of green growth. Furthermore, The Environmental Kuznets Curve (EKC) hypothesis supports the idea that economic growth initially leads to environmental degradation, but beyond a certain level of income, the relationship reverses as societies invest in cleaner technologies [8,50]. Additionally, the Diffusion of Innovations Theory explains how new ideas and technology spread, which in the context of green innovation, suggests significant potential for reducing emissions [51].
Although the relationship between green innovation and CO2 emissions is well-documented, its role as a moderator in the interaction between urbanization and CO2 emissions has not been thoroughly investigated. Furthermore, while the benefits of green growth are established, the interaction between green innovation and green growth and its effect on CO2 emissions remains unexplored.
This research aims to contribute new insights into how green innovation can influence the environmental outcomes of urbanization and green growth in OECD countries. By examining these hypotheses, the study seeks to provide a more sophisticated view of how these variables interact and their combined effect on CO2 emissions, a topic that has not received enough attention in the literature.
By examining these hypotheses, the study seeks to contribute new insights into how green innovation can influence the environmental outcomes of urbanization and green growth in OECD countries. This method offers a more sophisticated view of how these variables interact and how their combined effect affects CO2 emissions, a topic that has not received enough attention in the literature.

3. Material and Methods

The main objective of this research is to assess the effect of green growth, green innovation, and urbanization on carbon dioxide emanations across 38 OECD economies from 1996 to 2022.

3.1. Theoretical Framework and Model Specification

Identifying IPATs is the predominant approach for studying the impacts of human activities on ecological systems. The IPAT model, which stands for impact = population × affluence × technology, was first introduced by Holdren and Ehrlich [52] during the early 1970s. Subsequently, it evolved into a significant forum for examining environmental issues. While IPAT is a reliable and economical approach that can quickly identify the main factors contributing to climate change, it does possess many constraints. The IPAT model fails to account for the non-proportional or non-monotonic influences of the primary environmental factors. In their seminal work, Dietz and Rosa [53] proposed the concept of STIRPAT, a framework that encompasses the examination of stochastic influences on population (P), affluence (A), and technology (T) using regression analysis.
STIRPAT is an enhanced IPAT identity that preserves the fundamental characteristics of the IPAT framework while mitigating its limitations. The STIRPAT model has recently seen an explosion of applications for investigating the factors that influence environmental quality. As an illustration, specific scholarly investigations have extended the STIRPAT model to encompass renewable energy. In contrast, others have directed their attention towards government efficacy, urbanization, and industrialization [54], trade openness [55], immigration and human capital [56], and nuclear energy [57], among other variables. The STIRPAT model has been extended to include green growth, green innovation, and urbanization, relying on the existing body of research. Furthermore, we have included several other variables, including renewable energy sources, energy consumption, and depletion of natural resources. This study, therefore, incorporates the STIRPAT model to analyze the impacts of these factors on environmental quality, whose transformed and logarithmic form is exhibited as follows. Equation (1):
ln I i t = α + ln P i t + ln A i t + ω ln T i t + τ
The proposed model, Equation (1), can quantify the environmental impacts of independent variables while maintaining the multiplicative structure of the standard IPAT framework and allowing for variable elasticities. Finally, following Yasin, Ahmad and Chaudhary [10], Shu, et al. [58], and Lin, Wang, Marinova, Zhao and Hong [54], the STIRPAT model can be extended as follows. Equation (2):
ln C E i t = α 0 + τ ln G r e G i t + π ln G r I i t + Ω ln U i t + ξ ln R E n C i t + β ln E n C i t + σ ln N r D i t + i t     Model 1
In this case, CE denotes carbon dioxide emanations, and the other variables are urbanization (U), natural resource depletion (NrD), renewable energy consumption (REnC), energy consumption (EnC), and error term (ε). The normality difficulties in the data were addressed by applying the natural logarithm to all variables [59].
We have used the interaction terms as shown in models 2 (Equation (3)) and 3 (Equation (4)) below to examine the moderating influence between (GrI*U) and (GrI*GreG):
ln C E i t = α 0 + τ ln G r e G i t + π ln G r I i t + Ω ln U i t + ξ ln R E n C i t + β ln E n C i t + σ ln N r D i t + ϻ ln G r I i t ln U i t + i t     Model 2
ln C E i t = α 0 + τ ln G r e G i t + π ln G r I i t + Ω ln U i t + ξ ln R e n C i t + β ln E n C i t + σ ln N r D i t + ¥ ln G r I i t ln G r e G i t + i t     Model 3

3.2. Data Description

To indicate environmental deterioration in this research, CO2 emanations have been employed. The following factors are considered independent variables: green growth, urbanization, green innovation, energy consumption, consumption of renewable energy, and depletion of natural resources. Green growth describes building a sustainable, equitable, and economically robust economy. Its stated goals are to increase economic activity, decrease emanations of greenhouse gases, protect natural resources, and improve social welfare [60]. In this research, environmentally adjusted multifactor productivity growth is used as a measure of green growth. Creating and using novel technology, procedures, and goods that benefit the environment is called “green innovation”. Indicators such as the amount of investment in clean technology, the number of patents filed for eco-friendly innovations, and the adoption of sustainable business practices by enterprises are typically used to determine the degree of green innovation [61]. This research estimates green innovation by calculating the proportion of environment-related technologies relative to all other technologies. The urban population measures urbanization. The measurement of renewable energy consumption is expressed as a percentage of the overall final energy consumption. Oil, gas, coal, hydropower, wind, and solar are all renewable and non-renewable sources that contribute to overall energy consumption [62]. The research uses kilograms of oil equivalent per capita as a measure of energy consumption measurement. The measurement of natural resource depletion encompasses the collective impact of mineral, energy, and net forest loss. The World Development Indicators provide data on carbon dioxide emanations, urbanization, energy consumption, renewable energy consumption, and the depletion of natural resources. The OECD provides data on green growth and green innovation. For the convenience of our readers, we have included all the variables in Table 1, along with descriptions and the anticipated signs of each.
Green growth curbs carbon dioxide emanations because green growth facilitates economic progress without burdening the Earth’s natural resources, a crucial need for maintaining a robust ecological system [21]. Jacobs [63] argue that we may achieve our economic development and environmental conservation objectives via green growth. Green innovation is crucial in tackling the economic-environmental challenge by enhancing operational capabilities and mitigating adverse environmental effects. Green innovation reduces pollution, promotes the use of renewable energy sources, and increases efficiency in the use of resources. Efficient energy utilization reduces CO2 emanations while improving financial growth and environmental quality via modern technologies [64,65]. Urbanization has a favorable influence since it increases fossil fuel use, which drives energy demand [66,67].
On the contrary, conventional understanding posits that the expansion of urbanization is often believed to exacerbate environmental contamination. Urbanization initially leads to enhanced productivity because of economies of scale. Agglomeration in urban areas leads to a reduction in total resource use. Growing urbanization reduces environmental deterioration [68,69]. According to Saqib, et al. [70], the expected negative sign of renewable energy consumption shows that investing in renewable energy improves environmental circumstances. Carbon emanations are positively affected by both energy usage and the depletion of natural resources. According to Khan, Khan and Muhammad [71], the decrease in environmental quality that increases primary energy use is the reason for the positive association between energy consumption and environmental deterioration. There is a positive correlation between natural resources and carbon emanations because the ways these resources are extracted are no longer sustainable, leading to more waste and higher carbon emanations. Carbon emanations might rise because of mining and deforestation, two forms of resource extraction. Furthermore, environmental degradation is caused by the excessive use of natural resources, such as coal, petroleum, and natural gas, to meet their energy demands [72,73].

3.3. Methodology

The methodology comprises many diagnostic tests, including cross-sectional dependency tests and unit root tests. Kao panel cointegration and Westerlund cointegration tests are used to examine long-term relationships. Furthermore, regression analysis is conducted using the Driscoll–Kraay and System GMM methods.

3.3.1. Cross-Sectional Dependence Tests

To ensure the integrity and dependability of the results, it is essential to precisely ascertain and address the cross-sectional dependence that often impacts panel data. This phenomenon occurs when there is a dearth of independence among the observations conducted within the same cross-sectional units, such as countries. Usually, this problem is caused by some familiar, unobserved characteristics that affect all units in diverse ways. To address this issue, we use the Breusch–Pagan Lagrange Multiplier [74] and Pesaran scaled LM [75] tests to assess the cross-sectional dependence among the variables under investigation.
The Breusch–Pagan LM test may be used even when the variances of the error components differ across different cross-sections since it is robust to heteroscedasticity [76]. However, even at a deficient level of spatial correlation, the Pesaran scaled LM test remains stable when there is little cross-sectional dependency. The Breusch–Pagan test is applicable even in cases where the error terms exhibit variation across different cross-sections or periods. Moreover, this technique can assess balanced and imbalanced panels [75].

3.3.2. Slope Heterogeneity Test

Panel heterogeneity pertains to systematic disparities or variances among individual entities or units in panel datasets. It shows how the units’ characteristics, actions, or connections vary over the cross-section. Unobserved individual-specific components or variables that impact the dependent variable give rise to heterogeneity. For this reason, we use the autocorrelation- and heteroscedasticity-resistant heterogeneity test in our current investigation. It is appropriate for cases when these assumptions may not be met since it does not presume homoscedasticity or that the error terms do not exhibit serial correlation. The test statistic converges to its actual value as the sample size rises, indicating consistency. The Blomquist–Westerlund test allows for more credible inferences in panel data analysis by considering cross-sectional dependency and individual-specific effects. By limiting panel heterogeneity, this problem assists statistical analysis in capturing the underlying correlations [77].

3.3.3. Panel Unit Root Analysis

Academics use panel unit root tests to ascertain the stationarity of variables within a panel data collection. They check for the presence of a unit root in the relevant variables. A unit root indicates non-stationarity, which causes a stochastic trend to emerge and eventually settle to a stable mean. The current study checks the unit root using Pesaran’s [78] cross-sectional augmented IPS (CIPS) test. To account for cross-sectional data, the CIPS test adds new variables to the IPS test statistic to reflect the cross-sectional dependence. Compared to the IPS test developed by Im, et al. [79], which produced skewed findings due to its failure to account for cross-sectional dependency explicitly, this one is better.

3.3.4. Panel Cointegration

Panel cointegration tests may determine whether the variables of interest have a long-run connection once stationarity properties have been established and the null hypothesis of the unit root has been rejected. The Kao cointegration tests build upon the Engle-Granger framework by testing for panel cointegration.
The first stage regressors for the Kao test specify the cross-sectional intercepts and homogenous coefficients. The bivariate case study in Kao is as follows, Equations (5)–(7):
y i t = a 1 + β 1 i X 1 , t + ε i t
y i t = y 1 , t 1 + μ i , t
X i t = X 1 , t 1 + ε i , t
whereas t = 1., T; i = 1., N. According to Balsalobre-Lorente et al. [80], the first regression analysis assumes that the variable a 1 is heterogeneous, the variable βi is homogeneous across cross-sections, and all trend coefficients ρi are set to zero.
The cointegration test proposed by Westerlund and Edgerton [81] incorporates the consideration of cross-sectional dependency, as highlighted by Ali, Dogan, Chen and Khan [82]. This test encompasses four statistical measures: two-group statistics (Gt and Ga) and two-panel statistics (Pt and Pa). Under the null hypothesis of no cointegrating connection, this approach computes four error-correction-based panel non-cointegration test statistics and accurately predicts the cointegrating characteristics in a cross-sectionally dependent homogeneous panel dataset [83].
The following is the test equation for each of the four statistics:
G t = N 1 i 1 N a i S E ( a i )
G a = N 1 i 1 N T a i a i ( 1 )
P t = a S E   ( a )
P a = T a

3.3.5. Driscoll–Kraay Standard Error

The next stage is to ascertain the long-run connection after the fundamental studies of the panel data under investigation. The Driscoll–Kraay standard errors test was therefore used in this investigation. They are the ones who first created the Driscoll–Kraay standard errors test. This estimator yields a robust and favorable outcome regardless of missing values, heteroscedasticity, autocorrelations, cross-sectional dependency, balanced or unbalanced panel data, or any other combination of these factors [84,85,86].

3.3.6. System Generalized Methods of Moment (SGMM)

When dealing with endogenous issues, GMM models are a popular dynamic approach. System GMM and differential GMM are the two most common GMM models. System GMM may improve measurement efficiency compared to the differential GMM model because it addresses the difference and level equations as a system.
Consequently, the system GMM model was used to examine the impact of the dependent variable on the independent or explanatory factors. To be more precise, the model is described by the following:
Y i t = α 0 + α 1 Y i t 1 + β o e x p i t + δ C i t + ε i t
whereas Y i t stands for the explained variable and Y i t 1 for the first-order lag of the explained variables; C i t stands for the control variables; and e x p i t for the explanatory variables in this research. The variable α 1 denotes the individual fixed effects, whereas ε i t represents the random disturbance term. The stepwise application of tests and methods used in the study is exhibited in Table A1 in Appendix A.

4. Empirical Results

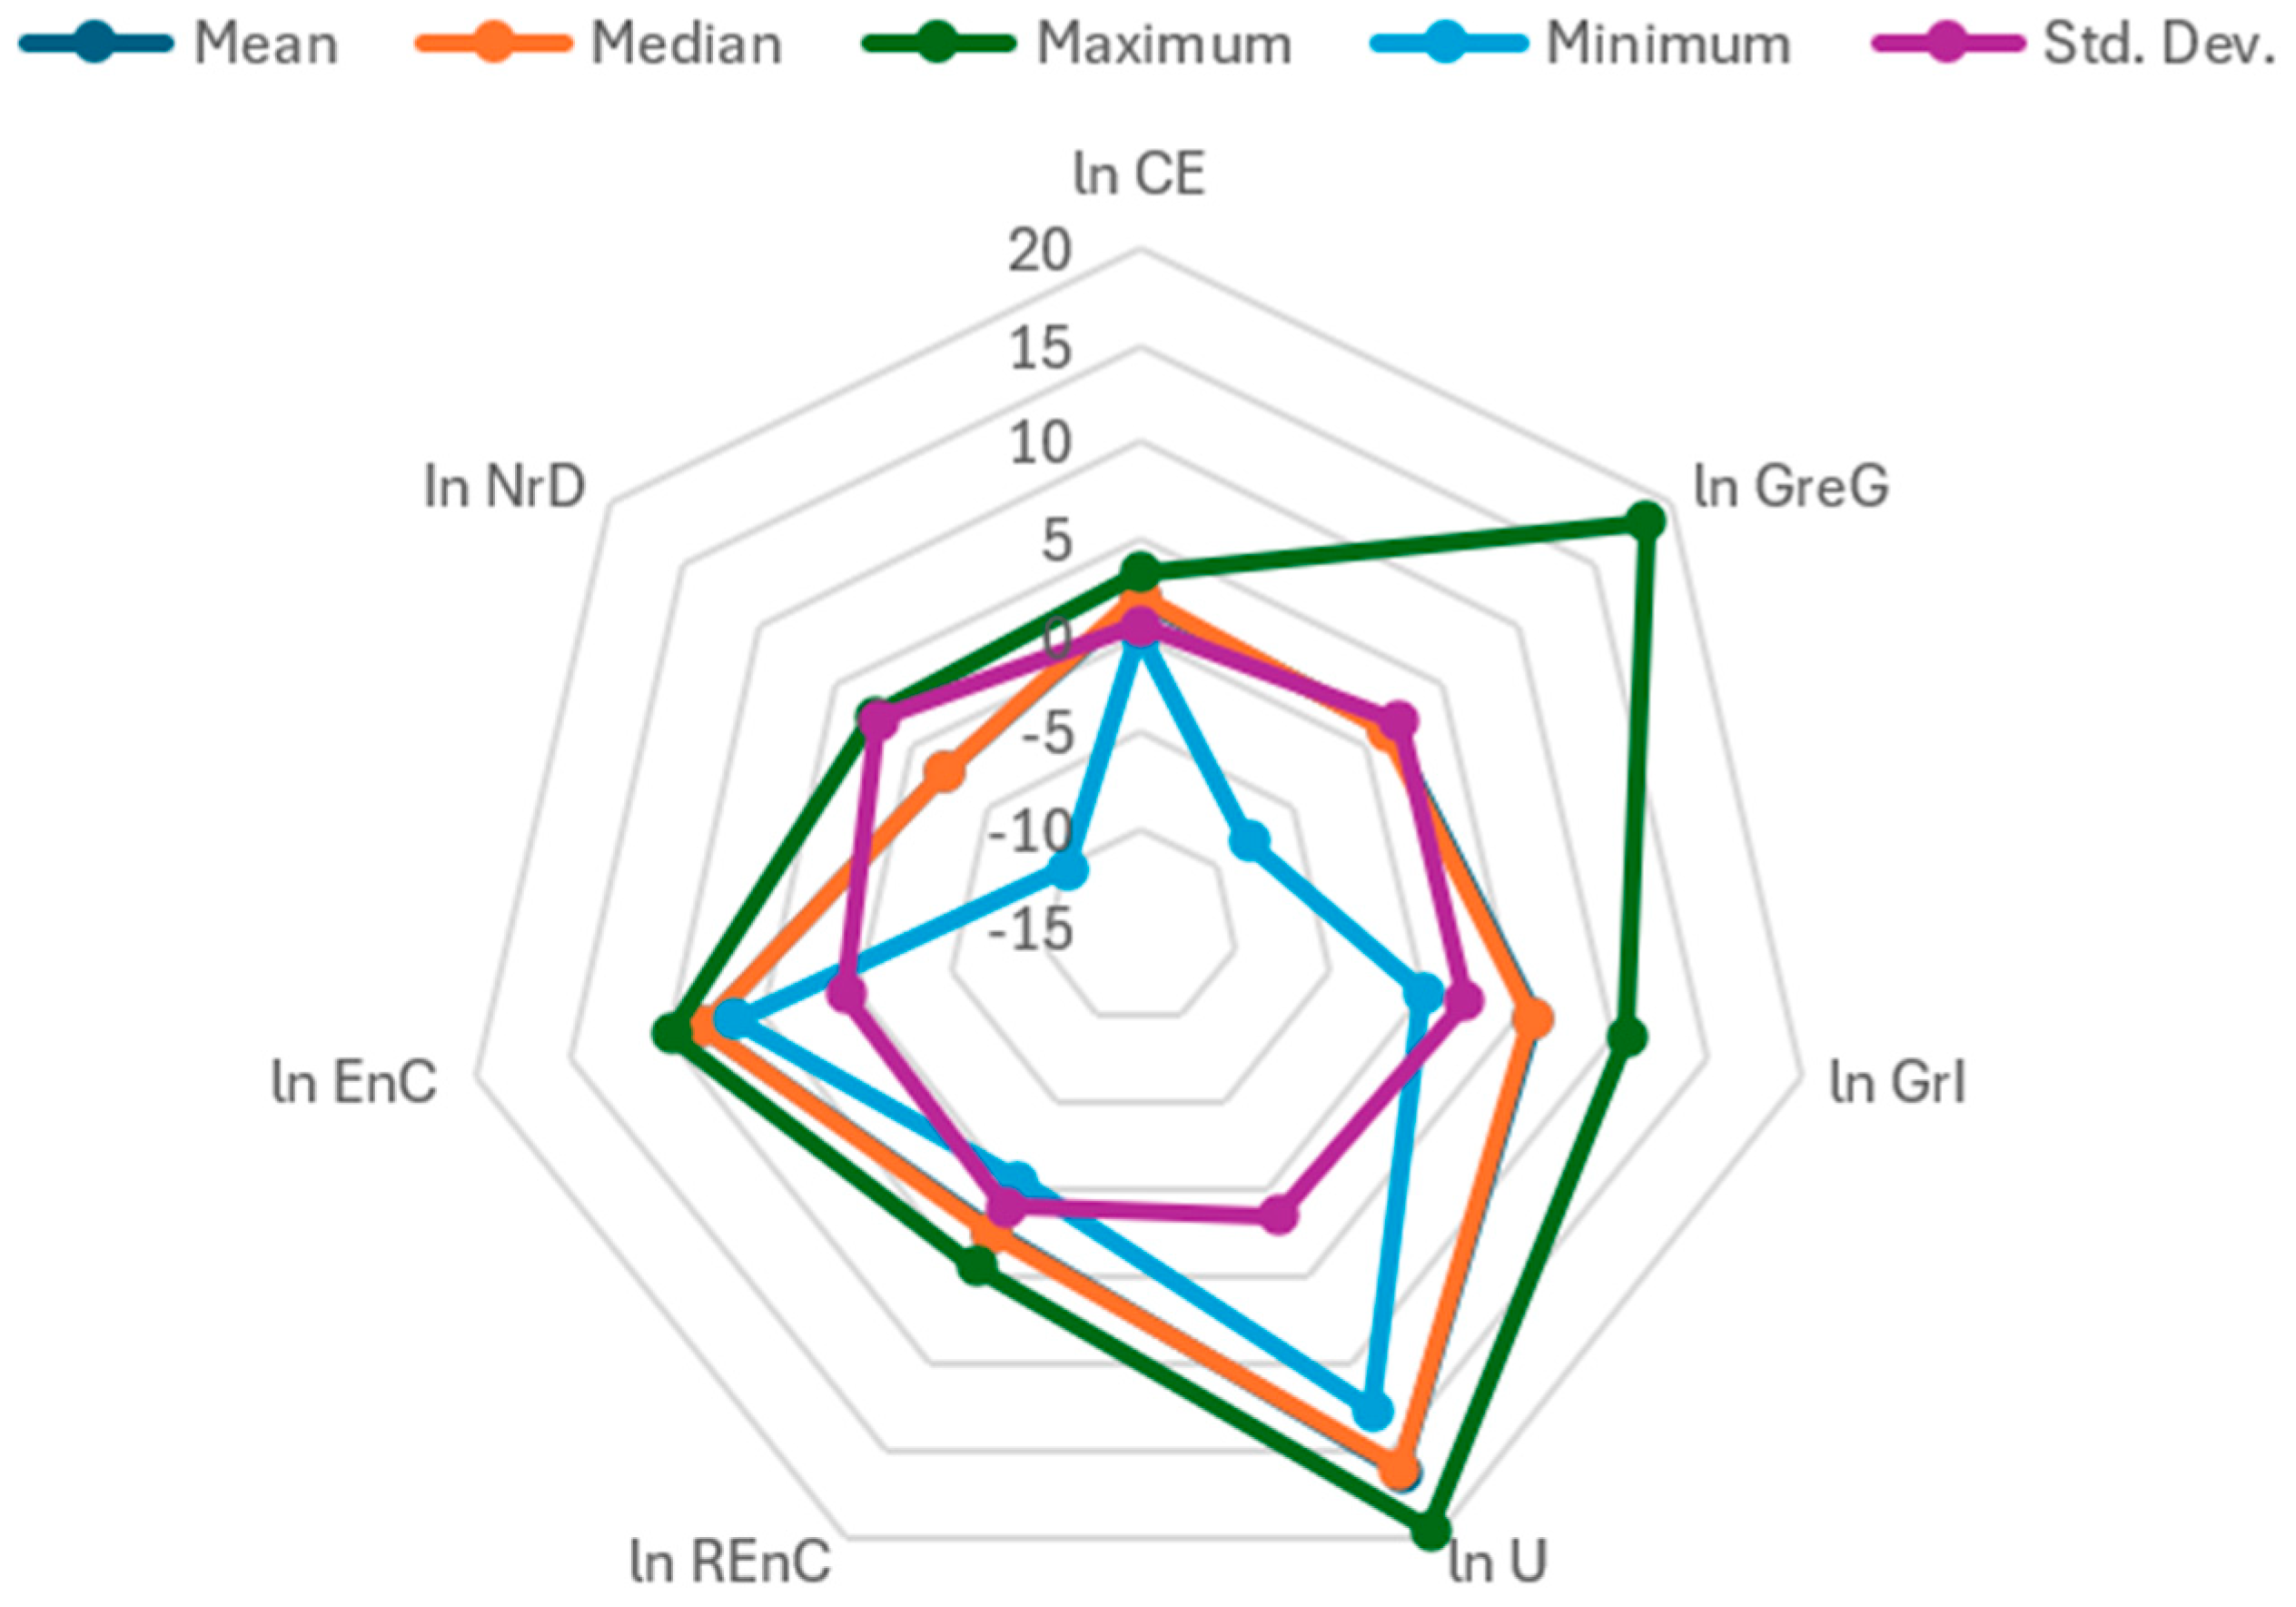
This research sought to investigate the long-term impacts of urbanization, green innovation, and green growth on OECD member nations’ carbon dioxide (CO2) emanations. Descriptive statistics are shown in Figure 1.
Table 2 displays the findings of and for the cross-sectional dependency among the relevant variables. Both tests reject the absence of cross-sectional dependency among the variables. These findings confirm the existence of cross-sectional dependency within the model. The existence of cross-sectional dependency is confirmed by the findings in Table 2; thus, it is vital to examine the variables of interest for heterogeneity and unit-root features.
The unit root findings of the CIPS test conducted by Im, Pesaran and Shin [79] are shown in Table 3. According to the findings, all other variables remain non-stationary at level, but the GreG and EnC become stationary at that point. Conversely, the dependent variable (CE) and all the other explanatory variables are stationary at the first difference. These variables demonstrate first-order or I (1) integration, as shown by this evidence.
The findings of the heterogeneity test are shown in Table 4. The findings indicate heterogeneity in the model and reject the null hypothesis of homogeneity. This demonstrates the intricate and dynamic character of the phenomenon studied and guarantees a broad range of the 38 OECD nations.
Table 5 displays the findings of the cointegration tests conducted by Kao [87] and Westerlund and Edgerton [81] tests, which provide significant evidence against the null hypothesis of no integration. Based on the findings of the cointegration tests, it can be deduced that the variables lnCE, lnGreG, lnGrI, lnU, lnREnC, lnEnC, and lnNrD demonstrate a long-term association.
Table 6 illustrates the results of the tests conducted using the Driscoll–Kraay standard error estimator and System GMM (to ensure the findings are robust). Both types of tests give comparable results.
In all models of both approaches, the GreG exhibits a substantial negative connection with CE at a significance level of 1%; however, in Model 1 of the DKra test, the link is insignificant. The research conducted by Jouvet and de Perthuis [21] confirms the findings. Secondly, at the 1% significance level, the long-term association between GrI and CE is also negative and noteworthy. The recent studies align with these findings. Moreover, a notable positive correlation exists between urbanization, U, and carbon emanations, CE, consistent with that of Yasin, Ahmad and Chaudhary [10] and Pata [88].
Finally, REnC has a negative impact on the CE in OECD nations. Consistent with our findings, Saqib, Ozturk, Usman, Sharif and Razzaq [70] also found a negative correlation between REnC and CE in their research. They claim that the goal of variable renewable energy consumption is to lessen the degradation of the environment and advance sustainable development. Therefore, environmental conditions are improved when resources are allocated to renewable energy. In contrast, CE is positively correlated with EnC and NrD in all three models of both methods. The findings align with the research conducted by Ahmed, Asghar, Malik and Nawaz [73] and Byaro, et al [89].
According to the results of the interaction term GrI*U in the second model for both SGMM and DKra, green innovation helps lessen the harmful effects of urbanization. A negative coefficient between green growth and innovation in the interaction term indicates a synergistic impact in curbing carbon emanations. The results indicate that when green growth strategies are combined with green innovation activities, the resulting cut in carbon emanations is amplified beyond the combined effects of each strategy alone [90,91].

5. Discussion

The study has shown that green growth has beneficial effects on the environment, i.e., it helps mitigate carbon emissions (CE). To ensure a sustainable future for all living things, “green growth” has emerged as a means to expand economies without depleting their natural resources. Jacobs [63] posits that the implementation of green growth has the potential to effectively address both economic development objectives and environmental conservation goals concurrently. According to Reilly [92], the primary objectives of green growth often include economic development, job creation, and mitigation of environmental damage. Green growth is paramount as it promotes the simultaneous advancement of ecological sustainability and economic prosperity. Green growth has the potential to bring about significant social and economic advantages; it is also generally believed to be economically sound and essential to the stability of both developed and developing countries.
The research findings demonstrate that green innovation is effective in mitigating environmental pressures. The fundamental reason for this is that GrI is essential for solving the economic-environmental problem since it boosts operational capacities while reducing environmental consequences. GrI reduces pollution, promotes the use of renewable energy sources, and increases efficiency in the utilization of resources. Efficient energy utilization enhances financial growth, reduces CO2 emanations, and minimizes energy consumption using innovative technologies [64,65]. Promoting green economic growth and green financing strategies; enhancing environmental quality in OECD economies; facilitating and transferring technology to green investment and trade; concentrating on research and development, information and communication technology, biotechnology, and nanotechnology; and implementing policies that support green innovation in international marketplaces are all steps toward a more sustainable society. Nonetheless, OECD economies must prioritize technological innovation to decrease emanations and environmental degradation.
Our findings confirm the hypothesis that urbanization has a damaging environmental impact. This result aligns with the prevailing understanding that rapid urbanization often leads to increased energy consumption, particularly from fossil fuels, to support the growing population and economic activities within urban centers [88]. Industrialization, transportation, and building construction, key components of urbanization, contribute significantly to CO2 emissions [93]. These findings underscore the urgent need for sustainable urban planning and development strategies to mitigate the environmental impacts of rapid urbanization.
The rise in primary energy use has resulted in a deterioration of environmental conditions. There is an increase in carbon emanation due to the increased waste produced using unsustainable extraction techniques and natural resource exploitation. Energy use substantially influences CO2 emissions, as shown by several studies [94,95]. Studies suggest that using renewable energy leads to a decrease in CO2 emissions while using non-renewable energy sources increases emissions.
The research reveals that higher levels of natural resource depletion are positively associated with environmental degradation. Natural resource exploitation includes activities such as mining and deforestation, which may lead to an increase in carbon emanations [89]. Natural resource depletion, which includes declining minerals, energy sources, and forest areas, worsens CO2 emissions via many interrelated pathways. The mining and burning of fossil fuels and materials releases substantial amounts of carbon dioxide into the air. Additionally, the absorption of CO2 by the planet is further exacerbated by the reduction in forest areas, which function as critical carbon sinks. In addition, meeting energy demands through the excessive use of natural resources such as coal, petroleum, and natural gas leads to environmental damage.
The negative coefficient of the interaction term between green innovation and urbanization indicates that environmentally friendly inventions and practices may successfully mitigate the typical rise in CO2 emissions from urbanization, even when cities experience growth [91,96]. The finding aligns with our hypothesis that green innovation promotes solutions for sustainable development in urban settings. The findings emphasize the crucial importance of green innovation in advancing sustainable urban development. Increases in carbon emissions are a typical result of rising energy consumption and resource demands brought on by rapidly growing metropolitan areas. Incorporating sustainable practices and green technologies into urban planning and development can alleviate these environmental factors.
A negative interaction term implies that these techniques are most effective when applied together. This outcome supports the idea that making significant cuts in carbon emanations necessitates an integrated approach that addresses both environment-friendly green economic growth and sustainable technological innovations. A negative coefficient in the interaction term between green innovation and green growth supports the second hypothesis of the study and suggests that the combined implementation of both strategies results in a more substantial decrease in carbon emissions compared to the separate impacts of each approach. To maximize environmental benefits, this synergistic impact emphasizes how crucial it is to include green innovation in green development programs [97]. Innovative technology and sustainable practices may increase the effectiveness of green growth programs in lowering CO2 emissions. These projects seek to separate economic development from environmental deterioration.

5.1. Theoretical and Practical Implications

This study contributes to the theoretical understanding of green innovation, green growth and urbanization by demonstrating their effects on carbon emissions. The negative interaction term between green innovation and urbanization supports the theory that integrating sustainable technologies with urban development can mitigate environmental impact. The negative coefficient of the interaction term between green innovation and green growth indicates a synergistic effect where the combined implementation of both strategies results in a more substantial reduction in carbon emissions compared to their individual effects. This finding challenges the existing theories that often treat green innovation and green growth as separate entities and underscores the importance of their integration.
Moreover, this research highlights the novelty of addressing urbanization’s environmental impact through green innovation, a relatively underexplored area in the literature. The study’s insights into the synergistic effects of green innovation and green growth provide a new perspective on enhancing the effectiveness of environmental policies. This theoretical extension suggests that green innovation is not only complementary to green growth but is essential for maximizing environmental benefits.
Furthermore, the findings suggest that policymakers should prioritize green innovation in urban planning to effectively mitigate carbon emissions. Practical applications include implementing policies that encourage the adoption of renewable energy sources, increasing investments in green technologies, and integrating sustainability criteria into urban development projects. By emphasizing the importance of integrating green innovation with urban development and green growth, this study offers a comprehensive framework for addressing environmental challenges, contributing novel insights and extending existing theories in the field.

5.2. Limitations and Future Directions

This study is limited by the availability of data and the scope of the analysis. Additionally, the cross-sectional nature of the data may not fully capture the dynamic interactions between green innovation, urbanization, and environmental quality over time. Future research could benefit from more comprehensive datasets and alternative methodological approaches to validate and expand these findings. Future research should explore the long-term effects of green innovation on urban sustainability and examine additional factors that may influence the relationship between urbanization and environmental quality. Further studies could also investigate the impact of specific green technologies on different urban settings and address potential data limitations by incorporating time series analyses or case studies.

6. Conclusions and Policy Implications

This research aimed to examine the interconnected relationship between urbanization, green growth, green innovation, and CO2 emissions in OECD countries. The research used panel data analysis from 1996 to 2022 and rigorous econometric methodologies to uncover key findings.
The findings demonstrate that the implementation of green growth and green innovation is essential in reducing CO2 emissions. Green innovation moderates the link between urbanization and its detrimental environmental effects. Furthermore, using renewable energy sources contributes to reducing carbon emissions, but the utilization of energy and the depletion of natural resources is what worsens the problem.
The results emphasize the significance of implementing environmentally friendly regulations and encouraging innovative practices that prioritize sustainability in OECD nations. Green technology regulations, sustainable city design, and renewable energy infrastructure should be top priorities for governments.
This research enhances the current body of knowledge by presenting empirical evidence of the complex relationship between urbanization, green growth, green innovation, and CO2 emissions in OECD countries. Nevertheless, additional research is necessary to investigate the precise effects of various green technologies on various industries and to evaluate the long-term trends in environmental sustainability and urbanization. Furthermore, comparative studies of OECD and non-OECD nations may provide helpful insights into global environmental concerns and workable solutions.
Policymakers may adopt effective policies to prevent climate change and promote sustainable development by comprehending the elements influencing CO2 emissions in industrialized economies.

Author Contributions

Conceptualization, G.C. and I.Y.; methodology, G.C.; software, I.Y.; validation, G.C., I.Y. and S.M.M.A.N.; formal analysis, I.Y.; investigation, G.C.; writing—original draft preparation, S.M.M.A.N.; writing—review and editing, I.Y.; visualization, G.C. All authors have read and agreed to the published version of the manuscript.

Funding

This research received no external funding.

Institutional Review Board Statement

Not applicable.

Informed Consent Statement

Not applicable.

Data Availability Statement

The data presented in this study are available at https://www.oecd.org/en/data.html and https://databank.worldbank.org/, accessed on 29 April 2024.

Conflicts of Interest

The authors declare no conflict of interest.

Abbreviations

ARDL Autoregressive Distributed Lag
CE Carbon Dioxide Emissions
CIPS Cross-sectionally augmented Im-Pesaran-Shin
CO2 Carbon Dioxide
DKra Driscoll and Kraay
EDGAR Emissions Database for Global Atmospheric Research
EnC Energy Consumption
GreG Green Growth
GrI Green Innovation
IPAT Environmental Impact (I), Population (P), Affluence (A), and Technology (T)
MENA Middle East and North Africa
NrD Natural Resource Depletion
OECD Organization for Economic Co-operation and Development
REnC Renewable Energy Consumption
U Urbanization
SGMM System Generalized Method of Moments
STIRPAT Stochastic Impacts by Regression on Population, Affluence and Technology

Appendix A

Table A1. Stepwise application of tests and methods used in the study.
StepTest/MethodPurpose
1Breusch–Pagan LM and Pesaran scaled LM testsAssess cross-sectional dependence among variables
2Blomquist and Westerlund heterogeneity testAccount for panel heterogeneity and improve inference credibility
3Pesaran’s CIPS testCheck for stationarity and presence of unit roots
4Kao and Westerlund cointegration testsDetermine long-run relationships among variables
5Driscoll–Kraay standard errors testProvide robust regression results addressing various panel data issues
6System GMM modelAddress endogeneity issues and improve measurement efficiency

References

  1. He, B.; Jie, W.; He, H.; Alsubih, M.; Arnone, G.; Makhmudov, S. From resources to resilience: How green innovation, fintech and natural resources shape sustainability in OECD countries. Resour. Policy 2024, 91, 104856. [Google Scholar] [CrossRef]
  2. Zhang, J.; Yasin, I. Greening the BRICS: How Green Innovation Mitigates Ecological Footprints in Energy-Hungry Economies. Sustainability 2024, 16, 3980. [Google Scholar] [CrossRef]
  3. Hashmi, N.I.; Alam, N.; Jahanger, A.; Yasin, I.; Murshed, M.; Khudoykulov, K. Can financial globalization and good governance help turning emerging economies carbon neutral? Evidence from members of the BRICS-T. Environ. Sci. Pollut. Res. 2023, 30, 39826–39841. [Google Scholar] [CrossRef]
  4. Abbasi, K.R.; Zhang, Q.; Ozturk, I.; Alvarado, R.; Musa, M. Energy Transition, fossil Fuels, and green Innovations: Paving the way to achieving sustainable development Goals in the United States. Gondwana Res. 2024, 130, 326–341. [Google Scholar] [CrossRef]
  5. Qing, L.; Usman, M.; Radulescu, M.; Haseeb, M. Towards the vision of going green in South Asian region: The role of technological innovations, renewable energy and natural resources in ecological footprint during globalization mode. Resour. Policy 2024, 88, 104506. [Google Scholar] [CrossRef]
  6. Yasin, I.; Ahmad, N.; Amin, S.; Sattar, N.; Hashmat, A. Does agriculture, forests, and energy consumption foster the carbon emissions and ecological footprint? fresh evidence from BRICS economies. Environ. Dev. Sustain. 2024, 1–21. [Google Scholar] [CrossRef]
  7. Ali, Z.; Jianzhou, Y.; Ali, A.; Hussain, J. Determinants of the CO2 emissions, economic growth, and ecological footprint in Pakistan: Asymmetric and symmetric role of agricultural and financial inclusion. Environ. Sci. Pollut. Res. 2023, 30, 61945–61964. [Google Scholar] [CrossRef] [PubMed]
  8. Yasin, I.; Ahmad, N.; Chaudhary, M.A. Catechizing the Environmental-Impression of Urbanization, Financial Development, and Political Institutions: A Circumstance of Ecological Footprints in 110 Developed and Less-Developed Countries. Soc. Indic. Res. 2020, 147, 621–649. [Google Scholar] [CrossRef]
  9. Ahmad, M.; Jiang, P.; Murshed, M.; Shehzad, K.; Akram, R.; Cui, L.; Khan, Z. Modelling the dynamic linkages between eco-innovation, urbanization, economic growth and ecological footprints for G7 countries: Does financial globalization matter? Sustain. Cities Soc. 2021, 70, 102881. [Google Scholar] [CrossRef]
  10. Yasin, I.; Ahmad, N.; Chaudhary, M.A. The impact of financial development, political institutions, and urbanization on environmental degradation: Evidence from 59 less-developed economies. Environ. Dev. Sustain. 2021, 23, 6698–6721. [Google Scholar] [CrossRef]
  11. Xu, X.; Zeng, L.; Li, S.; Liu, Y.; Zhang, T. Dynamic nonlinear CO2 emission effects of urbanization routes in the eight most populous countries. PLoS ONE 2024, 19, e0296997. [Google Scholar] [CrossRef] [PubMed]
  12. Dong, F.; Wang, Y.; Su, B.; Hua, Y.; Zhang, Y. The process of peak CO2 emissions in developed economies: A perspective of industrialization and urbanization. Resour. Conserv. Recycl. 2019, 141, 61–75. [Google Scholar] [CrossRef]
  13. Poumanyvong, P.; Kaneko, S. Does urbanization lead to less energy use and lower CO2 emissions? A cross-country analysis. Ecol. Econ. 2010, 70, 434–444. [Google Scholar] [CrossRef]
  14. Han, X.; He, X.; Xiong, W.; Shi, W. Effects of urbanization on CO2 emissions, water use and the carbon-water coupling in a typical dual-core urban agglomeration in China. Urban Clim. 2023, 49, 101572. [Google Scholar] [CrossRef]
  15. Yasin, I.; Aslam, A.; Siddik, A.B.; Abbass, K.; Murshed, M. Offshoring the scarring causes and effects of environmental challenges faced by the advanced world: An empirical evidence. Environ. Sci. Pollut. Res. 2023, 30, 79335–79345. [Google Scholar] [CrossRef] [PubMed]
  16. Razzaq, A.; Sharif, A.; Ozturk, I.; Afshan, S. Dynamic and threshold effects of energy transition and environmental governance on green growth in COP26 framework. Renew. Sustain. Energy Rev. 2023, 179, 113296. [Google Scholar] [CrossRef]
  17. Wang, X.; Xu, Z.; Qin, Y.; Skare, M. Innovation, the knowledge economy, and green growth: Is knowledge-intensive growth really environmentally friendly? Energy Econ. 2022, 115, 106331. [Google Scholar]
  18. Lee, H.-H. Towards green growth in Asia and the Pacific. In Proceedings of the An Issue Paper for a Round Table “Prosperity for Asia’s Billions: Green Growth and Poverty Reduction” at the 14-Th General Conference of UNIDO, 2011; Available online: http://cc.kangwon.ac.kr/~hhlee/paper/UNIDO_hhlee_111201_final.pdf (accessed on 1 May 2024).
  19. Bank, W. Inclusive Green Growth: The Pathway to Sustainable Development; The World Bank. 2012. Available online: https://books.google.com/books?hl=en&lr=&id=_-dLBmoHFP0C&oi=fnd&pg=PR5&dq=Inclusive+Green+Growth:+The+Pathway+to+Sustainable+Development&ots=IAc7o1Y5ra&sig=5-9ZwnlAK8gj6_yoj7-kK48QfPA (accessed on 1 May 2024).
  20. OECD. Putting Green Growth at the Heart of Development; OECD Publishing. 2013. Available online: https://www.oecd.org/en/publications/putting-green-growth-at-the-heart-of-development_9789264181144-en.html (accessed on 2 May 2024).
  21. Jouvet, P.-A.; de Perthuis, C. Green growth: From intention to implementation. Int. Econ. 2013, 134, 29–55. [Google Scholar] [CrossRef]
  22. Chen, X.; Wu, Y. Cultivating green growth: The interplay of communication and resource efficiency in East Asia. Resour. Policy 2024, 90, 104776. [Google Scholar]
  23. Bhowmik, R.; Rahut, D.B.; Syed, Q.R. Investigating the impact of climate change mitigation technology on the transport sector CO2 Emissions: Evidence from panel quantile regression. Front. Environ. Sci. 2022, 10, 916356. [Google Scholar] [CrossRef]
  24. Xin, D.; Ahmad, M.; Khattak, S.I. Impact of innovation in climate change mitigation technologies related to chemical industry on carbon dioxide emissions in the United States. J. Clean. Prod. 2022, 379, 134746. [Google Scholar] [CrossRef]
  25. Chan, P. Cambodian Green Economy Transition: Background, Progress, and SWOT Analysis. World 2024, 5, 413–452. [Google Scholar] [CrossRef]
  26. Saqib, N.; Usman, M.; Ozturk, I.; Sharif, A. Harnessing the synergistic impacts of environmental innovations, financial development, green growth, and ecological footprint through the lens of SDGs policies for countries exhibiting high ecological footprints. Energy Policy 2024, 184, 113863. [Google Scholar] [CrossRef]
  27. Ahmad, M.; Zheng, J. Do innovation in environmental-related technologies cyclically and asymmetrically affect environmental sustainability in BRICS nations? Technol. Soc. 2021, 67, 101746. [Google Scholar] [CrossRef]
  28. You, C.; Khattak, S.I.; Ahmad, M. Impact of innovation in renewable energy generation, transmission, or distribution-related technologies on carbon dioxide emission in the USA. Environ. Sci. Pollut. Res. 2022, 29, 29756–29777. [Google Scholar] [CrossRef] [PubMed]
  29. Solarin, S.A.; Bello, M.O. Energy innovations and environmental sustainability in the US: The roles of immigration and economic expansion using a maximum likelihood method. Sci. Total Environ. 2020, 712, 135594. [Google Scholar] [CrossRef]
  30. Sadiq, M.; Chau, K.Y.; Ha, N.T.T.; Phan, T.T.H.; Ngo, T.Q.; Huy, P.Q. The impact of green finance, eco-innovation, renewable energy and carbon taxes on CO2 emissions in BRICS countries: Evidence from CS ARDL estimation. Geosci. Front. 2024, 15, 101689. [Google Scholar] [CrossRef]
  31. Huang, J. Resources, innovation, globalization, and green growth: The BRICS financial development strategy. Geosci. Front. 2024, 15, 101741. [Google Scholar] [CrossRef]
  32. Sharma, S.S. Determinants of carbon dioxide emissions: Empirical evidence from 69 countries. Appl. Energy 2011, 88, 376–382. [Google Scholar] [CrossRef]
  33. Martínez-Zarzoso, I.; Maruotti, A. The impact of urbanization on CO2 emissions: Evidence from developing countries. Ecol. Econ. 2011, 70, 1344–1353. [Google Scholar] [CrossRef]
  34. Hanif, I. Energy consumption habits and human health nexus in Sub-Saharan Africa. Environ. Sci. Pollut. Res. 2018, 25, 21701–21712. [Google Scholar] [CrossRef] [PubMed]
  35. Poumanyvong, P.; Kaneko, S.; Dhakal, S. Impacts of Urbanization on National Residential Energy Use and CO2 Emissions: Evidence from Low-, Middle-and High-Income Countries; Hiroshima University, Graduate School for International Development and Cooperation (IDEC), 2012; Available online: https://ideas.repec.org/p/hir/idecdp/2-5.html (accessed on 1 May 2024).
  36. Azam, A.; Rafiq, M.; Shafique, M.; Ateeq, M.; Yuan, J. Causality relationship between electricity supply and economic growth: Evidence from Pakistan. Energies 2020, 13, 837. [Google Scholar] [CrossRef]
  37. Saadaoui, H. The impact of financial development on renewable energy development in the MENA region: The role of institutional and political factors. Environ. Sci. Pollut. Res. 2022, 29, 39461–39472. [Google Scholar] [CrossRef] [PubMed]
  38. Abou Houran, M.; Mehmood, U. How institutional quality and renewable energy interact with ecological footprints: Do the human capital and economic complexity matter in the Next Eleven nations? Environ. Sci. Pollut. Res. 2023, 1–13. [Google Scholar] [CrossRef] [PubMed]
  39. Das, N.; Murshed, M.; Rej, S.; Bandyopadhyay, A.; Hossain, M.E.; Mahmood, H.; Dagar, V.; Bera, P. Can clean energy adoption and international trade contribute to the achievement of India’s 2070 carbon neutrality agenda? Evidence using quantile ARDL measures. Int. J. Sustain. Dev. World Ecol. 2023, 30, 262–277. [Google Scholar] [CrossRef]
  40. Sheraz, M.; Deyi, X.; Sinha, A.; Mumtaz, M.Z.; Fatima, N. The dynamic nexus among financial development, renewable energy and carbon emissions: Moderating roles of globalization and institutional quality across BRI countries. J. Clean. Prod. 2022, 343, 130995. [Google Scholar] [CrossRef]
  41. Omri, A. CO2 emissions, energy consumption and economic growth nexus in MENA countries: Evidence from simultaneous equations models. Energy Econ. 2013, 40, 657–664. [Google Scholar] [CrossRef]
  42. Soytas, U.; Sari, R. Energy consumption, economic growth, and carbon emissions: Challenges faced by an EU candidate member. Ecol. Econ. 2009, 68, 1667–1675. [Google Scholar] [CrossRef]
  43. Arouri, M.E.H.; Youssef, A.B.; M’henni, H.; Rault, C. Energy consumption, economic growth and CO2 emissions in Middle East and North African countries. Energy Policy 2012, 45, 342–349. [Google Scholar] [CrossRef]
  44. Hilaire, J.; Minx, J.C.; Callaghan, M.W.; Edmonds, J.; Luderer, G.; Nemet, G.F.; Rogelj, J.; del Mar Zamora, M. Negative emissions and international climate goals—Learning from and about mitigation scenarios. Clim. Chang. 2019, 157, 189–219. [Google Scholar] [CrossRef]
  45. Sun, G.; Yuan, C.; Hafeez, M.; Raza, S.; Jie, L.; Liu, X. Does regional energy consumption disparities assist to control environmental degradation in OBOR: An entropy approach. Environ. Sci. Pollut. Res. 2020, 27, 7105–7119. [Google Scholar] [CrossRef] [PubMed]
  46. Bekun, F.V.; Alola, A.A.; Sarkodie, S.A. Toward a sustainable environment: Nexus between CO2 emissions, resource rent, renewable and nonrenewable energy in 16-EU countries. Sci. Total Environ. 2019, 657, 1023–1029. [Google Scholar] [CrossRef] [PubMed]
  47. Adebayo, T.S.; Rjoub, H.; Akinsola, G.D.; Oladipupo, S.D. The asymmetric effects of renewable energy consumption and trade openness on carbon emissions in Sweden: New evidence from quantile-on-quantile regression approach. Environ. Sci. Pollut. Res. 2022, 29, 1875–1886. [Google Scholar] [CrossRef] [PubMed]
  48. Kwakwa, P.A.; Alhassan, H.; Adu, G. Effect of natural resources extraction on energy consumption and carbon dioxide emission in Ghana. Int. J. Energy Sect. Manag. 2020, 14, 20–39. [Google Scholar] [CrossRef]
  49. Joshua, U.; Bekun, F.V. The path to achieving environmental sustainability in South Africa: The role of coal consumption, economic expansion, pollutant emission, and total natural resources rent. Environ. Sci. Pollut. Res. 2020, 27, 9435–9443. [Google Scholar] [CrossRef] [PubMed]
  50. Grossman, G.M.; Krueger, A.B. Environmental Impacts of a North American Free Trade Agreement; National Bureau of Economic Research. 1991. Available online: https://www.nber.org/papers/w3914 (accessed on 1 May 2024).
  51. Franceschinis, C.; Thiene, M.; Scarpa, R.; Rose, J.; Moretto, M.; Cavalli, R. Adoption of renewable heating systems: An empirical test of the diffusion of innovation theory. Energy 2017, 125, 313–326. [Google Scholar] [CrossRef]
  52. Holdren, J.P.; Ehrlich, P.R. Human Population and the Global Environment: Population growth, rising per capita material consumption, and disruptive technologies have made civilization a global ecological force. Am. Sci. 1974, 62, 282–292. [Google Scholar] [PubMed]
  53. Dietz, T.; Rosa, E.A. Effects of population and affluence on CO2 emissions. Proc. Natl. Acad. Sci. USA 1997, 94, 175–179. [Google Scholar] [CrossRef] [PubMed]
  54. Lin, S.; Wang, S.; Marinova, D.; Zhao, D.; Hong, J. Impacts of urbanization and real economic development on CO2 emissions in non-high income countries: Empirical research based on the extended STIRPAT model. J. Clean. Prod. 2017, 166, 952–966. [Google Scholar] [CrossRef]
  55. Yang, L.; Xia, H.; Zhang, X.; Yuan, S. What matters for carbon emissions in regional sectors? A China study of extended STIRPAT model. J. Clean. Prod. 2018, 180, 595–602. [Google Scholar] [CrossRef]
  56. Dedeoğlu, B.B.; Boğan, E. The motivations of visiting upscale restaurants during the COVID-19 pandemic: The role of risk perception and trust in government. Int. J. Hosp. Manag. 2021, 95, 102905. [Google Scholar] [CrossRef]
  57. Usman, A.; Ozturk, I.; Naqvi, S.M.M.A.; Ullah, S.; Javed, M.I. Revealing the nexus between nuclear energy and ecological footprint in STIRPAT model of advanced economies: Fresh evidence from novel CS-ARDL model. Prog. Nucl. Energy 2022, 148, 104220. [Google Scholar] [CrossRef]
  58. Shu, X.; Usman, M.; Ahmad, P.; Irfan, M. Analyzing the asymmetric FinTech services under natural resources, and renewable energy in the future environmental performance: New insights from STIRPAT model framework. Resour. Policy 2024, 92, 104984. [Google Scholar] [CrossRef]
  59. Ulucak, R.; Khan, S.U.-D. Determinants of the ecological footprint: Role of renewable energy, natural resources, and urbanization. Sustain. Cities Soc. 2020, 54, 101996. [Google Scholar]
  60. Sohail, M.T.; Ullah, S.; Majeed, M.T. Effect of policy uncertainty on green growth in high-polluting economies. J. Clean. Prod. 2022, 380, 135043. [Google Scholar] [CrossRef]
  61. Chen, R.; Ramzan, M.; Hafeez, M.; Ullah, S. Green innovation-green growth nexus in BRICS: Does financial globalization matter? J. Innov. Knowl. 2023, 8, 100286. [Google Scholar] [CrossRef]
  62. Sohail, M.T.; Yu, X.; Usman, A.; Majeed, M.T.; Ullah, S. Renewable energy and non-renewable energy consumption: Assessing the asymmetric role of monetary policy uncertainty in energy consumption. Environ. Sci. Pollut. Res. 2021, 28, 31575–31584. [Google Scholar] [CrossRef] [PubMed]
  63. Jacobs, M. Green Growth: Economic Theory and Political Discourse; Grantham Research Institute on Climate Change and the Environment London, 2012; Volume 108, Available online: https://www.cccep.ac.uk/wp-content/uploads/2015/10/WP96-climate-abatement-policies-and-technological-transfers.pdf (accessed on 1st May 2024).
  64. Guo, J.; Zhou, Y.; Ali, S.; Shahzad, U.; Cui, L. Exploring the role of green innovation and investment in energy for environmental quality: An empirical appraisal from provincial data of China. J. Environ. Manag. 2021, 292, 112779. [Google Scholar] [CrossRef] [PubMed]
  65. Shan, S.; Genç, S.Y.; Kamran, H.W.; Dinca, G. Role of green technology innovation and renewable energy in carbon neutrality: A sustainable investigation from Turkey. J. Environ. Manag. 2021, 294, 113004. [Google Scholar] [CrossRef]
  66. Raihan, A.; Tuspekova, A. Dynamic impacts of economic growth, energy use, urbanization, agricultural productivity, and forested area on carbon emissions: New insights from Kazakhstan. World Dev. Sustain. 2022, 1, 100019. [Google Scholar] [CrossRef]
  67. Raihan, A.; Tuspekova, A. Dynamic impacts of economic growth, energy use, urbanization, tourism, agricultural value-added, and forested area on carbon dioxide emissions in Brazil. J. Environ. Stud. Sci. 2022, 12, 794–814. [Google Scholar] [CrossRef]
  68. Gao, J.; Zhang, L. Does biomass energy consumption mitigate CO2 emissions? The role of economic growth and urbanization: Evidence from developing Asia. J. Asia Pac. Econ. 2021, 26, 96–115. [Google Scholar] [CrossRef]
  69. Lv, Z.; Xu, T. Trade openness, urbanization and CO2 emissions: Dynamic panel data analysis of middle-income countries. J. Int. Trade Econ. Dev. 2019, 28, 317–330. [Google Scholar] [CrossRef]
  70. Saqib, N.; Ozturk, I.; Usman, M.; Sharif, A.; Razzaq, A. Pollution haven or halo? How European countries leverage FDI, energy, and human capital to alleviate their ecological footprint. Gondwana Res. 2023, 116, 136–148. [Google Scholar] [CrossRef]
  71. Khan, S.; Khan, M.K.; Muhammad, B. Impact of financial development and energy consumption on environmental degradation in 184 countries using a dynamic panel model. Environ. Sci. Pollut. Res. 2021, 28, 9542–9557. [Google Scholar] [CrossRef] [PubMed]
  72. Hassan, S.T.; Xia, E.; Khan, N.H.; Shah, S.M.A. Economic growth, natural resources, and ecological footprints: Evidence from Pakistan. Environ. Sci. Pollut. Res. 2019, 26, 2929–2938. [Google Scholar] [CrossRef] [PubMed]
  73. Ahmed, Z.; Asghar, M.M.; Malik, M.N.; Nawaz, K. Moving towards a sustainable environment: The dynamic linkage between natural resources, human capital, urbanization, economic growth, and ecological footprint in China. Resour. Policy 2020, 67, 101677. [Google Scholar] [CrossRef]
  74. Breusch, T.S.; Pagan, A.R. The Lagrange multiplier test and its applications to model specification in econometrics. Rev. Econ. Stud. 1980, 47, 239–253. [Google Scholar] [CrossRef]
  75. Pesaran, M.H. General diagnostic tests for cross-sectional dependence in panels. Empir. Econ. 2021, 60, 13–50. [Google Scholar] [CrossRef]
  76. Baum, C.F. Residual diagnostics for cross-section time series regression models. Stata J. 2001, 1, 101–104. [Google Scholar] [CrossRef]
  77. Blomquist, J.; Westerlund, J. Testing slope homogeneity in large panels with serial correlation. Econ. Lett. 2013, 121, 374–378. [Google Scholar] [CrossRef]
  78. Pesaran, M.H. A simple panel unit root test in the presence of cross-section dependence. J. Appl. Econom. 2007, 22, 265–312. [Google Scholar] [CrossRef]
  79. Im, K.S.; Pesaran, M.H.; Shin, Y. Testing for unit roots in heterogeneous panels. J. Econom. 2003, 115, 53–74. [Google Scholar] [CrossRef]
  80. Balsalobre-Lorente, D.; Shahbaz, M.; Chiappetta Jabbour, C.J.; Driha, O.M. The role of energy innovation and corruption in carbon emissions: Evidence based on the EKC hypothesis. Energy Environ. Strateg. Era Glob. 2019, 271–304. [Google Scholar]
  81. Westerlund, J.; Edgerton, D.L. A panel bootstrap cointegration test. Econ. Lett. 2007, 97, 185–190. [Google Scholar] [CrossRef]
  82. Ali, S.; Dogan, E.; Chen, F.; Khan, Z. International trade and environmental performance in top ten-emitters countries: The role of eco-innovation and renewable energy consumption. Sustain. Dev. 2021, 29, 378–387. [Google Scholar] [CrossRef]
  83. Khan, Z.; Murshed, M.; Dong, K.; Yang, S. The roles of export diversification and composite country risks in carbon emissions abatement: Evidence from the signatories of the Regional Comprehensive Economic Partnership agreement. Appl. Econ. 2021, 53, 4769–4787. [Google Scholar] [CrossRef]
  84. Driscoll, J.C.; Kraay, A.C. Consistent covariance matrix estimation with spatially dependent panel data. Rev. Econ. Stat. 1998, 80, 549–560. [Google Scholar] [CrossRef]
  85. Baloch, M.A.; Zhang, J.; Iqbal, K.; Iqbal, Z. The effect of financial development on ecological footprint in BRI countries: Evidence from panel data estimation. Environ. Sci. Pollut. Res. 2019, 26, 6199–6208. [Google Scholar] [CrossRef]
  86. Kongbuamai, N.; Bui, Q.; Nimsai, S. The effects of renewable and nonrenewable energy consumption on the ecological footprint: The role of environmental policy in BRICS countries. Environ. Sci. Pollut. Res. 2021, 28, 27885–27899. [Google Scholar] [CrossRef]
  87. Kao, C. Spurious regression and residual-based tests for cointegration in panel data. J. Econom. 1999, 90, 1–44. [Google Scholar] [CrossRef]
  88. Pata, U.K. Renewable energy consumption, urbanization, financial development, income and CO2 emissions in Turkey: Testing EKC hypothesis with structural breaks. J. Clean. Prod. 2018, 187, 770–779. [Google Scholar] [CrossRef]
  89. Byaro, M.; Nkonoki, J.; Mafwolo, G. Exploring the nexus between natural resource depletion, renewable energy use, and environmental degradation in sub-Saharan Africa. Environ. Sci. Pollut. Res. 2023, 30, 19931–19945. [Google Scholar] [CrossRef] [PubMed]
  90. Sharif, A.; Saqib, N.; Dong, K.; Khan, S.A.R. Nexus between green technology innovation, green financing, and CO2 emissions in the G7 countries: The moderating role of social globalisation. Sustain. Dev. 2022, 30, 1934–1946. [Google Scholar] [CrossRef]
  91. Sahoo, B.; Behera, D.K.; Rahut, D. Decarbonization: Examining the role of environmental innovation versus renewable energy use. Environ. Sci. Pollut. Res. 2022, 29, 48704–48719. [Google Scholar] [CrossRef] [PubMed]
  92. Reilly, J.M. Green growth and the efficient use of natural resources. Energy Econ. 2012, 34, S85–S93. [Google Scholar] [CrossRef]
  93. Katircioğlu, S.; Katircioğlu, S. Testing the role of urban development in the conventional environmental Kuznets curve: Evidence from Turkey. Appl. Econ. Lett. 2018, 25, 741–746. [Google Scholar] [CrossRef]
  94. Yasin, I.; Naseem, S.; Anwar, M.A.; Madni, G.R.; Mahmood, H.; Murshed, M. An analysis of the environmental impacts of ethnic diversity, financial development, economic growth, urbanization, and energy consumption: Fresh evidence from less-developed countries. Environ. Sci. Pollut. Res. 2022, 29, 79306–79319. [Google Scholar] [CrossRef]
  95. Acaroğlu, H.; Kartal, H.M.; García Márquez, F.P. Testing the environmental Kuznets curve hypothesis in terms of ecological footprint and CO2 emissions through energy diversification for Turkey. Environ. Sci. Pollut. Res. 2023, 30, 63289–63304. [Google Scholar] [CrossRef]
  96. Zhang, Y.-J.; Peng, Y.-L.; Ma, C.-Q.; Shen, B. Can environmental innovation facilitate carbon emissions reduction? Evidence from China. Energy Policy 2017, 100, 18–28. [Google Scholar] [CrossRef]
  97. Zhang, X.; Song, Y.; Zhang, M. Exploring the relationship of green investment and green innovation: Evidence from Chinese corporate performance. J. Clean. Prod. 2023, 412, 137444. [Google Scholar] [CrossRef]
Figure 1. Descriptive statistics.
Sustainability 16 07047 g001
Table 1. Variables: descriptions, symbols, and expected signs.
VariablesRepresentation Expected Sign
Carbon dioxide emanationsCECarbon dioxide emanations (metric ton per person).
Green growthGreGEnvironmentally adjusted multifactor productivity has been used to capture green growth.-
Green innovationGrIEnvironment-related technologies (as % of all technologies) have been used to measure green innovation.-
UrbanizationUUrban population.+/-
Renewable energy consumptionREnCRenewable Energy Consumption (% of total final energy consumption).-
Energy consumptionEnCIt is referred to as energy consumption kg of oil equivalent per capita.+
Natural resource depletionNrDDepletion of natural resources is an outcome of the combined effects of depleting minerals, energy, and net forest.+
Note: CE is a dependent variable, so it does not have probable signs.
Table 2. Panel cross-sectional dependence analysis.
ln CEln GreG ln GrI ln Uln REnCln EnC In NrD
Pesaran [75]69.038 a47.255 a17.034 a69.312 a74.3212 a11.757 a38.955 a
Breusch–Pagan LM10,649 a3119.6 a4257.7 a16,519 a10,577.8 a5910.7 a3677.0 a
Pesaran scaled LM265.26 a64.448 a94.802 a421.81 a263.35 a138.88 a79.313 a
Bias-corrected scaled LM264.53 a63.585 a94.010 a421.07 a262.62 a138.15 a78.553 a
Note: The symbols a is used to denote statistical significance level of 1%.
Table 3. Panel unit root analysis.
CIPS
ln CEln GreG ln GrI ln Uln REnCln EnC In NrD
@ Level−1.411 −3.929 a−1.647−1.804 −1.962−0.624 a−1.823
Δ (FD)−4.652 a−5.760 a−4.335 a−3.429 b−4.719 a−3.838 a−4.086 a
Note: The letters a and b stand for the 1% and 5% levels of significance, correspondingly.
Table 4. Slope homogeneity test.
TestDeltap-Value
Δ16.8380.0000
Δ adj.21.1580.0000
Table 5. Panel cointegration test.
Kao
Modified Dickey-Fuller t1.4587 c
Dickey-Fuller t2.0471 a
Augmented Dickey-Fuller t3.0859 b
Unadjusted modified Dickey-Fuller t−1.9724 a
Unadjusted Dickey-Fuller t−0.6095
Westerlund
Variance Ratio−1.3581 c
The letters a, b, and c correspondingly represent the 1%, 5%, and 10% significance levels.
Table 6. Driscoll–Kraay and System GMM regression estimations.
Driscoll–Kraay (DKra)System GMM (SGMM)
Model 1Model 2Model 3Model 1Model 2Model 3
l n   G r e G −0.0021 −0.0002 a−0.0023 a−0.0027 a−0.0025 a−0.0110 a
l n   G r I −0.0221 a−0.0174 a−0.0214 a−0.0640 a−0.0464 a−0.0653 a
l n   U −0.0215 a0.2400 a0.2183 a0.1158 a0.0802 a0.1101 a
l n   R E n C −0.0914 a−0.0916 a−0.0908 a−0.0816 a−0.1180 a−0.1082 a
l n   E n C 0.9137 a0.9108 a0.9150 a1.2364 a1.1731 a1.2005 a
l n   N r D 0.0080 a0.0078 a0.0071 a0.0275 a0.0280 a0.0301 a
l n   G r I l n   U −0.0025 a −0.0009 a
l n   G r I l n   G r e G −0.0005 a −0.0018 c
C−1.7951 a−1.4847 a−1.8557 a−9.3099 a−8.2254 a−8.8460 a
Diagnostic Tests
Obs.102610261026102610261026
Cross Sections383838383838
AR (2) 0.7210.8030.334
Sargan 0.68510.7840.736
Note: The letters a and c stand for the 1% and 10% levels of significance, correspondingly.
Disclaimer/Publisher’s Note: The statements, opinions and data contained in all publications are solely those of the individual author(s) and contributor(s) and not of MDPI and/or the editor(s). MDPI and/or the editor(s) disclaim responsibility for any injury to people or property resulting from any ideas, methods, instructions or products referred to in the content.

