1. Introduction
The COVID-19 pandemic had an enormous impact on the global economy, interrupting economic relationships for both people and firms. Governments worldwide quickly responded to the crisis by introducing a wide range of stimulus measures aimed at stabilizing the economies. These measures included but were not limited to VAT reductions, incentives for small- and medium-sized firms (SMEs), and the imposition of moratoriums to reduce the burden of debt repayment for persons experiencing financial difficulties. Such early actions were critical in reducing the pandemic’s immediate economic impact and paving the way for recovery.
Throughout this period, commercial banks have shown resilience, assisted by regulatory support and central bank measures aimed at preserving liquidity and financial stability. Indeed, it is worth noticing that at the beginning of the pandemic, a number of scholars predicted significant increases in non-performing loan (NPL) ratios, which is equivalent to a decrease in bank profitability ratios. For example, Ref. [
1] analyzed the profitability repercussions of the pandemic using bank- and country-specific factors. Their research suggests that European countries, which have larger government debt and weaker bank profitability than before the global financial crisis, are likely to face greater profitability issues in the aftermath of the COVID-19 pandemic. Furthermore, Refs. [
2,
3] argue that the COVID-19 pandemic has led to some delayed profitability effects, primarily due to the widespread application of loan moratoria in European nations. Nevertheless, government and central bank initiatives prevented these forecasts from being completely realized. These institutions quickly introduced appropriate measures to mitigate the pandemic’s negative impact on the financial sector. As the world is recovering from the pandemic’s economic negative effects, it is crucial to properly evaluate the negative effects during the COVID-19 era in order to understand its long-term influence on bank profitability.
In this paper, we aim to examine the impact of government intervention on the profitability of European commercial banks by looking at how these measures proposed by Ref. [
4] influence banks with varying levels of profitability. By extracting a comprehensive dataset of financial data from the ORBIS covering the period from 2014 to 2022, this research aims to provide insights into the nuanced effects of government interventions, such as subsidies, grants, and tax exemptions, on banks’ Return on Assets (ROA). The study seeks to answer the following key research questions: How do economic support measures affect the profitability of banks across different quantiles of ROA distribution? Are banks with lower profitability levels more adversely impacted by these measures compared to their more profitable counterparts? What role do factors like bank size, leverage, and loan quality play in moderating the effects of economic support on bank profitability?
The novelty of our research comes from the direct examination of the impact of economic support measures on bank profitability. Unlike previous studies that tried to identify the influence of financial and macroeconomic variables on bank performance, our analysis specifically investigates the effects of government economic support on different levels of bank profitability. This study not only fills a huge gap in existing literature but also highlights a pressing aspect of contemporary banking operations in the context of economic uncertainty. Our results, based on a methodology that captures the impact of economic support measures across the entire distribution of banking profitability, provide a deep understanding of how government intervention is shaping banks’ profitability at different levels. More to the point, in this paper, we provide fresh evidence regarding the impact of several bank-related factors on banking profitability, considering a very interesting period, such as the COVID-19 pandemic, and also show the importance of government intervention in shaping banking strategies.
The analysis conducted in this paper is very important in terms of Environmental, Social, and Governance (ESG) issues related to commercial banks. Indeed, the increased attention paid by decision-makers, professionals, stakeholders, and academics to corporate sustainability objectives has contributed, in recent years, to the significant development and widespread dissemination of ESG indicators. European banks have been determined to integrate environmental and social issues into their business practices. At the same time, they have become increasingly exposed to ESG controversies, i.e., events where their operations and/or products generate negative environmental, social, or governance impacts. Thus, the analysis of factors influencing bank profitability, especially in the context of economic support measures, becomes crucial for understanding how banks can achieve ESG objectives, considering the strong link between these two.
The remainder of the paper is structured as follows.
Section 2 presents the literature review; the data description and econometric approach are in
Section 3, the results are presented in
Section 4, while
Section 5 concludes the paper.
2. Literature Review
The literature examining the factors that influence banking profitability is quite extensive. However, the conclusions drawn are rather mixed, stemming from a multitude of samples and relying on various econometric approaches. In terms of bank-related variables, bank size is an often-studied factor that affects a bank’s profitability. For example, Ref. [
5] identifies it as one of the main factors that drives a bank’s profitability. Due to the economies of scale, it is anticipated that large banks would be profitable, as Ref. [
6] pointed out. These banks have better access to a broader array of funding sources and more sophisticated cost management procedures in order to diversify their portfolios. On the other hand, Ref. [
7] found that larger banks may have decreased profitability based on their analysis of a sample of 35 Vietnamese commercial banks from 2006 to 2014. Similarly, Ref. [
8] examined a sample of 14 Ethiopian banks from 2008 to 2019, while Ref. [
9] studied 20 Swedish commercial banks from 2005 to 2014 and failed to reveal a significant relationship between the size of the bank and return on assets and return on equity. Finally, Ref. [
10] conducted a study on commercial banks in Britain from 1998 to 2018 and reported that the size of the bank did not have a significant influence on profitability.
The quality of a loan portfolio, namely the level of NPLs, which is computed as the ratio of non-performing loans to total bank gross loans, is also considered a major driving factor for the level of banking profitability. A higher value of this ratio indicates a lower quality of the loan portfolio, resulting in a delay in the collection of claims. For example, Ref. [
11], analyzing commercial banks in the Euro area between 2015 and 2020, found that the NPL rate had a negative impact on profitability. Also, Ref. [
12], considering a sample of 108 real estate banks in the US, UK, and Germany between 2000 and 2014, highlighted that credit and liquidity risks reduce profitability, but efficient management of operations and an increased volume in loans improve it. Along the same line of argument, Ref. [
7] identified that higher-risk banks tend to have higher net interest margins but lower profitability in terms of equity returns (ROE). Also, Ref. [
13], studying an unbalanced panel of Greek commercial banks from 1985 to 2001, found that exposure to credit risk and increased labor productivity have a significant impact on profitability. Finally, some older studies, such as Refs. [
14,
15], have proven the same negative relationship between risk and profitability, indicating that the level of NPLs exhibits a robust impact on profitability.
Several academics have recognized that bank capitalization is a crucial determinant of profitability. For instance, Ref. [
10] has highlighted the correlation between capitalization rates, financing strategies, and bank profitability. Ref. [
6] demonstrated that European banks with adequate funding experience reduced financing expenses, resulting in increased profitability. Furthermore, Ref. [
8] established that an adequate amount of capital has a favorable impact on the profitability of Ethiopian banks, while Ref. [
9] revealed a noteworthy correlation between capital adequacy and the profitability of Swedish banks. Finally, operational efficiency and the growth in loan volume are highly correlated with bank profitability (Refs. [
7,
12]) while Refs. [
8,
16] revealed that liquidity and leverage are key factors that influence profitability.
Moving forward, the importance of the macroeconomic environment in shaping the profitability of banks was also intensively studied by several scholars. For example, Ref. [
10] has brought to light the influence of inflation and interest rates on the profitability of British banks, while Ref. [
17] showed that macroeconomic factors had a major impact on the profitability of big banks in 14 European nations. Also, Ref. [
11] demonstrated a positive correlation between GDP growth and bank profitability in the Euro area. Conversely, inflation, unemployment, and public debt were found to have negative impacts. Ref. [
16] shows that the profitability of banks in low- and middle-income countries is significantly influenced by GDP growth and inflation, while Ref. [
18] emphasized the importance of regulatory efficiency and financial development in enhancing the profitability of banks in Latin America. Meanwhile, Ref. [
19] identified several macroeconomic factors, including the government, GDP growth, unemployment rate, CPI, and gross savings, that have a positive impact on bank profitability in the Western Balkan countries. Finally, the budget deficit of some countries and government spending could significantly impact the daily activities of the banking sector. Higher expenditures and budget deficits are likely to result in a long-term decrease in the profitability of the banking industry.
Also, Ref. [
20] analyzed the relationship between monetary policy and bank profitability across 36 European nations from 2005 to 2021. Using the two-step system GMM technique, they examined data from 903 credit institutions. According to them, monetary policy generally has a moderate impact on profits and margins, except for ROA in Central and Eastern European and Southeast European countries, highlighting potential benefits for banks in this region. However, doubts arise regarding the effectiveness of Negative Interest Rate Policies, while loan loss provisions and cost-to-income ratios emerge as primary profitability determinants, emphasizing the importance of effective provisioning practices and operational efficiency. Along the same line of argument, Ref. [
21] examined the impact of monetary policy on the profitability of 109 large banks in developed countries. The results bring to light a positive relationship between policy tools and bank profitability, especially during periods of low interest rates and flat-term structures.
In the landscape of banking profitability research, where existing studies offer mixed conclusions about the roles of credit risk, capitalization, and monetary policies, our paper introduces a novel perspective by specifically focusing on the impact of economic support measures on bank profitability. This focus is particularly pertinent given the recent global economic challenges and the consequent increase in government interventions in financial markets. While previous studies have extensively analyzed factors such as non-performing loans, capital adequacy, and the expansion of banking services, the direct examination of the relationship between government economic support and bank profitability remains underexplored. Our study aims to fill this gap by utilizing the Economic Support Index (ESI) to measure the extent of governmental economic assistance and investigate its impact on banks’ Return on Assets (ROA). By doing so, we provide fresh insights into how macroeconomic policy interventions, especially during periods of financial stress, influence the banking sector’s performance across different levels of profitability. Thus, the hypotheses that we aim to test are
H1. The economic support measures during the COVID-19 pandemic are influencing banking profitability.
H2. The impact of economic support measures on banking profitability is sensitive to the current level (quantile) of the ROA.
Intuitively, one might expect that governmental economic support could influence banks’ profitability. The nature of this influence, however, is less obvious. On the one hand, economic support measures are typically introduced in times of financial stress or economic downturns, potentially protecting banks against the immediate impacts of such environments. On the other hand, extensive support could also alter the competitive landscape or affect the risk-taking incentives of commercial banks. Thus, we hypothesize that there is a significant relationship between the level of economic support and banks’ profitability. The direction and nature of this relationship—whether it is positive, negative, or more complex—is an open question that our study aims to explore. These hypotheses reflect the nuanced and potentially varied ways in which macroeconomic policy interventions interact with bank performance metrics.
3. Material and Methods
In what follows, we are going to present the research design of the paper. After extracting the data from the ORBIS database, we performed a preliminary analysis to assess its quality. This included conducting panel stationarity tests to avoid the risk of running spurious regressions. Stationarity analysis is very important in panel data analysis since non-stationary data can lead to misleading findings. By verifying that our data exhibited stationarity patterns, we established the reliability of our following econometric studies. In addition, we examined the problem of multicollinearity from two different viewpoints in order to mitigate the possibility of receiving contradictory estimates. Multicollinearity occurs when the independent variables in a regression model exhibit a powerful correlation. To overcome this, we analyzed the variance inflation factors (VIFs) that measure the extent of multicollinearity. In addition, we examined the correlation matrix of the explanatory variables. These methods enabled us to recognize and address any concerns of multicollinearity in our model.
In order to carry out the econometric analysis, we primarily employed quantile regression. This approach is used to analyze dependent variables that have asymmetric distributions, such as ROA (Return on Assets) for the selected banks. Quantile regression enables the analysis of the influence of explanatory factors on various points in the distribution of Return on Assets (ROA). This approach offers more comprehensive knowledge of how these variables affect banks with varying degrees of profitability. This method is robust to outliers and can successfully manage error distributions that are not normal. Furthermore, in order to evaluate the strength and address possible issues of endogeneity, we utilized the Generalized Method of Moments (GMM) approach under a panel data framework. The system GMM estimator was developed to address dynamic panel data models in which we suspect the presence of endogeneity. This methodology utilizes lagged values of the variables as instruments, offering consistent estimates even when the endogeneity is present among the data. By integrating quantile regression with the GMM methodology, we guaranteed that our research was thorough and methodologically rigorous. Additional details are presented in
Section 3.1 and
Section 3.2.
3.1. Data Description
In this paper, we rely on a balanced panel with yearly data from 2014 to 2022, using a sample of 269 commercial banks. We extract financial information for these banks from the ORBIS database using several filters: (i) we exclude banks with financial indicators missing from 2014 to 2022; (ii) we limit the commercial banks search to EU27 countries. We choose only EU member states mainly for homogeneity reasons. In fact, economic support measures were coordinated by domestic governments but under the supervision of the European Commission; (iii) we exclude the banks with negative assets and where total assets were lower than the net loans; (iv) to ensure that we select only representative banks from each country, we use a size threshold of EUR five million in total assets (see Ref. [
22]).
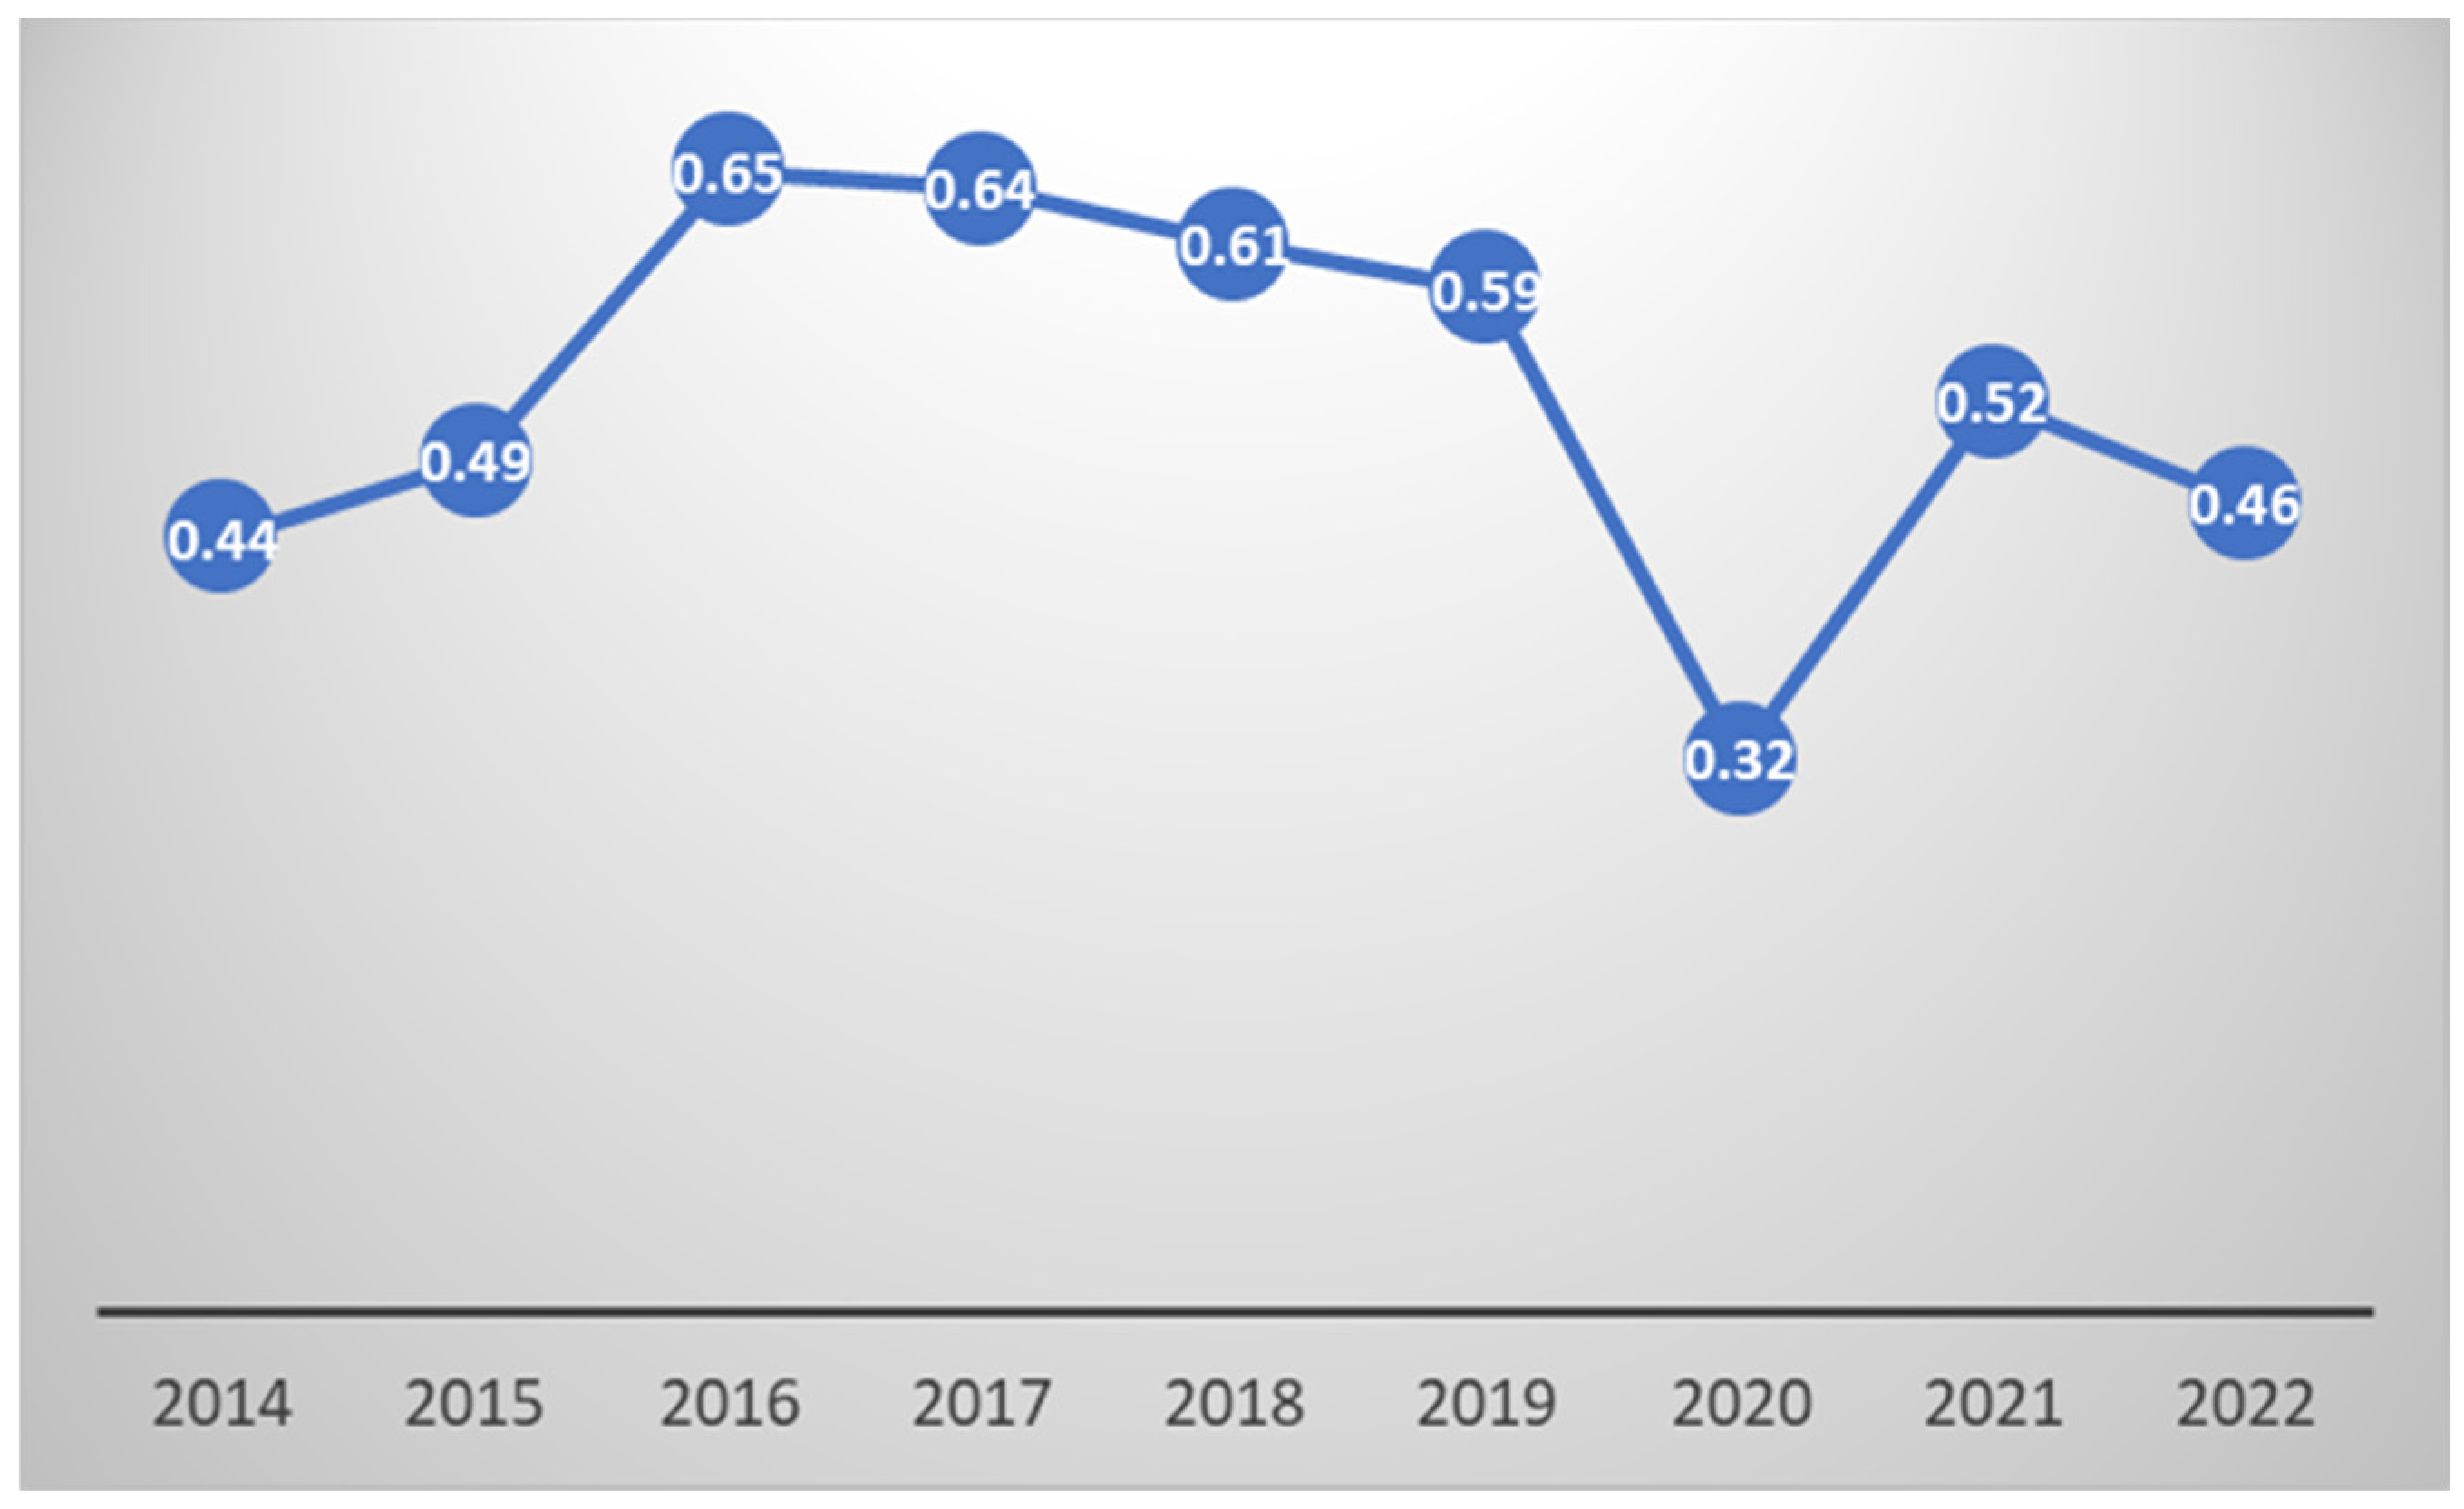
The dependent variable is the banking profitability proxied by the Return on Assets ratio (ROA). In
Figure 1, we present the evolution of the ROA across EU27 countries during the analyzed period.
The evolution of the ROA presented in
Figure 1 brings to light a period of volatility and important events that are likely to influence this evolution. The ROA began at 0.44% in 2014 and gradually increased over the next two years, hitting 0.49% in 2015 and culminating at 0.65% in 2016. This increasing trend may imply a stronger economic situation following the financial crisis, with banks perhaps seeing better asset performance, cost management, or an increase in profitable activities. However, the minor falls to 0.64% in 2017 and 0.61% in 2018 indicate stability or commencement of constraints that limit the potential to create profit from assets. The sustained drop to 0.59% in 2019 might be attributed to external market factors or regulatory changes that affect bank profitability. The large reduction to 0.32 in 2020 is most likely due to the COVID-19 pandemic, which has left banks facing major challenges, such as greater loan loss provisions, lower consumer spending, and economic downturns. The subsequent rise to 0.52% in 2021 demonstrates a partial recovery as the economy strengthens and banks adjust to the ‘new normal’, possibly through digital transformation and cost-cutting initiatives. However, the drop to 0.46% in 2022 may indicate that the recovery was vulnerable to the lasting pandemic impacts, geopolitical conflicts, or other economic obstacles. Additional details regarding the levels of the ROA in EU27 are presented in
Figure 2.
The ROA data for commercial banks from 2014 to 2022 shows significant variation across European countries, ranging from a high of 1.4 in Latvia to a low of −1.5 in Greece, indicating diverse levels of asset profitability and efficiency within the banking sectors of different nations.
As control variables, we include banking size, banking leverage, solvability, interbank activities, and capital adequacy. We choose the variables based on the large amount of literature investigating the explanatory factors of banking profitability, as presented in
Section 2. As a key explanatory variable, we rely on the economic support index developed by Ref. [
4]. Thus, during the COVID-19 pandemic, EU nations implemented various strategies in terms of health, containment, and economic recovery. The challenge in evaluating these measures arises from the varied demographics, cultures, and economies of EU countries. Ref. [
4] introduced a set of indices via the Oxford COVID-19 Government Response Tracker aimed at assessing the disparity in governmental actions across the globe. These indices have since been widely used in research papers to analyze the effects of diverse policies on both the economy and healthcare systems. The primary objective of these indices is to systematically measure the policy responses to COVID-19 within the European Union and highlight the heterogeneity in their intensity.
The effectiveness of policies in EU countries is captured using the Economic Support Index (ESI). The ESI evaluates the robustness of government initiatives that offer direct monetary assistance for unemployment and ease financial burdens. Its scale extends from 0, indicating minimal strength, to 100, signifying maximum effectiveness.
Figure 3 illustrates the evolution of ESI in the EU Member States during 2020 and 2021.
The ESI data for EU27 countries from 2020 to 2022 show a distinct trajectory of policy achievements in providing monetary assistance and reducing financial constraints caused by unemployment. Notably, Austria, Cyprus, and Ireland demonstrate exceptional policy success, retaining a maximum ESI score of 100 in 2021 and 2022, implying that these nations developed strong support systems over this time period. In contrast, Belgium, Denmark, and Portugal show a considerable fall in their ESI ratings in 2022, with Belgium and Denmark sliding to 0, suggesting a withdrawal or severe reduction in support measures compared to prior years. Countries such as Bulgaria, Greece, and Hungary, on the other hand, have demonstrated a remarkable rising tendency, with their ESI ratings steadily increasing year after year, indicating stronger support over time. Germany’s improvement is particularly notable, with an ESI of 35.75 in 2020, a slight gain in 2021, and a substantial jump to 73.81 in 2022, indicating a major increase in policy efficacy. Luxembourg, on the other hand, shows a downward trend, with a dramatic decline to 16.39 in 2022 from a peak of 75.72 in 2020, implying a significant reduction in economic assistance measures. The statistics show a complex and changeable picture of policy effects and modifications as countries adapt to changing economic difficulties and conditions during the last three years.
A detailed description of all the variables we employ in the regression analysis is presented in
Table 1.
We move forward with the data analysis to multicollinearity issues. Presenting the correlation matrix of explanatory variables for banking profitability is essential since it aids in identifying linkages and potential concerns with multicollinearity among variables, resulting in a more accurate and trustworthy examination of the elements that influence profitability. The results are presented in
Table 2.
Multicollinearity is mostly an issue when correlations are extremely strong (usually greater than 80–90%). While there are some significant correlations in this matrix, they do not appear to be at levels indicative of serious multicollinearity issues. However, it is crucial to remember that multicollinearity can still occur in more complicated relationships that are not immediately obvious in pairwise correlation matrices, so additional investigations are required post-estimation. To ensure robustness to the results, we also run a linear model and compute the VIF values for all the covariates, which are presented in
Table 3 below:
As can be seen in
Table 3, the VIF value for covariates is below 10, which indicates that multicollinearity is not a problem when running the regression. Indeed, the primary findings reported in
Table 2 are consistent, and we can go further with the statistical analysis without any concerns regarding the misspecification of the model.
3.2. Econometric Approach
As outlined in the introductory part of this paper, the primary objective is to examine the impact of economic assistance programs introduced during the COVID-19 pandemic on the profitability of banks. The fundamental framework for this analysis is structured as follows:
In Equation (1), and , are countries and years, respectively, is the Return on Assets (ROA) for the bank i in year t, is the Return on Assets (ROA) for the bank i in year t−1, is a matrix of control variables defined in the previous section while is the economic support index. Finally, represents the error term.
To address possible endogeneity concerns in estimating Equation (1), various methods have been suggested in econometric studies, including the use of panel GMM or system-GMM techniques. Nonetheless, there are instances where linear methodologies might yield inaccurate conclusions, particularly if the distribution of the dependent variable is not symmetric. In response to this challenge, Ref. [
23] introduced conditional quantile regression. This technique allows for the analysis of data that are positioned either above or below the conditional mean of the exchange rate percentage change. For any level
, across the conditional distribution of the banking profitability denoted
, considering the set of explanatory variables denoted
, the conditional quantile
captures
where
symbolizes the conditional distribution function. To evaluate the effect of a specific factor or occurrence across different levels of the distribution of banking profitability, the most common approach is the conditional quantile regression (CQR) for panel data, a technique proposed by Ref. [
24]:
In Equation (2)
is the dependent variable,
is the set of covariates,
is the common slope parameter, while
is a location-shift parameter. In addressing unobserved country-specific variations, Koenker’s approach considers the fixed effects in the panel as nuisance factors. The significance of this method lies in incorporating a penalty term within the minimization algorithms:
In Equation (3), is the quantiles’ index, represents the quantile loss-function while is the relative weight associated with the th quantile. The penalty term, denoted as λ, is incorporated to reduce the impact of individual fixed effects towards zero. Furthermore, as λ approaches zero, the model tends towards a conventional fixed effects specification.
While the conditional quantile regression (CQR) is effective in analyzing variables with an asymmetric distribution, it generates coefficients that do not adequately represent the influence of these variables across different quantiles. To address this, Ref. [
25] introduced the unconditional quantile regression (UQR). This approach involves calculating a recentred influence function (RIF) that is independent of covariates, and then this function is regressed on the explanatory variables:
In Equation (4),
,
symbolizes the cumulative distribution function of
,
indicates the distribution that concentrates at the value
, while
is the value of the considered statistic. The RIF, representing an estimator ν with a probability distribution F at the point
is determined by augmenting this statistic with its Influence Function (IF):
In Equation (5), the expected value of the RIF is
, if the expected value of the
is zero. When choosing the τ
th quantile as the statistic of interest and estimate the density functions based using a Kernel density approach, the RIF, given
can be defined in the following manner:
In Equation (6),
is the τ
th quantile of the unconditional distribution of banking profitability,
express the pdf of
conditioned by the τ
th quantile, while
is an indicator function indicating if
is below the τ
th quantile. Finally, the UQR estimator is given by Equation (7):
This paper employs the baseline specification of Unconditional Quantile Regression (UQR) for panel data, a methodology developed by Ref. [
26], which incorporates both country and time-fixed effects.
4. Results
4.1. UQR Regression
Table 4 displays the estimated coefficients for a representative selection of quantiles, revealing several notable insights.
As we can see in
Table 4, the selected covariates exhibit mostly non-linear influences on the ROA across banks with different profitability levels. Starting with the size, it has a positive relationship with the ROA for banks at the lowest profitability level (Q10), where it is statistically significant at the 10% level. However, this positive impact of size becomes statistically insignificant as we investigate higher profitability quantiles (Q25 to Q90), indicating that the dimension of a bank in terms of assets exhibits a marginal role in influencing the ROA when the level of profitability is already high. Leverage exhibits a positive effect on the ROA across all profitability levels, and its impact is statistically significant at 1% and monotonically increasing from lower to higher quantiles. This implies that banks with a higher equity-to-assets ratio are generally more stable and less risky. Higher equity is associated with a stronger capital structure, which can assimilate some potential losses better than banks with lower equity. Based on this argument, we can conclude that this stability reduces the probability of financial distress, which can improve performance and result in a higher ROA. Risk, measured by impaired loans to equity, negatively influences the ROA across all quantiles, with the effect being statistically significant at the 1% level. This finding brings to light the detrimental impact of higher impaired loan ratios on bank profitability, regardless of the profitability level.
Moreover, the Tier 1 capital ratio exhibits a negative and monotonically decreasing impact on the ROA from the lower-middle to the superior quantile (Q25 to Q90), with all the coefficients being statistically significant at the 1% level. This shows us that banks with higher Tier 1 capital ratios are more likely to report lower ROAs, except for those with extremely low profitability levels. Indeed, as Refs. [
6,
8,
9,
10] pointed out, banks with stronger capital adequacy are, most of the time, more conservative from a risk management perspective. This is equivalent to a more restrictive lending policy and more prudent investments, which, even though they reduce the risks taken by the banks, can also limit profit-generating opportunities and, implicitly, reduce the ROA.
Moving forward, the interbank ratio does not exhibit a statistically significant impact on the ROA at any profitability level, suggesting its limited role in shaping the trajectory of banking profitability. However, liquidity has mixed results: its impact on the ROA is statistically significant at the 1% level for medium and upper quantiles, namely when the bank’s profitability is good enough. In addition, as Refs. [
8,
12] pointed out, liquidity allows banks to respond quickly to profitable investment opportunities and finance new loans, which can increase interest income and, consequently, profitability. From this point of view, this is a normal result.
The Economic Support Index (ESI) has a detrimental effect on the Return on Assets (ROA) at the lowest (Q10) and medium (Q50, Q75) quantiles. The estimates are statistically significant at the 5% level in Q10 and at the 1% level in Q50 and Q75. This suggests that in countries where the government enhanced economic assistance during the COVID-19 epidemic, banks experienced reduced profitability, especially those with lower to moderate levels of the ROA. This impact can be due to various economic reasons. Initially, when the government provides significant economic assistance, it often indicates difficult market conditions, such as recessions or financial crises. During these times, banks are facing greater default risks and fewer possibilities to lend money, resulting in decreased profitability. Thus, government actions are devoted to stabilizing the economy and establishing a safety net for both enterprises and individuals. This, in turn, diminishes their immediate need for bank borrowing. This might result in a decrease in the primary revenue-generating operations of banks, such as providing loans and investing services. In such circumstances, banks can opt to use more cautious risk management methods, selecting safer, although less profitable, investments. Although this prudent strategy helps reduce risk, it can also further decrease the Return on Assets (ROA).
4.2. Endogeneity Concerns
Over recent years, there has been a notable increase in the use of panel data within the fields of economics and finance. A key challenge in employing standard panel data methods is addressing endogeneity issues, which may stem from factors like omitted variables, measurement errors, or simultaneity. The methodologies developed by Ref. [
27] and further advanced by Ref. [
28] have gained widespread acceptance. These approaches are particularly valued for their effectiveness in dealing with several common issues: variables that are not strictly exogenous and may correlate with past or present error terms, fixed effects unique to each individual, and the presence of heteroskedasticity and autocorrelation within but not across individuals.
The Arellano and Bond estimations summarized in
Table 5 reveal some interesting insights regarding the factors affecting banking profitability.
The lagged ROA has a negative relationship with the current level of profitability, which is statistically significant at 1%, indicating a mean-reverting trajectory. High profitability in one period appears to lead to lower profitability in the following period, which could reflect market changes or cyclical financial performance. The bank’s size has a significant positive effect, indicating that larger banks are typically associated with higher profitability. This could be attributed to economies of scale or improved risk diversification. This result confirms to some extent the conclusions drawn under the unconditional quantile regression specification and previous findings in the literature (Refs. [
5,
6,
29]) but is not in line with the ones investigating banking profitability in countries across different continents, such as Ref. [
7] when investigating banks in Ethiopia.
Leverage is another variable with a positive and significant impact on profitability, also at the 1% level, confirming the results of the unconditional quantile regression and the previous findings reported in the literature, such as Refs. [
8,
9,
30]. Similarly, the impact of risk on profitability, proxied by the impaired loans-to-equity ratio, validates the estimates generated by the unconditional quantile regression for all five quantiles. This is a normal result since, as impaired loans are increasing, commercial banks have to write off the toxic loans or increase the provisions. This process can erode the level of capital adequacy, reducing the equity available to support other productive activities. A weakened capital position can restrict the bank’s ability to lend and invest, further diminishing profitability and the ROA. Similar findings were reported by a series of papers investigating European banks, such as Refs. [
11,
17], among others.
As expected, the Tier 1 capital ratio negatively affects profitability, with the impact coefficient being statistically significant at the 1% level, similar to the unconditional quantile regression case. These results imply greater capital adequacy, which, although crucial for stability, might constrain profitability. In contrast, the interbank ratio does not present a statistically significant effect, suggesting its limited influence on profitability at traditional significance levels. Liquidity demonstrates a significant positive impact on profitability, signifying at the 1% level that banks with higher loan-to-deposit ratios tend to be more profitable. This might reflect effective asset management and income generation capabilities. The Economic Support Index (ESI) shows a significant negative effect on profitability, significant at the 1% level, indicating that banks in environments with greater government economic support, which is definitely influencing economic growth, might experience reduced profitability (Refs. [
31,
32]). This could be due to a lower risk–reward environment or competitive dynamics shaped by government interventions. The overall performance of the model is supported by the Wald chi2 statistic, while the number of instruments used is 43, which is an appropriate number, lending additional robustness to previous findings.
Both the quantile regression at the 50th percentile and the GMM analysis consistently show a negative impact of economic support measures. This congruence between the two methodologies in identifying a negative effect enhances the robustness of our results.
5. Discussion
As mentioned before, the estimates reveal a U-shaped negative impact induced by the economic support measures on banking profitability. We notice that the negative impact is more pronounced across the 10th quantile throughout the ROA distribution, indicating that even if these interventions are necessary to re-establish economic stability, they may disproportionately affect less competitive banks. For example, if the government provides direct financial assistance to individuals, the need for traditional bank loans decreases. Banks with low profitability, which rely more on these revenues, will experience a greater negative impact. Furthermore, the room for maneuvering in this new environment is larger for banks with a medium to high level of profitability, where the impact coefficients are lower. For the banks associated with the 90th quantile, which report an extremely high level of profitability, the impact is statistically insignificant. This might suggest that operational efficiency, income diversification, a better quality of the loan portfolio, and easy access to capital markets allow these banks to maintain stability and profitability even under adverse economic conditions. These financial institutions tend to have greater resilience and competitiveness, which protects them against the negative effects of government interventions aimed at stabilizing the economy.
As secondary findings, we confirm the robustness of some traditional covariates included in the regression analysis of banking profitability. However, we provide a deeper perspective by means of unconditional quantile regression. Indeed, the size of the bank exhibits a positive influence on the ROA but only across the 10th quantile, and this impact becomes insignificant across the middle and upper quantiles. Furthermore, we report that higher leverage exhibits a positive influence on the ROA across all quantiles, signifying its crucial role in banking operational management. The analysis also underscores the detrimental impact of higher impaired loan ratios on profitability, regardless of the selected quantile. The Tier 1 Capital Ratio is experiencing a negative association with the ROA among banks with moderate to high profitability. Surprisingly, we find that the impact of the interbank ratio on the ROA is negligible across all the selected quantiles, while liquidity shows a significant influence only at medium profitability levels.
These results might be of interest to bank managers, regulators, and all economic agents. Indeed, it is very important for bank managers to implement proactive initiatives in order to minimize the adverse effects of government interventions on profitability, particularly in times of economic uncertainty, such as great financial crises or the COVID-19 pandemic. First and foremost, banks should prioritize the diversification of their income flows to decrease their reliance on interest income and other conventional services. This includes the creation of innovative financial products, diversification into other market sectors, and the allocation of resources towards digital services. In order to enhance their competitiveness, banks must increase their operational efficiency by implementing advanced technologies and reducing internal procedures to minimize expenses.
In addition, to enhance their resilience, commercial banks must implement very strict risk management regulations. This implies continuous monitoring of the loan portfolio to diminish the NPL ratio and maintain the integrity of investments. Financial institutions that have low levels of profitability should prioritize enhancing the quality of their loan portfolio and adopting cautious lending practices. Furthermore, it is crucial to keep sufficient capital reserves to cover future losses and satisfy regulatory obligations. Ultimately, more profitable banks should prioritize maintaining and sustainably increasing their financial positioning. Allocating resources to financial technology and product development may increase the number of clients as well as their retention. Finally, banks may mitigate the adverse impacts of economic support measures and achieve sustainable long-term development by implementing diversification strategies, enhancing risk management, and investing in innovation.
The profitability of banks is crucial for achieving ESG objectives, as it provides the necessary resources to allocate towards sustainable and responsible projects (Ref. [
33]). Financial institutions that exhibit higher profitability have an increased capacity to successfully execute ESG initiatives, including the management of environmental and social risks, and to react favorably to ESG issues. Profitable banks have the ability to invest funds towards enhancing workplace diversity and inclusion, creating financial products that benefit local communities, and implementing technologies that decrease their carbon impact. On the other hand, banks that do not generate as much profit and are being significantly impacted by economic support measures need to focus on enhancing the quality of their loan portfolio and implementing cautious lending procedures. This will help them improve their financial stability and eventually enable them to participate in ESG projects. Profitability enables banks to both preserve their stability through economic interventions and promote long-term sustainability through the implementation of strong ESG measures.
Finally, the relationship between ESG and profitability has become ambiguous, especially during the COVID-19 pandemic. Some studies suggest that ESG can reduce bank profitability in the short term, according to the trade-off hypothesis, due to the increase in costs associated with the implementation of these standards. However, there is evidence that in the long term, ESG can improve bank performance, as observed in the non-banking sector in South Korea and the USA (Ref. [
34]). During the pandemic, banks with higher ESG scores performed better, attracting responsible investors and customers (Ref. [
35]). Thus, ESG integration as a determinant of banking profitability cannot be considered clear or consistent, requiring a more detailed and nuanced analysis that takes into account economic variables and the impact of economic support measures. In addition, a future study could consider ESG as a transition variable in a non-linear analysis to explore more deeply the complex interactions between sustainability and bank performance.
6. Conclusions
In this paper, we relied on a comprehensive dataset of European commercial banks from the ORBIS Database from 2014 to 2022 and an unconditional quantile regression to investigate the driving factors of profitability. By controlling for several bank-related factors, we aimed to capture the influence of economic support measures on banking profitability as measured by the ROA. The major finding of the paper brings to light the negative impact of economic support measures on bank profitability, particularly across lower and middle quantiles. It indicates that while government interventions, as reflected in the Economic Support Index (ESI), are essential during economic downturns such as the COVID-19 pandemic, their impact on banking sector productivity is more complex. Indeed, when the government provides more intensive economic support in the form of direct subsidies, grants, or tax exemptions, it reduces the immediate dependence of economic agents on bank loans. If these entities receive funds directly from the government, their propensity to borrow from banks drastically decreases, resulting in a reduction in their interest income and other financial services.
Although the current study brings to light some very interesting connections, it also presents some limitations. First of all, it focused only on European banks, which diminishes the representativeness of the conclusions drawn at the global level, considering that the US, Central American, and Islamic banking systems have their own particularities. Secondly, it would have been really interesting to capture a longer period of time, possibly starting with the 2000s, in order to have a clearer picture of how different types of government interventions impact banks’ profitability. This was not accounted for due to the limitations of the ORBIS platform. Finally, we consider that the results would have been more robust if an unconditional quantile regression had been built to take into account potential endogeneity problems. As future directions of research, we consider that in the light of new regional events, such as the invasion of Ukraine by Russia or the energy crisis, the role of banks in ensuring sustainable economic growth will become increasingly higher, and we consider that studying the determining factors of banking profitability in conditions of geopolitical risk or energy uncertainty would be a topic of interest for the general public.


